Article

Assessing the Impact of Tillage Methods on Soil Moisture Content and Crop Yield in Hungary

by
Maimela Maxwell Modiba
1,*,
Caleb Melenya Ocansey
2,
Hanaa Tharwat Mohamed Ibrahim
3,
Márta Birkás
1,
Igor Dekemati
1 and
Barbara Simon
3
1
Institute of Crop Production Sciences, Hungarian University of Agriculture and Life Sciences, H-2100 Gödöllő, Hungary
2
CSIR—Crops Research Institute, Fumesua, Kumasi, Ghana
3
Institute of Environmental Sciences, Hungarian University of Agriculture and Life Sciences, H-2100 Gödöllő, Hungary
*
Author to whom correspondence should be addressed.
Agronomy 2024, 14(8), 1606; https://doi.org/10.3390/agronomy14081606
Submission received: 6 June 2024 / Revised: 12 July 2024 / Accepted: 19 July 2024 / Published: 23 July 2024
(This article belongs to the Special Issue Effective Soil and Water Conservation Practices in Agriculture)

Abstract

:
A decline in rainfall as a source of agricultural water has affected and will continue to affect sustainable crop production globally including in Hungary. Conservation of the greatest water reservoir is important for the sustainable development of agriculture in Hungary. The objective of this study was to evaluate the effects of the different tillage methods on soil moisture content, grain yield, and root weight of wheat (Triticum aestivum) and sunflower (Helianthus annuus) under rainfed conditions. A field study was conducted at the Józsefmajor Experimental and Training Farm (JM) of the Hungarian University of Agriculture and Life Sciences near Hatvan. The experiment consisted of six tillage treatments: disking (D, 16 cm), shallow cultivation (SC, 20 cm), no-till (NT), deep cultivation (DC, 25 cm), loosening (L, 45 cm), and plowing (P, 30 cm). Soil moisture content (SMC) was measured monthly, and grain yield and root weight were measured at the end of the cropping period. Our results showed no significant difference in SMC between conservation and conventional tillage methods in 2018. However, in 2021, greater SMC was significantly conserved under NT compared to P. Regarding the sampling date, a significant increase in moisture with time was observed. A significantly lower SMC was observed on 3 June 2019 between L and D. while on the 9 September 2020, SMC significantly differed between P and all the other treatments (D, SC, NT, DC, and L). Interestingly in 2018, SMC was significantly lower at 10–20 cm depth between L and D. Notably the effect of depth on SMC was observed as moisture significantly increased with increasing depth in all tillage treatments. Root weight was greatest at DC (1.54 t ha−1) in 2018 and under L (3.89 t ha−1) in 2021. Similarly, wheat grain yield was greatest at DC (2.48 t ha−1) in 2018, while sunflower yield in 2021 was greatest at L (3.86 t ha−1). It is comprehensible that conservation tillage methods such as L and NT can increase SMC and grain yield.

1. Introduction

Soil moisture content (SMC) is an important component in agriculture. Its significance in agriculture extends beyond crop production. It plays a crucial role in transporting nutrients, supporting soil biological organisms, and regulating soil looseness for root growth and development [1,2]. The shortage of water resources has become a global problem, limiting agricultural development [3,4]. Agricultural practices in the Mediterranean region, combined with delicate ecosystems, extreme climate conditions characterized by infrequent and insufficient rainfall, and arid soils enduring extended dry periods, are widely recognized as crucial elements exacerbating soil and water depletion [5,6,7]. Therefore, understanding the effects of tillage on soil moisture content is imperative to optimize agricultural practices and improve soil moisture conservation. Soil tillage is an important practice for managing soil water content, fertility, gas/air ratio, and heat. Enhanced tillage practices have demonstrated a positive impact on improving the physical and chemical soil properties and soil water use efficiency [8]. Various studies have provided insights into different tillage practices on the SMC. For instance, holistic tillage methods that enhance soil structure and increase soil organic matter (SOM), such as no-till, shallow cultivation, and subsoiling, can improve soil moisture retention [9]. Lampurlanés et al. [10] reported that NT increased soil water-holding capacity and decreased soil evaporation. A five-year field study discovered that deep plowing and subsoiling, as opposed to NT, significantly enhanced soil water storage in the 0–3 m depth range [11]. Małecka et al. [12] reported the use of a stubble cultivator significantly increased SMC at 0–10 and 10–20 cm relative to a conventional plow. Al-Wazzan and Muhammad [13] found no differences in soil moisture from planting to eight weeks after planting between conventional and NT. In contrast, conventional tillage harms soil by disintegrating aggregates, degrading organic matter, and increasing moisture evaporation [14,15]. Moreover, the depth and intensity of tillage also play a role in conserving SMC. Studies have shown that plowed soils are more prone to settling, loosened soil depth reduction, crumb disintegration, and surface siltation [16,17]. Although numerous studies have been conducted on this topic, there is still a limited understanding of how different tillage practices affect SMC in specific agricultural systems. Additionally, few studies conducted in Hungary have focused on 0–30 cm and 30–40 cm soil depths [18,19]. Hence, there exists a knowledge gap on the impact of tillage methods at deeper (<40 cm) soil depths under varying periods. To our knowledge, other previous work in Hungary studied the effect of different tillage methods on soil erosion, nutrient loss, maize root response, and nitrogen use efficiency [20,21,22]. Therefore, more knowledge is required to assess the impact of different tillage practices on SMC, crop yield, and yield components. Furthermore, it is important to investigate the relationship between tillage practices and SMC to develop sustainable agricultural practices that optimize water-use efficiency and improve soil moisture conservation. We hypothesized that conservation tillage methods will conserve more moisture and thus enhance crop yield. To confirm the hypothesis a two-year field study was conducted to identify the effects of six tillage methods on (a) grain yield and root growth of wheat and sunflower crops and (b) soil moisture content and distribution throughout the crops growing season.

2. Materials and Methods
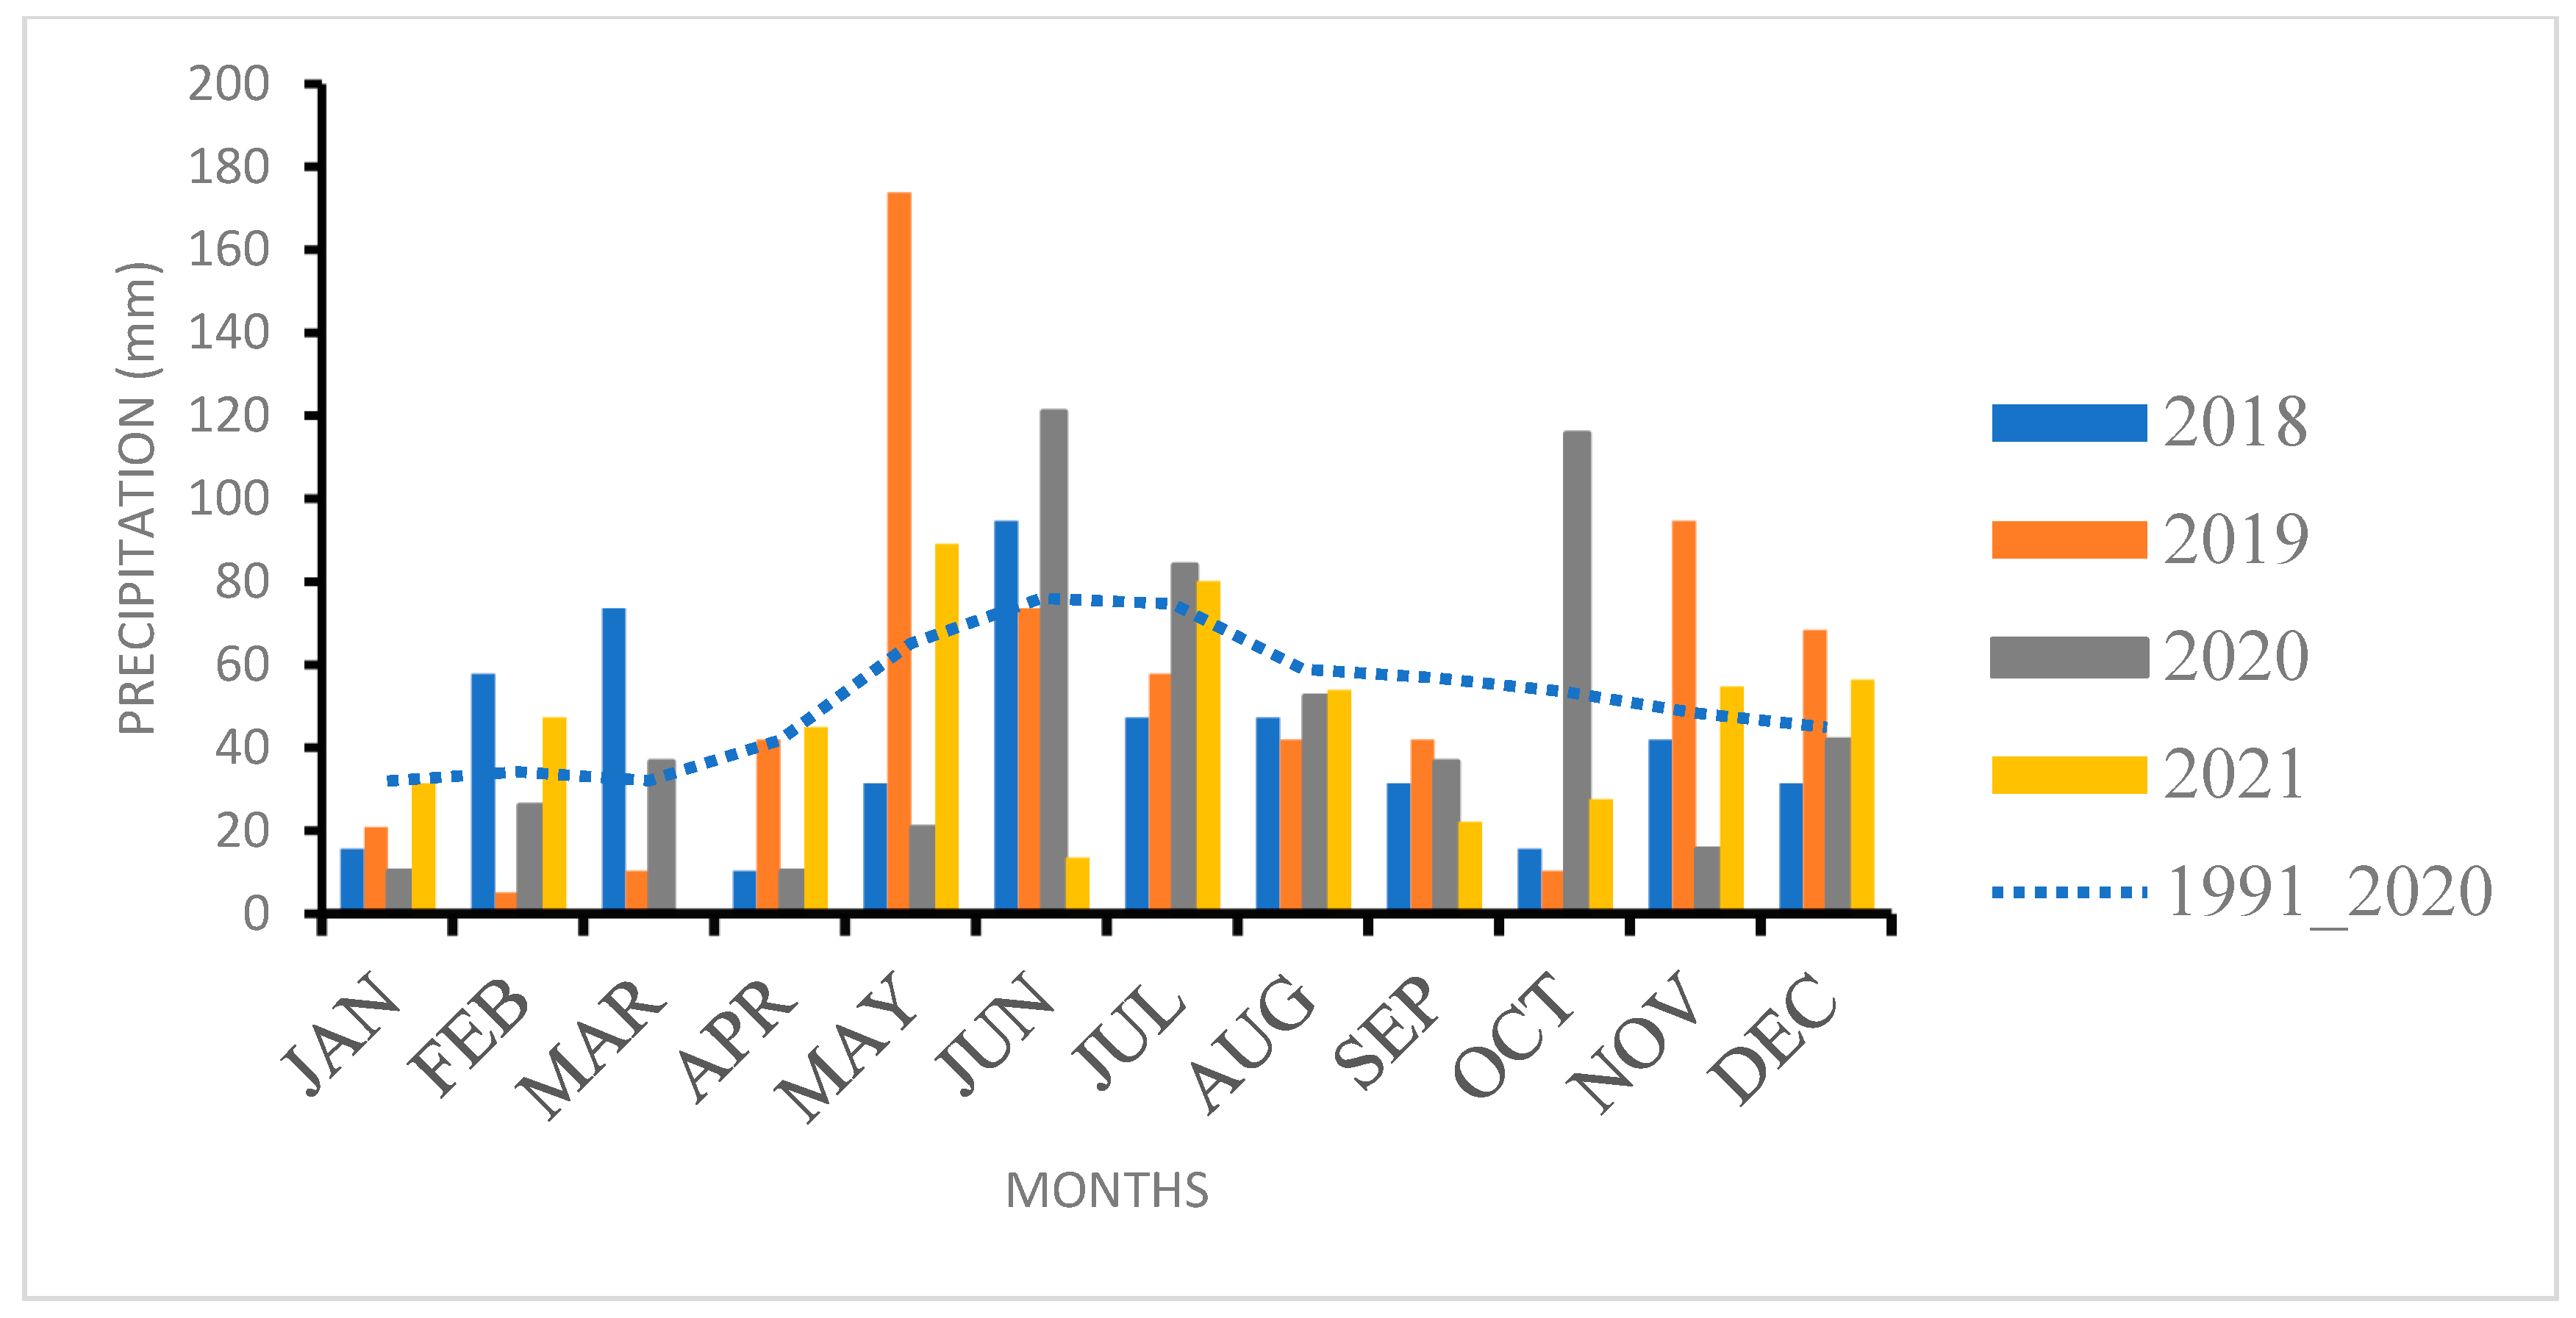
2.1. Study Location

The study was conducted at the Józsefmajor Experimental and Training Farm (JM) of the Hungarian University of Agriculture and Life Sciences near Hatvan (47°41′30.6″ latitude N, 19°36′46.1″ longitude E; 110 m above sea level), established in 2002. The research area covers 5.5 ha. The topography is level, with a clay-loam texture, classified as Endocalcic Chernozems, loamic [23]. The soil contained a humus content of 3.12% in the top 20 cm layer, with corresponding sand, silt, and clay contents of 10%, 54%, and 36%, respectively [24]. As described by Ács et al. [25], the climate in Hungary consists of warm, dry summers followed by dry, wet winters, referred to as a continental climate. The weather conditions are classified as continental, with annual temperatures ranging between 10.3 and 15 °C during growing periods [26]. The mean annual rainfall period from 2018 to 2021 ranged between 500.98 and 643.36 mm (Figure 1). During the duration of the study, the annual rainfall was 117.55, 43.72, and 95.24 mm lower in 2018, 2020, and 2021, respectively, when compared to the average long-term rainfall (1991–2020). Whereas in 2019, the study area received 24.33 mm more rainfall compared to the long-term average (1991–2020).

2.2. Experimental Design

The research area (Figure 2) consists of six tillage treatments that are arranged in a randomized block design with four replications, and each treatment area has a size of 2340 m2 (13 m × 180 m). The tillage treatments were disking (D, 16 cm), shallow cultivation (SC, 20 cm), no-tilling (NT), deep cultivation (DC, 25 cm), loosening (L, 45 cm), and Ploughing (P, 30 cm). Primary tillage was performed in correspondence with soil workability.

2.3. Soil Moisture Measurement

SMC was measured from 0 to 60 cm depth at 5 cm increments in four replications per treatment, and the data were aggregated to 0–10, 10–20, 20–30, 40–50, and 50–60 cm depths. Measurements were performed in 30-day intervals between March and November of the 2018–2019 and 2020–2021 cropping seasons. A PT-I type gauge (Kapacitiv Kft, Budapest, Hungary), which is based on a time domain reflectometry (TDR) principle, was used to determine SMC. The SMC was shown on the LCD of the instrument as water by weight, %, g g−1 [18]. The specified soil is classified as dry, humid, or wet when its moisture content ranges between 14.8–18.9, 19.0–23.9, and >24.0 g g−1 SMC, respectively [27].

2.4. Grain Yield and Root Weight Were Recorded

To obtain the fresh root weight, three plant roots were randomly selected for Sunflower roots were collected randomly three plants per treatment, washed, and measured using a digital scale, and the resulting weight was converted to t h−1. A similar procedure was followed to collect wheat roots with an auger. After collection, they were washed and weighed with a scale. A 12-row combine harvester was used to harvest sunflower heads. Similarly, wheat was harvested with a 6.6 m width combine, equipped with a straw chopper (Table 1).

2.5. Statistical Analysis

The R software version 4.3.1 was utilized to examine the SMC data. After conducting both the Kolmogorov–Sminov test and the Shapiro–Wilk test on the SMC data, it was determined that it did not adhere to Gaussian distribution (p < 0.05). To investigate the relationship between tillage treatments and crop yield while accounting for various random effects such as depth and season, generalized linear mixed models (GLMMs) were employed. The R syntax model used was as follows: model <- lmer (Moisture~Treatments + (1|Depth) + (1|Season), data = Analysis). A simpler model was utilized to separate the means: model <- lmer (Moisture~Treatments + (1|Season), data = Analysis). The 2018 grain yield and root weight data were subjected to a square root transformation and analyzed using a simple linear model. The R syntax model used was as follows: model: <- lm (Yield~Treatments, data = Analysis), with the parameters exchanged for analyzing root weight. The root weight and grain yield correlation coefficients were computed using the R software, with Pearson correlation utilized for normally distributed data and Spearman’s rank correlation coefficients used for non-parametric data. All means were separated using a Tukey HSD post hoc test at the 5% level of significance.

3. Results

3.1. The Effect of Tillage on SMC

The results of SMC measurements for 2018 and 2021 are presented in Table 2. Tillage significantly impacted SMC in both years. In 2018, SMC was assessed between March and August at 10 cm intervals from 0–60 cm depth. At 0–10 cm, no significant differences were observed among the tillage treatments. However, SMC was higher (18.99 g g−1) under NT and lowest (17.69 g g−1) under L treatment. At 10–20 cm, SMC was significantly higher under D, compared to NT (28.12 g g−1), (28.18 g g−1)P, and L treatments. The SMC at the SC, DC, P, and L did not differ significantly. At 20–30 cm, SMC was significantly lower under L; but statistically similar to, P, DC, and SC. Furthermore, P, SC, NT, and D SMC values were statistically similar. At 30–40 cm, statistically higher SMC was observed at P (29.20 g g−1) compared to the lowest at L (28.16 g g−1). However, P was statistically similar to that of D, DC, and NT within that same soil depth. A similar trend was observed in the 30–40 cm layer and was also observed at 40–50 cm in all treatment plots. At 50–60 cm, SMC was significantly greater at P than in SC but comparable to all the other tillage practices. Regarding the sampling date, statistical differences were observed during the study period, with SMC higher in August than in March [Table 2C(2b)]. In March, significantly higher SMC was observed at P (16%) followed by NT (15%) compared to L. No significant differences were observed between tillage treatments in April, June 28, and August. However, on June 3, SMC significantly lowered by 8% at L relative to D. Regarding soil depth, SMC increased with increasing depth in all treatments, with the greatest SMC observed at 40–50 cm and the lowest observed at 0–10 cm. Between 20–30 cm and 50–60 cm, SMC was significantly different among the studied treatments. Considering the differences between sampling dates, the SMC increased with time in all treatments. In 2021, SMC at NT was 84% higher relative to the lowest measured at P [Table 2C(2a)]. At 0–10 cm, a significant 17% and 7% increase in SMC was observed at NT and DC, respectively, relative to P. However, at 10–20 cm, D significantly increased SMC by 8% compared to P. Furthermore, statistically, D did not vary from SC, DC, or L. Similarly, at 20–30 cm, 30–40 cm, and 40–50 cm, P was significantly lower by 3%, 2%, and 16%, respectively, relative to NT. No significant differences were observed among the treatments at 50–60 cm. Considering sampling, the greatest SMC (16%) was measured in September relative to the lowest observed in March. There were no significant differences among the treatments from October to April [Table 2C(2b)]. However, in October, November, and March, NT showed a 6%, 4%, and 3%, respectively, higher SMC relative to P. In September, a significantly higher SMC was observed at D, SC, NT, and L than at P. SMC differences between the sampling dates showed that at P, there was no significant difference among sampling dates, although SMC slightly increased with time. SMC was the lowest of all treatments in March relative to the other sampling dates.

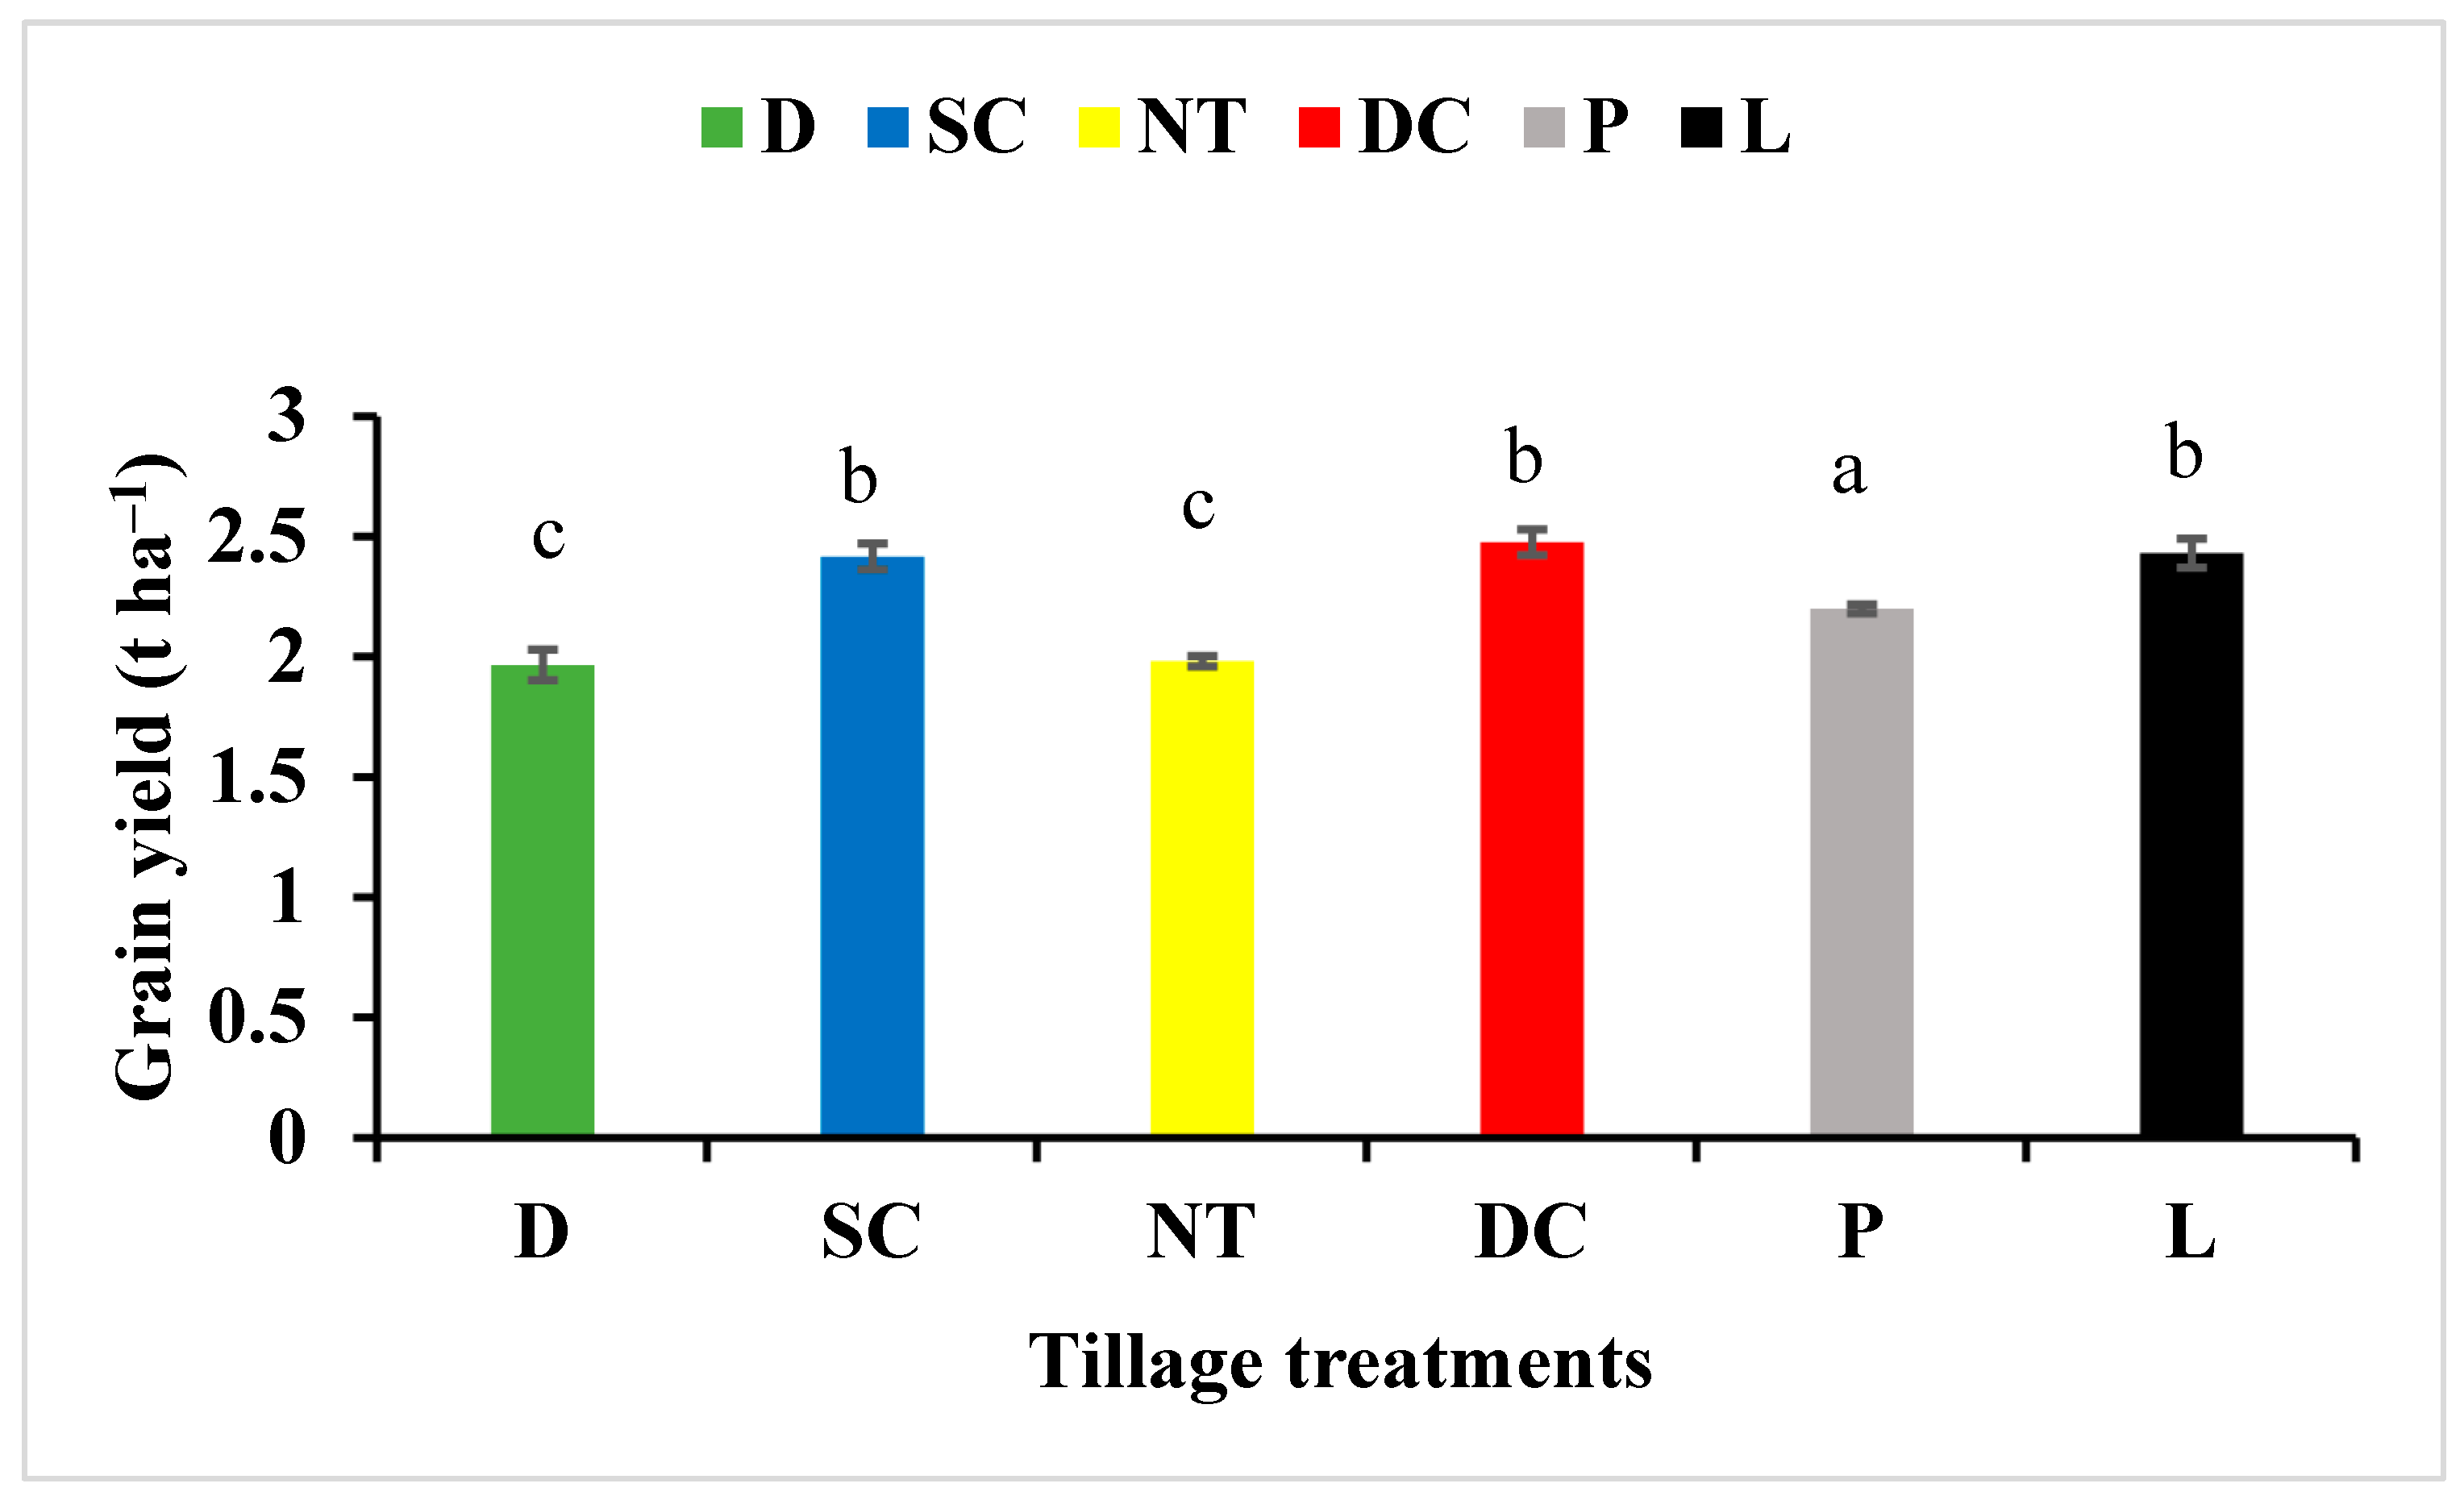
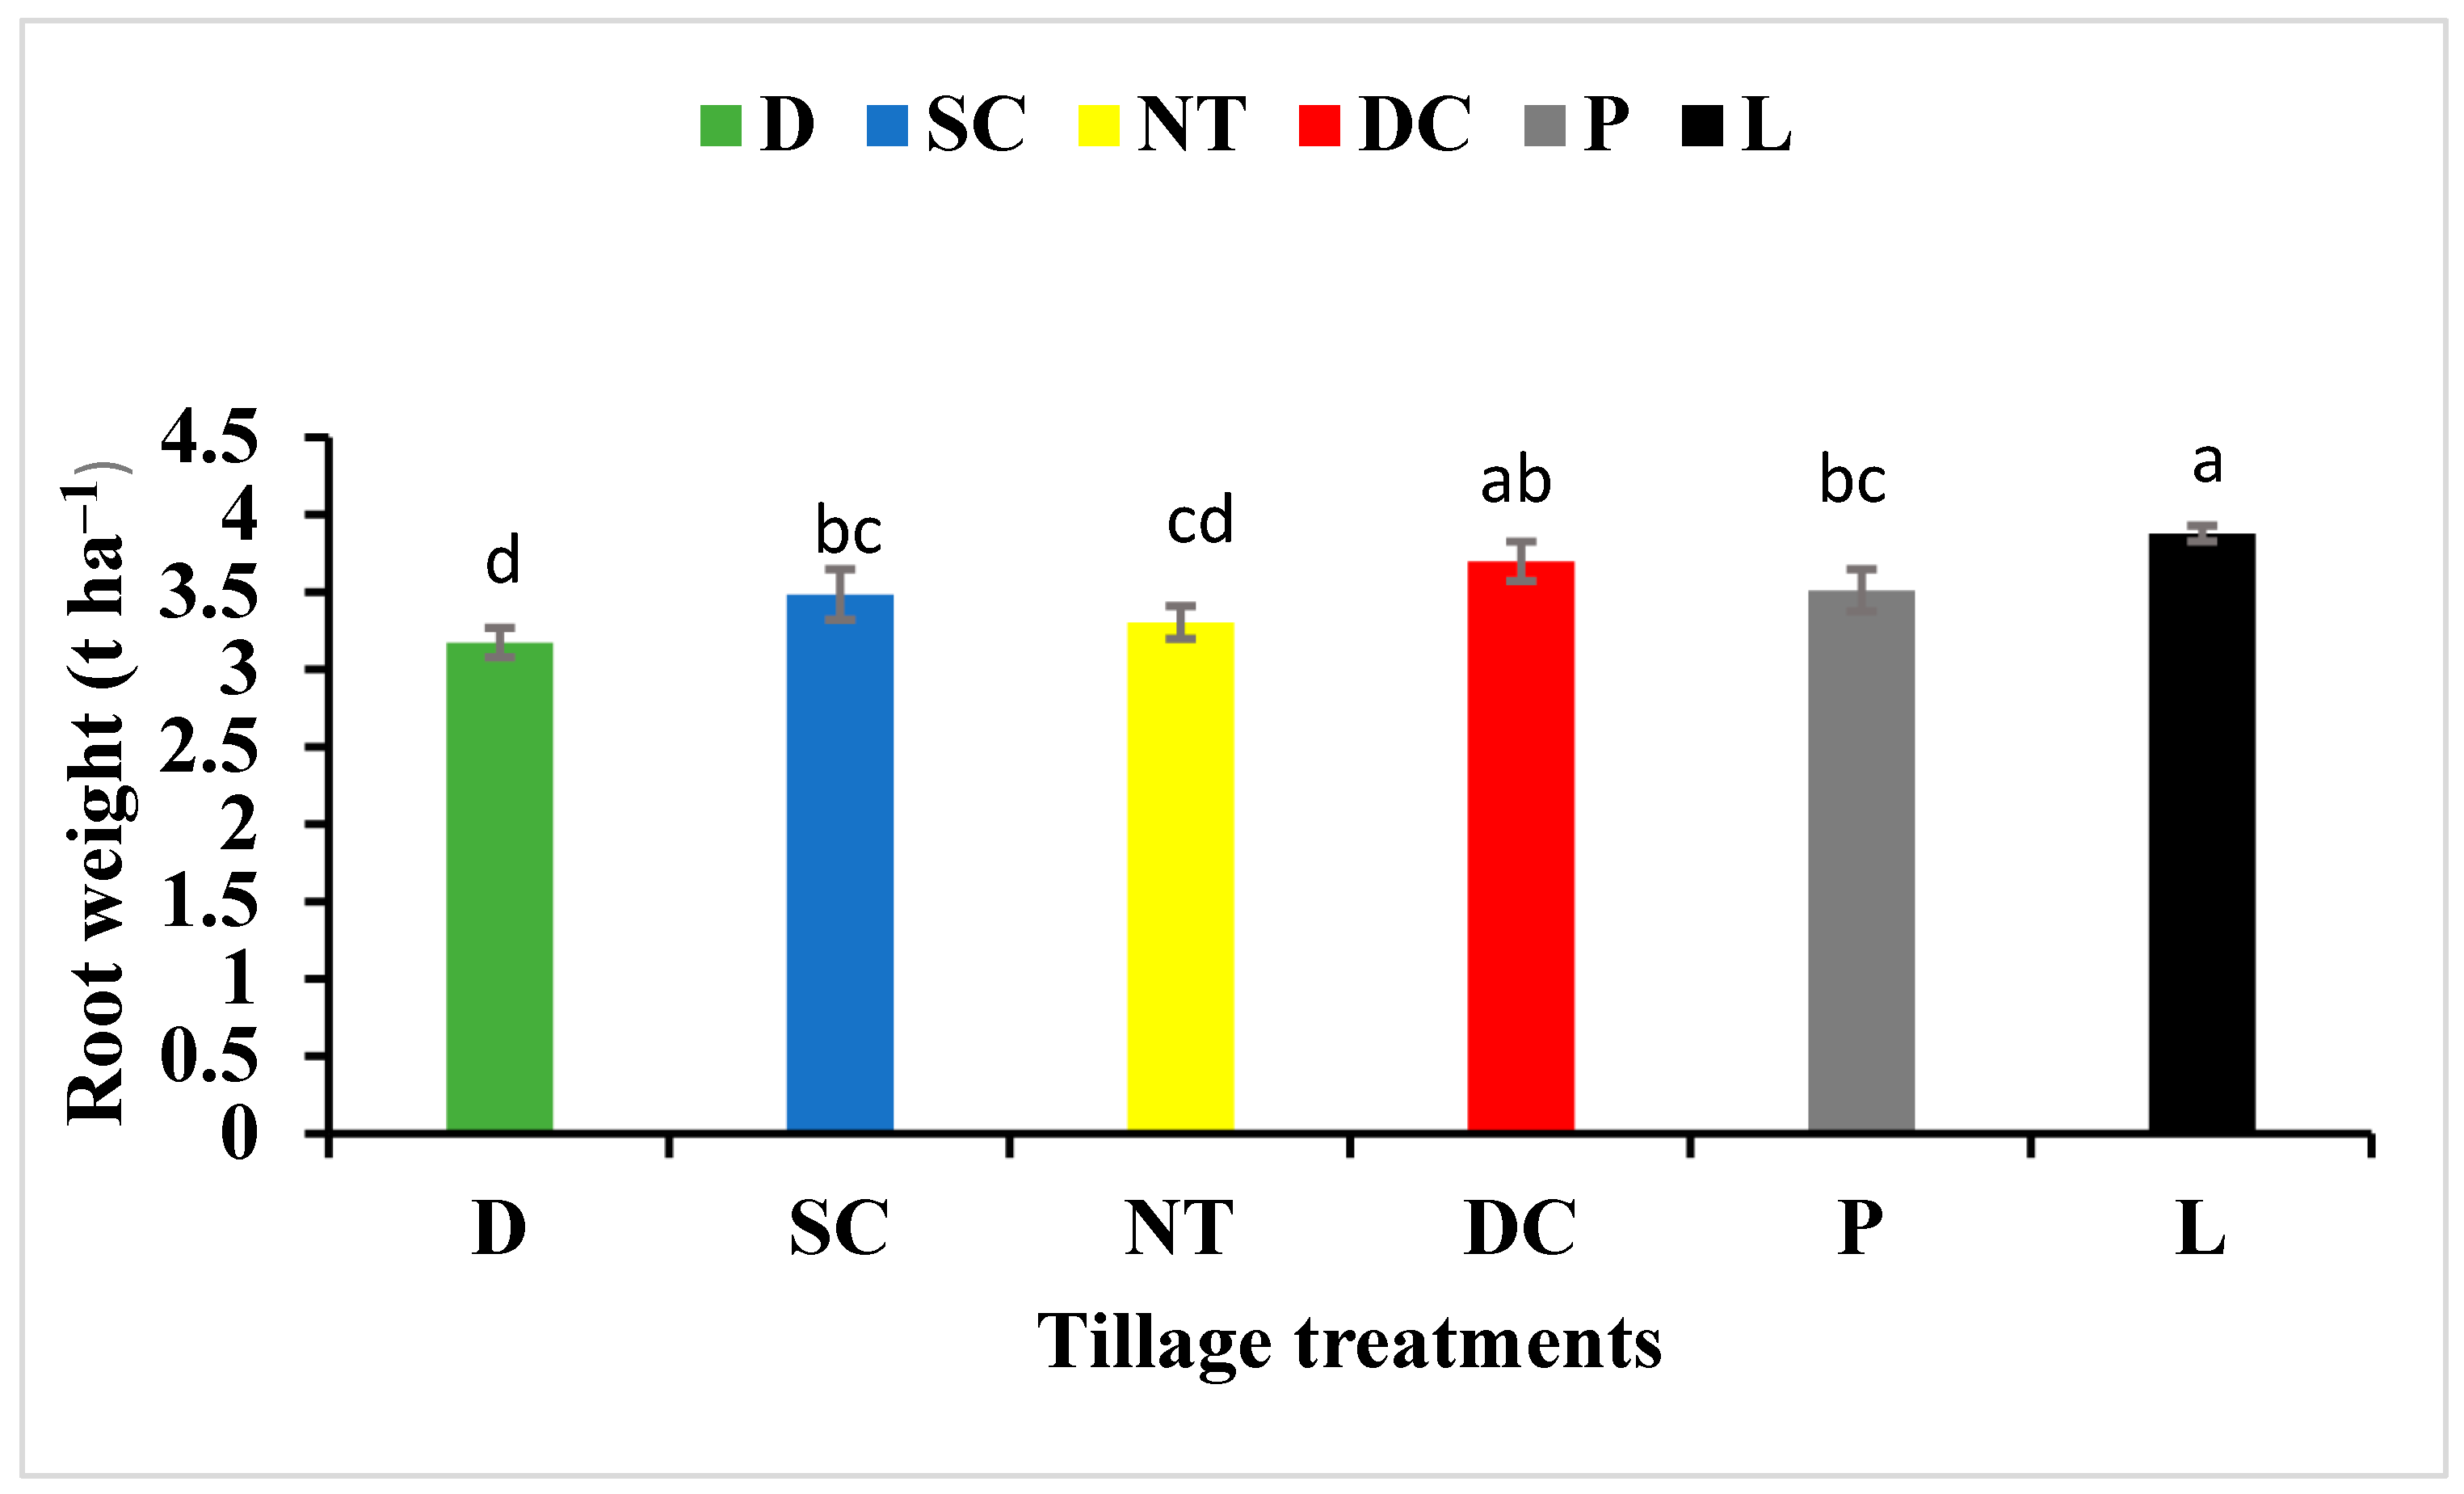
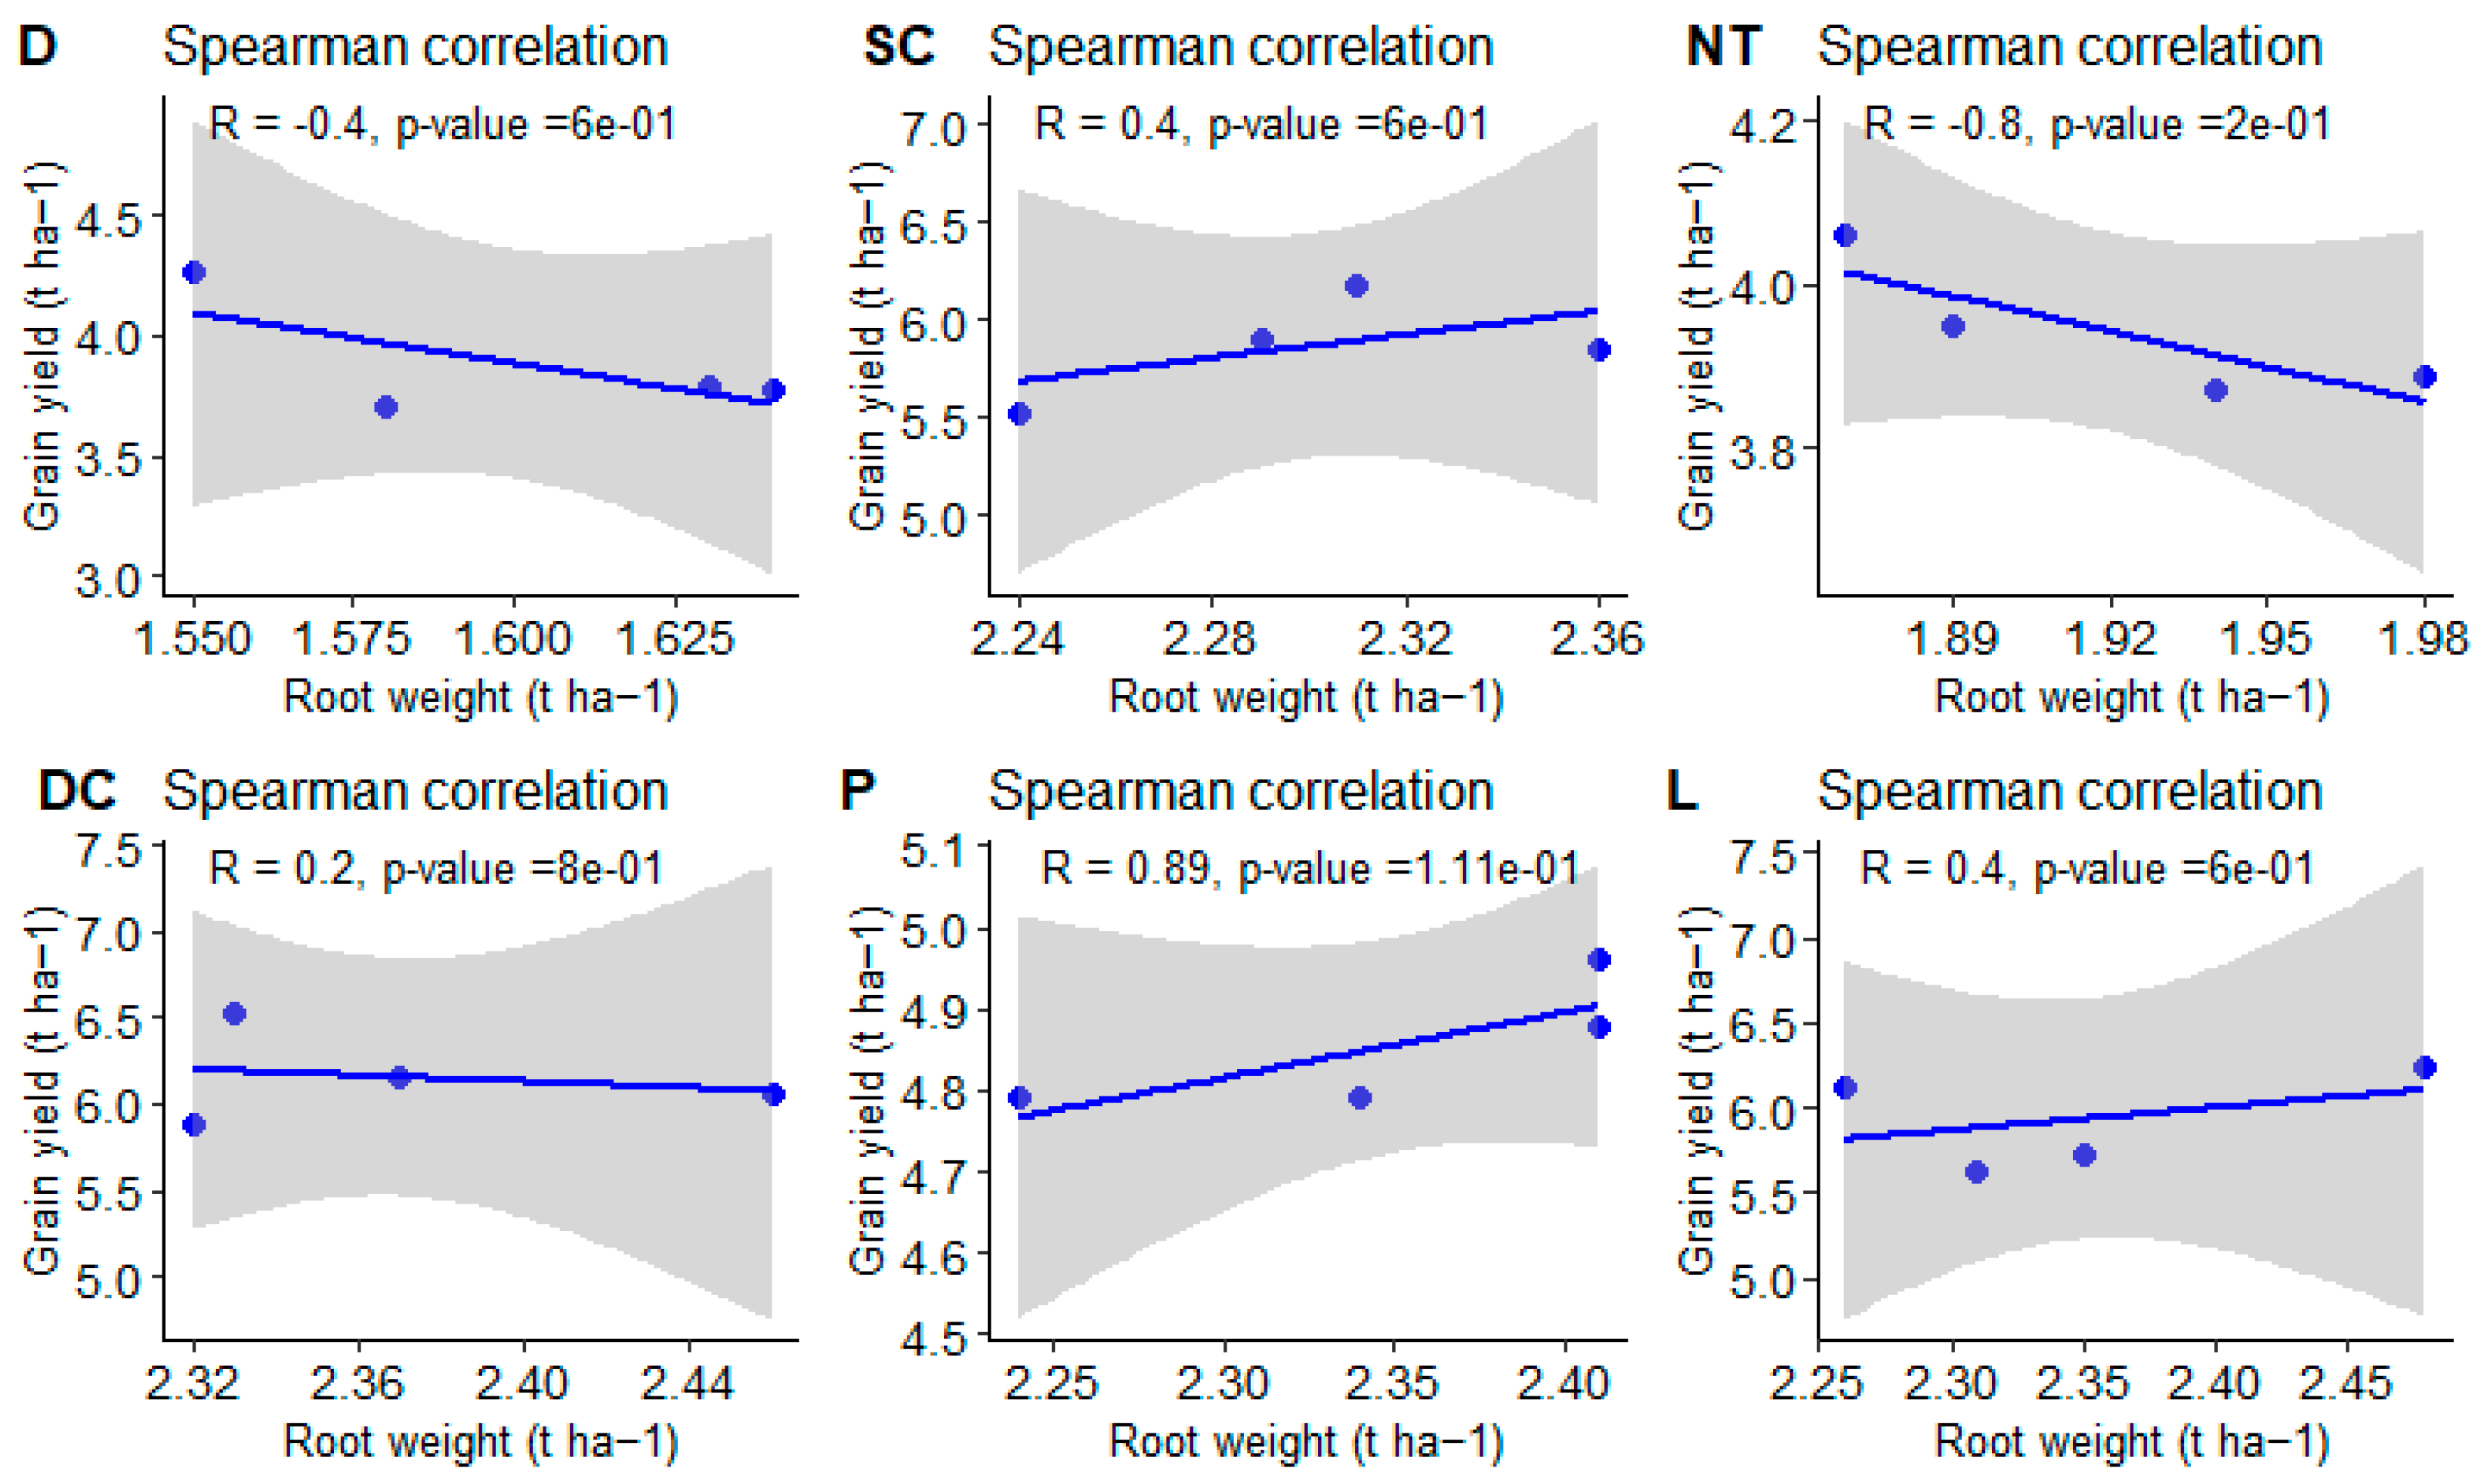
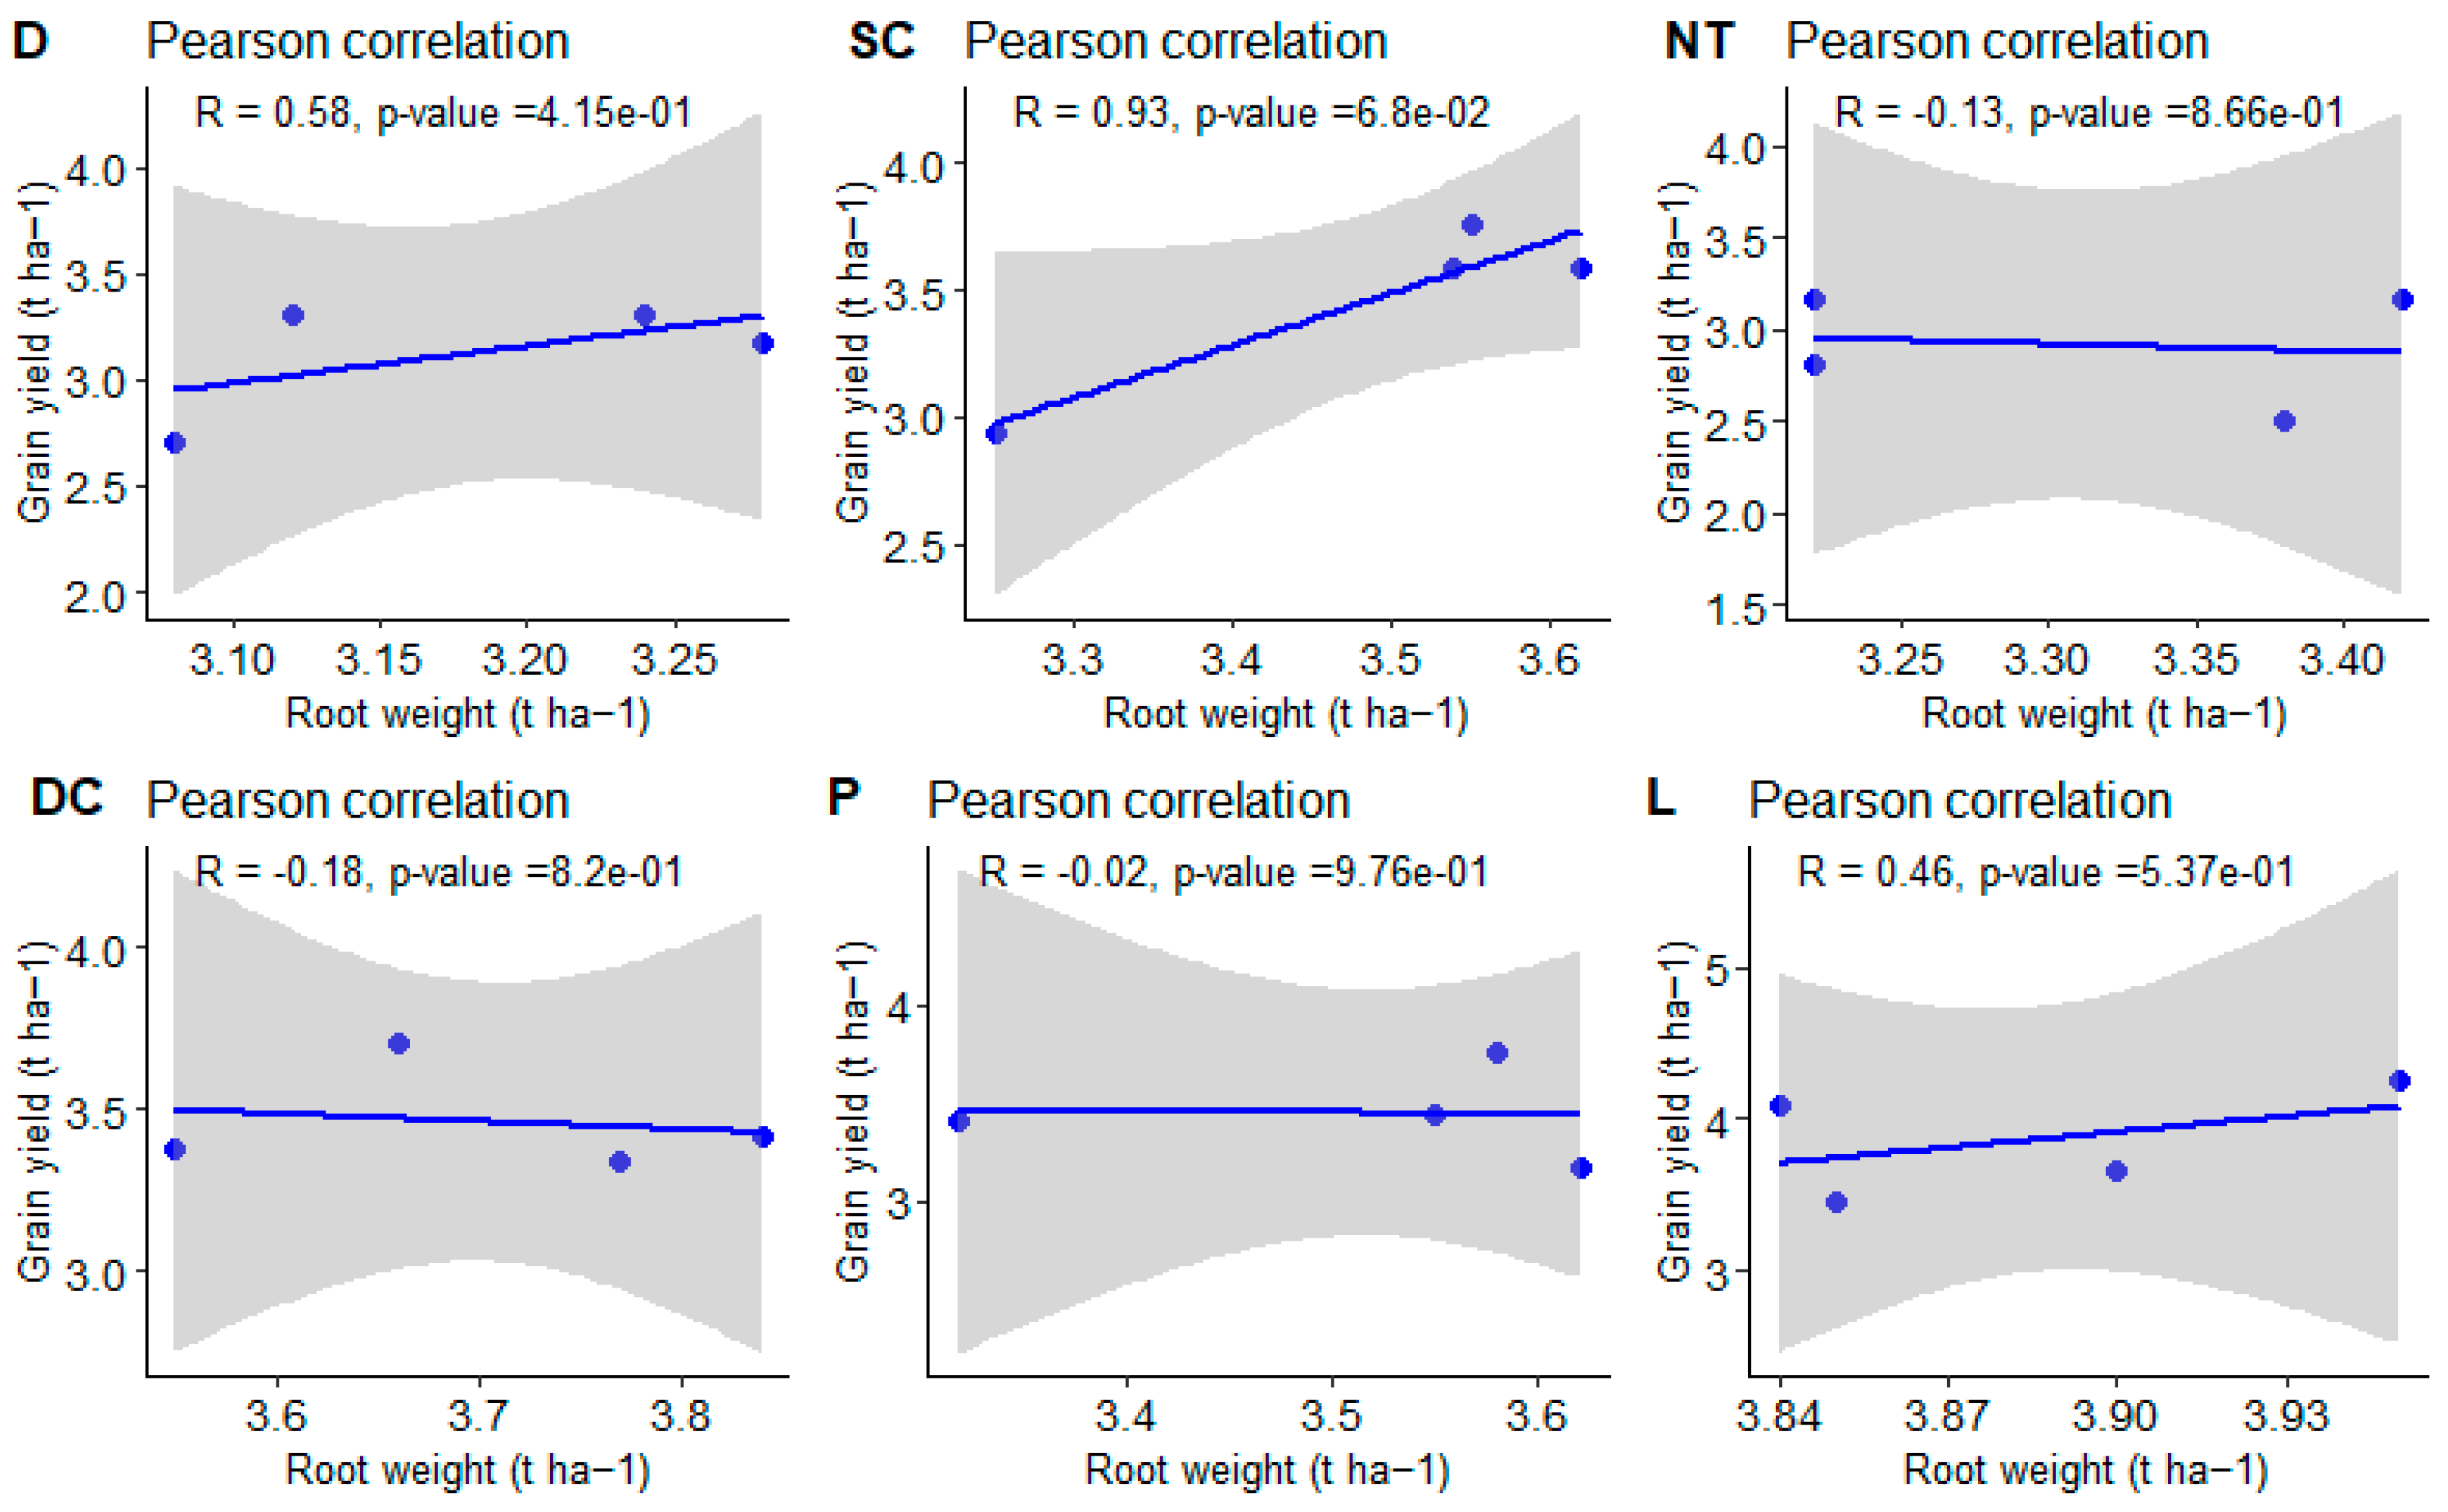
3.2. The Effect of Tillage on Wheat and Sunflower Root Weight and Grain Yield

Wheat grain was harvested on 19 July 2018, at 10.2% moisture content (Figure 3). Each treatment was harvested, and yield was measured in t ha−1. In 2018, tillage treatments had a significant effect on wheat grain yield (p < 0.05) (Figure 3). Wheat grain yield was similar (p > 0.05) in DC, L, and SC. However, the latter three treatments but the three tillage practices had greater wheat yield compared to NT, P, and D as the lowest wheat grain yield producers. In contrast, the wheat grain yield in the NT and P fields was not significant (p > 0.05).
In 2021, the sunflower seed yield was cultivated, as illustrated in Figure 4, revealing that tillage had a substantial effect on seed yield, which was considered statistically significant (p < 0.05). The highest seed yield was observed at L (3.86 t ha−1); however, it was not statistically different from SC and P. In comparison, the sunflower seed yield in the NT treatment was 34% lower than the yield observed in the L treatment.
The root weight of wheat and sunflower results for 2018 and 2021 are presented in Figure 5 and Figure 6, respectively. Tillage significantly affected root weight (p < 0.05) in both cropping seasons. The wheat root weight in 2018 under DC was 22% greater relative to the lowest obtained at D. The wheat root weight was in the following order: DC > L = P > SC > NT > D when considering all treatments.
In 2021, tillage significantly affected sunflower root weight (p = 1.03 × 10⁻⁵). The sunflower root weight under L was 22% higher compared to the lowest at D. Sunflower root weights in treatments D, NT, DC, and P were similar (p > 0.05). Similarly, treatments SC, NT, and P were not statistically different. Whereas sunflower root weight in DC did not differ statistically from all the other treatments.
Figure 7 and Figure 8 show the Spearman rank and Pearman correlation plots analysis performed to assess the relationship between root weight and crop yield. The correlation analysis for 2018 was not statistically significant for all tillage treatments. The correlation plots revealed positive relationships between wheat root weight and crop yield under the SC, P, and L treatments. The strongest positive relationship between root weight and grain yield was observed under the P treatment, with a correlation coefficient ρ = 0.89, followed by the SC and L treatments both with correlation coefficient ρ = 0.4. Furthermore, the least positive correlation was observed at DC. Treatments D and NT showed negative correlations of −0.4 and −0.8, respectively.
In 2021, the Pearson correlation analysis for sunflower (Helianthus annuus) revealed both strong positive and insignificant negative relationships between sunflower root weight and grain yield. Notably, strong positive relationships were observed under D, SC, and L (Figure 8). Among these, the strongest relationship was observed under SC (R = 0.93), followed by D (R = 0.58) and L (R = 0.46). On the other hand, DC, P, and NT showed weak correlations of (R = −0.21), (R = −0.7), and (R = −0.84), respectively.

4. Discussion

4.1. The Effect of Tillage on SMC

In this study, the effects of tillage methods on SMC and crop yield were studied. The results obtained showed a significant response of tillage, sampling date, and depth to SMC. Long-term studies have demonstrated that less intensive (SC, NT, and D) tillage methods have proven beneficial in improving the physical, chemical, and biological properties of the soil. Traditional tillage methods, such as P, retain fewer stubbles and potentially negatively affect SMC [28]. Furthermore, the less intensive tillage method has been highly advocated for its benefits for moisture conservation [18,29] compared to CT. The results of our study suggest that no-till (NT) practices lead to higher soil micro-aggregate concentration in the top layer (0–10 cm) compared to conventional tillage. Although these differences were not statistically significant, they are consistent with the findings of Dekemati et al. [18], who also observed the impact of stubble retention on SMC levels in the same study area. Adequate stubble retention with at least a 30% soil cover ratio in NT treatment plots protects the soil from harsh weather conditions, consequently reducing evaporation. However, it is important to note that SMC was occasionally higher than the conservation tillage practices (SC and NT) at various depths. This can be explained by the amount of precipitation that occurred during the cropping period. Precipitation was fairly distributed throughout the year, with May receiving 174.02 mm downpours (Figure 1). Our results are consistent with various [6,30,31] studies that reported higher SMC under conservation tillage than under conventional tillage.
Kroulík et al. [32] found greater SMC under deep tillage resulting from its deep loosened layer, which increases the frequency of water infiltration. Contrary to the study by Dekemati et al. [18], SMC in this study was lowest from the top layer to approximately the maximum depth measured (0–10 to 40–50 cm) under the L treatment relative to other treatments. Our results also disagree with the findings of Yankov and Drumeva [33] who observed significantly higher SMC during low rainfall conditions with chisel plow at various soil depths (10–20, 20–30, and 30–40 cm). The low SMC observed under L can be attributed to various reasons. Induced partial water (rainfall or irrigation) infiltration and drainage patterns resulting from loosening practices [34,35]. Loosening soil, especially in heavy clay soils, has the effect of changing hydraulic properties by decreasing bulk density, increasing soil porosity, and enhancing water permeability, leading to the formation of preferential flow pathways [36]. This partial flow may result in fast gravitational water movement, thus creating a water bypass on the surrounding soil matrix. This leads to restricted desiccated zones irrespective of overall copious precipitation [37]. Additionally, deep loosening functions like active macropores, and corresponding dry soil cracks, promoting quick water flow away from the surface [38]. The results of the study suggest that there is a complex relationship between tillage practices and soil moisture levels, which cannot be simply generalized. Specifically, during the sampling periods in April and June, the highest SMC was observed when loosening was practiced, while in August, no-tillage practices were associated with higher moisture levels. This pattern can be attributed to the impact of tillage techniques on soil structure and moisture dynamics. Deep tillage methods, such as loosening, can extend the loosened layer in the soil and increase moisture infiltration rates. In contrast, the presence of a protective mulch layer in NT may mitigate evaporation rates and sustain higher soil moisture levels. These findings emphasize the importance of considering multiple factors in agricultural management decisions, as the interplay between tillage practices, soil structure, and moisture retention is complex and nuanced. Our results are in line with those of Jin et al. [34], who observed significantly greater SMC of 18.9 and 20.8% relative to P in May 2005 at 20–40 and 40–60 cm depths under loosening. Fu et al. [39] reported that half of summer rainfall in arid wheat fields was obtained under subsoiling. Moreover, subsoiling enhanced soil water storage capacity by 76.2 mm in 0–2 m depth prior to planting. The highest SMC obtained on the 3rd of June under D is attributed to the high rainfall (174.02 mm) received in May. Plausibly, the increased density of soil that results from an annual disking application is more pronounced in humid soils, which could lead to higher SMC in the rhizosphere. Lukacs et al. [40] pointed out that in wet seasons high soil density in the rhizosphere leads to relative water abundance in a rainy period.
Particularly notable was the significant difference in SMC between P and NT at the depth of 20–30 cm which highlights the contrasting impacts of CT versus conservation tillage practices. Our findings underscore the continued positive influence of conservation tillage methods on soil moisture conservation.
The substantial differences in SMC between SC, D, and NT at the depth of 40–50 cm compared to plowing were noteworthy, with respective differences of 3.64 g g−1, 3.76 g g−1, and 3.93 g g−1. Generally, findings in this study underscore the efficacy of conservation tillage practices, such as NT, in maintaining higher soil moisture levels at deeper soil depths compared to traditional plowing methods. Such differences hold significant implications for agricultural management strategies. We posit that improved conservation tillage methods hold the potential to mitigate soil moisture deficits and enhance overall soil health and productivity.
The rainfall in 2021 cropping was lower than that in the 2018 cropping season (Figure 2). The high SMC observed under P in 2018 was due to rainfall; comparing the rainfall of the two cropping seasons in 2021 rainfall was 22.31 mm more than that in 2018.
The low SMC observed in September at P was due to low rainfall. The rainfall received in September 2021 was 34.58 mm lower compared to the long-term average. The P treatment is associated with a high loss of SMC due to its removal of stubble residues. Additionally, soil turning promotes the decomposition of organic matter and disintegration of soil aggregates which play a pivotal part in SMC infiltration, retention, and conservation [41]. Despite no significant differences in SMC during other sampling dates (October, November, April, and March), the plowing treatment consistently exhibited the lowest SMC on three of the four occasions indicating its inferior moisture retention capacity. Notably, despite receiving substantial precipitation in October, the impact on SMC storage under different tillage treatments was negligible. This showcases the limited efficacy of precipitation in offsetting the moisture-depleting effects of intensive tillage, particularly, in the ploughing treatment.

4.2. The Effect of Tillage on Wheat and Sunflower Root Weight and Grain Yield

The outcomes obtained in 2018 regarding wheat grain yield under NT conditions as compared to P align with the findings of Afzalinia and Zabihi [42], who reported diminished maize grain yield and yield components following short-term NT studies when compared with CT practices. These researchers attributed the observed results to the increased soil compaction associated with NT. The similarity between the results obtained in our study and those of Afzalinia and Zabihi [42] suggests that soil compaction may indeed contribute to reduced yields under minimum tillage practices. Moreover, our Pearson correlation coefficient suggests that crops may have sacrificed grain yield for a more developed root system under NT (see Figure 8). These outcomes may have been caused by compaction, as roots require more energy to grow in compacted soil. Additionally, low wheat yield was observed at D relative to all other treatments. This may be attributed to the depth of the loosened layer (as indicated by the root weight results in Figure 5) resulting from the annual disking of the soil. Therefore, we emphasize the importance of implementing specialized conventional tillage management strategies, such as loosening, to optimize agricultural productivity. It is important to note that plowing and disking (particularly in wet soil) should not be encouraged for agricultural productivity due to their adverse effects on soil structure, moisture retention, and overall soil health.
In 2021, the greatest sunflower yield was obtained at L. This showed that loosening provided suitable growing conditions (depth of the loosened layer) According to records, loosening of the soil is believed to improve the soil’s physical condition by alleviating the compact layer. This allows the roots to increase in depth and weight and extend deeper into the soil to absorb water and nutrients accumulated in the subsoil [43]. Consequently, loosening improves dry biomass accumulation, and ultimately attaining greater grain yield and profitable benefits [44,45].
Zhang et al. [46] outlined a significant correlation between root biomass and shoot biomass which leads to greater yields and water use efficiency. Considerable differences regarding sunflower yield at D were noted. These findings can be explained by several reasons. One of the reasons is assuming the presence of a compact layer created by annual disking. Birkás et al. [47] reported that annual disking causes more harm than plowing, particularly in humid light-textured soils. Consequently, hindering normal root growth [48] thus prohibiting the absorption of water and nutrients and accelerating aging.

5. Conclusions

The current study on the effect of different tillage methods on SMC and crop yield was conducted in Hungary. The results obtained from the study were more profound under less intensive tillage methods. Specifically, during the sampling periods in April and June, the highest SMC was observed when loosening was practiced, while in August, no-tillage practices were associated with higher moisture levels. However, it is important to note that occasionally we observed higher SMC in conventional tillage methods which can be attributed to profile replenishment by rainfall events. The conservation tillage methods were more important in moisture-limited periods in this study. We can deduce that concerning SMC, conservation tillage methods such as NT are no different from conventional tillage methods in areas that receive adequate and normally distributed rainfall. However, in seasons where rainfall is inadequate, conservation tillage proves to be the best for moisture conservation thus resisting the adverse climate effects. Crop yield response was more pronounced under loosening in both cropping seasons, which is probably due to the fact that the depth of the loosened layer promoted root proliferation which facilitated nutrients and water absorption. Therefore, for obtaining higher yields irrespective of climatic conditions, it is recommended that soil must be loosened to a depth of 40–45 cm. The future research objectives of this study are to explore the effect of long-term soil tillage on the soil hydraulic properties, soil penetration resistance, compaction, earthworm abundance, soil organic matter, and how they play a role in affecting crop growth and yield.

Author Contributions

Conceptualization, M.M.M., C.M.O., I.D., M.B. and B.S.; methodology, I.D., B.S. and M.B.; software, M.M.M. and C.M.O.; validation, I.D., B.S., M.M.M. and M.B.; formal analysis, I.D., B.S., C.M.O. and M.B.; investigation, M.M.M., I.D., M.B., H.T.M.I. and B.S.; resources, B.S., I.D and M.B.; data curation, M.M.M., I.D. and C.M.O.; writing—original draft preparation, M.M.M., I.D., B.S., C.M.O. and M.B.; writing—review and editing, C.M.O., B.S., I.D. and M.B.; visualization, M.M.M. and C.M.O.; supervision, I.D. and B.S.; project administration, I.D. and B.S.; funding acquisition, B.S. All authors have read and agreed to the published version of the manuscript.

Funding

The research was supported by the project ‘The feasibility of the circular economy during national defense activities’ of 2021 Thematic Excellence Program of the National Research, Development and Innovation Office under grant no.: TKP2021-NVA-22, led by the Centre for Circular Economy Analysis.

Data Availability Statement

The data presented in this study are available on request from the corresponding authors.

Acknowledgments

We would like to express our thanks to the Stipendium Hungaricum Scholarship for supporting our research.

Conflicts of Interest

The authors declare no conflict of interest.

References

  1. Gregić, M. Pogodnost tala Oranice i Voćnjaka za Ekološku Poljoprivredu. Doctoral Dissertation, Department for Agroecology, Faculty of Agriculture, Josip Juraj Strossmayer University of Osijek, Osijek, Croatia, 2017. [Google Scholar]
  2. Zhu, Y.Z.; Li, Y.Y.; Han, J.G.; Yao, H.Y. Effects of changes in water status on soil microbes and their response mechanism: A review. Ying Yong Sheng Tai Xue Bao = J. Appl. Ecol. 2019, 30, 4323–4332. [Google Scholar]
  3. Wang, X.J.; Zhang, J.Y.; Shahid, S.; Guan, E.H.; Wu, Y.X.; Gao, J.; He, R.M. Adaptation to climate change impacts on water demand. Mitig. Adapt. Strateg. Glob. Chang. 2016, 21, 81–99. [Google Scholar] [CrossRef]
  4. Qin, W.; Hu, C.; Oenema, O. Soil mulching significantly enhances yields and water and nitrogen use efficiencies of maize and wheat: A meta-analysis. Sci. Rep. 2015, 5, 16210. [Google Scholar] [CrossRef]
  5. Covelli, C.; Cimorelli, L.; Pagliuca, D.N.; Molino, B.; Pianese, D. Assessment of erosion in river basins: A distributed model to estimate the sediment production over watersheds by a 3Dimensional LS Factor in RUSLE Model. Hydrology 2020, 7, 13. [Google Scholar] [CrossRef]
  6. Kühling, I.; Redozubov, D.; Broll, G.; Trautz, D. Impact of tillage, seeding rate and seeding depth on soil moisture and dryland spring wheat yield in Western Siberia. Soil Tillage Res. 2017, 170, 43–52. [Google Scholar] [CrossRef]
  7. Salvia, R.; Egidi, G.; Vinci, S.; Salvati, L. Desertification risk and rural development in Southern Europe: Permanent assessment and implications for sustainable land management and mitigation policies. Land 2019, 8, 191. [Google Scholar] [CrossRef]
  8. Bottinelli, N.; Angers, D.A.; Hallaire, V.; Michot, D.; Le Guillou, C.; Cluzeau, D.; Heddadj, D.; Menasseri-Aubry, S. Tillage and fertilization practices affect soil aggregate stability in a Humic Cambisol of Northwest France. Soil Tillage Res. 2017, 170, 14–17. [Google Scholar] [CrossRef]
  9. Gao, L.; Wang, B.; Li, S.; Wu, H.; Wu, X.; Liang, G.; Gong, D.; Zhang, X.; Cai, D.; Degré, A. Soil wet aggregate distribution and pore size distribution under different tillage systems after 16 years in the Loess Plateau of China. Catena 2019, 173, 38–47. [Google Scholar] [CrossRef]
  10. Lampurlanés, J.; Plaza-Bonilla, D.; Álvaro-Fuentes, J.; Cantero-Martínez, C. Long-term analysis of soil water conservation and crop yield under different tillage systems in Mediterranean rainfed conditions. Field Crop. Res. 2016, 189, 59–67. [Google Scholar] [CrossRef]
  11. Sun, M.; Ren, A.X.; Gao, Z.Q.; Wang, P.R.; Mo, F.; Xue, L.Z.; Lei, M.M. Long-term evaluation of tillage methods in fallow season for soil water storage, wheat yield and water use efficiency in semiarid southeast of the Loess Plateau. Field Crop. Res. 2018, 218, 24–32. [Google Scholar] [CrossRef]
  12. Małecka, I.; Blecharczyk, A.; Sawinska, Z.; Plechota, T.; Waniorek, B. Cereals yield response to tillage methods. Fragm. Agron. 2012, 29, 114–123. [Google Scholar]
  13. Al-Wazzan, F.A.; Muhammad, S.A. Effects of conservation and conventional tillage on some soil hydraulic properties. In IOP Conference Series: Earth and Environmental Science; IOP Publishing: Bristol, UK, 2022; Volume 1060, p. 012002. [Google Scholar]
  14. Ebabu, K.; Tsunekawa, A.; Haregeweyn, N.; Adgo, E.; Meshesha, D.T.; Aklog, D.; Masunaga, T.; Tsubo, M.; Sultan, D.; Fenta, A.A.; et al. Exploring the variability of soil properties as influenced by land use and management practices: A case study in the Upper Blue Nile basin, Ethiopia. Soil Till. Res. 2020, 200, 104614. [Google Scholar] [CrossRef]
  15. Estevam, R.F.H.; Peixoto, D.S.; de Melo Filho, J.F.; Amorim, H.C.S.; de Souza Moreira, F.M.; Silva, A.O.; Mouazen, A. Soil properties sensitive to degradation caused by increasing intensity of conventional tillage. Soil Res. 2021, 59, 819–836. [Google Scholar] [CrossRef]
  16. Gallardo-Carrera, A.; Léonard, J.; Duval, Y.; Dürr, C. Effects of seedbed structure and water content at sowing on the development of soil surface crusting under rainfall. Soil Tillage Res. 2007, 95, 207–217. [Google Scholar] [CrossRef]
  17. Jug, D.; Jug, I.; Brozović, B.; Vukadinović, V.; Stipešević, B.; Đurđević, B. The role of conservation agriculture in mitigation and adaptation to climate change. Agriculture 2018, 24, 35–44. [Google Scholar] [CrossRef]
  18. Dekemati, I.; Simon, B.; Vinogradov, S.; Birkás, M. The effects of various tillage treatments on soil physical properties, earthworm abundance and crop yield in Hungary. Soil Tillage Res. 2019, 194, 104334. [Google Scholar] [CrossRef]
  19. Dekemati, I.; Simon, B.; Bogunovic, I.; Kisic, I.; Kassai, K.; Kende, Z.; Birkás, M. Long term effects of ploughing and conservation tillage methods on earthworm abundance and crumb ratio. Agronomy 2020, 10, 1552. [Google Scholar] [CrossRef]
  20. Madarász, B.; Jakab, G.; Szalai, Z.; Juhos, K.; Kotroczó, Z.; Tóth, A.; Ladányi, M. Long-term effects of conservation tillage on soil erosion in Central Europe: A random forest-based approach. Soil Tillage Res. 2021, 209, 104959. [Google Scholar] [CrossRef]
  21. Jakab, G.; Madarász, B.; Szabó, J.A.; Tóth, A.; Zacháry, D.; Szalai, Z.; Kertész, Á.; Dyson, J. Infiltration and soil loss changes during the growing season under ploughing and conservation tillage. Sustainability 2017, 9, 1726. [Google Scholar] [CrossRef]
  22. Jug, D.; Đurđević, B.; Birkás, M.; Brozović, B.; Lipiec, J.; Vukadinović, V.; Jug, I. Effect of conservation tillage on crop productivity and nitrogen use efficiency. Soil Tillage Res. 2019, 194, 104327. [Google Scholar] [CrossRef]
  23. IUSS Working Group WRB. World Reference Base for Soil Resources 2014, Update 2015. In International Soil Classification System for Naming Soils and Creating Legends for Soil Maps; World Soil Resources Reports No. 106; FAO: Rome, Italy, 2015. [Google Scholar]
  24. Tóth, E.; Gelybó, G.; Dencső, M.; Kása, I.; Birkás, M.; Horel, Á. Soil CO2 emissions in a long-term tillage treatment experiment. In Soil Management and Climate Change: Effects on Organic Carbon, Nitrogen Dynamics, and Greenhouse Gas Emissions; Munoz, M., Zornoza, R., Eds.; Elsevier: Amsterdam, The Netherlands, 2017; pp. 293–307. [Google Scholar]
  25. Ács, F.; Breuer, H.; Skarbit, N. Climate of Hungary in the twentieth century according to Feddema. Theor. Appl. Climatol. 2015, 119, 161–169. [Google Scholar] [CrossRef]
  26. New, M.; Lister, D.; Hulme, M.; Makin, I. A high-resolution data set of surface climate over global land areas. Clim. Res. 2002, 21, 1–25. [Google Scholar] [CrossRef]
  27. Csorba, S.; Farkas, C.; Birkás, M. Dual porosity water retention curves for characterizing the effect of tillage. Agrokémia és Talajtan 2011, 60, 335–342. [Google Scholar] [CrossRef]
  28. Tao, Z.; Li, C.; Li, J.; Ding, Z.; Xu, J.; Sun, X.; Zhou, P.; Zhao, M. Tillage and straw mulching impacts on grain yield and water use efficiency of spring maize in Northern Huang–Huai–Hai Valley. Crop J. 2015, 3, 445–450. [Google Scholar] [CrossRef]
  29. Guan, D.; Zhang, Y.; Al-Kaisi, M.M.; Wang, Q.; Zhang, M.; Li, Z. Tillage practices effect on root distribution and water use efficiency of winter wheat under rain-fed condition in the North China Plain. Soil Tillage Res. 2015, 146, 286–295. [Google Scholar] [CrossRef]
  30. Budu, M.; Atta-Darkwa, T.; Amaglo, H.; Kyei-Baffour, N.; Aidoo, I.A.; Ahorsu, S.K.; Bessah, E. The impact of tillage and weed control methods on physical properties of sandy clay loam forest ochrosol in Cassava cultivation. Appl. Environ. Soil Sci. 2022, 2022, 6758284. [Google Scholar] [CrossRef]
  31. Ramos, M.C.; Pareja-Sánchez, E.; Plaza-Bonilla, D.; Cantero-Martínez, C.; Lampurlanés, J. Soil sealing and soil water content under no-tillage and conventional tillage in irrigated corn: Effects on grain yield. Hydrol. Process. 2019, 33, 2095–2109. [Google Scholar] [CrossRef]
  32. Kroulík, M.; Hůla, J.; Šindelář, R.; Illek, F. Water infiltration into soil related to the soil tillage intensity. Soil Water Res 2007, 2, 15–24. [Google Scholar] [CrossRef]
  33. Yankov, P.; Drumeva, M. Effect of different types of soil tillage for sunflower on some soil physical characteristics. Part I: Soil moisture. Helia 2021, 44, 59–72. [Google Scholar] [CrossRef]
  34. Jin, H.; Hongwen, L.; Kuhn, N.J.; Xuemin, Z.; Wenying, L. Soil loosening on permanent raised-beds in arid northwest China. Soil Tillage Res. 2007, 97, 172–183. [Google Scholar] [CrossRef]
  35. Tudor, S.Ä.; Dážrja, M.; Hoble, A. Review for Soil with Excess Moisture. ProEnviron. Promediu 2013, 6, 495–498. [Google Scholar]
  36. Tudor, S.Ä.; Dážrja, M.; Hoble, A. Studies upon Climatic Soil Moisture Indicators. ProEnviron. Promediu 2013, 6, 503–506. [Google Scholar]
  37. Wang, X.; Zhang, Q.; Zhang, Z.; Li, W.; Liu, W.; Xiao, N.; Liu, H.; Wang, L.; Li, Z.; Ma, J.; et al. Decreased soil multifunctionality is associated with altered microbial network properties under precipitation reduction in a semiarid grassland. iMeta 2023, 2, e106. [Google Scholar] [CrossRef] [PubMed]
  38. Paltineanu, C. Soil water, solute storage and drainage in a deeply loosened, heavy-clay soil of southern Romania. Int. Agrophys. 2003, 17, 105–110. [Google Scholar]
  39. Fu, Z.G.; Du, S.P.; Liao, Y.C. Studies on tillage system of stubble mulching and subsoiling and furrow sowing on side of film mulch for dryland winter wheat in Weibei Plateau. Agric. Res. Arid Areas 2003, 21, 13–17. [Google Scholar]
  40. Lukacs, A.; Partay, G.; Farkas, C. Studying the Soil-Water-Plant Relationships on Winter Wheat Grown in Undisturbed Soil Columns. Cereal Res. Commun. 2008, 36, 479–482. [Google Scholar]
  41. Haghnazari, F.; Shahgholi, H.; Feizi, M. Factors affecting the infiltration of agricultural soils. Int. J. Agron. Agric. Res. 2015, 6, 21–35. [Google Scholar]
  42. Afzalinia, S.; Zabihi, J. Soil compaction variation during corn growing season under conservation tillage. Soil Tillage Res. 2014, 137, 1–6. [Google Scholar] [CrossRef]
  43. Xue, L.; Khan, S.; Sun, M.; Anwar, S.; Ren, A.; Gao, Z.; Lin, W.; Xue, J.; Yang, Z.; Deng, Y. Effects of tillage practices on water consumption and grain yield of dryland winter wheat under different precipitation distribution in the loess plateau of China. Soil Tillage Res. 2019, 191, 66–74. [Google Scholar] [CrossRef]
  44. Feng, Q.Q.; Han, H.F.; Zhang, Y.Y.; Xu, J.; Cao, Y.Q.; Wang, S.B.; Ning, T.Y.; Li, Z.J. Effects of tillage methods on soil carbon sequestration and water holding capacity and yield in wheat–maize rotation. J. Plant Nutr. Fertil. 2018, 24, 869–879. [Google Scholar]
  45. Shah, A.N.; Tanveer, M.; Shahzad, B.; Yang, G.; Fahad, S.; Ali, S.; Bukhari, M.A.; Tung, S.A.; Hafeez, A.; Souliyanonh, B. Soil compaction effects on soil health and cropproductivity: An overview. Environ. Sci. Pollut. Res. 2017, 24, 10056–10067. [Google Scholar] [CrossRef] [PubMed]
  46. Zhang, H.; Xue, Y.; Wang, Z.; Yang, J.; Zhang, J. Morphological and physiological traits of roots and their relationships with shoot growth in “super” rice. Field Crop. Res. 2009, 113, 31–40. [Google Scholar] [CrossRef]
  47. Birkás, M.; Szalai, T.; Gyuricza, C.; Gecse, M.; Bordas, K. Effects of the disk tillage on soil condition, crop yield and weed infestation. Rostl. Vyrob. 2002, 48, 20–26. [Google Scholar] [CrossRef]
  48. Ren, B.; Li, X.; Dong, S.; Liu, P.; Zhao, B.; Zhang, J. Soil physical properties and maize root growth under different tillage systems in the North China Plain. Crop J. 2018, 6, 669–676. [Google Scholar] [CrossRef]
Figure 1. Average monthly measured precipitation from 2018–2021, and multi-year (1981–2021) average monthly rainfall.
Agronomy 14 01606 g001
Figure 2. Study design depicting the long-term experimental at Józsefmajor Experimental and Training Farm: Below the picture is a schematic representation of treatment plots and their four replications (Source: Dekemati et al., 2019a) [18].
Agronomy 14 01606 g002
Figure 3. Wheat grain yield for the 2018 cropping season (D: disking, SC: shallow tine cultivation, NT: no-till, DC: deep tine cultivation, L: loosening, P: plowing). Bars with similar lower-case letters indicate similarities according to ANOVA and the Tukey post-hoc test at p < 0.05. Hanging bars indicate the standard deviation.
Agronomy 14 01606 g003
Figure 4. Sunflower seed yield for 2021 cropping season (D—disking, SC—shallow tine cultivation, NT—no-till, DC—deep tine cultivation, L—loosening, P—plowing. Bars with similar lower-case letters indicate similarities according to ANOVA and Tukey post-hoc test at p < 0.05. Hanging bars indicate standard deviation.
Agronomy 14 01606 g004
Figure 5. Wheat root weight for the 2018 cropping season (D: disking, SC: shallow tine cultivation, NT: no-till, DC: deep tine cultivation, L: loosening, P: plowing). Bars with similar lower-case letters indicate similarities according to ANOVA and the Tukey post-hoc test at p < 0.05. Hanging bars indicate the standard deviation.
Agronomy 14 01606 g005
Figure 6. Sunflower root weight for the 2021 cropping season (D: disking, SC: shallow tine cultivation, NT: no-till, DC: deep tine cultivation, L: loosening, P: plowing). Bars with similar lower-case letters indicate similarities according to ANOVA and Tukey’s post hoc test at p < 0.05. Hanging bars indicate the standard deviation.
Agronomy 14 01606 g006
Figure 7. Spearman correlation analysis between root weight and crop yield of 2018 cultivated wheat crop (D—disking, SC—shallow tine cultivation, NT—no-till, DC—deep tine cultivation, L—loosening, P—plowing) at significant at p < 0.05.
Agronomy 14 01606 g007
Figure 8. Correlation analysis between root weight and crop yield of 2021 cultivated sunflower crop (D—disking, SC—shallow tine cultivation, NT—no-till, DC—deep tine cultivation, L—loosening, P—plowing) at significant at p < 0.05.
Agronomy 14 01606 g008
Table 1. Experimental Activities for the 2018/19 Wheat Cropping Season and 2020/21 sunflower cropping season.
ActivityDateMethod and Equipment Used
Wheat
Basic fertilizer spreading17 September 2018NPK (20, 100, 60 kg/ha)
Foundation cultivation10 October 2018Ploughing, cultivation with cultivators
11 October 2018Loosening, discing, ploughing and processing with a disc
Breaking rolling26 October 2018
Autumn wheat sowing 258 kg/ha26 October 2018
Autumn wheat emergence10 November 2018 to 23 December 2018Ploughing: weak
Head fertilization11 February 201930 kg/ha active ingredient lime-ammonium saltpetre (27% N)
Weed killer spraying (Tangazd)3 March 2019John Deer4830 machine, Mustang Forte 1 L/ha
Fungicide spraying3 March 2019Artea, 0.5 L/ha, in 300 L of water
(John Deer 7430 + Vogel Noot Holder, 18 m)
Spraying against seed bleaching25 July 2019
Harvesting, chopping straw18 July 2018 to 19 July 2019John Deer W650/Combine rental, JD W650
Weed control after harvest25 July 2019Fozat 480 3 L/200 L water
Sunflower
Basic cultivation16 September 2020Tractor (DC, SC).
Fertilization 31 March 2021120 kg/ha 27% pétisol (GAK)
Bed making23 April 2021Power machine John Deer 7820 and Metalwolf 3.8/4.2 combiner
Sowing2021 April 23Syngenta SY ONESTAR CLP Clearfield plus, 56,000 seeds/ha. Power plant John Deer 7820, seeder KUHN Maxima 6, 12 rows on one plot, sowing depth 5–6 cm
Weed control31 March 2021Fozát 480, 6 L/ha, against Veronica (John Deer 4830, Tangazdaság);
Weed control1 June 2021Pulsar 40SL, 1.2 L/ha + Silvet Star 0.1 L/ha, also Pantera 40 EC 1.2 L/ha (Claas Arion 630 + Horsch Leeb, Tangazdaság, late, medium effect)
Plant protection spraying:
(against insects)
25 June 2021Monospel 24EW (against insects, 0.2 L/ha) + Pictor (against fungi, 0.5 L/ha, John Deer 4830, Tangazdaság)
Table 2. (A). shows wheat (2018) and sunflower (2021) general linear mixed effects model results. (B). (1a). The mean values of SMC are affected by tillage and soil depth. (1b). Mean values of SMC for wheat as affected by tillage and different soil depths. (C). (2a), Mean values of SMC for sunflower as affected by tillage and soil depth. (2b). The mean SMC for sunflowers as affected by tillage and sampling date for the 2021 cropping season. Different letters within the same row represent significant differences (p < 0.05) between tillage (lowercase) and sampling date. Different letters within the same column represent differences between soil depths and sampling dates (uppercase). *** Statistical significance at p < 0.001. ** Statistical significance at p < 0.01. * Statistical significance at p < 0.05.
(A)
Year2018/192020/21
Tillage2.2 × 10−16 ***2.2 × 10⁻¹⁶ ***
Sampling date2.2 × 10−16 ***2.2 × 10⁻¹⁶ ***
Depth2.2 × 10−16 ***2.2 × 10⁻¹⁶ ***
(B)
(1a) 2018
Depth (cm)DSCNTDCPL
0–1018.21 ± 3.38 aA17.75 ± 3.42 aA18.99 ± 2.31 aA18.25 ± 3.37 aA18.83 ± 2.44 aA17.69 ± 3.49 aA
10–2026.36 ± 2.64 cB25.45 ± 2.49 abB26.19 ± 2.64 cB25.28 ± 2.34 abB25.26 ± 1.95 abB24.81 ± 3.14 aB
20–3028.12 ± 2.13 bC27.97 ± 2.04 abC28.18 ± 1.82 bC26.93 ± 2.22 aC27.28 ± 2.22 abC26.84 ± 2.75 aC
30–4029.06 ± 1.84 abBD28.97 ± 2.08 abC29.12 ±1.62 abCD28.35 ± 2.06 abD29.20 ± 1.36 bD28.16 ± 2.37 aCD
40–5029.44 ± 1.66 abD29.09 ± 2.04 abC29.63 ± 1.47 abD29.21 ± 1.73 abD29.85 ± 1.30 bD28.84 ± 2.26 aD
50–6029.35 ± 1.60 abD28.58 ± 1.97 aC29.58 ± 1.24 bD29.32 ± 1.45 abD29.88 ± 1.19 bD29.02 ± 2.24 abD
(1b) 2018
Sampling dateDSCNTDCPL
14 March 201923.46 ± 4.73 bcA22.33 ± 4.75 abA24.53 ± 4.52 cA22.63 ± 4.52 abcA24.75 ± 4.51 cA21.27 ± 4.73 aA
11 April 201925.81 ± 3.67 aB26.33 ± 3.36 aB25.84 ± 3.49 aAB26.74 ± 2.58 aB25.84 ± 2.95 aAB25.96 ± 3.19 aB
3 June 201928.23 ± 2.97 bBC27.04 ± 4.26 abBC27.32 ± 3.91 abBC26.46 ± 3.91 abB27.19 ± 4.30 abBC26.12 ± 3.78 aB
28 June 201927.52 ± 5.46 aC27.29 ± 5.08 aBC28.27 ± 4.64 aC27.00 ± 5.27 aB27.36 ± 4.88 aBC27.65 ± 5.07 aBC
15 August 201928.74 ± 3.59 aC28.52 ± 3.16 aC28.79 ± 3.14 aC28.27 ± 3.42 aB28.46 ± 3.46 aC28.46 ± 3.49 aC
(C)
(2a) 2021
Depth (cm)DSCNTDCPL
0–1017.48 ± 1.38 abA17.33 ± 1.80 abA18.10 ± 1.73 cA16.59 ± 2.02 bA15.52 ± 2.16 aA16.99 ± 1.81 bA
10–2025.70 ± 1.57 bB25.32 ± 1.86 bB25.73 ± 1.63 bB24.93 ± 1.72 bB23.76 ± 2.03 aB24.90 ± 1.61 bB
20–3027.07 ± 1.30 bcC27.01 ± 1.43 bcC27.15 ± 1.41 cC26.89 ± 1.32 abcC26.26 ± 1.27 aBC26.40 ± 1.38 abC
30–4027.90 ± 1.10 abD27.96 ± 1.19 abD28.08 ± 1.16 bD27.98 ± 1.10 abD27.47 ± 1.11 aCD27.75 ± 1.10 abD
40–5028.32 ± 0.89 bD28.20 ± 0.91 bD28.49 ± 0.94 bD24.56 ± 0.87 bD24.56 ± 9.21 aD28.36 ± 0.89 bD
50–6027.95 ± 0.60 aD27.85 ± 0.75 aD28.09 ± 0.75 aD28.21 ± 0.69 aD27.87 ± 0.81 aD28.20 ± 0.67 aD
(2b) 2021
Sampling dateDSCNTDCPL
9 September 202026.65 ± 4.23 bB26.43 ± 4.13 bB26.90 ± 4.01 bB26.68 ± 4.32 bB22.37 ± 9.25 aA26.60 ± 4.05 bB
23 October 202026.54 ± 3.67 aB26.36 ± 3.92 aB26.36 ± 3.85 aB25.61 ± 4.78 aAB24.89 ± 4.84 aA25.68 ± 4.41 aAB
17 November 202025.80 ± 3.89 aA26.25 ± 3.64 aB25.93 ± 3.56 aB25.41 ± 4.40 aAB24.94 ± 4.69 aA25.44 ± 4.09 aAB
16 March 202124.22 ± 4.27 aA23.63 ± 4.56 aA23.94 ± 4.26 aA23.85 ± 4.69 aA23.24 ± 4.47 aA23.91 ± 4.59 aA
24 April 202125.25 ± 3.65 aAB25.16 ± 3.69 aAB26.37 ± 3.18 aB25.76 ± 3.50 aAB24.77 ± 3.84 aA25.27 ± 3.50 aAB
Disclaimer/Publisher’s Note: The statements, opinions and data contained in all publications are solely those of the individual author(s) and contributor(s) and not of MDPI and/or the editor(s). MDPI and/or the editor(s) disclaim responsibility for any injury to people or property resulting from any ideas, methods, instructions or products referred to in the content.

