Article

Nitrogen and Potassium Application Effects on Grain-Filling and Rice Quality in Different Japonica Rice Cultivars

by
Liqiang Chen
1,2,
Jiping Gao
1,*,
Wenzhong Zhang
1,*,
Hongfang Jiang
1,
Ya Liu
1,
Bingchun Yan
1 and
Xue Wan
1
1
Rice Research Institute, Agronomy College, Shenyang Agricultural University, Shenyang 110866, China
2
School of Agriculture, Liaodong University, Dandong 118001, China
*
Authors to whom correspondence should be addressed.
Agronomy 2024, 14(8), 1629; https://doi.org/10.3390/agronomy14081629
Submission received: 28 May 2024 / Revised: 24 July 2024 / Accepted: 25 July 2024 / Published: 25 July 2024
(This article belongs to the Section Plant-Crop Biology and Biochemistry)

Abstract

:
Northeast China is an important commercial grain base for China, but also the largest japonica rice production area. However, N, and K fertilizer application and unreasonable application times are prominent contradictions that restrict the development of japonica rice. This study aimed to investigate how to rationally apply N and K fertilizers to affect grain filling and ultimately increase the quality of the rice. In this field study, two N application levels and three K application ratios were set in 2020 and 2021 using Shennong 265 (SN265) and Meifengdao 61 (MF61). We found that the final seed growth and filling rate of SN265 were higher than those of MF61, and their filling characteristics were slow in the early stage and fast in the later stage, with large fluctuations. Appropriate reductions and increases of N and K fertilizer applications, respectively, in the early stage could improve grain filling. Compared with SN265, MF61 had a 3.2% increase in head rice rate, lower amylose and protein content, a decrease of chalkiness degree and chalkiness percentage by 23.96 and 34.00%, respectively, and more reasonable protein components. With the N application increase, the processing quality improved, the amylose and protein content and chalkiness increased, the protein components increased except for the milled rice glutelin, and the rice taste value decreased. At low N levels, increasing the proportion of K application was consistent with the effect of increasing N. The taste value of SN265 decreased linearly with the increase in the ratio of N application to pre-application of K, the highest taste value was obtained when the N fertilizer was applied at a rate of 180 kg ha−1, and the ratio of before and after K fertilizer application was about 1:2. The taste value of MF61 decreased linearly with the N application increase and showed a trend of increasing and then decreasing with the K application increase in the early stage. The taste peak gradually shifted back with the N application increase, and the highest taste value was obtained when N fertilizer was applied at 180 kg ha−1; the ratio of before and after K fertilizer application was about 3:2. By constructing the grain-filling quality evaluation system, the characteristic parameters of superior and inferior grains at the early and late stages of grain filling, respectively, greatly affected the rice taste value. Additionally, the percentage of the rice grain weight at the maximum grain-filling rate to the final rice grain weight (I) of superior grains, glutelin content, and value of the RVA profile characteristics were all critical reference indicators for rice taste quality.

1. Introduction

With the continuous improvement of China’s national economy and consumer habit changes, there is an increased demand for higher quality rice [1]. The production of rice has moved from a focus on increasing yields to the synergy of quantity and quality. The status of Northeast japonica rice is pivotal in China as it is valued throughout the country for its excellent taste [2]. Recently, with the rise in fertilizer prices, farmers commonly use cheaper N fertilizers as the main exogenous nutrient input to their rice fields, improving economic returns but destroying soil nutrients and leading to a yearly decline in rice quality. Therefore, balanced N fertilization is a key issue in rice cultivation today. Uptake of K in rice is second only to N and plays a very important role in yield and quality [3,4]. Supplementation of K at the spike stage notably reduces chalkiness and straight-chain starch content, improving rice quality [5].
Grain-filling is closely related to quality, and there are important differences in grouting dynamics between superior and inferior grains of different cultivars [6]. Inferior grain germination is inhibited by the middle and upper grains, resulting in a decrease in overall quality [7]. The processing quality, appearance, and nutritional quality of rice at different spike levels can be affected by the timing of filling [8]. There is a substantial relationship between the head rice rate and grain-filling dynamics; that is, the filling rate in the first and middle stages is negatively correlated with the whole-finish rice rate, while the filling rate in the later stages is positively correlated with this rate [9]. Additionally, amylose content is notably and positively correlated with the onset of grain-filling potential, and the filling rate, filling volume, and contribution of different filling stages all have different degrees of influence on the quality index [10].
At present, Northeast japonica rice often has low grain quality due to poor filling of vulnerable grains, which has become a bottleneck limiting its further quality improvement [11]. Increased application of N and K can substantially promote and prolong the active period of seed filling, but their excess use can lead to a decrease in filling rate [12]. Therefore, it is important to study how to coordinate the effects of N and K rationing on filling rate and quality in Northeast japonica rice. Moreover, research into the relationship between the filling dynamics and quality of different japonica rice cultivars is valuable to determine more suitable N and K application ratios so that the strategic goal of sustainable development, with improvements in quality and efficiency, can be achieved. This study aimed to evaluate the correlation between filling dynamics and quality of the different cultivars, and to determine appropriate N and K application ratios. This was achieved through a two-year field trial in Shenyang, China, using a light and efficient cultivation method with two japonica rice cultivars and with different N application rates and pre- and post-K application ratios.

2. Materials and Methods

2.1. Experimental Site Descriptions

Field experiments were conducted on a farm at Shenyang Agricultural University (41°49′ N, 123°34′ E) during the rice-growing season (June to October) in 2020 and 2021. The site was located within the main high-yielding rice region of the Liaohe River basin, which has a temperate, semi-humid, continental climate. The daily mean temperatures, precipitation, relative humidity, and total sunshine hours during the growing seasons in 2020 and 2021 are provided (Table S1). The soil type is brown loam with moderate fertility. The total N, available P, available K, organic matter, and pH in 0–20 cm of soil was 1.0 g kg−1, 34.2 mg kg−1, 107.5 mg kg−1, 24.5 g kg−1, and 7.03, respectively.

2.2. Experimental Design and Crop Management

The test cultivars were Shennong 265 (SN265) and Meifengdao 61 (MF61). SN265 is a medium maturity cultivar with a total of 15 leaves on the main stem; it is 103.0 cm tall, compact, strong tillering, and has an upright spike type. MF61 is a medium to early maturing cultivar with a total of 14 leaves on the main stem; it is 109.0 cm tall, compact, slightly strong tillering, and a curved spike type. The differences in N uptake and utilization rates between the two at conventional fertilizer application rates (225.0 kg N ha−1, 112.5 kg K2O ha−1) reached significant levels, but the differences in K uptake and utilization efficiency were not significant.
A randomized group design was used to set two N levels and three K ratios: K fertilizer pre- and post-application ratio of 3:7 under low N conditions (LNK1); K fertilizer pre- and post-application ratio of 5:5 under low N conditions (LNK2); K fertilizer pre- and post-application ratio of 7:3 under low N conditions (LNK3); K fertilizer pre- and post- application ratio of 3:7 under high N conditions (HNK1); K fertilizer pre- and post-application ratio of 5:5 under high N conditions (HNK2); and K fertilizer pre- and post-application ratio of 7:3 under high N conditions (HNK3). The amount of pure nitrogen was 180 and 270 kg ha−1 under low and high N conditions, respectively. The amount of pure K fertilizer was the same as the amount of pure P fertilizer in all treatments—112.5 kg ha−1. N fertilizer was applied three times—base, tiller, and spike fertilizers at 36, 24, and 40%, respectively, and K fertilizer was applied twice—base and spike fertilizers were applied one day before transplanting, at 60% leaf age, and at 80% leaf age, respectively. The N, K, and P fertilizers were 46.0% urea, 50.0% potassium sulfate, and 12.0% calcium superphosphate, respectively.
In the 2020 trial, the seeds were sown on 24 April, the seedlings were insulated and dried, transplanted manually on 22 May, and harvested on 8 October. In the 2021 trial, the seeds were sown on 21 April, the seedlings were insulated and dried, transplanted manually on 29 May, and harvested on 7 October. The leaf age at transplanting was four leaves and one heart, and the transplanting size was 30.0 × 13.3 cm with two seedlings per hole. PVC dividers (40.0 cm in height, 1.5 mm in thickness, 25.0 cm in depth) were used between plots to prevent water and fertilizer cascading. Each plot was single-rowed and single-irrigated, and the water layer, sunning, weeding, and pest protection were the same as conventional field management.

2.3. Data Collection

2.3.1. Sampling and Grain-Filling Parameters

In 2020 and 2021, rice spikes of roughly the same size—5.0 cm from the top of the spike to the rachis sheath—were selected and marked with a tag. Two-hundred spikes were marked in each plot, and fifteen spikes were taken every five days from flowering to maturity.
The Richards growth equation [13,14] was used to calculate the grain-filling parameters to simulate the seed grouting process, and the corresponding grain-filling characteristic parameters were derived using the method of Zhu et al. [15]. The growth analysis of grain filling was performed using the average of two years to fit the equation with the fitting formula:
W = A ( 1 + B exp kt ) 1 / N
where W is the weight of rice grains (mg), A is the final growth (mg), t is the time after flowering (d), and B, K, and N are equation parameters. A second equation (Equation (2)), derived by taking the first derivative of Equation (1), was used to estimate the effective grain-filling duration and kernel growth rate:
G = d W d t = A k B exp k t N ( 1 + B exp k t ) N + 1 N

2.3.2. Photosynthetic Gas Exchange Measurements and Related Enzyme Activities

The flag leaf and top 2nd leaf net photosynthetic rate (Pn), transpiration rate (Tr), stomatal conductance (Gs), intercellular CO2 concentration (Ci), vapor pressure deficit (VPD), and water use efficiency (WUE) were measured using a portable infrared gas analyzer (CIRAS-3, PP Systems, Amesbury, MA, USA) at the booting, full heading, and filling stages. Photosynthesizer parameters were recorded at a photosynthetic photon flux density of 1200 μmol·m−2·s−1 from an internal light source in the leaf chamber in which the relative humidity was 60%, CO2 concentration was 400 μmol·mol−1, and leaf temperature was 25 °C [16]. All parameters were measured on eight individual plants per treatment between 9:00 and 11:00 h [17]. The RuBPcase was measured at the booting, full heading, and filling stages in the flag leaf and top 2nd leaf using the method of Li et al. [18].

2.3.3. Determination of Rice-Related Quality Indexes

The seeds were threshed and naturally dried and then stored in a cool, ventilated, and dry place for 3 months for grain quality measurement. Milling quality, including brown rice, milled rice, and head milled rice rates were measured according to the GB/T 17891-1999 standard [19]. The amylose and protein content of brown rice was measured using a Foss 1241 near-infrared grain analyzer (Infratec TM 1241, FOSS, Hillerød, Denmark). The protein component was determined according to Luthe and Liu [20,21], based on Bradford’s BCA protein quantification method. Pasting properties of rice flour were measured using a rapid viscosity analyzer (RVA-TecMaster, Perten, Hägersten, Sweden) according to the American Society for Cereal Chemistry Operating Procedures [22]. The RVA spectrum characteristic value was represented by peak viscosity (PKV), hot paste viscosity (HPV), cool paste viscosity (CPV), breakdown viscosity (BDV = PKV − HPV), and setback viscosity (SBV = CPV − PKV) [23]. The rice grain taste quality was measured using the STA1A rice taste meter (SATAKE, Saitama, Japan). Milled rice (30 g) was rinsed until the water became clear, and then soaked in a stainless-steel tank for 30 min. Water was added in a ratio of 1:1.2 (rice:water); the rice was put in a steamer to cook for 40 min and cooled for 1 h 50 min, and a taste meter was used to measure appearance, hardness, viscosity, balance degree, and taste value. The process was repeated thrice for each sample.

2.3.4. Statistical Analysis

For experimental variables, a three-way ANOVA was applied to assess differences among treatments with SPSS 22.0 software (Softonic International, Barcelona, Spain). Significant differences (p < 0.05) between treatments are indicated by different letters according to Fisher’s LSD. Graphs were drawn with the Origin 2021 software (OriginLab, Northampton, MA, USA).

3. Results

3.1. Grain-Filling Characteristics

The fitted coefficients of determination were all >0.99 and reached a highly significant level by simulating the effect of N and K rationing on the weight gain of superior and inferior grains of different japonica rice cultivars through the Richards simulation curve (Figure 1). This shows that this curve can simulate the grain-filling process well, and the fitted curves of the grain-filling process all demonstrated a “fast-slow-calm” growth trend.
The superior grains of SN265 had the fastest growth rate and the greatest final growth at the LNK3 level, followed by LNK1 and LNK2. The difference in the proportion of K applied before and after the HN treatment had less of an effect on the weight gain of the superior grains, both of which were lower than in the LN treatment. The weight gain pattern of the inferior grains was the same as that of the superior grains, but the difference between the treatments was not significant. The superior grains of MF61 had the largest final weight of seeds at the LNK2 level, but the difference in the growth rate between the different N levels was small, and the pattern of different K application ratios was K2 > K1 > K3. The difference in the inferior grains was more obvious—under the LN treatment they finished grubbing first, whereas under the HN treatment they took longer to grub. Overall, the final growth of SN265 was greater than that of MF61, and the effects of N and K rationing were not consistent for the two cultivars.
Table 1 lists the grain-filling characteristic parameters of each treatment calculated according to the Richards model, and Figure 2 shows the simulation curve of the grain-filling rate. SN265 had the highest filling rate of superior grains of K3; these were the highest under LN conditions, and its Tmax, D, and T99 were the smallest among all the superior grains of this cultivar, while GRmax, GRmean, and Wmax were the largest. The next was K3 and K2 under HN conditions, and the differences among the other treatments were small. For K1 under LN conditions, both cultivars had the largest Tmax, but T99 was smaller, indicating that grain-filling was slower in the early stage and faster in the later stage. Among the inferior grains, LNK1 had the largest GRmax, followed by HNK2 (mean value of the two cultivars), and the difference between the other treatments was small. The GRmax, GRmean, and other indices of the superior grain-filling rate in MF61 showed little difference, while R0 and I had large differences in their values. It is noteworthy that the grain-filling rate curves of the inferior grains of LNK1 and HNK1 (mean value of the two cultivars) were different from those of other treatments. The Tmax of LNK1 was the smallest, GRmax and GRmean were the largest, and Tmax and T99 of HNK1 were the largest. In general, the grain-filling rate under LN and HN conditions had its advantages and disadvantages, and the indices of SN265 were better than those of MF61. With the increase in the proportion of K fertilizer applied before and after N treatment, the filling rate of inferior grains of SN265 increased, while that of MF61 decreased. The grain-filling rates of the two cultivars were not significantly different under different N levels.
Table 2 shows the grain-filling rate variation between different cultivars occurred during the middle stage of grain-filling. The duration of filling days, MGR, and RGC of SN265 were higher than those of MF61, but the difference between the early and late stages was small. Under LN conditions, the Days and MGR of the middle and late grains of superior grains were higher than those under HN conditions. The number of filling days of inferior grains in each period was less than that of the HN condition, but the MGR and RGC were higher than that of the HN condition in the early and middle stages of filling. However, the indices of the HN condition were higher than those of the LN condition in the late stage of filling. With the proportion of K application increase pre- and post-N treatment, MGR of SN265 increased gradually, while the Days and RGC of MF61 at the late stage decreased gradually. The performance of the cultivars under different N levels was different, and the pattern of each index was also different, indicating that the effect of the ratio of K fertilizer before and after application on grain filling is complex, and in need of further research.

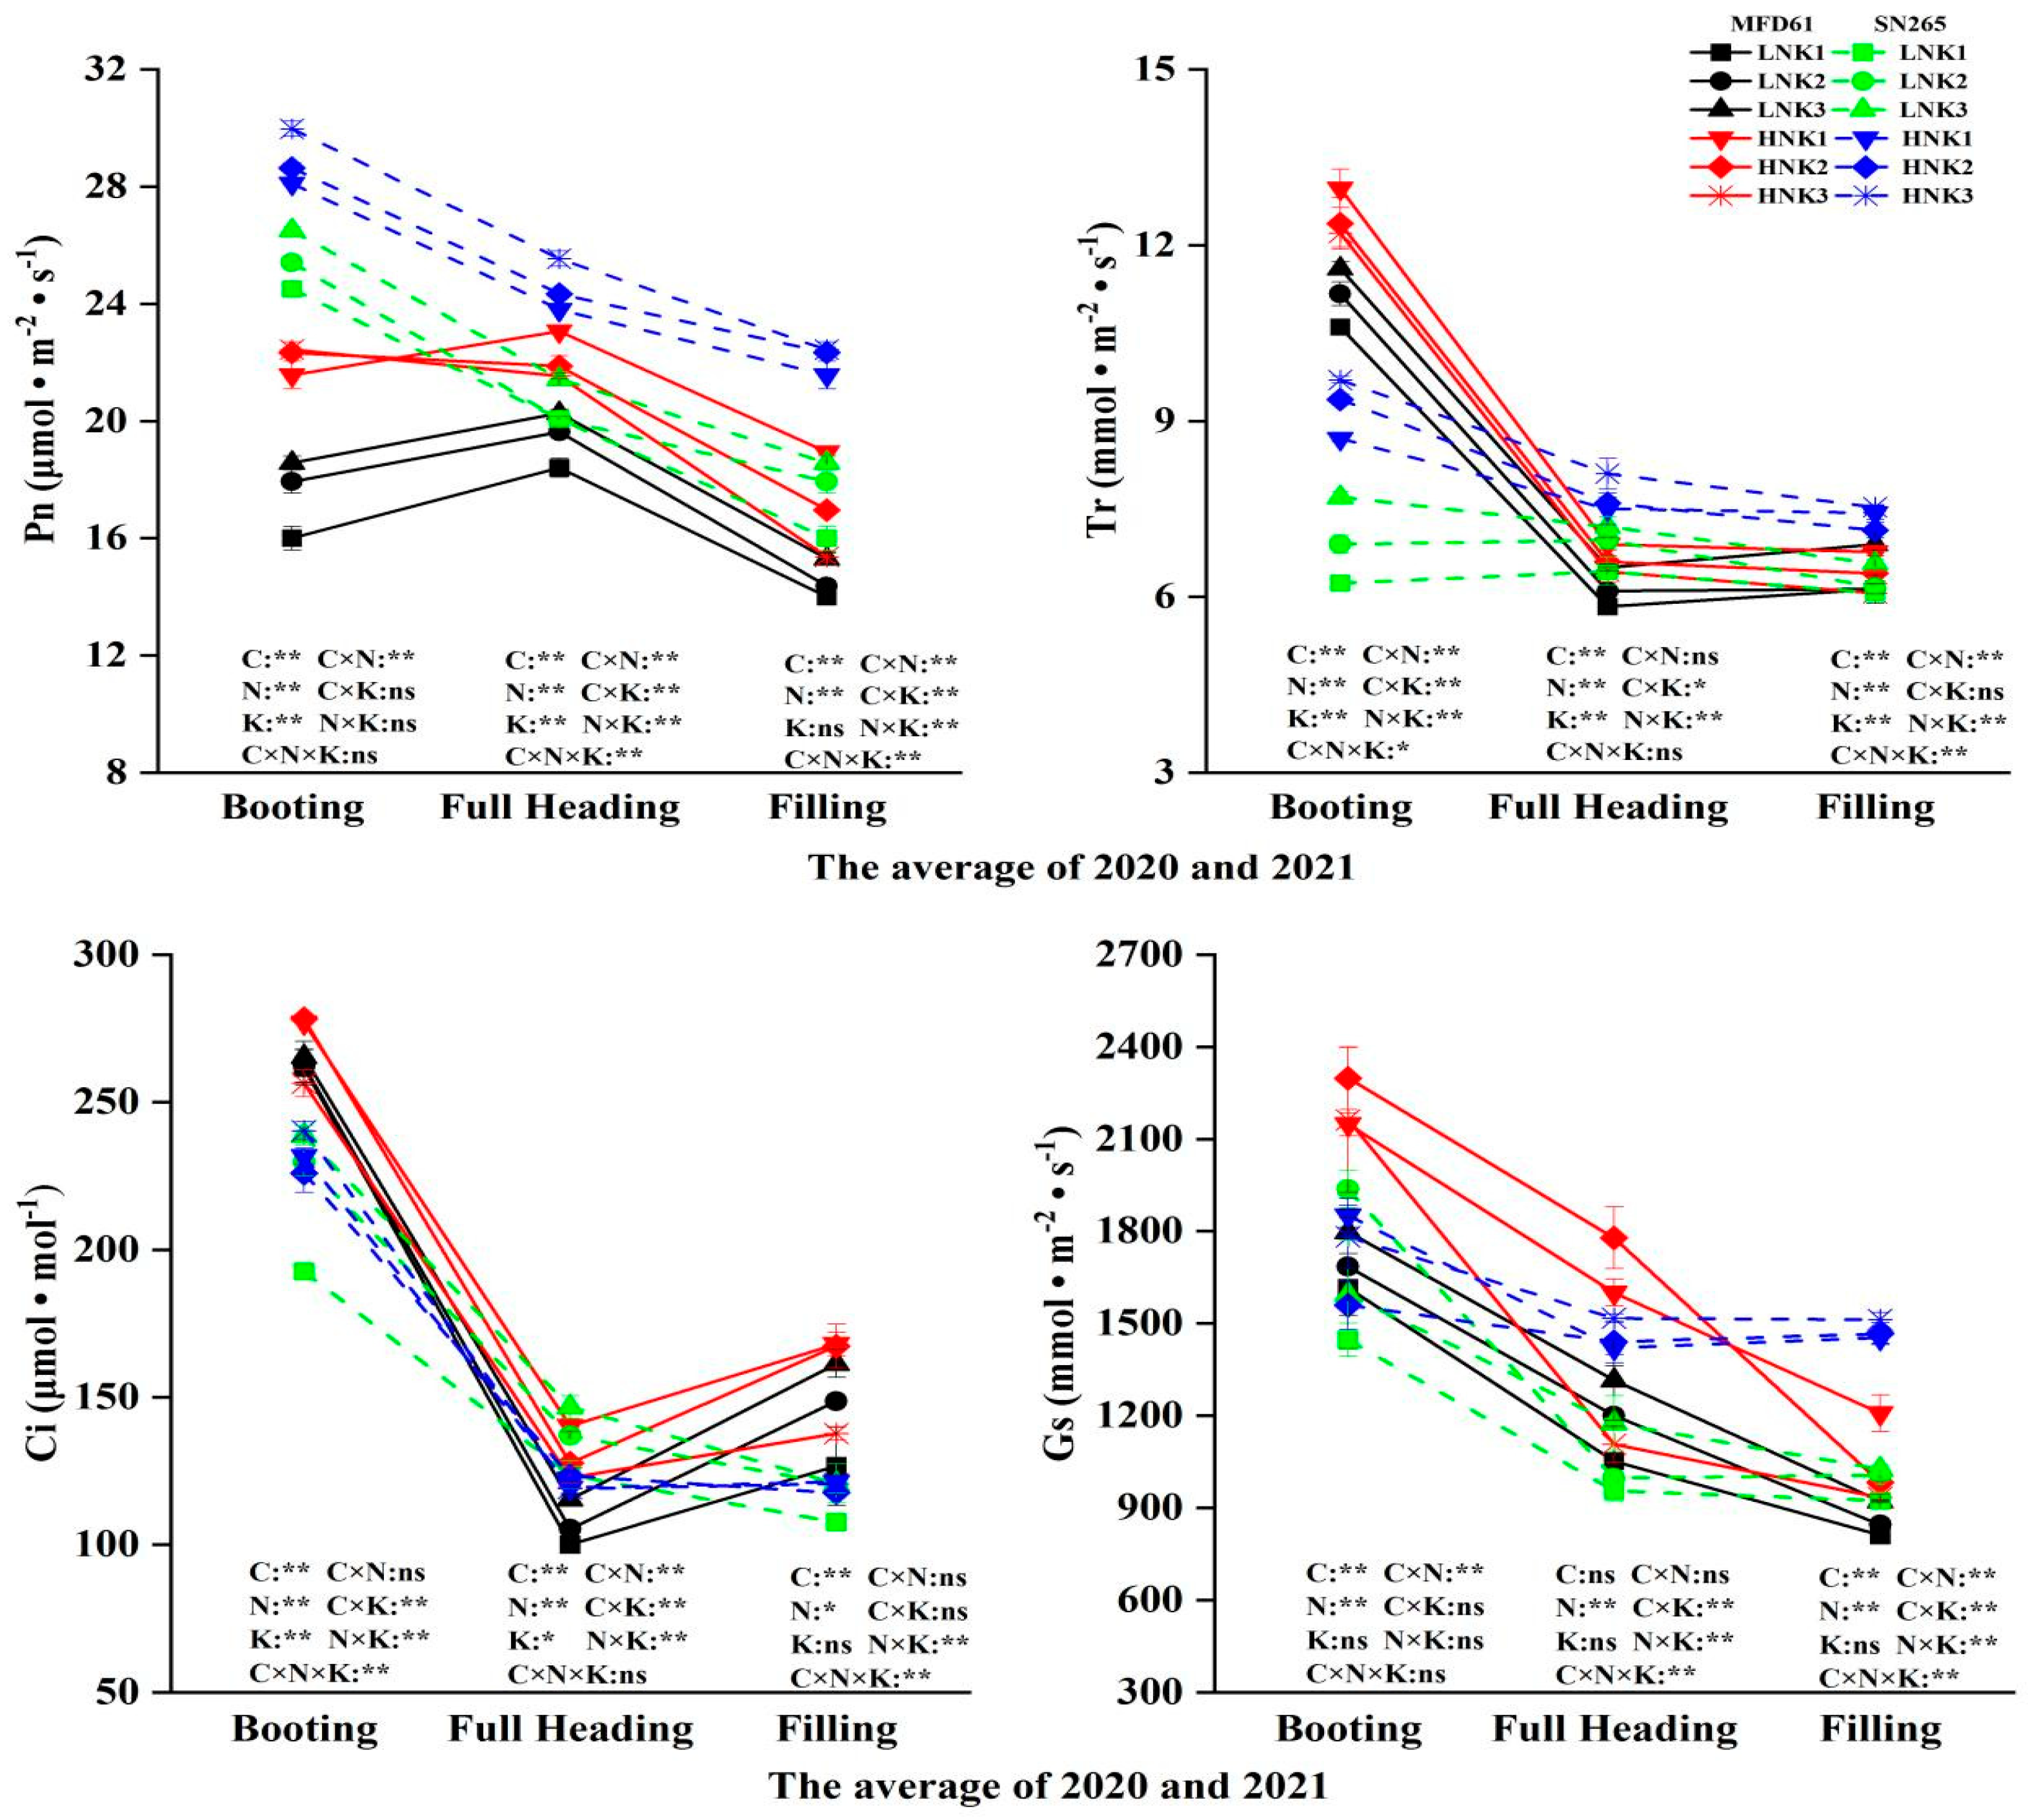
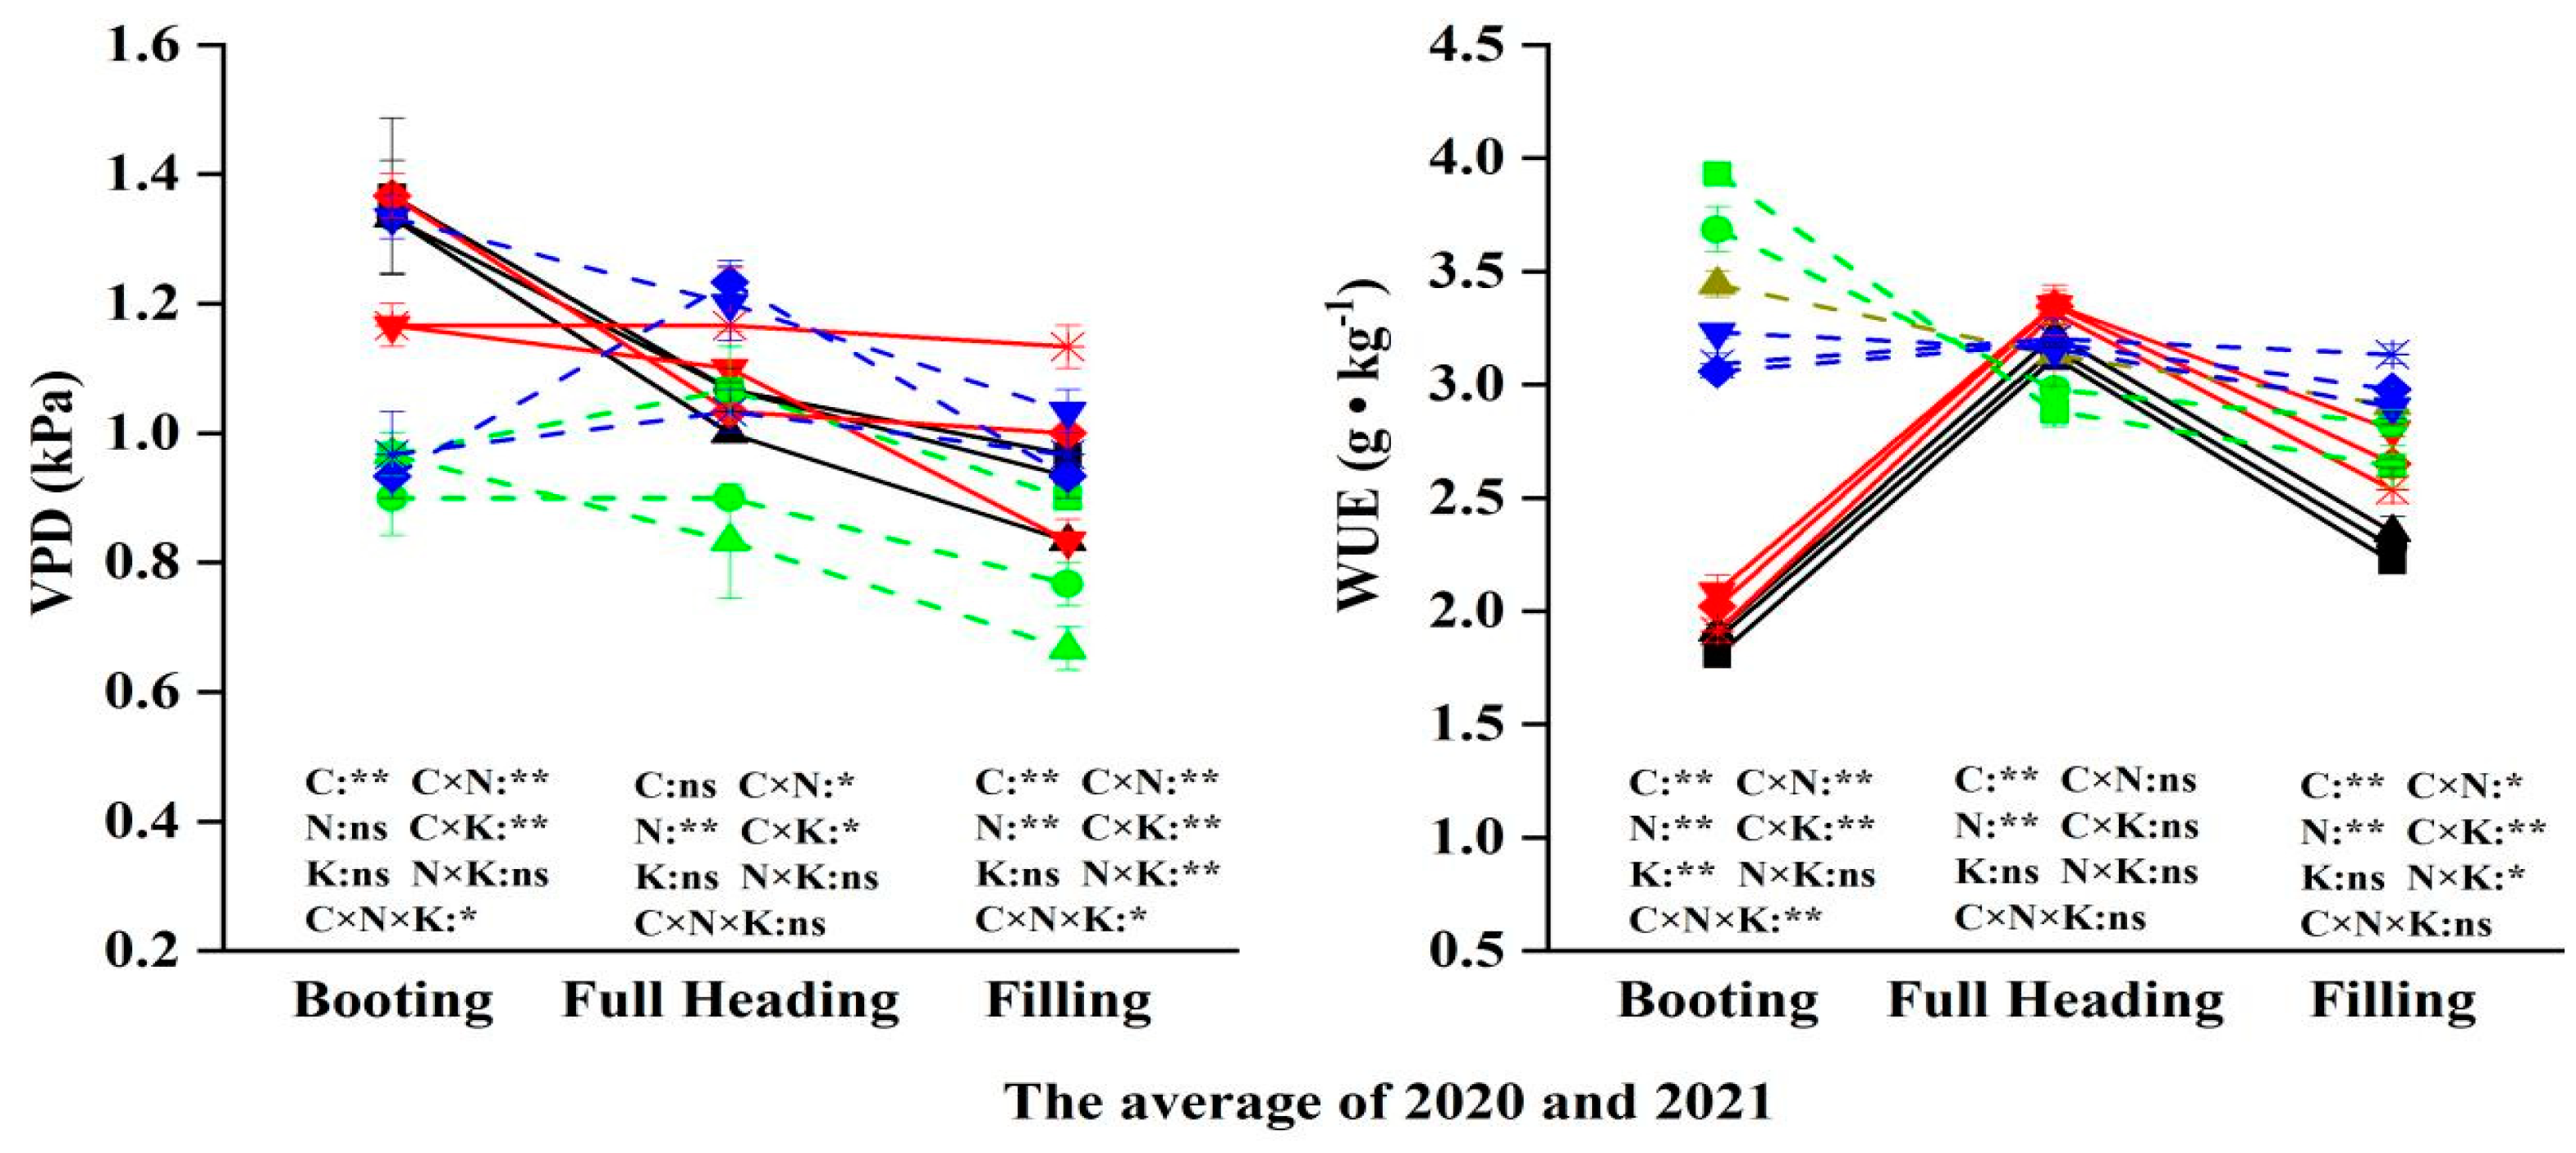
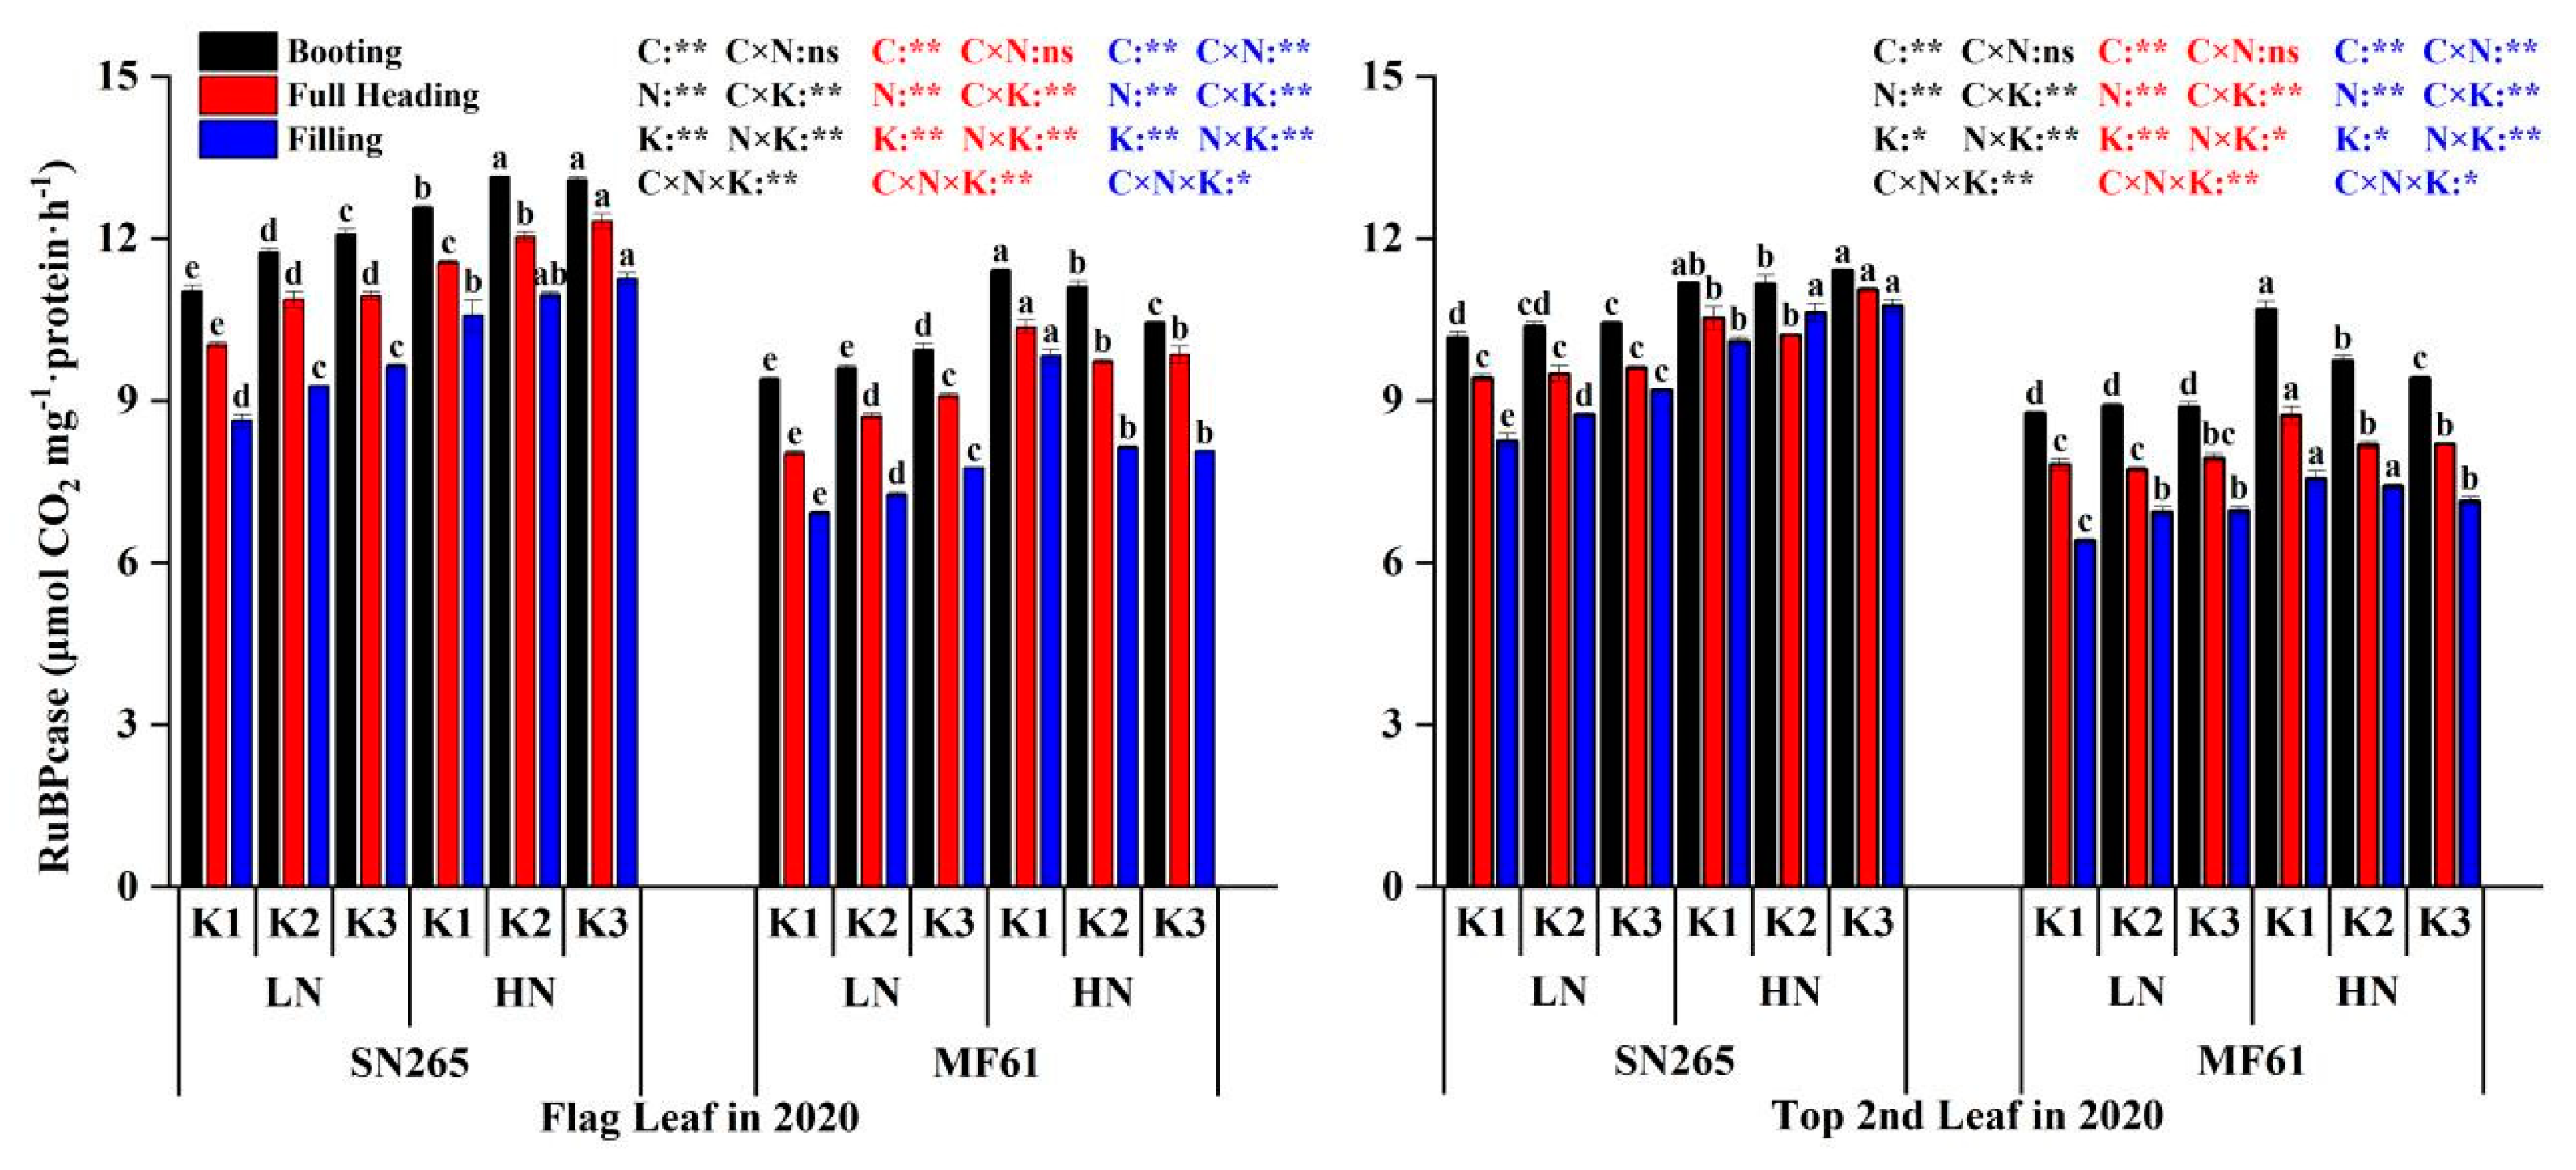
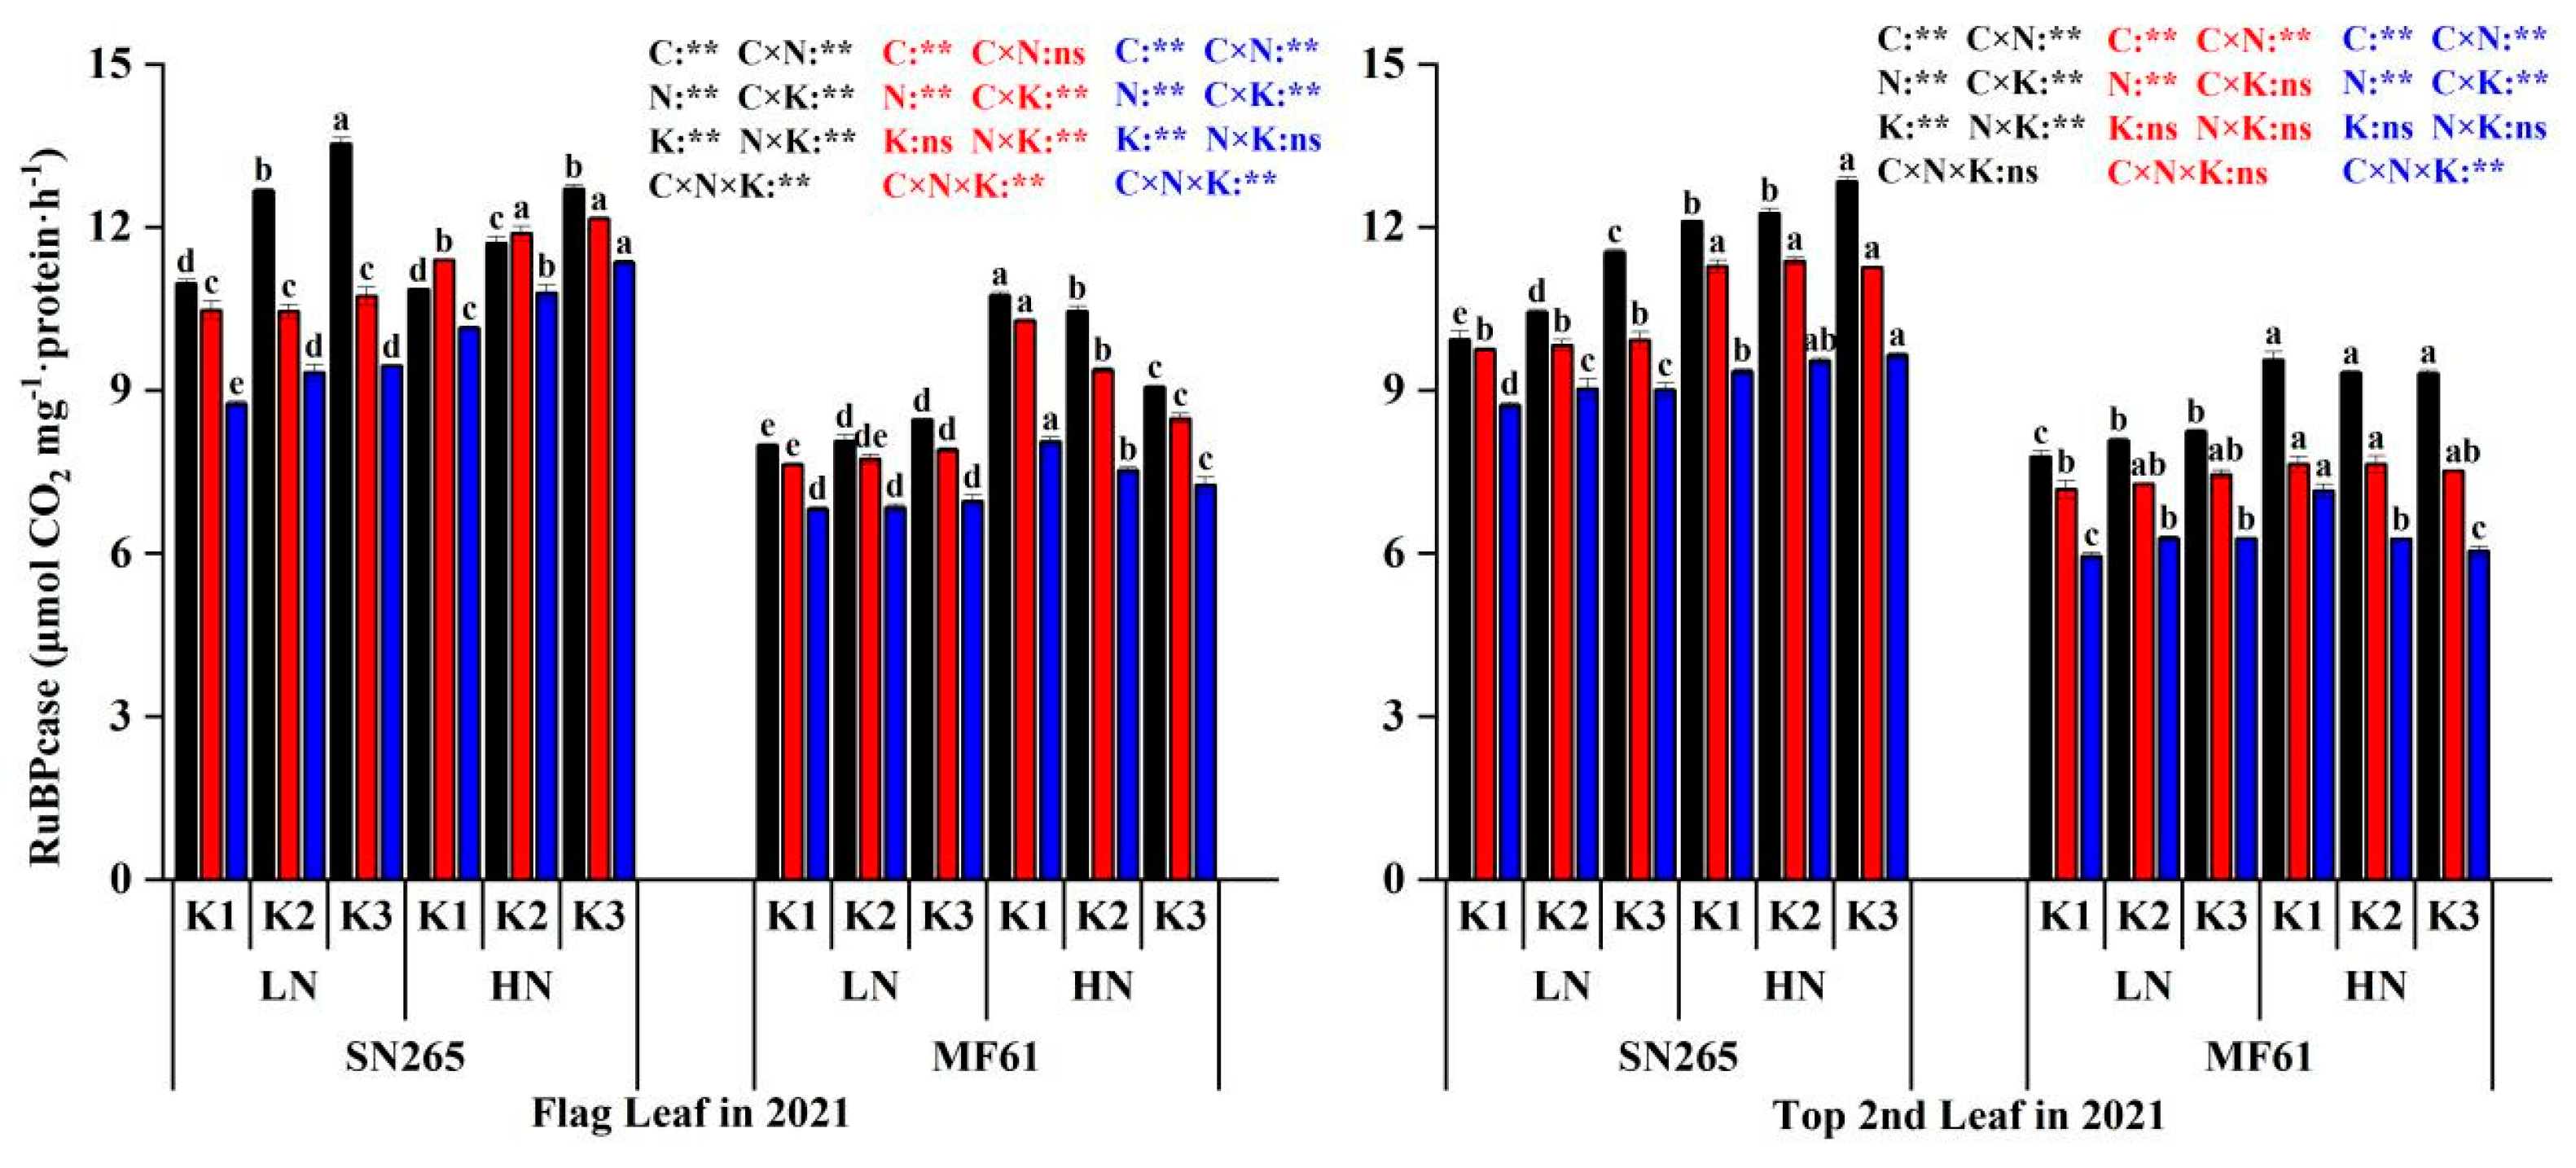
3.2. N- and K-Rationing Effects on Photosynthetic Characteristics and RuBPcase Activity of Different Cultivars

Pn and WUE of SN265 were significantly higher than those of MF61 at the booting stage, while Tr, Ci, Gs, and VPD were significantly lower (Figure 3). Pn, Ci, and Tr were significantly increased and WUE was significantly decreased under HN. With an increase in the proportions of K fertilizer application, Pn, Tr, and Ci increased significantly, while WUE decreased significantly. The interactions between Pn, Tr, Gs, VPD, WUE indicators, cultivars, and N application were highly significant; the interactions between Tr, Ci, VPD, WUE indicators, cultivars, and K application rate reached a significant level; the interactions between Tr and Ci indicators and N and K allocation reached a highly significant level; and the interactions between Tr, Ci, VPN, and WUE reached a significant level.
At the full heading stage, Pn and Tr of SN265 were significantly higher than those of MF61 by 8.39 and 14.16%, respectively, and Ci and WUE were significantly lower than those of MF61 by 8.11 and 5.25%, respectively. Under HN conditions, the pattern was the same as that at the full heading stage, except for WUE. Excepting WUE, the pattern of K operation was the same as that at the booting stage. However, it is noteworthy that the pattern of K operation under HN of MF61 was contrary to the overall pattern. In this period, an increase in N fertilizer increased Pn, Tr, Ci, and Gs of different cultivars by 4.09–20.48%, and K3 increased Pn, Tr, Ci, and VPD by 3.91–32.50%. The interaction of Pn, Ci, and VPD indicators between cultivars and N application reached significant levels; the interaction between Pn, Tr, Ci, Gs, and VPD indicators, cultivars, and K application reached a significant level; the interaction between Pn, Tr, Ci, and Gs and N and K allocation reached a significant level; and the three-factor interaction between Pn and Gs reached a significant level.
The regularity of cultivars and N application at the filling stage was consistent with that at the full head stage. However, the pattern of K fertilizer operation was different from that of the previous two periods. Only the difference in Tr reached a very significant level, while all other photosynthetic rate indices were not significant. The reason for this is that MF61 under HN conditions presents the opposite situation to the overall pattern, which is more influential than the full head stage. However, this phenomenon requires further exploration.
The RuBPcase activity of SN265 was significantly higher than that of MF61 at the booting, full head, and filling stages, and the trend was consistent over the two years (Figure 4). As the growth process advanced, the RuBPcase activity of the flag leaf and the top 2nd leaf decreased gradually, and the activity of the flag leaf was higher than that of the top 2nd leaf. The RuBPcase activity of the SN265 top 2nd leaf was less volatile and more stable during the reproductive growth period. Increasing N application significantly increased RuBPcase activity, which showed a significant increase in SN265 as the percentage of K pre-application increased. Combining the data of the two years, the increase in RuBPcase activity of the flag leaf was greater than that of the top 2nd leaf, and the pattern was more consistent at LN levels of the K application rate, while the pattern of RuBPcase activity of MF61 at HN levels was opposite, with an increase of K pre-application rate, a gradual decrease in RuBPcase activity, and the decrease was greater in the top 2nd leaf.

3.3. N- and K-Rationing Effects on the Processing Quality of Different Cultivars

The milled and head rice rates were affected by interannual variation and the amount of N applied, both reaching highly significant levels (Table 3). The processing quality of SN265 was significantly affected by the rate of K application, whereas that of MF61 was not significantly affected. The trends in brown, milled, and head rice rates were the same for each treatment in both years. Under different treatments, the brown and milled rice rates of SN265 were 4.25 and 4.11% higher than those of MF61, respectively, but the head rice rate was slightly lower (2.71%). From the analysis of the N transport, the brown, milled, and head rice rates showed a gradual increase with the increase in N application, and the trend was consistent for both cultivars. In terms of the K transport, both cultivars showed the same pattern of processing quality at low N levels, with a gradual increase in brown, milled, and head rice rates as the percentage of K pre-application increased: K3 > K2 > K1, with significant differences. At HN levels, the pattern was reversed for the two cultivars, with SN265 having the same level of N application as the others and MF61 having the opposite pattern: K3 < K2 < K1, indicating that the processing quality of MF61 was more affected by N and K rationing. The interactions between N and K were not significant for the processing quality (except the head rice rate) of SN265. The interactions between N and K reached highly significant levels for the processing quality of MF61, and the differences between the three factors of the head rice rate of the two cultivars reached significant levels.

3.4. N- and K-Application Effects on Cultivar Appearance and Nutritional Quality

Appearance and nutritional quality were affected by the environment and N application at significant or highly significant levels (Table 4). The trends in amylose and protein content, chalkiness degree, and chalkiness percentage of the treatments were similar between the two years, with fewer fluctuations in amylose and protein content and more changes in chalkiness degree and chalkiness percentage, with 1.62 and 42.10% higher amylose content and chalkiness percentage in 2020 than in 2021, respectively. Under different treatments, the amylose content, protein content, chalkiness degree, and chalkiness percentage of SN265 were 1.16, 2.93 23.78, and 34.00% higher than those of MF61, respectively. From the N transport analysis, amylose and protein content, chalkiness degree, and chalkiness percentage showed a gradual increase with increasing N application, and the trend was consistent for both cultivars. From the K transport analysis, the amylose and protein content, chalkiness degree, and chalkiness percentage showed a gradual increase in the K pre-application percentage, and the pattern of the two cultivars was not consistent at the HN level. The trend of amylose and protein content and chalkiness percentage of MF61 was inversely proportional to the increased K pre-application proportion: K1 < K2 < K3. N-K interactions reached significant levels for chalkiness degree and chalkiness percentage of SN265, and N-K interactions reached highly significant levels for all appearance and nutritional quality indicators of MF61. Only the interactions between chalkiness degree and chalkiness percentage of MF61 in the three-factor interactions reached highly significant levels.

3.5. N- and K-Rationing Effects on Different Cultivar Protein Components

The protein content was significantly affected by the environment and N and K rationing (Table 5). The trends of the treatment protein fractions were similar between the two years, with 24.25, 22.92, 17.33, and 14.94% higher levels of albumin, globlulin, prolamin, and glutenin, respectively, in 2020 than those in 2021. Under different treatments, SN265 had 36.28 and 42.00% higher clear protein and globulin, and 3.82 and 5.81% lower alcoholic protein and glutenin, respectively, than the low-NUE cultivar. From the N transport analysis, an increase in N application led to a gradually increasing trend of albumin, globlulin, and prolamin, consistent for the two cultivars, while glutenin showed a gradually decreasing trend, not consistent for the two cultivars. In terms of K transport, both cultivars showed the same pattern at LN levels for albumin, globlulin, and prolamin, with a gradual increase in the K pre-application proportion: K3 > K2 > K1, while the glutenin pattern was opposite with significant differences. At HN levels, the albumin, globlulin, and prolamin patterns of the two cultivars showed opposite trends, the pattern of SN265 was the same as the LN level, whereas the pattern of MF61 was K3 < K2 < K1, and the glutenin was opposite to the trends of the other three protein components.

3.6. N- and K-Rationing Effects on the Eigenvalues of Starch RVA Spectra of Different Cultivars

The characteristic values of starch RVA spectra of SN265 were affected by inter-annual variation and N-K rationing to highly significant levels (Table 6). The RVA trends were generally consistent across treatments between the two years. From the N transport analysis, peak, hot paste viscosity, and breakdown viscosity decreased with the N application increase. The cool paste viscosity, setback viscosity, and peak time showed an increasing trend, while the effect of different N applications on pasting temperature was small and the difference was not significant. In terms of K transport, peak and hot paste viscosity were significantly negatively correlated with the increase in the K pre-application percentage: K3 < K2 < K1 and were significantly positively correlated with each other: K3 > K2 > K1. The cool paste and setback viscosity were positively correlated with the K pre-application ratio increase: K3 > K2 > K1, while peak time tended to increase and then decrease, with the highest value at K2; however, the breakdown viscosity effect was not significant.
The eigenvalues of the starch RVA spectra of MF61 were more influenced by inter-annual variation and N-K rationing, and the trend of these eigenvalues of the treatments was similar between the two years (Table 7). From the N transport analysis, peak viscosity, hot paste viscosity, and peak time decreased with an increase in N application, while cool paste viscosity, setback viscosity, and pasting temperature showed an increasing trend. The N application effect on breakdown viscosity decreased and then increased, though the difference was not significant. In terms of K transport, peak viscosity and hot paste viscosity decreased as the K pre-application proportion increased: K3 < K2 < K1, and setback viscosity increased: K3 > K2 > K1. Cool paste viscosity, breakdown viscosity, peak time, and pasting temperature showed an increasing and then decreasing trend, with the highest value at K2, though the differences did not reach a significant level. The two- and three-factor interaction of N and K reached a significant and highly significant level, respectively, except for cool paste viscosity, breakdown viscosity, and peak time.

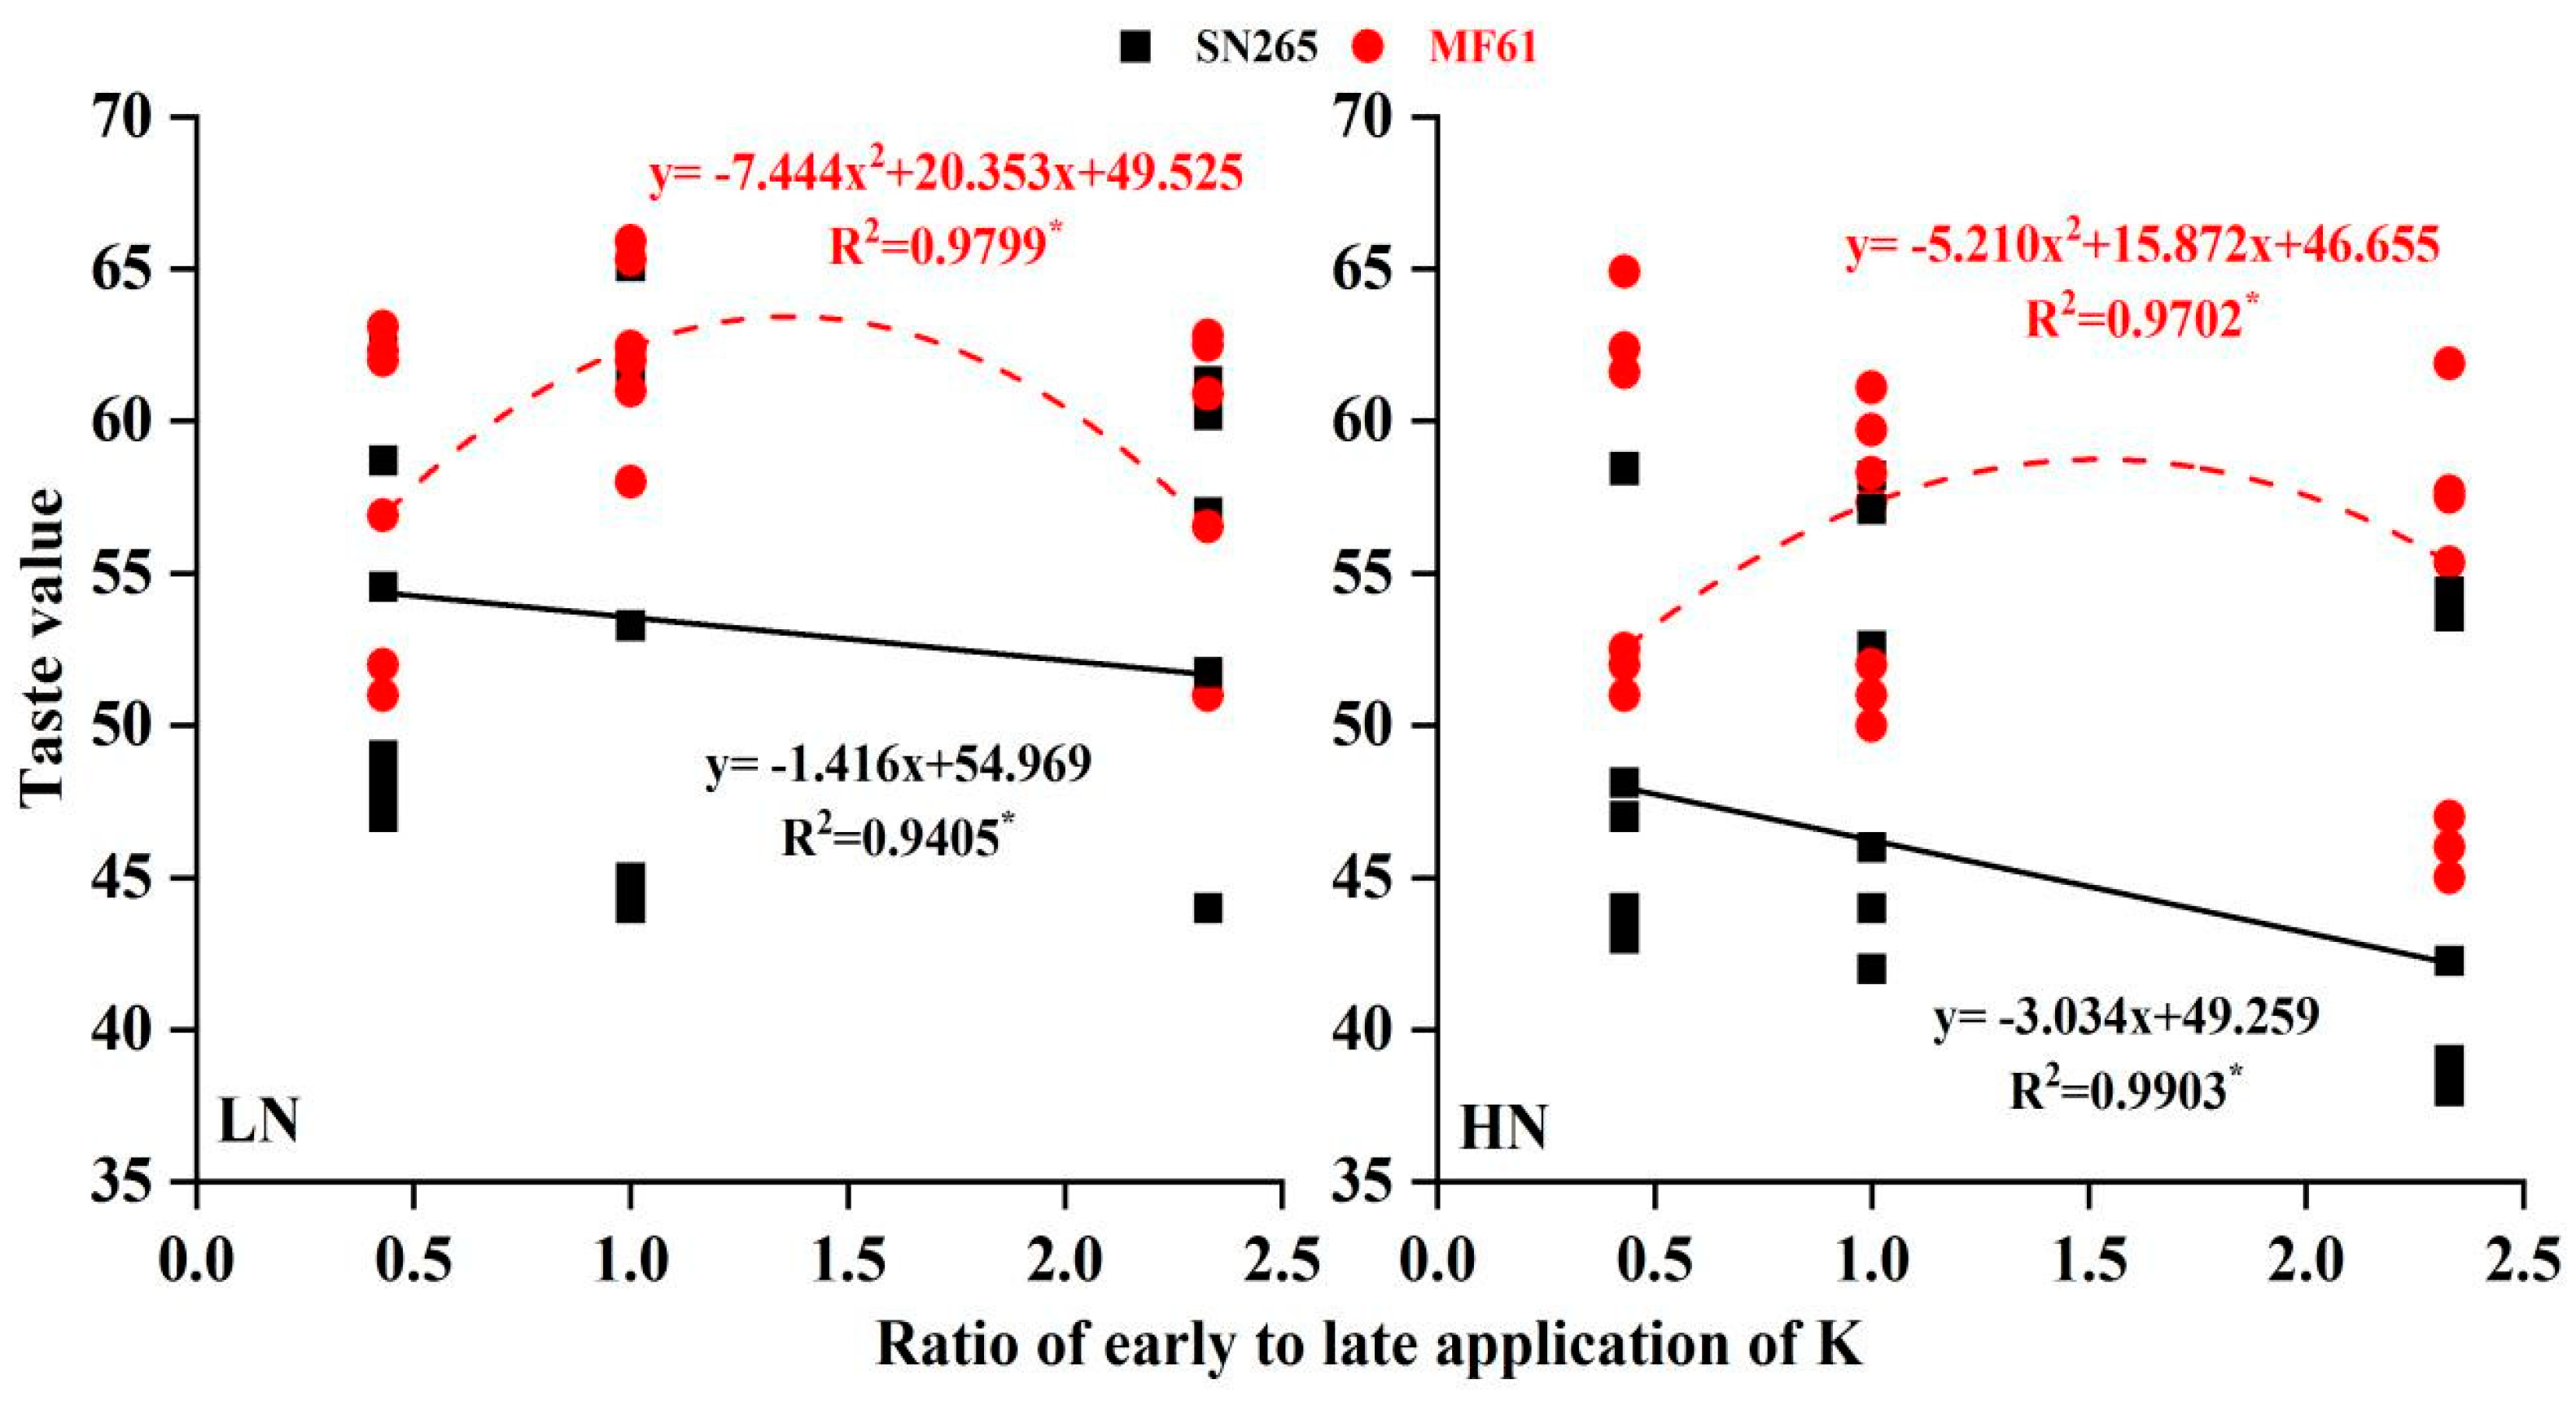
3.7. N- and K-Allocation Relationships and Taste Value of Different Cultivars

The relationship between N and K rationing and the taste value of two cultivars is shown in Figure 5. The dietary value of SN265 was negatively correlated with the ratio of K pre-application, that is, the higher the K application in the early stage, the lower the dietary value. However, under the LN condition, the taste value decreased slightly, and the fitting equation was y = −1.416x + 54.969. Under HN, it decreased significantly, and the fitting equation was y = −3.034x + 49.259. The fitting equations were all linear with one variable, and R2 reached a significant level. The taste value of MF61 with increasing K fertilizer pre-application ratio showed a trend of first increasing and then decreasing, that is, with the ratio increase of K fertilizer application in the early stage, the taste value increased, and then began to decline after reaching the optimal ratio. Under LN, the optimal ratio before and after K fertilizer application was <6:4, whereas under HN, the optimal ratio was >6:4, and the peak value of taste showed an obvious backward shift. The fitting equation for the LN condition was y = −7.444x2 + 20.353x + 49.525, R2 = 0.9799, and the highest value of tasting appeared at 63.44 when the K fertilizer pre-application ratio was 1.37. Under the HN condition, the fitting equation was y = −5.210x2 + 15.872x + 46.622, R2 = 0.9702. The highest taste value appeared at 58.74 when the K fertilizer pre-application ratio was 1.52.

4. Discussion

4.1. N- and K-Application Effects on Photosynthetic Characteristics and Grain-Filling Rates of Different Cultivars

Rice grain filling is the most important physiological process for grain formation, and a decisive stage for rice yield and quality, which has always been a concern for cultivators [24]. N is the most critical factor influencing grain filling, regulating the photosynthetic characteristics of rice, as well as the filling rate of superior and inferior grains, to promote grain maturation [25]. Yang [26] found that the N transport mode promoted enzyme activity, and thus the grain-filling weight of rice at the late filling stage. The effects of N on the filling rate have been correlated with yield, but the effect of K rationing on grain-filling is a neglected research area. K application can increase the grain-filling rate of wheat [27] and buckwheat [28], prolong the effective filling period, increase GRmean, and shorten the time to reach GRmax. Fertilizer application during panicle growth in rice can change R0 and T99, which in turn promotes grain filling [29]. The results here showed that SN265 had higher rapier and inverted dichotomous RuBP carboxylase activities at both the booting and filling stages, enhancing the ability to reduce CO2, and improving the net photosynthetic rate and other indicators, so that the grains had sufficient material assurance at the filling stage. N and K application had different grain-filling effects on different N-use efficiency japonica rice cultivars. SN265 increased GRmax and GRmean of superior grains and shortened the filling time by increasing the proportion of K pre-application. The K proportion increase applied later in the stage increased R0, GRmax, and GRmean of the inferior grains. The difference in the K application percentage in MF61 had a smaller and less regular effect on each index of superior grains, while the effect on inferior grains was more pronounced.

4.2. N- and K-Application Effects on the Quality of Different Cultivars

Rice quality is influenced not only by genetic factors but also by the environment. Among the environmental factors involved, fertilization has a huge impact on rice quality [30,31,32]. Increasing N application (0–350 kg ha−1) improves the processing quality of rice and has the greatest effect on rice head formation rates [33,34,35]. However, the present results on N fertilization effects on the appearance and nutritional quality of rice differ, indicating that different cultivars respond differently to the formation of starch, protein, and chalkiness under the action of different N concentrations [36,37,38]. N application reduces the taste value, possibly due to a significant positive correlation between N and protein accumulation, and because increased protein leads to harder rice, which in turn reduces its taste value [39]. Rice grain protein is subdivided into four protein fractions according to their solubility, among which prolamin and glutelin have a relatively large impact on quality [38]. K application has less effect on processing quality and more significant changes in appearance quality, improving rice quality by increasing gelatinous consistency and decreasing amylose content, whereas excessive K fertilization could increase protein content and thus affect taste quality [40,41]. The present study showed that the appearance and nutritional quality of MF61 were better than those of SN265. An increase in the K proportion applied in the first stage improved processing quality at LN levels, whereas, in the second stage, it reduced amylose and protein content, as well as chalkiness degree and chalkiness percentage at LN levels, improved the ratio of protein components (relatively low prolamin and relatively high glutelin), increased peak viscosity, and thus improved the taste value. Differences in K application ratios had different effects on the taste values of the two cultivars with those of SN265 decreasing with increasing N application and K pre-application, with the greatest decrease at HN levels. The peak taste value of MF61 gradually shifted back with increasing N- and K-application ratios, that is, K pre- and post-application ratios <6:4 at LN levels and K pre- and post-application ratios >6:4 at HN levels both enhanced taste value.

4.3. N- and K-Allocation Relationship on Grain-Filling Rates and Quality of Different Cultivars

Rice quality is closely related to the grain-filling process [42]. Generally, processing quality is good if the filling time is long and the grains are full and tight; processing quality is poor if the filling time is short and the grains are full and loose. Zhao [8] proposed that superior and inferior grains with notable filling differences had considerable differences in processing, appearance, and cooking quality, indicating that superior grains were better than inferior grains. Chalkiness is usually reduced if the grain-filling rate is smooth, and increased if the grain-filling rate fluctuates [7,43]. The present study showed that the filling rate had a notable effect on rice quality, and the effect of each index of superior and inferior grains differed for different qualities [44]. We can draw some conclusions from the main findings: processing, appearance, nutritional quality, and superior grain-filling rate, are closely related; the superior grain-filling rate is fast, especially the filling rate in the middle and late stages, which can improve the processing quality but increase the content of protein and amylose. R0, D, and T99 of superior grains have a strong influence on hot and cool paste viscosity, and pasting temperature, in the RVA characteristic spectrum of starch. The I, RGC, and MGR of the superior grains, the RGC and MGR of the early stage, and the characteristic values of the late stage of the inferior grains all greatly influenced the taste value. Interestingly, the effect of glutelin, peak viscosity, breakdown viscosity, and peak time on the taste value was also more notable.

5. Conclusions

N and K allocation optimized RuBPcase activity in the upper two leaves of SN265 at the booting and filling stages, keeping it stable and providing a sufficient material basis for filling. SN265 is characterized by slow filling in the early stage and fast filling in the late stage, with large fluctuations. Appropriate reduction of nitrogen application coupled with increased application of K fertilizer in the early stage can improve grain-filling. Reducing the K proportion applied in the early stage can improve the filling of inferior grains of MF61. Compared with SN265, MF61 had a higher head rice rate, better appearance and nutritional quality, and more reasonable protein content. With the N application increase, the processing quality improved, the appearance and nutritional quality decreased, the protein content increased (except for glutelin), and the taste value decreased. Under LN conditions, increasing the K pre-application rate was consistent with the effect of increasing N. The taste value of SN265 decreased linearly with the increase in the ratio of N application to K pre-application. The taste value of MF61 decreased linearly with the N application increase and showed a trend of increasing and then decreasing with the K pre-application ratio increase, and the taste value peak gradually shifted back with the N application increase.
The analysis of the 57 indicators that showed the N- and K-rationing effect on japonica rice with different cultivars using principal component and cluster analysis showed that the early characteristics of strong grains and the late characteristics of weak grains greatly influenced the taste value of rice, Additionally, the I of superior grains, the glutelin in milled rice, and the characteristic value of starch RVA spectrum were all extremely important reference indicators for the taste value.

Supplementary Materials

The following supporting information can be downloaded at: https://www.mdpi.com/article/10.3390/agronomy14081629/s1, Table S1. Average temperature, average relative humidity, total sunshine hours, and rainfall during the rice growth period (2020–2021). Figure S1. PCA principal component scattered point diagram. Figure S2. R-type and Q-type clustering. 34 indicators of grain-filling characteristics and 23 indicators related to rice quality were analyzed by R-type clustering and 12 treatments of the experimental setup were analyzed by Q-type clustering.

Author Contributions

W.Z. and J.G. designed the study and provided experimental materials. H.J. and Y.L. performed the determination of protein components. B.Y., X.W. and L.C. performed the determination of quality-related indicators. L.C. and H.J. analyzed the results and prepared the figures and tables. L.C. wrote the paper. All authors discussed the results and commented on the manuscript. All authors have read and agreed to the published version of the manuscript.

Funding

This study was supported by the National Key R&D Program of China (2023YFD2301603); Natural Science Foundation of Liaoning Province Joint Fund (2023-BSBA-161); LiaoNing Revitalization Talents Program, China (No. XLYC2007169).

Data Availability Statement

Data are contained within the article or supplementary material.

Conflicts of Interest

The authors declare no conflicts of interest.

References

  1. Zeng, Y.; Tan, X.; Zeng, Y.; Zheng, Y.; Xie, X.; Pan, X.; Shi, Q.; Zhang, J. Changes in the rice grain quality of different high-quality rice varieties released in southern China from 2007 to 2017. J. Cereal Sci. 2019, 87, 111–116. [Google Scholar] [CrossRef]
  2. Jia, Y.; Liu, H.; Mei, Y.; Wang, H.; Zou, D.; Wang, J.; Zheng, H.; Wang, J.; Zhang, H.; Zhao, H. Analysis of Gaps Yield and Resource use Efficiency of Cold-Region Japonica Rice. Int. J. Plant Prod. 2022, 17, 17–33. [Google Scholar] [CrossRef]
  3. Wood, M.; Dunn, B.; Balindong, J.; Waters, D.; Blanchard, J.; Mawson, A.; Oli, P. Effect of agronomic management on rice grain quality Part II: Nitrogen rate and timing. Cereal Chem. 2021, 98, 234–248. [Google Scholar] [CrossRef]
  4. Zhou, C.; Huang, Y.; Jia, B.; Wang, Y.; Wang, Y.; Xu, Q.; Li, R.; Wang, S.; Dou, F. Effects of cultivar, nitrogen rate, and planting density on rice-grain quality. Agronomy 2018, 8, 246. [Google Scholar] [CrossRef]
  5. Atapattu, A.; Prasantha, R.; Amaratunga, K.; Marambe, B. Increased rate of potassium fertilizer at the time of heading enhances the quality of direct seeded rice. Chem. Biol. Technol. Agric. 2018, 5, 22. [Google Scholar] [CrossRef]
  6. Xue, J.; Chen, S.; Du, X.; Pan, G.; Wang, Y. Grain-filling Characteristics of Two Different panicle Type Rice Cultivars in Heilongjiang Province. Agric. Sci. Technol. 2016, 17, 301–308. [Google Scholar] [CrossRef]
  7. Chen, Y.; Teng, Z.; Yuan, Y.; Yi, Z.; Zheng, Q.; Yu, H.; LV, J.; Wang, Y.; Duan, M.; Zhang, J.; et al. Excessive nitrogen in field-grown rice suppresses grain filling of inferior spikelets by reducing the accumulation of cytokinin and auxin. Field Crops Res. 2022, 283, 108542. [Google Scholar] [CrossRef]
  8. Zhao, C.; Liu, G.; Chen, Y.; Jiang, Y.; Shi, Y.; Zhao, L.; Liao, P.; Wang, W.; Xu, K.; Dai, Q.; et al. Excessive nitrogen application leads to lower rice yield and grain quality by inhibiting the grain filling of inferior grains. Agriculture 2022, 12, 962. [Google Scholar] [CrossRef]
  9. Liu, Z.; Gao, J.; Gao, F.; Dong, S.; Liu, P.; Zhao, B.; Zhang, J. Integrated agronomic practices management improve yield and nitrogen balance in double cropping of winter wheat-summer maize. Field Crops Res. 2018, 221, 196–206. [Google Scholar] [CrossRef]
  10. Yu, N.; Ren, B.; Zhao, B.; Liu, P.; Zhang, J. Effects of nitrogen application rate on grain filling characteristics and nutritional quality of summer maize. J. Appl. Ecol. 2019, 30, 3771–3776. [Google Scholar] [CrossRef]
  11. Zheng, E.; Zhang, C.; Qi, Z.; Zhang, Z. The effects of different water and nitrogen methods on fluorescence characteristic and growth of rice in black soil region on songnen plain, northeast China. Agric. Res. 2021, 10, 665–674. [Google Scholar] [CrossRef]
  12. Sun, Y.; Wu, Y.; Sun, Y.; Luo, Y.; Guo, C.; Li, B.; Li, F.; Xing, M.; Yang, Z.; Ma, J. Effects of Water and Nitrogen on Grain Filling Characteristics, Canopy Microclimate with Chalkiness of Directly Seeded Rice. Agriculture 2022, 12, 122. [Google Scholar] [CrossRef]
  13. Richards, F. A flexible growth function for empirical use. J. Exp. Bot. 1959, 10, 290–301. [Google Scholar] [CrossRef]
  14. Zhu, Q.; Cao, X.; Luo, Y. Growth analysis on the process of grain filling in rice. Acta Agron. Sin. 1988, 14, 182–193. [Google Scholar]
  15. Perdomo J, A.; Capó-Bauçà, S.; Carmo-Silva, E.; Galmés, J. Rubisco and rubisco activase play an important role in the biochemical limitations of photosynthesis in rice, wheat, and maize under high temperature and water deficit. Front. Plant Sci. 2017, 8, 490. [Google Scholar] [CrossRef]
  16. Pandey, V.; Shukla, A. Acclimation and tolerance strategies of rice under drought stress. Rice Sci. 2015, 22, 147–161. [Google Scholar] [CrossRef]
  17. Li, X.; Li, Z.; Xie, Y.; Wang, B.; Kuai, J.; Zhou, G. An improvement in oilseed rape Brassica napus L. productivity through optimization of rice-straw quantity and plant density. Field Crops Res. 2021, 273, 108290. [Google Scholar] [CrossRef]
  18. Nelson, D.; Sommers, L. Total nitrogen analysis of soil and plant tissues. J. Assoc. Off. Anal. Chem. 1980, 63, 770–778. [Google Scholar] [CrossRef]
  19. Fan, M.; Wang, X.; Sun, J.; Zhang, Q.; Xu, Z.; Xu, Q. Effect of indica pedigree on eating and cooking quality in rice backcross inbred lines of indica and japonica crosses. Breed. Sci. 2017, 67, 450–458. [Google Scholar] [CrossRef]
  20. Luthe, D. Storage protein accumulation in developing rice Oryza sativa L. seeds. Plant Sci. Lett. 1983, 32, 147–158. [Google Scholar] [CrossRef]
  21. Liu, Z.; Cheng, F.; Cheng, W.; Zhang, G. Positional variations in phytic acid and protein content within a panicle of japonica rice. J. Cereal Sci. 2005, 41, 297–303. [Google Scholar] [CrossRef]
  22. Champagne, E.; Bett, K.; Vinyard, B.; McClung, A.; Barton, F.; Moldenhauer, K.; Linscombe, S.; Mckenzie, K. Correlation between cooked rice texture and rapid visco analyser measurements. Cereal Chem. 1999, 76, 764–771. [Google Scholar] [CrossRef]
  23. Cao, X.; Sun, H.; Wang, C.; Wang, C.; Ren, X.; Liu, H.; Zhang, Z. Effects of late-stage nitrogen fertilizer application on the starch structure and cooking quality of rice. J. Sci. Food Agric. 2018, 98, 2332–2340. [Google Scholar] [CrossRef] [PubMed]
  24. Kato, T.; Takeda, K. Associations among characters related to yield sink capacity in space-planted rice. Crop Sci. 1996, 36, 1135–1139. [Google Scholar] [CrossRef]
  25. Ren, H.; Zhao, M.; Zhou, B.; Zhou, W.; Li, K.; Qi, H.; Jiang, Y.; Li, C. Understanding physiological mechanisms of variation in grain filling of maize under high planting density and varying nitrogen applicate rate. Front. Nutr. 2022, 9, 998946. [Google Scholar] [CrossRef] [PubMed]
  26. Zhang, J.; Zhang, Y.; Song, N.; Chen, Q.; Sun, H.; Peng, T.; Huang, S.; Zhao, Q. Response of grain-filling rate and grain quality of mid-season indica rice to nitrogen application. J. Integr. Agric. 2021, 6, 1465–1473. [Google Scholar] [CrossRef]
  27. Gong, Y.; Lei, Y.; Zhang, X.; Yan, B.; Ju, X.; Cheng, X. Nitrogen rate and plant density interaction enhances grain yield by regulating the grain distribution of secondary branches on the panicle axis and photosynthesis in japonica rice. Photosynthetica 2022, 60, 179–189. [Google Scholar] [CrossRef]
  28. Yang, J.; Zhang, J. Grain-filling problem in ‘super’ rice. J. Exp. Bot. 2010, 61, 1–5. [Google Scholar] [CrossRef]
  29. Wang, R.; Zhang, X.; Wu, L.; Wang, R.; Xiao, S. QTL mapping for grain filling rate and thousand-grain weight in different ecological environments in wheat. Acta Agron. Sin. 2008, 34, 1750–1756. [Google Scholar] [CrossRef]
  30. Wu, X.; Zhang, Y.; He, P.; Huang, X.; Huang, K. Effect of different tillage methods on senescence and grain filling characteristics of tartary buckwheat. Zemdirb.-Agric. 2020, 4, 301–308. [Google Scholar] [CrossRef]
  31. Jiang, Q.; Du, Y.; Tian, X.; Wang, Q.; Xiong, R.; Xu, G.; Yan, C.; Ding, Y. Effect of panicle nitrogen on grain filling characteristics of high-yielding rice cultivars. Eur. J. Agron. 2016, 74, 185–192. [Google Scholar] [CrossRef]
  32. Liu, X.; Li, M.; Guo, P.; Zhang, Z. Optimization of water and fertilizer coupling system based on rice grain quality. Agric. Water Manag. 2019, 221, 34–46. [Google Scholar] [CrossRef]
  33. Bian, J.; Xu, F.; Han, C.; Qiu, S.; Ge, J.; Xu, J.; Zhang, H.; Wei, H. Effects of planting methods on yield and quality of different types of japonica rice in northern Jiangsu plain, China. J. Integr. Agric. 2018, 17, 2624–2635. [Google Scholar] [CrossRef]
  34. Yang, D.; Peng, S.; Zheng, C.; Xiang, H.; Huang, J.; Cui, K.; Wang, F. Effects of nitrogen fertilization for bud initiation and tiller growth on yield and quality of rice ratoon crop in central China. Field Crops Res. 2021, 272, 108286. [Google Scholar] [CrossRef]
  35. Xiong, F.; Wang, Z.; Gu, Y.; Chen, G.; Zhou, P. Effects of nitrogen application time on caryopsis development and grain quality of rice variety Yangdao 6. Rice Sci. 2008, 15, 57–62. [Google Scholar] [CrossRef]
  36. Zhang, J.; Tong, T.; Potcho, P.; Huang, S.; Ma, L.; Tang, X. Nitrogen effects on yield, quality and physiological characteristics of giant rice. Agronomy 2020, 10, 1816. [Google Scholar] [CrossRef]
  37. Hu, Y.; Cong, S.; Zhang, H. Comparison of the grain quality and starch physicochemical properties between japonica rice cultivars with different contents of amylose, as affected by nitrogen fertilization. Agriculture 2021, 11, 616. [Google Scholar] [CrossRef]
  38. Shi, S.; Zhang, G.; Chen, L.; Zhang, W.; Wang, X.; Pan, K.; Li, L.; Wang, J.; Liu, J.; Cao, C.; et al. Different nitrogen fertilizer application in the field affects the morphology and structure of protein and starch in rice during cooking. Food Res. Int. 2023, 163, 112193. [Google Scholar] [CrossRef] [PubMed]
  39. Lan, Y.; Sui, X.; Wang, J.; Duan, Q.; Wu, C.; Ding, C.; Li, T. Effects of nitrogen application rate on protein components and yield of low-gluten rice. Agriculture 2021, 11, 302. [Google Scholar] [CrossRef]
  40. Deng, N.; Ling, X.; Sun, Y.; Zhang, C.; Fahad, S.; Peng, S.; Cui, K.; Nie, L.; Huang, J. Influence of temperature and solar radiation on grain yield and quality in irrigated rice system. Eur. J. Agron. 2015, 64, 37–46. [Google Scholar] [CrossRef]
  41. Balindong, J.; Ward, R.; Liu, L.; Rose, T.; Pallas, L.; Ovenden, B.; Peter, J.; Snell, B.; Daniel, L. Rice grain protein composition influences instrumental measures of rice cooking and eating quality. J. Cereal Sci. 2018, 79, 35–42. [Google Scholar] [CrossRef]
  42. Chen, G.; Peng, L.; Li, C.; Tu, Y.; Lan, Y.; Wu, C.; Duan, Q.; Zhang, Q.; Yang, H.; Li, T. Effects of the potassium application rate on lipid synthesis and eating quality of two rice cultivars. J. Integr. Agric. 2023, 22, 2025–2040. [Google Scholar] [CrossRef]
  43. Huang, J.; Pan, Y.; Chen, H.; Zhang, Z.; Fang, C.; Shao, C.; Amjad, H.; Lin, W.; Lin, W. Physiochemical mechanisms involved in the improvement of grain-filling, rice quality mediated by related enzyme activities in the ratoon cultivation system. Field Crops Res. 2020, 258, 107962. [Google Scholar] [CrossRef]
  44. Zhou, L.; Jiang, L.; Zhai, H.; Wan, J. Current status and strategies for improvement of rice grain chalkiness. Hereditas 2009, 31, 563–572. [Google Scholar] [CrossRef] [PubMed]
Figure 1. Richards simulation curves of N and K rationing on the weight gain of superior and inferior grains of different cultivars. Note: K fertilizer pre- and post-application ratio of 3:7 under low N conditions (LNK1); K fertilizer pre- and post-application ratio of 5:5 under low N conditions (LNK2); K fertilizer pre- and post-application ratio of 7:3 under low N conditions (LNK3); K fertilizer pre- and post- application ratio of 3:7 under high N conditions (HNK1); K fertilizer pre- and post-application ratio of 5:5 under high N conditions (HNK2); and K fertilizer pre- and post-application ratio of 7:3 under high N conditions (HNK3). S: superior grain (SG), I: inferior grain (IG).
Agronomy 14 01629 g001
Figure 2. Simulation curves of N and K rationing on superior and inferior grains and filling rates of different cultivars. Note: K fertilizer pre- and post-application ratio of 3:7 under low N conditions (LNK1); K fertilizer pre- and post-application ratio of 5:5 under low N conditions (LNK2); K fertilizer pre- and post-application ratio of 7:3 under low N conditions (LNK3); K fertilizer pre- and post- application ratio of 3:7 under high N conditions (HNK1); K fertilizer pre- and post-application ratio of 5:5 under high N conditions (HNK2); and K fertilizer pre- and post-application ratio of 7:3 under high N conditions (HNK3). S: superior grain (SG), I: inferior grain (IG).
Agronomy 14 01629 g002
Figure 3. Results of the three-way ANOVA on N- and K-rationing effects on photosynthetic characteristics of different cultivars at different periods. Note: * and ** indicate significant differences at the 0.05 and 0.01 levels, respectively, and ns indicates non-significant differences; C: cultivars, N: nitrogen treatment, K: potassium treatment, Pn: net photosynthetic rate, Tr: transpiration rate, Gs: stomatal conductance, Ci: intercellular CO2 concentration, VPD: vapor pressure deficit, WUE: water use efficiency. K fertilizer pre- and post-application ratio of 3:7 under low N conditions (LNK1); K fertilizer pre- and post-application ratio of 5:5 under low N conditions (LNK2); K fertilizer pre- and post-application ratio of 7:3 under low N conditions (LNK3); K fertilizer pre- and post- application ratio of 3:7 under high N conditions (HNK1); K fertilizer pre- and post-application ratio of 5:5 under high N conditions (HNK2); and K fertilizer pre- and post-application ratio of 7:3 under high N conditions (HNK3).
Agronomy 14 01629 g003aAgronomy 14 01629 g003b
Figure 4. Results of the three-way ANOVA on N- and K-rationing effects on the activity of RuBPcase of different cultivars at different periods in 2020 and 2021. Note: Different lowercase letters indicate significant differences between groups of the two factors (p < 0.05); * and ** indicate significant differences at the 0.05 and 0.01 levels, respectively, and ns indicates non-significant differences; C: cultivars, N: nitrogen treatment, K: potassium treatment. K fertilizer pre- and post-application ratio of 3:7 under low N conditions (LNK1); K fertilizer pre- and post-application ratio of 5:5 under low N conditions (LNK2); K fertilizer pre- and post-application ratio of 7:3 under low N conditions (LNK3); K fertilizer pre- and post- application ratio of 3:7 under high N conditions (HNK1); K fertilizer pre- and post-application ratio of 5:5 under high N conditions (HNK2); and K fertilizer pre- and post-application ratio of 7:3 under high N conditions (HNK3).
Agronomy 14 01629 g004aAgronomy 14 01629 g004b
Figure 5. Relationship between N and K rationing on cultivars with different N-use efficiency and cooking flavor. * p < 0.05.
Agronomy 14 01629 g005
Table 1. Effects of N and K combined application on grain-filling parameters of different cultivars.
CultivarTreatment
(N and K)
Grain
Position
R0Tmax
(d)
GRmax
(mg grain−1 d−1)
Wmax
(mg grain−1)
I
(%)
GRmean
(mg grain−1 d−1)
D
(d)
T99
(d)
SN265LNK1SG0.2015.181.2013.2248.450.8034.0640.24
K20.2814.071.2112.1645.160.8133.0943.80
K30.2413.481.4613.4848.000.9828.6236.91
K1IG0.2714.211.2511.7446.120.8430.3740.68
K20.3014.021.2911.3945.830.8728.5339.07
K30.3013.991.3011.3745.960.8728.3433.51
HNK1SG0.0734.071.2118.5773.910.7234.7140.12
K20.0732.971.0617.9674.820.6338.0741.44
K30.0634.961.0018.7375.950.5941.6042.16
K1IG0.0734.961.0417.7075.020.6238.1441.52
K20.0734.031.1117.6174.350.6635.8439.71
K30.0734.121.1517.7673.950.6934.9240.52
MF61LNK1SG0.1713.701.2011.8554.130.7927.7621.68
K20.1912.411.2812.0378.900.8527.0622.69
K30.2511.231.2510.1484.670.8324.2920.00
K1IG0.1912.701.2811.6283.330.8525.9321.93
K20.1612.661.2412.3784.880.8127.0421.77
K30.1613.741.2111.7181.330.7926.3720.61
HNK1SG0.0830.810.9813.9678.930.5932.1518.45
K20.0633.190.8614.9758.360.5138.7619.40
K30.0634.690.7913.7451.100.4739.1017.87
K1IG0.0731.500.9214.4946.760.5635.4419.75
K20.0733.530.8914.9255.550.5337.7619.90
K30.0635.580.8215.5253.410.4842.2419.88
Note: R0: starting growth potential reflecting the growth potential of the fertilized ovary; Tmax: time of reaching the maximum grain-filling rate; GRmax: maximum grain-filling rate; GRmean: mean grain-filling rate; D: active grain-filling period (d) representing the time elapsed from 5 to 95% of W from A; T99: effective grain-filling time indicating the time to reach 99% A; I: percentage of the rice grain weight (Wmax) at the maximum grain-filling rate to the final rice grain weight A.
Table 2. N- and K-application characteristics before, during, and after grain filling of different cultivars.
CultivarTreatment
(N and K)
Grain PositionEarly StageMiddle StageLate Stage
Days
(d)
MGR
(mg grain−1 d−1)
RGC
(%)
Days
(d)
MGR
(mg grain−1 d−1)
RGC
(%)
Days
(d)
MGR
(mg grain−1 d−1)
RGC
(%)
SN265LNK1SG7.570.6419.3515.221.0759.2317.450.3220.42
K26.450.6915.6015.251.0559.6422.090.2923.76
K37.060.8318.7512.851.2858.6417.000.3621.61
K1IG29.590.4553.198.971.1643.101.560.362.71
K228.210.4554.899.510.9638.833.710.345.28
K329.980.4356.369.950.9439.452.230.353.19
HNK1SG7.270.6716.6013.881.0859.3519.520.2923.06
K27.480.6816.2613.071.1359.4918.520.3123.25
K37.500.6719.6312.971.1661.7213.030.3317.65
K1IG30.240.4159.899.460.9935.731.820.363.38
K229.480.4352.059.111.0843.351.130.383.59
K329.620.4353.609.011.1042.831.890.392.57
MF61LNK1SG7.930.7026.0911.531.0555.5612.520.3017.35
K26.660.7924.0411.511.1256.4213.220.3218.54
K35.900.8321.0710.651.0856.9814.630.2820.95
K1IG7.210.8224.9010.981.0753.4716.110.2920.63
K27.220.7828.7110.871.1054.2011.050.3216.09
K38.440.7028.8110.601.0754.1610.700.3116.03
HNK1SG26.740.3853.718.160.9340.712.020.364.58
K228.480.3655.729.420.8339.311.770.313.97
K329.870.3255.149.640.7439.302.120.284.56
K1IG31.490.2842.159.250.7032.907.280.6723.95
K230.550.3653.519.740.8539.404.070.386.09
K332.400.3556.6710.060.7738.081.950.284.25
Note: The grain-filling rate curve has two inflection points: the second order derivative of t was found and made zero to obtain the values t1 and t2 of the two inflection points on the horizontal coordinate; time t3 of T99 above was combined to determine the three stages of the grain-filling process: early (0~t1), middle (t1~t2), and late (t2~t3). The duration of grain-filling (Days), mean grain-filling rate (MGR), and the ratio of the grain-filling contributing to the final grain weight (RGC) were also found for each period.
Table 3. Results of the three-way ANOVA on N- and K-rationing effects on the processing quality of different cultivars in 2020 and 2021.
SN265MF61
YearTreatment
(N and K)
Brown Rice Rate (%)Milled Rice Rate (%)Head Rice Rate (%)Brown Rice Rate (%)Milled Rice Rate (%)Head Rice Rate (%)
2020LNK178.42 ± 0.14 a69.74 ± 0.19 a59.07 ± 0.33 a75.07 ± 0.96 a68.14 ± 0.88 a66.38 ± 0.51 a
K278.44 ± 0.06 a69.91 ± 0.32 a60.04 ± 0.46 a75.74 ± 0.09 a68.62 ± 0.14 a66.35 ± 0.92 a
K378.59 ± 0.11 a70.07 ± 0.42 a60.09 ± 0.57 a74.80 ± 0.41 a67.87 ± 0.43 a65.66 ± 0.20 a
HNK179.24 ± 0.16 b70.17 ± 1.01 b59.27 ± 0.20 c78.03 ± 0.26 a70.06 ± 0.35 a66.98 ± 0.41 a
K279.61 ± 0.98 b72.51 ± 0.21 a60.36 ± 0.10 b77.03 ± 0.15 ab69.77 ± 0.22 a66.82 ± 0.58 a
K380.95 ± 0.27 a70.73 ± 0.20 b62.83 ± 0.50 a76.16 ± 0.06 b69.07 ± 0.12 a66.40 ± 0.07 a
2021LNK178.66 ± 0.26 a70.31 ± 0.39 b62.67 ± 0.51 b74.14 ± 0.65 b63.74 ± 0.31 b60.22 ± 0.38 b
K278.99 ± 0.19 a70.33 ± 0.38 b62.69 ± 0.92 b74.70 ± 0.14 b65.52 ± 0.44 a60.36 ± 0.59 b
K379.12 ± 0.01 a71.05 ± 0.19 a65.94 ± 0.20 a76.55 ± 0.90 a66.71 ± 0.13 a62.24 ± 0.20 a
HNK179.71 ± 0.15 a71.82 ± 0.01 a66.14 ± 0.41 b77.36 ± 0.44 a69.76 ± 0.37 a65.54 ± 0.22 a
K279.79 ± 0.45 a71.99 ± 0.23 a67.23 ± 0.58 ab76.81 ± 0.54 a68.96 ± 0.10 a64.01 ± 0.56 b
K379.91 ± 0.02 a72.05 ± 0.10 a67.83 ± 0.07 a76.28 ± 0.43 a68.86 ± 0.34 a63.62 ± 0.11 b
FY ns****ns****
FN ************
FK ****nsnsns
FY×N nsns**ns****
FY×K ns*ns***ns
FN×K ns*ns*****
FN×K×Y nsns**nsns*
Note: Different lowercase letters indicate significant differences between groups of the two factors (p < 0.05); * and ** indicate significant differences at the 0.05 and 0.01 levels, respectively, and ns indicates non-significant differences; Y: year, N: nitrogen treatment, K: potassium treatment.
Table 4. Results of the three-way ANOVA of N- and K-application effects on appearance and nutritional quality of different cultivars in 2020 and 2021.
SN265MF61
YearTreatment
(N and K)
Amylose Content
(%)
Protein Contents (%)Chalkiness Degree
(%)
Chalkiness Percentage (%)Amylose Content
(%)
Protein Contents (%)Chalkiness Degree
(%)
Chalkiness Percentage
(%)
2020LNK119.00 ± 0.01 a7.47 ± 0.01 b6.90 ± 0.30 c23.03 ± 0.37 b18.90 ± 0.09 a7.40 ± 0.01 ab3.50 ± 0.25 c15.50 ± 0.36 c
K218.90 ± 0.06 a7.40 ± 0.03 c8.33 ± 0.19 b23.97 ± 0.09 ab18.83 ± 0.03 a7.30 ± 0.06 b5.67 ± 0.17 b18.70 ± 0.90 b
K319.07 ± 0.03 a7.60 ± 0.01 a9.40 ± 0.12 a24.70 ± 0.09 a18.90 ± 0.03 a7.47 ± 0.03 a6.77 ± 0.18 a21.30 ± 0.21 a
HNK118.87 ± 0.06 a7.73 ± 0.01 b11.17 ± 0.03 c30.57 ± 0.46 c18.83 ± 0.03 a7.87 ± 0.03 a8.00 ± 0.07 a25.63 ± 0.48 a
K218.83 ± 0.03 a7.70 ± 0.03 b12.27 ± 0.28 b32.67 ± 0.33 b18.80 ± 0.07 a7.53 ± 0.03 b8.23 ± 0.15 a23.57 ± 0.87 b
K319.00 ± 0.03 a7.90 ± 0.01 a13.47 ± 0.17 a34.30 ± 0.56 a18.40 ± 0.12 b7.77 ± 0.03 a7.20 ± 0.31 b18.47 ± 0.33 c
2021LNK118.47 ± 0.09 b7.40 ± 0.01 b4.93 ± 0.03 c17.57 ± 0.15 b18.23 ± 0.03 a7.07 ± 0.06 b4.93 ± 0.12 c12.70 ± 0.12 b
K218.60 ± 0.09 b7.70 ± 0.01 a6.50 ± 0.12 b18.37 ± 0.18 a18.30 ± 0.12 a7.20 ± 0.01 ab6.50 ± 0.15 b13.77 ± 0.12 a
K318.87 ± 0.01 a7.73 ± 0.03 a8.03 ± 0.06 a17.43 ± 0.09 b18.40 ± 0.06 a7.37 ± 0.03 a8.03 ± 0.07 a14.60 ± 0.09 a
HNK118.47 ± 0.03 b7.80 ± 0.03 b10.27 ± 0.04 c16.70 ± 0.07 c18.50 ± 0.03 a7.73 ± 0.03 a10.27 ± 0.08 c15.67 ± 0.12 a
K218.50 ± 0.06 b8.00 ± 0.03 a11.14 ± 0.07 b17.73 ± 0.15 b18.30 ± 0.01 ab7.67 ± 0.09 a11.14 ± 0.03 b13.67 ± 0.09 b
K318.67 ± 0.03 a8.07 ± 0.03 a12.28 ± 0.20 a20.63 ± 0.44 a18.27 ± 0.06 b7.50 ± 0.06 a12.28 ± 0.03 a13.63 ± 0.06 b
FY ****************
FN **********ns****
FK ********nsns**ns
FY×N *ns****ns*****
FY×K ***nsns*ns***
FN×K nsns***********
FN×K×Y nsnsnsnsnsns****
Note: Different lowercase letters indicate significant differences between groups of the two factors (p < 0.05); * and ** indicate significant differences at the 0.05 and 0.01 levels, respectively, and ns indicates non-significant differences; Y: year, N: nitrogen treatment, K: potassium treatment.
Table 5. Results of the three-way ANOVA on N- and K-rationing effects on the protein components of different cultivars in 2020 and 2021.
SN265MF61
YearTreatment
(N and K)
Albumin
(%)
Globlulin
(%)
Prolamin
(%)
Glutelin
(%)
Albumin
(%)
Globlulin
(%)
Prolamin
(%)
Glutelin
(%)
2020LNK10.31 ± 0.01 a0.61 ± 0.04 c0.57 ± 0.05 b8.04 ± 0.16 b0.18 ± 0.01 a0.35 ± 0.05 b0.51 ± 0.05 c7.53 ± 0.47 b
K20.33 ± 0.01 a0.76 ± 0.07 b0.80 ± 0.08 a7.40 ± 0.31 ab0.29 ± 0.03 b0.50 ± 0.02 a0.78 ± 0.01 b7.49 ± 0.34 b
K30.38 ± 0.01 b0.82 ± 0.04 a0.98 ± 0.03 a6.39 ± 0.08 a0.32 ± 0.01 c0.63 ± 0.11 a1.29 ± 0.16 a6.18 ± 0.05 a
HNK10.38 ± 0.01 b0.71 ± 0.02 c0.83 ± 0.31 b6.87 ± 0.13 c0.37 ± 0.02 a0.70 ± 0.07 a1.23 ± 0.12 a7.12 ± 0.09 a
K20.45 ± 0.01 b0.75 ± 0.10 b1.10 ± 0.13 b5.99 ± 0.18 b0.37 ± 0.01 b0.62 ± 0.06 a1.20 ± 0.21 a7.13 ± 0.22 a
K30.49 ± 0.01 a1.19 ± 0.03 a1.97 ± 0.18 a5.87 ± 0.20 a0.28 ± 0.01 b0.62 ± 0.07 b1.13 ± 0.17 a7.47 ± 0.45 a
2021LNK10.25 ± 0.01 a0.46 ± 0.04 c0.59 ± 0.07 c6.96 ± 0.05 c0.13 ± 0.01 a0.24 ± 0.03 c0.67 ± 0.08 c6.49 ± 0.09 b
K20.28 ± 0.01 b0.60 ± 0.01 b0.70 ± 0.07 b6.51 ± 0.08 b0.19 ± 0.01 ab0.30 ± 0.01 b0.59 ± 0.06 b6.12 ± 0.04 b
K30.31 ± 0.01 b0.70 ± 0.02 a0.88 ± 0.01 a5.39 ± 0.13 a0.24 ± 0.01 b0.42 ± 0.02 a1.06 ± 0.04 a6.09 ± 0.01 a
HNK10.35 ± 0.01 b0.61 ± 0.02 b0.68 ± 0.03 c5.78 ± 0.29 c0.32 ± 0.01 a0.63 ± 0.03 a1.11 ± 0.02 a5.99 ± 0.05 a
K20.37 ± 0.01 a0.68 ± 0.03 b0.85 ± 0.02 b5.43 ± 0.14 b0.26 ± 0.02 a0.59 ± 0.01 b1.06 ± 0.02 a6.25 ± 0.08 a
K30.42 ± 0.01 a0.90 ± 0.04 a1.31 ± 0.07 a5.22 ± 0.13 a0.22 ± 0.02 a0.59 ± 0.02 c1.06 ± 0.03 a6.40 ± 0.04 a
FY **************
FN **************ns
FK ***************
FY×N nsns**nsns**nsns
FY×K ******ns**nsns*
FN×K ns****ns********
FN×K×Y ***nsnsnsnsns**
Note: Different lowercase letters indicate significant differences between groups of the two factors (p < 0.05); * and ** indicate significant differences at the 0.05 and 0.01 levels, respectively, and ns indicates non-significant differences; Y: year, N: nitrogen treatment, K: potassium treatment.
Table 6. Results of the three-way ANOVA on N- and K-rationing effects on starch RVA spectrum of SN265 in 2020 and 2021.
YearTreatment
(N and K)
Peak Viscosity (cP)Hot Paste Viscosity (cP)Cool Paste Viscosity (cP)Breakdown Viscosity (cP)Setback Viscosity (cP)Peak Time
(s)
Pasting Temp. (°C)
2020LNK12371.00 ± 11.36 a1622.67 ± 11.78 a2510.33 ± 14.08 b748.33 ± 0.88 b139.33 ± 17.61 c6.18 ± 0.02 a72.72 ± 0.33 a
K22269.33 ± 8.09 b1562.67 ± 8.29 b2551.67 ± 24.97 ab706.67 ± 3.18 b282.33 ± 16.9 b6.29 ± 0.02 a72.40 ± 0.26 a
K32165.67 ± 7.26 c1352.67 ± 25.71 c2555.00 ± 19.86 a813.00 ± 9.61 a389.33 ± 14.45 a6.25 ± 0.09 a72.35 ± 0.04 a
HNK12143.33 ± 2.40 a1500.00 ± 5.69 a2628.33 ± 11.79 c643.33 ± 3.84 b485.00 ± 11.02 c6.15 ± 0.02 a72.93 ± 0.02 a
K22101.33 ± 2.73 b1373.33 ± 9.94 b2703.33 ± 16.60 b728.00 ± 8.02 a602.00 ± 14.18 b6.20 ± 0.01 a72.68 ± 0.03 a
K32022.33 ± 3.53 c1368.00 ± 43.5 b2838.33 ± 8.35 a654.33 ± 14.29 b816.00 ± 5.03 a6.22 ± 0.02 a72.65 ± 0.28 a
2021LNK12285.67 ± 16.13 a1921.67 ± 13.35 a2451.00 ± 4.91 c364.00 ± 7.54 a165.33 ± 11.35 b5.76 ± 0.12 b79.14 ± 0.20 a
K22047.67 ± 9.17 b1828.67 ± 16.29 b2565.33 ± 29.58 b219.00 ± 2.91 b517.67 ± 35.93 a5.98 ± 0.02 a78.92 ± 0.06 ab
K32050.00 ± 28.01 b1806.00 ± 24.58 b2637.67 ± 41.68 a244.00 ± 5.36 b587.67 ± 20.01 a5.40 ± 0.04 c78.57 ± 0.06 b
HNK12148.00 ± 5.57 a1773.67 ± 10.84 a2368.67 ± 6.57 b374.33 ± 2.40 a220.67 ± 8.17 b5.95 ± 0.02 b79.33 ± 0.04 a
K22075.00 ± 11.37 b1759.67 ± 3.38 ab2363.33 ± 25.62 b315.33 ± 5.13 a288.33 ± 10.48 b6.15 ± 0.08 a78.72 ± 0.21 b
K31904.00 ± 31.79 c1709.00 ± 12.17 b2544.67 ± 18.25 a195.00 ± 4.06 b640.67 ± 9.94 a5.98 ± 0.02 b78.16 ± 0.24 c
FY **************
FN **********ns
FK ***********ns
FY×N **ns********ns
FY×K ****ns********
FN×K ***********ns
FN×K×Y ******ns**nsns
Note: Different lowercase letters indicate significant differences between groups of the two factors (p < 0.05); * and ** indicate significant differences at the 0.05 and 0.01 levels, respectively, and ns indicates non-significant differences; Y: year, N: nitrogen treatment, K: potassium treatment.
Table 7. Results of the three-way ANOVA on N- and K-rationing on starch RVA spectrum of MF61 in 2020 and 2021.
YearTreatment
(N and K)
Peak Viscosity (cP)Hot Paste Viscosity (cP)Cool Paste Viscosity (cP)Breakdown Viscosity (cP)Setback Viscosity (cP)Peak Time
(s)
Pasting Temp. (°C)
2020LNK12372.67 ± 26.77 a1691.00 ± 37.47 a2459.33 ± 35.15 b681.67 ± 17.4 a86.67 ± 4.26 c6.49 ± 0.02 a73.55 ± 0.02 a
K22356.67 ± 43.17 a1631.67 ± 11.79 b2568.33 ± 7.31 a725.00 ± 31.58 a211.67 ± 15.62 b6.51 ± 0.06 a73.57 ± 0.04 a
K32101.67 ± 70.05 b1472.00 ± 4.36 c2545.33 ± 18.89 a629.67 ± 65.79 a443.67 ± 56.84 a6.31 ± 0.02 b73.02 ± 0.29 a
HNK12266.33 ± 51.91 a1343.00 ± 25.16 b2579.67 ± 19.36 a923.33 ± 3.84 a313.33 ± 42.4 b6.25 ± 0.02 a73.48 ± 0.03 a
K22103.33 ± 2.40 b1408.33 ± 13.87 a2519.33 ± 13.86 b695.00 ± 11.62 b416.00 ± 11.59 a6.29 ± 0.02 a73.25 ± 0.28 a
K32127.33 ± 2.91 b1362.67 ± 21.06 b2489.33 ± 2.19 b764.67 ± 18.18 b362.00 ± 1.00 ab6.22 ± 0.02 a73.30 ± 0.30 a
2021LNK12408.67 ± 28.79 a1608.00 ± 12.13 a2498.33 ± 12.10 b800.67 ± 5.69 c89.67 ± 3.71 c6.34 ± 0.01 a76.17 ± 0.24 b
K22342.33 ± 19.2 b1347.67 ± 23.95 b2696.67 ± 9.64 a994.67 ± 11.46 a354.33 ± 15.17 b6.32 ± 0.01 ab76.63 ± 0.18 ab
K32276.33 ± 11.57 c1349.00 ± 3.48 b2715.67 ± 18.85 a927.33 ± 4.93 b439.33 ± 16.92 a6.28 ± 0.01 b76.93 ± 0.20 a
HNK12149.67 ± 28.34 b1272.67 ± 17.48 b2406.67 ± 46.26 a877.00 ± 16.92 a257.00 ± 17.93 a6.24 ± 0.03 b77.78 ± 0.07 a
K22285.33 ± 19.17 a1433.67 ± 9.87 a2340.67 ± 7.22 b851.67 ± 11.68 a55.33 ± 12.78 b6.31 ± 0.02 a77.33 ± 0.07 a
K32283.67 ± 13.96 a1391.33 ± 9.17 a2381.67 ± 7.02 ab892.33 ± 5.24 a98.00 ± 9.17 b6.33 ± 0.01 a76.22 ± 0.13 b
FY ****ns********
FN *******ns**ns
FK ******ns****ns
FY×N ns***********
FY×K ***********ns
FN×K *************
FN×K×Y ****nsns**ns**
Note: Different lowercase letters indicate significant differences between groups of the two factors (p < 0.05); * and ** indicate significant differences at the 0.05 and 0.01 levels, respectively, and ns indicates non-significant differences; Y: year, N: nitrogen treatment, K: potassium treatment.
Disclaimer/Publisher’s Note: The statements, opinions and data contained in all publications are solely those of the individual author(s) and contributor(s) and not of MDPI and/or the editor(s). MDPI and/or the editor(s) disclaim responsibility for any injury to people or property resulting from any ideas, methods, instructions or products referred to in the content.

