Article

Wheat Response to Foliar-Applied Phosphorus Is Determined by Soil Phosphorus Buffering

1
Department of Primary Industries and Regional Development Western Australia, 10 Dore St., Katanning, WA 6317, Australia
2
SoilsWest, Murdoch University, 90 South St., Murdoch, WA 6150, Australia
*
Author to whom correspondence should be addressed.
Agronomy 2024, 14(8), 1630; https://doi.org/10.3390/agronomy14081630
Submission received: 20 June 2024 / Revised: 19 July 2024 / Accepted: 23 July 2024 / Published: 25 July 2024
(This article belongs to the Special Issue Foliar Fertilization: Novel Approaches and Field Practices)

Abstract

:
In no-till cropping systems, banding of phosphorus (P) fertiliser at seeding results in low use efficiency due to chemical reactions in soil. Foliar P has the potential to allow grain producers to respond tactically with P application after sowing when P supply from soil and fertiliser is not meeting crop demand. The objective of this study was to evaluate the effectiveness of foliar P on wheat grain yield, grain quality, biomass yield, P uptake and P use efficiency indices. Nine field experiments were conducted to investigate the response of wheat to foliar P. Three rates of P, 0, 2.5 and 5.0 kg/ha, as phosphoric acid (H3PO4 85%) were applied to wheat at three different growth stages: first tiller emergence (Z21), first node detection (Z31) and flag leaf emergence (Z39). Grain yield responses ranging from 176 kg/ha to 505 kg/ha to foliar-applied P were observed in six out of nine experiments. The percent grain yield response to foliar P was negatively related to the P buffering index (PBI, 0–10 cm soil depth), which is attributed to greater sorption by soil of the foliar P at the higher PBI levels. Mean agronomic efficiency (AE) across the experiments was 111 kg/kg P but reached up to 232 kg/kg P. It was also evident that foliar P has the potential to improve P concentration in shoots and grains and increase P uptake but with no or minimal effect on grain quality. Our results suggest that a combination of tissue testing at the seedling stage and soil P buffering can be used to guide when foliar P application is likely to increase grain yield in wheat.

1. Introduction

In no-till cropping systems, banding of phosphorus (P) fertiliser at sowing is logistically efficient and has higher P use efficiency (PUE) than surface application [1]. However, unlike nitrogen (N) and potassium (K), grain producers have no option to respond to in-season periods of P deficiency due to unfavourable (dry) conditions and/or for higher P demand when the potential yield increases due to more favourable conditions. Phosphorus deficiency in wheat has been suggested to reduce tillering [2], increase the duration of the phyllochron [3,4], and reduce the rate of individual leaf expansion [4] and rate of assimilate production per unit area [5]. All these factors ultimately limit the grain yield potential of wheat crop. Foliar-applied P fertiliser (foliar P) offers the potential to allow grain producers to respond tactically to changing seasonal conditions and maintain adequate P concentrations in crops.
Studies on the impact of foliar P on wheat grain yield under field and controlled conditions have reported mixed results where the grain yield response is driven by soil type, soil pH, sources of foliar P, soil applied N and P [6,7,8,9,10,11]. In most instances, better grain yield was achieved with combined application of soil-applied P with supplemental foliar P instead of foliar P alone [12,13]. Foliar P application was found beneficial in P-deficient conditions [14]; for example, when the leaf P was above the critical value (0.3%), it did not give any response, but when the leaf P concentration was below the critical value of 0.3%, it resulted in a wheat yield increase [14]. This response shows that plant tissue P critical levels can be used to guide whether a yield response is expected from foliar P.
Maintaining adequate P supply to crops grown in the high P buffering gravelly soils of south-western Western Australia (SWWA) is problematic, and P deficiencies can occur. The phosphorus buffering index (PBI) is used to quantify the level of soil P buffering and guide the recommendations for P fertiliser. In this region, cropping intensity has also steadily increased in response to greater profit from cropping compared to animal enterprises [15]. The most common approach used to provide adequate P supply to crops grown on these soils is to drill granular P fertilisers at sowing. Foliar P fertiliser may provide a tactical top-up option to maintain adequate P supply for crops grown on these soils. The aim of this study was to examine whether yield responses to foliar P can be detected in wheat crops grown in these soils.

2. Materials and Methods

2.1. Site Selection and Experimental Details

First, 9 experimental sites were selected from 21 potential sites in 2021 and 2022 that were likely to be P deficient based on plant-available soil P measured using the diffusive gradient in thin-films (DGT-P) test [16]. At each potential site, monitoring of shoot P concentration was conducted at weekly intervals from first leaf emergence (Z11) to tillering (Z23) growth stages. Plant samples were analysed for P concentration using Inductively Coupled Plasma–Atomic Emission Spectrometry (ICP-AES) [17], and the results were compared to critical shoot P concentrations for the relevant growth stage [18,19]. Sites where shoot P concentration was below critical levels for two consecutive weeks were considered P deficient and selected as suitable for a foliar P experiment (Figure 1). Site details and agronomic management of wheat crops are given in Table 1. Monthly rainfall and temperature data for each site are presented in Supplementary Table S1.
Prior to seeding, 30 soil samples from each potential experimental site were collected from the top 10 cm between February and April in 2021 and 2022. Cores were collected from between and within the rows to ensure composite soil samples were representative of the site. The samples were bulked and stored in a plastic bag and placed in laboratory for air drying. After drying, samples were processed by sieving through a 2.0 mm sieve and then analysed for soil physico-chemical properties using standard methods [20]—soil pH (CaCl2) [Method 4A1], soil organic carbon (SOC) [Method 6A1], soil P buffering index (PBI) [Method 912C], Colwell extractable P (PCol) [Method 9B], inorganic N (Inorg-N) [7C2B], Colwell extractable K (KCol) [Method 18A1], KCl-40 extractable S (S) [Method 10D1], diffusive gradient in thin-films method (DGT-P) [16]; soil texture [21], the Australian soil classification (ASC) [22] and % gravel (>2 mm) by sieving and dry weight method. Soil test results of experimental sites are given in Table 2.
Table 1. Site details of nine foliar-applied P experiments conducted in SWWA in 2021–2022.
No. YearExperiment IDDate of SowingDate of HarvestingWheat VarietySeeding Rate (kg/ha)Row Spacing (cm)Seeding Depth (cm)N Applied (kg/ha)P Applied (kg/ha)K Applied (kg/ha)
12021Bannister22/05/202113/12/2021Sceptre120232.51241931
22021Kojonup S18/05/202124/12/2021Sceptre110282.563191
32022Gunwarrie 17/05/202216/12/2022Kinsei130252.51212140
42022Frankland12/05/202216/12/2022Kinsei130252.51212140
52022Gunwarrie 25/05/202215/12/2022Kinsei130252.51212140
62022Kojonup E23/05/202218/12/2022Chief10022.52.5721810
72022Qualeup 120/05/202213/12/2022Rockstar11022.52.5822035
82022Qualeup 220/05/202213/12/2022Rockstar11022.52.5822035
92022Wandering28/05/202217/12/2022Rockstar7522.5279157

2.2. Experimental Design

The design of the experiment was a factorial of rate and timing of P application. The P rates were 0 (Control), 2.5 and 5 kg P/ha (0 P, 2.5 P and 5 P, respectively). The time of application was based on Zadoks growth stages [23], e.g., Z21 (first tiller emergence), Z31 (first node detection) and Z39 (flag leaf emergence). All treatments were applied at the targeted growth stage except at Gunwarrie 2, where the Z21 application was delayed to Z23 due to rain and windy conditions. The experiments were arranged in a randomised block design with four replicates in wheat crops sown by farmers. Plots 20 m long and 7 rows wide (1.54 m to 1.8 m, depending on row spacing) were marked in an area where crop growth was uniform, and the risk of waterlogging and frost were lowest.
The foliar P treatments were applied using commercially available phosphoric acid (H3PO4 85%, Redox Australia, Sydney, Australia). Phosphoric acid was used as source of foliar P to avoid confounding effects of other nutrients. The phosphoric acid solutions were mixed with the adjuvant HastenTM (Victorian Chemical Company Pty., Ltd., Melbourne, Australia) at the ratio of 100:1 to increase droplet adherence on leaves [9]. The foliar P treatments were applied using a calibrated 12V backpack sprayer. Plots were photographed at approximately 2 m height at each time of foliar P application, and percent canopy cover was calculated with the web-based Canopeo App [24], (https://canopeoapp.com/, accessed on 14 November 2023).
We considered the management of weeds, diseases and fertiliser top-ups for N and K or micronutrients if any was done by the farmer. Granular P fertiliser was drilled below the seed at the time of seeding at all sites (Table 1) except Kojonup S site, where it was surface applied. The experiments were free of weeds and foliar diseases.
Table 2. Soil test results and P indices (0–10 cm) at the experiment sites. P indices classifications: * PBI—extremely low (<15), very-very low (15–35), very low (36–70), low (70–141), moderate (141–280), high (281–840), very high (>840) [25]; ** DGT-P (μg/L)—very low (0–20), low (21–45), marginal (46–56), adequate (57–100), high (>100) [16,26]; *** PCol (mg/kg)—low (<30), medium (30–90), high (>90) [27,28].
No. Experiment IDGravel (%)TextureASCpH (CaCl2)SOC (%)* PBI** DGT-P (μg/L)*** PCol (mg/kg)Inorg-N (mg/kg)KCol (mg/kg)S (mg/kg)
1Bannister51Loamy sandChromosol6.24.39175.6155071897.1
2Kojonup S51Loamy sandChromosol5.73.91110.1194210622621.8
3Gunwarrie 163Loamy sandChromosol5.64.31165.522616510318
4Frankland51Loamy sandChromosol6.23.43145.62039598914.2
5Gunwarrie 233Loamy sandSodosol5.63.65218.515434310316.5
6Kojonup E53LoamSodosol4.83.1379.924215119316.2
7Qualeup 159Clay loamTenosol6.54.32176.32493391468.6
8Qualeup 253Clay loamChromosol6.14.72202277356913.3
9Wandering30Clay loamChromosol5.63.65168.4224815824.9

2.3. In-Season Measurements, Plant and Grain Analysis, P Uptake and Efficiencies

Dry shoot weight (DSW) was measured at mid-anthesis (Z65). Samples were dried at 65 °C, weighed and ground for nutrient analysis. Shoot samples were analysed for nutrients using ICP-AES, and total N concentration was determined by using a LECO (LECO, Saint Joseph, MI, USA) combustion analyser (Method 9G2, [20]). Phosphorus uptake at anthesis was calculated from shoot dry weight and P concentration at anthesis.
Crop reflectance was measured at Z21, Z31, Z39 and Z65 growth stages by normalised difference vegetation index (NDVI) using a hand-held Greenseeker Sensor (Trimble Agriculture Division, Westminster, CO, USA) over the crop surface at approximately 1 m height maintaining a 90° inclination with the crop and scanning all rows in plot at a constant walking speed of approximately 1 m/s. Plot NDVI was calculated by deducting soil background reflectance levels from the plot readings.
Leaf scorching was assessed visually at mid-anthesis (Z65). Twenty plants were collected from each plot, and the percentage of leaf area scorched was estimated on the top three leaves. During the visual assessment, leaves were also assessed for symptoms of leaf disease. There was no leaf disease present at any of the sites.
The field experiments were harvested at physiological maturity (Z92) with a plot harvester. Grain subsamples were cleaned and analysed for nutrient concentration using ICP-AES, average grain weight and NIR predicted protein and hectolitre weight (Foss InfratecTM Nova, Foss Analytical A/S, Hilleroed, Denmark).

2.4. P Efficiency Indices

Agronomic efficiency (AE) was calculated as:
A E = Y i Y 0 F i
where Yi is grain yield (kg/ha) for P rate i, Y0 is grain yield (kg/ha) for 0 P and Fi is level of P applied (kg/ha) for rate i.
Recovery efficiency (RE) was calculated using the difference method [29]:
R E = U i U 0 F i
where Ui is P uptake (kg/ha) for P rate i and U0 is P uptake (kg/ha) for 0 P.
Phosphorus use efficiency (PUE) was calculated as the difference in grain P uptake per unit of P applied:
P U E = G i G 0 F i
where Gi is grain P uptake (kg/ha) for P rate i and G0 is grain P uptake (kg/ha) for 0 P.

2.5. Statistical Analysis

Statistical analysis was conducted using Genstat for Windows, 22nd Edition (VSN International 2022). For each experiment, the analysis used the treatment structure Control/(rate × timing), which first compares Control verses applied P, and then examined the main effects of rate of applied P (2.5 P vs. 5 P) and timing (Z21, Z31 and Z39) as well as the interaction of rate and timing. A combined analysis using treatment means from all nine experiments was also conducted with experiment as blocking factor, using the same treatment structure as above. Treatment effects were considered significant at p < 0.05. Leaf scorching was square root transformed prior to analysis. The least significant difference (LSD) values at the 5% level were used to compare treatments, with a focus on the main effects of rate and timing when the interaction was not significant.

3. Results

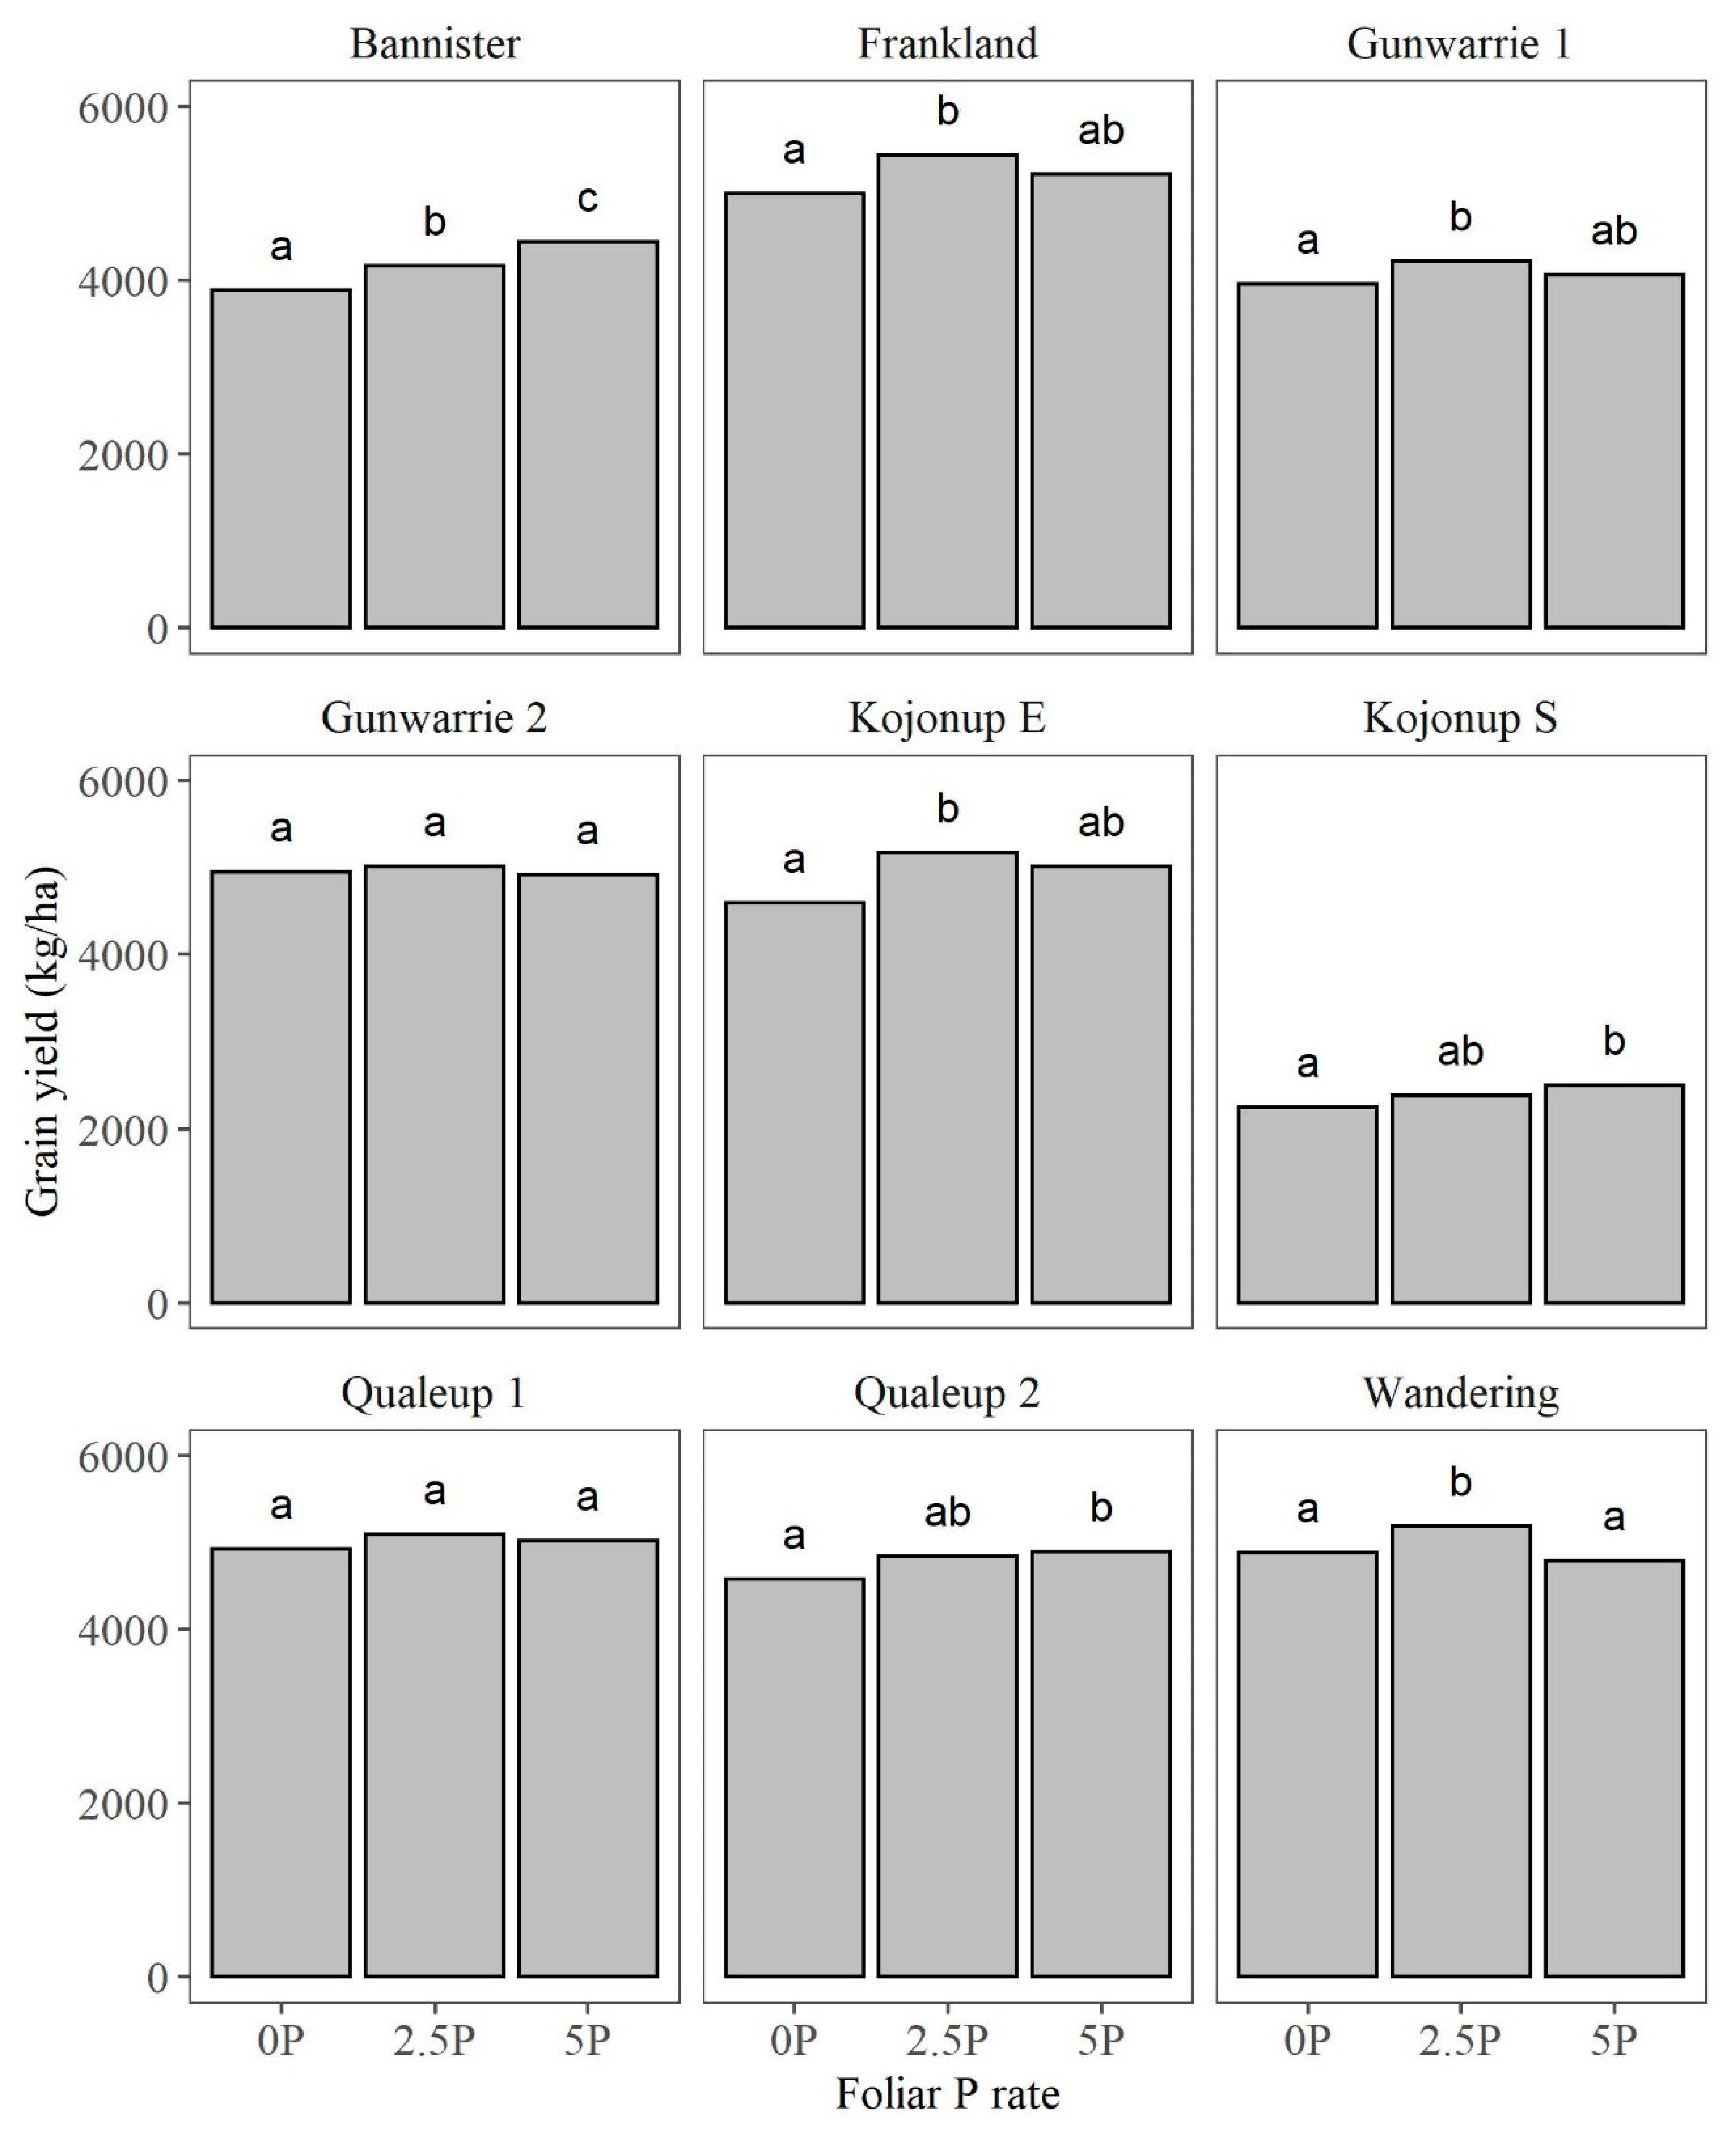
3.1. Grain Yield (GY)

Grain yield increased significantly (p < 0.05) due to foliar P application at six of the nine sites (Control vs. applied P, Table 3, Figure 2). During these experiments, the yield increase from foliar-applied P ranged from 176 kg/ha (4%) to 505 kg/ha (11%) relative to 0 P. The phosphorus rate had an effect on grain yield at two sites (Figure 3); 2.5 P was higher than 5 P at Wandering, and 5 P was higher than 2.5 P at Bannister.
In the combined analysis for all experiments, the grain yield increased by 6% due to foliar P application (Control vs. applied P, p < 0.001, Table 3).
Time of application had an effect on grain yield at four sites with a decline in yield at the later application (Z39) (Figure 4). Grain yield decreased when foliar P was applied at Z39 compared to Z21 by 612 kg/ha (12%) at Qualeup 1, 282 kg/ha (11%) at Kojonup S, 402 kg/ha (8%) at Qualeup 2 and 312 kg/ha (7%) at Gunwarrie 1 site.
Table 3. Probability values (p-values) for treatment effects on grain yield (GY), shoot dry weight (SDW), shoot and grain P concentration, shoot and grain P uptake, leaf scorching, P use efficiencies and grain quality. Significance (p): *** = ≤0.001, ** = ≤0.05, * = ≤0.1. (NS = Non-Significant).
SiteTreatmentsGYSDW% Shoot PShoot P Uptake% Grain PGrain P Uptake% Leaf ScorchingAEREPUEProteinHectolitre wtAv Grain wt
BannisterControl vs. applied P*****NS**NSNS***---**NS
P Rates (2.5 P vs. 5 P)**NS****NSNS**NSNSNSNSNSNS
P TimingsNSNSNSNSNSNS***NSNSNSNSNSNS
P Rates × P TimingsNSNSNSNSNSNS***NSNSNSNSNSNS
Kojonup SControl vs. applied P****NSNSNSNS***---NS***NS
P Rates (2.5 P vs. 5 P)NSNSNS*NSNS***NSNSNSNS*NS
P Timings******NSNSNS***NSNSNSNSNSNS
P Rates × P TimingsNSNS**NS*******NSNS**NSNS**
Gunwarrie 1Control vs. applied P****NSNS********---NSNS*
P Rates (2.5 P vs. 5 P)NSNSNSNS**NS*****NSNSNSNSNS
P Timings**NSNSNSNSNS****NSNSNSNSNS
P Rates × P TimingsNSNSNSNSNSNS***NSNSNSNSNSNS
FranklandControl vs. applied P****************---NSNSNS
P Rates (2.5 P vs. 5 P)NS****NSNSNS*****NS**NSNSNS
P TimingsNS**NSNSNSNS***NSNSNS*NSNS
P Rates × P TimingsNSNSNS**NSNS***NSNSNSNSNSNS
Gunwarrie 2Control vs. applied PNS*NS***NS***---NSNS*
P Rates (2.5 P vs. 5 P)NSNS**NSNSNSNSNSNSNSNSNSNS
P TimingsNSNS*******NS*NS**NS**NSNS
P Rates × P TimingsNSNSNSNSNSNSNSNSNSNSNSNSNS
Kojonup EControl vs. applied P****NS*********---NSNSNS
P Rates (2.5 P vs. 5 P)NSNSNSNS**NS*****NS*NSNSNS
P TimingsNSNSNSNS***NS***NSNSNSNSNSNS
P Rates × P TimingsNSNSNSNSNSNS**NSNSNS**NSNS
Qualeup 1Control vs. applied PNS************** NSNSNS
P Rates (2.5 P vs. 5 P)NSNS**NS**NS***NSNSNSNSNSNS
P Timings******NSNSNS*****NSNSNSNSNS
P Rates × P TimingsNSNSNSNSNSNSNSNSNSNSNSNSNS
Qualeup 2Control vs. applied P**NS**************---NSNSNS
P Rates (2.5 P vs. 5 P)NSNSNSNSNSNS**NS***NS*NS
P Timings***NSNS**NS*****NSNSNSNSNS
P Rates × P TimingsNSNSNSNSNSNS***NSNSNSNSNSNS
WanderingControl vs. applied PNS**************---NSNSNS
P Rates (2.5 P vs. 5 P)******NSNSNS*****NSNS**NSNS
P TimingsNSNSNS**NS***NS*NSNSNSNS
P Rates × P TimingsNSNSNSNSNSNSNSNSNSNSNSNSNS
Combined analysisControl vs. applied P********************---NSNS**
P Rates (2.5 P vs. 5 P)NS*********NS******NS***NSNSNS
P Timings********NS**NS*****NSNS**NSNS
P Rates × P TimingsNSNS**NS*******NSNS**NSNSNS

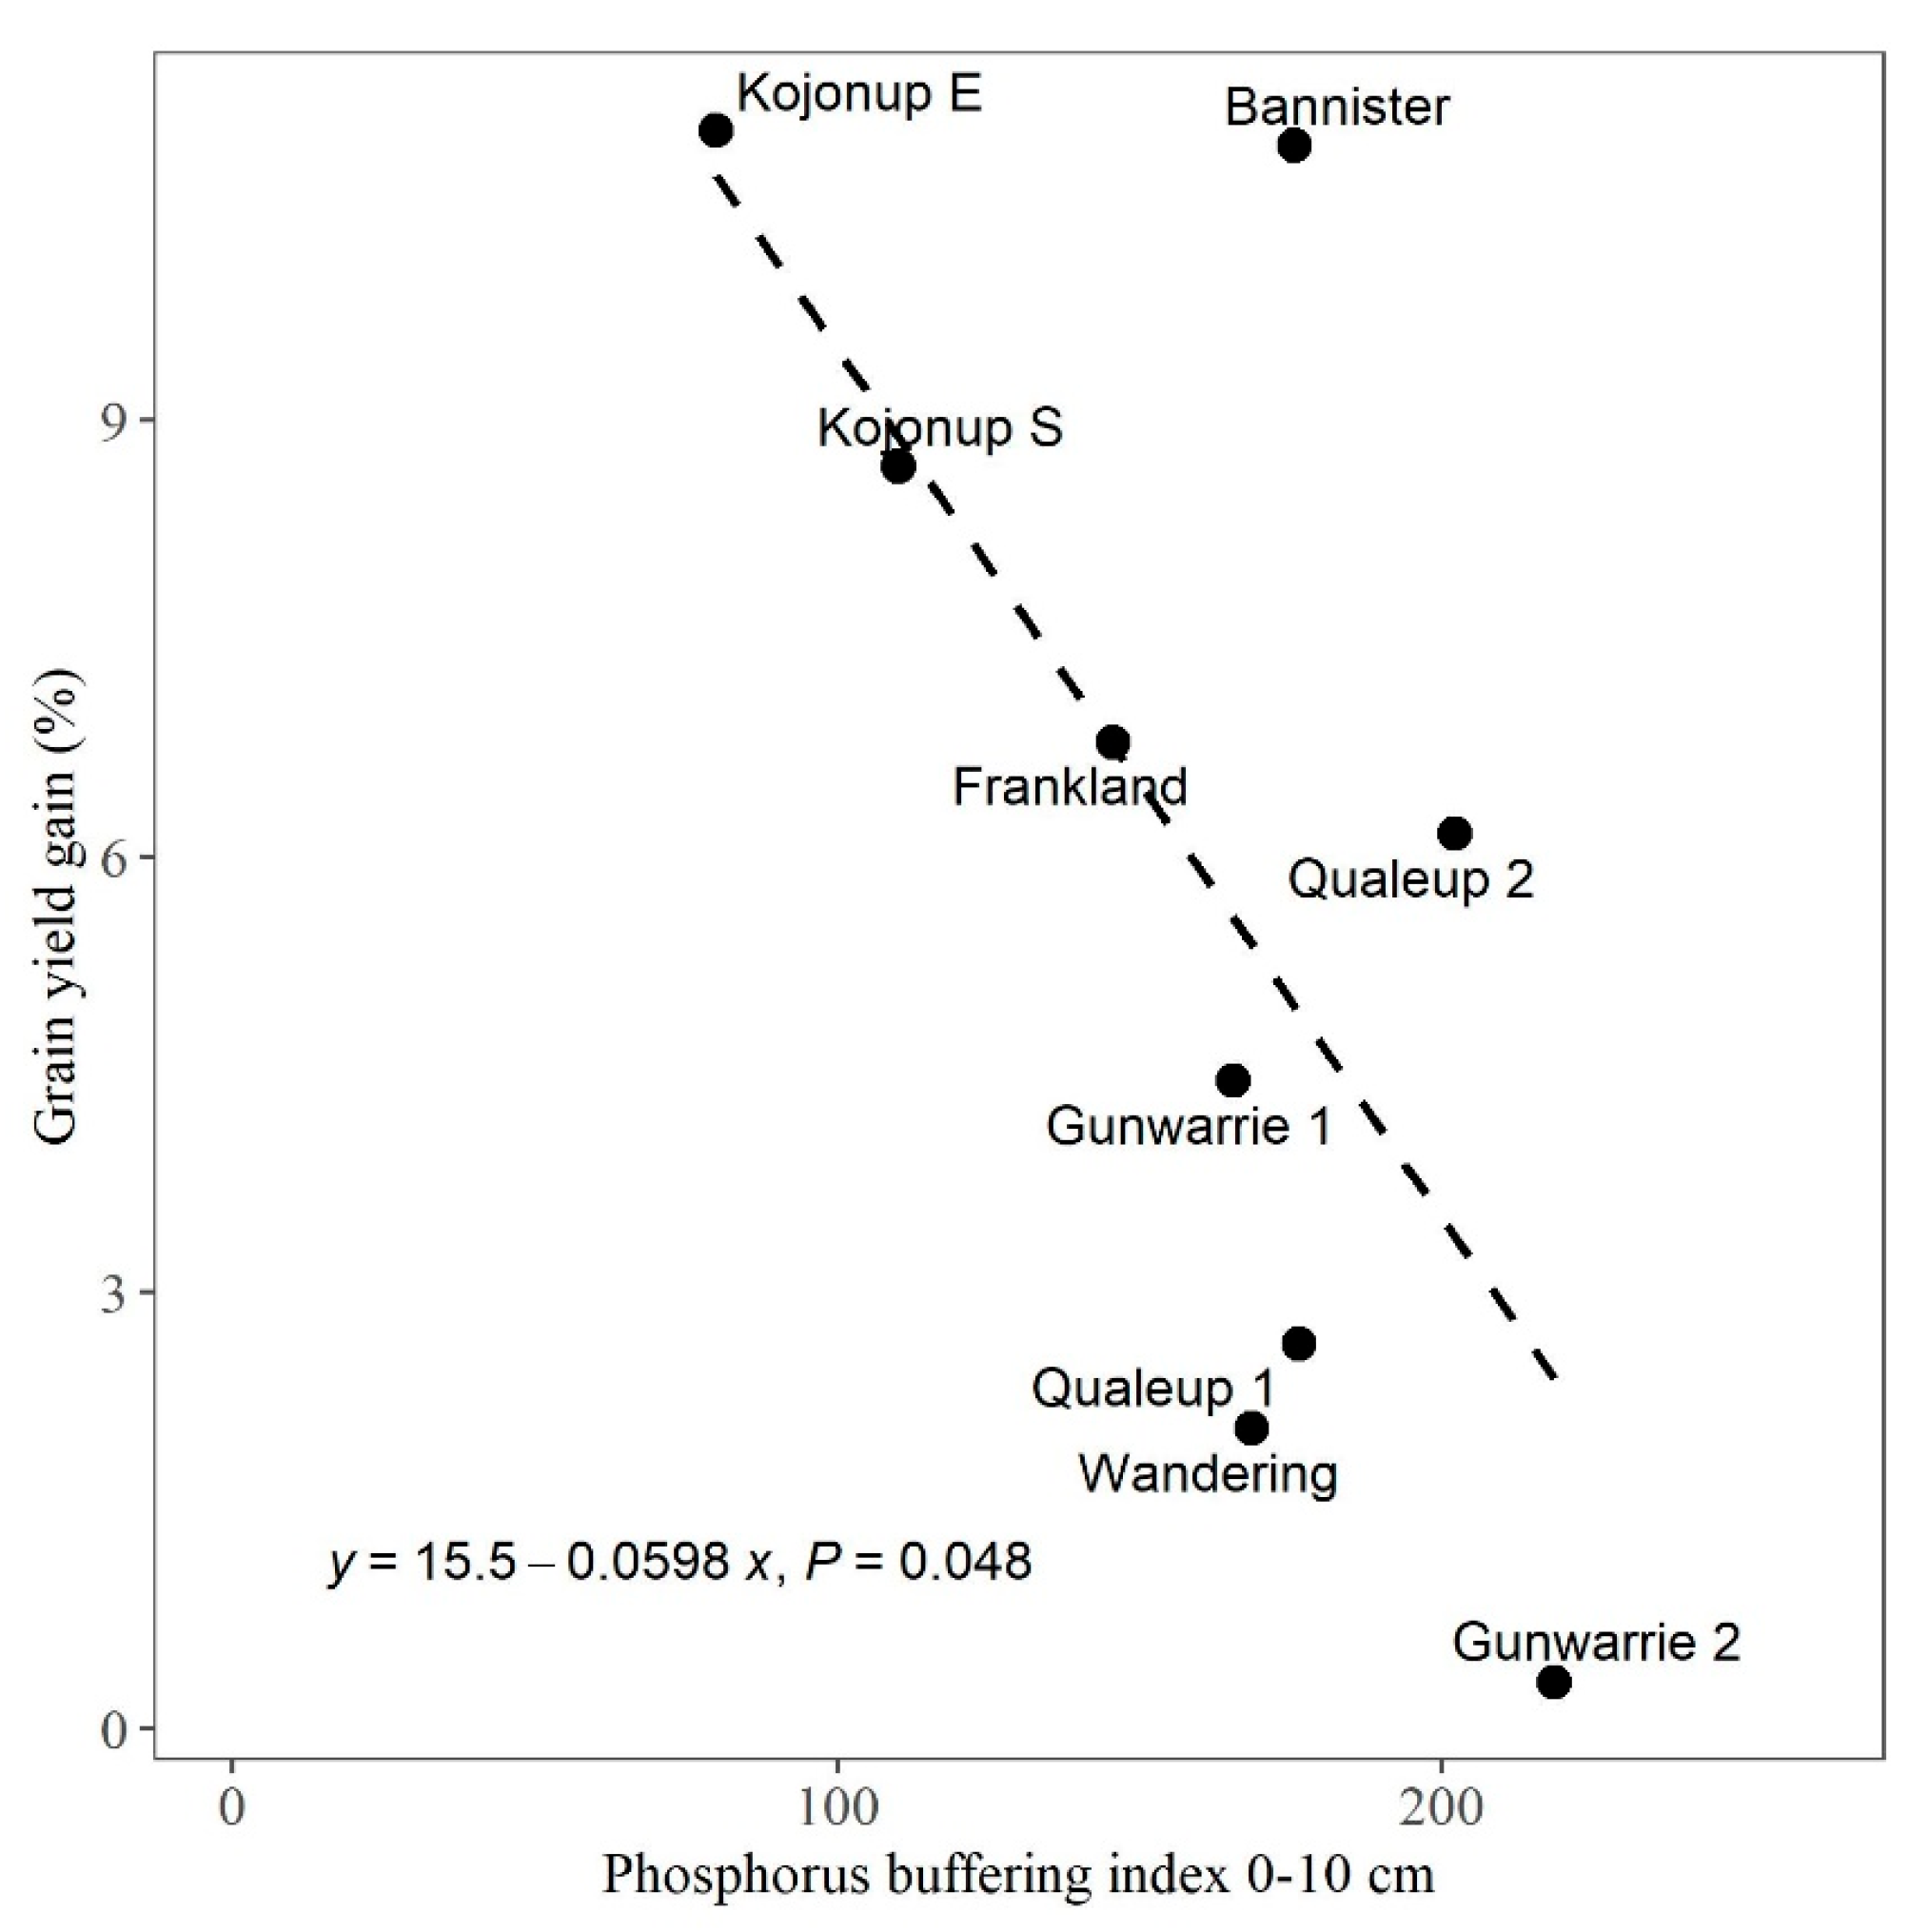
3.2. Relationships between Percent Yield Gain (% Response) Due to Foliar P Application and Site Factors

Regression analysis showed a significant (p < 0.05) relationship between the percent yield increase due to foliar P application and PBI (Figure 5). The relationship with PBI was linear and negative (r = −0.67, p = 0.047); i.e., the highest percent yield gain occurred at sites with the lowest PBI values. The correlation between percent yield gain and the other site variables measured (shoot N, P, K, S, Zn, Mn concentrations, applied N, P, K, soil DGT-P, PCol, KCol, and SOC) was not significant (p ≥ 0.05).

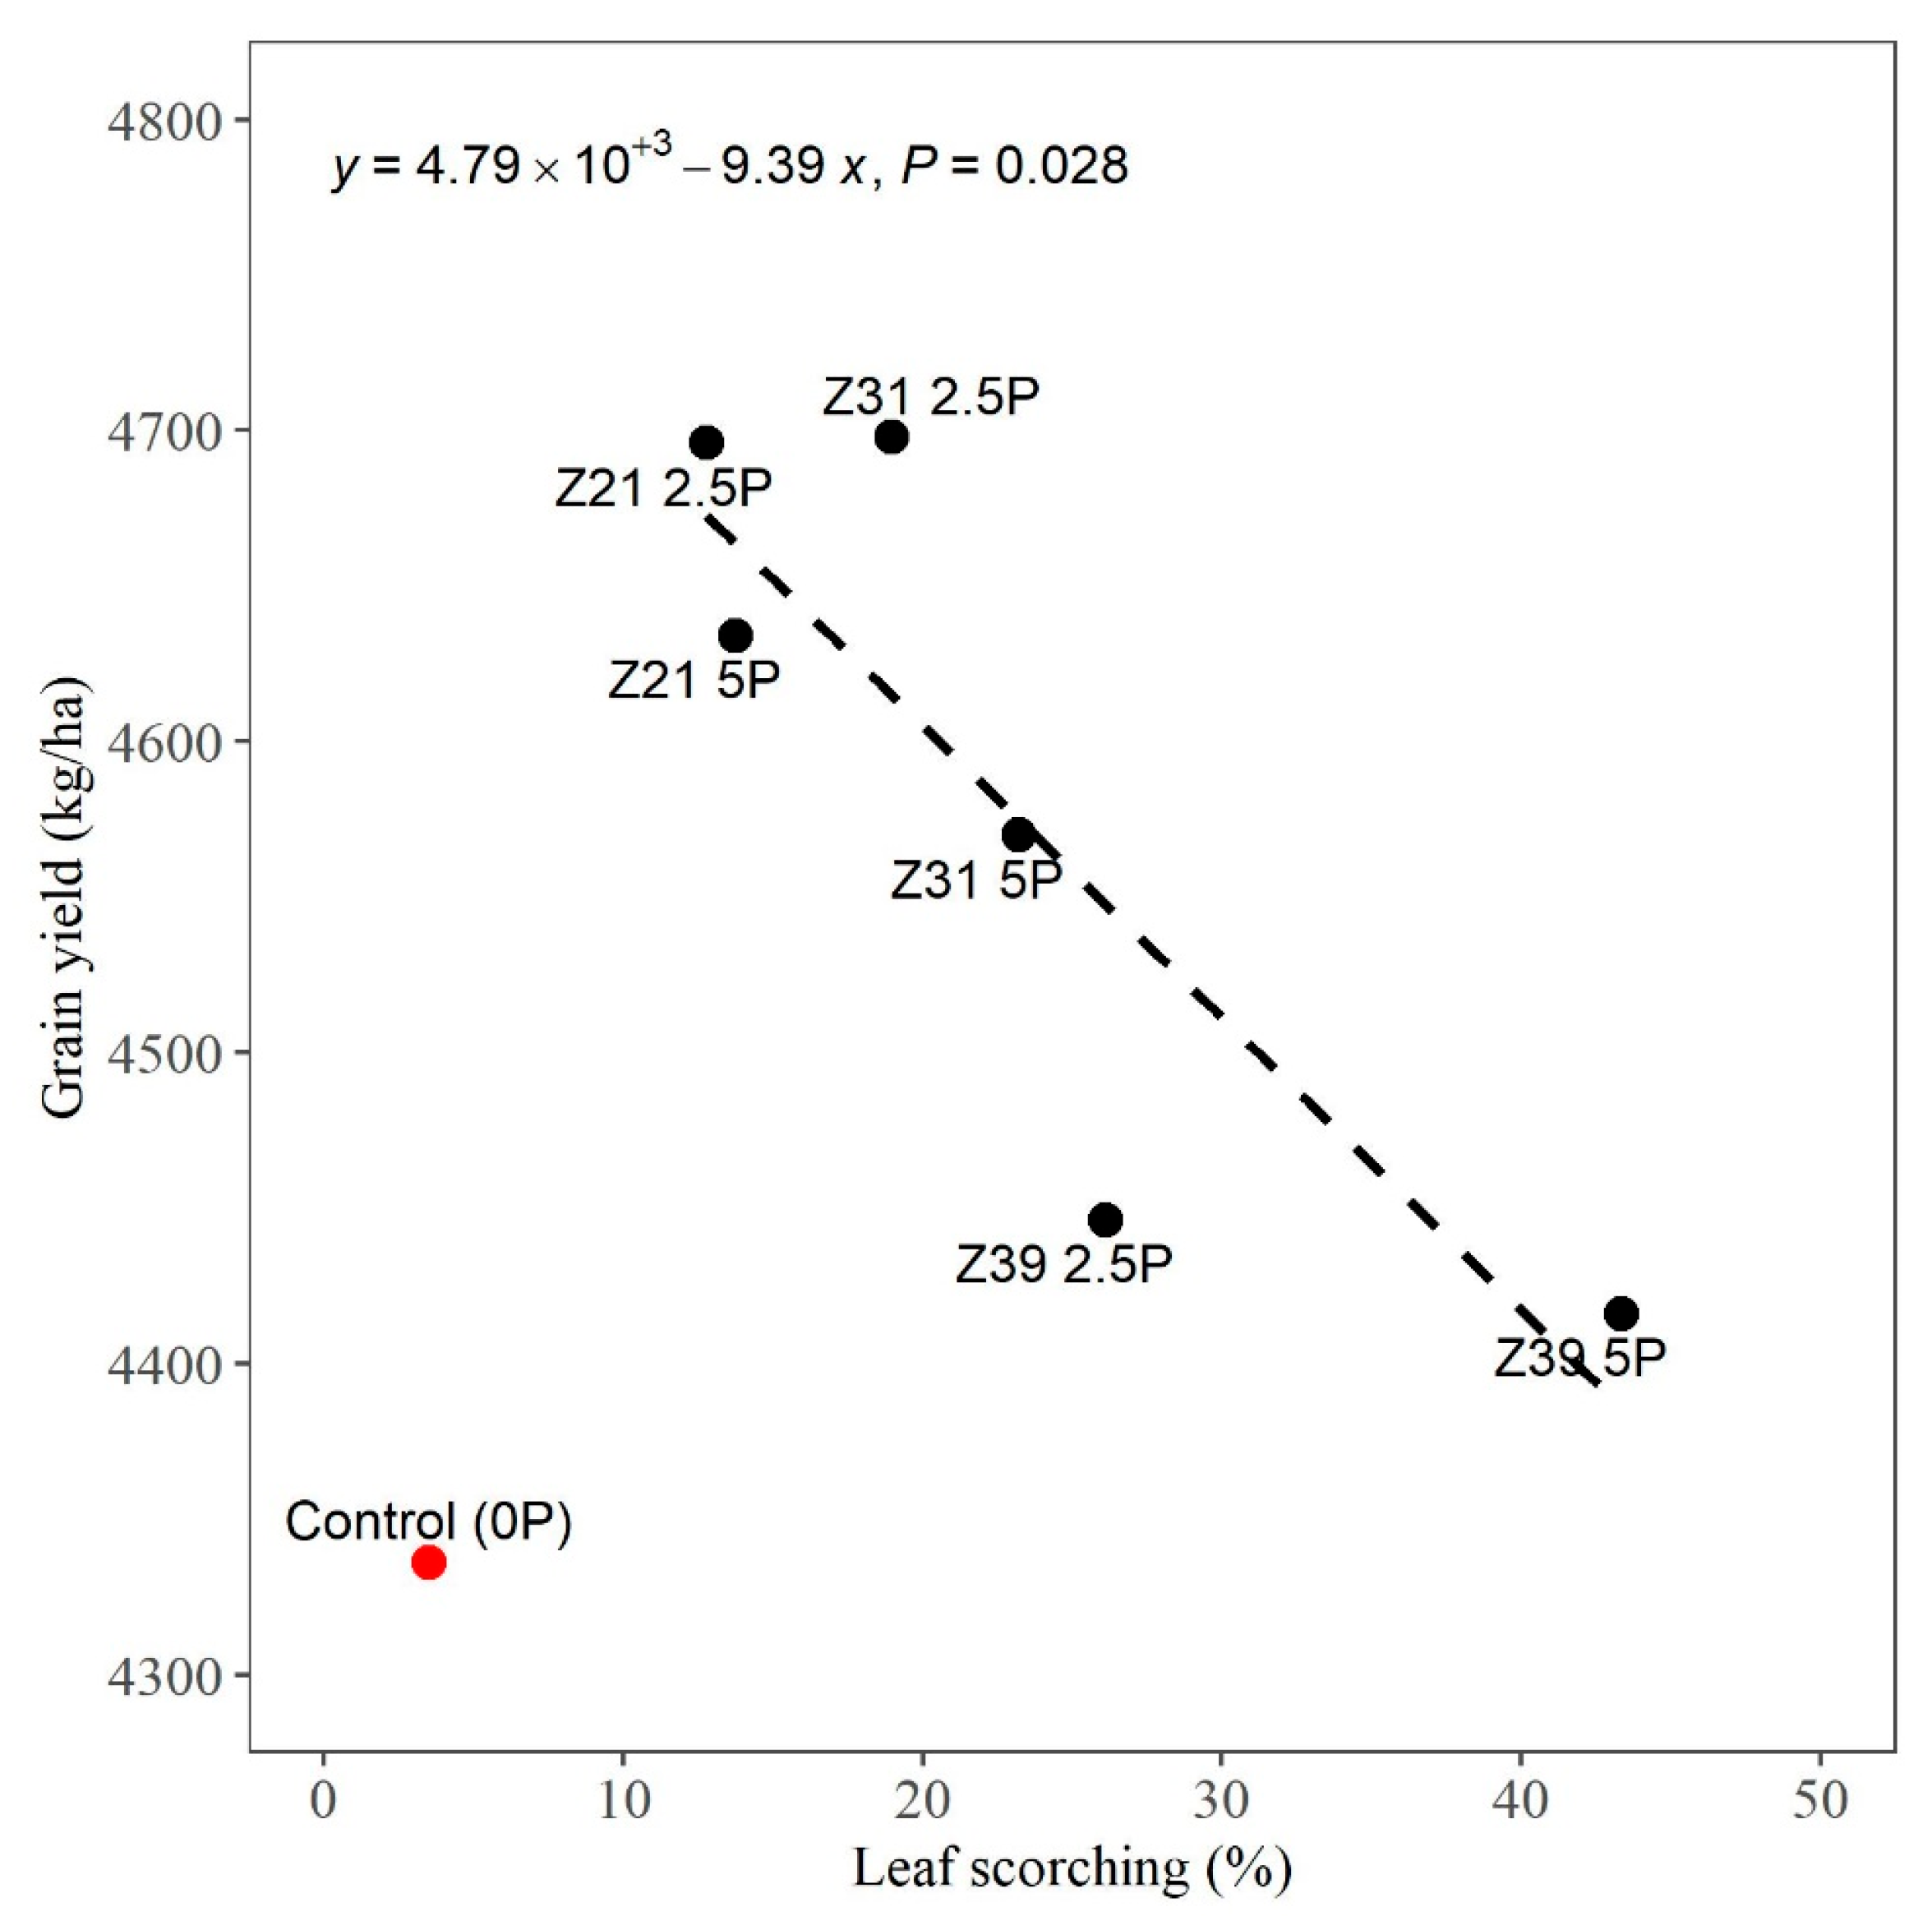
3.3. Relationship between Grain Yield and Leaf Scorching

An interaction between P rate and P timing was detected for leaf scorching for six out of the nine experiments and in the combined analysis (p < 0.001) (Table 3). While leaf scorching significantly increased with delayed application (Z21 < Z31 < Z39), the effect of P rate varied with timing. For Z21, there was no effect of the P rate on scorching; for Z31, there was a small increase in scorching for 5 P compared to 2.5 P; and for Z39, there was a much larger increase in scorching at 5 P (43%) compared to 2.5 P (26%).
A negative relationship between grain yield and leaf scorching was detected (Figure 6) using mean values of the P treatments from the combined analysis. A regression model of Y = yield vs. X = scorching + experiment predicted a significant (p = 0.005) but modest yield reduction with a gradient of −6.7, e.g., a grain yield reduction of 67 kg/ha for each 10% increase in scorching.

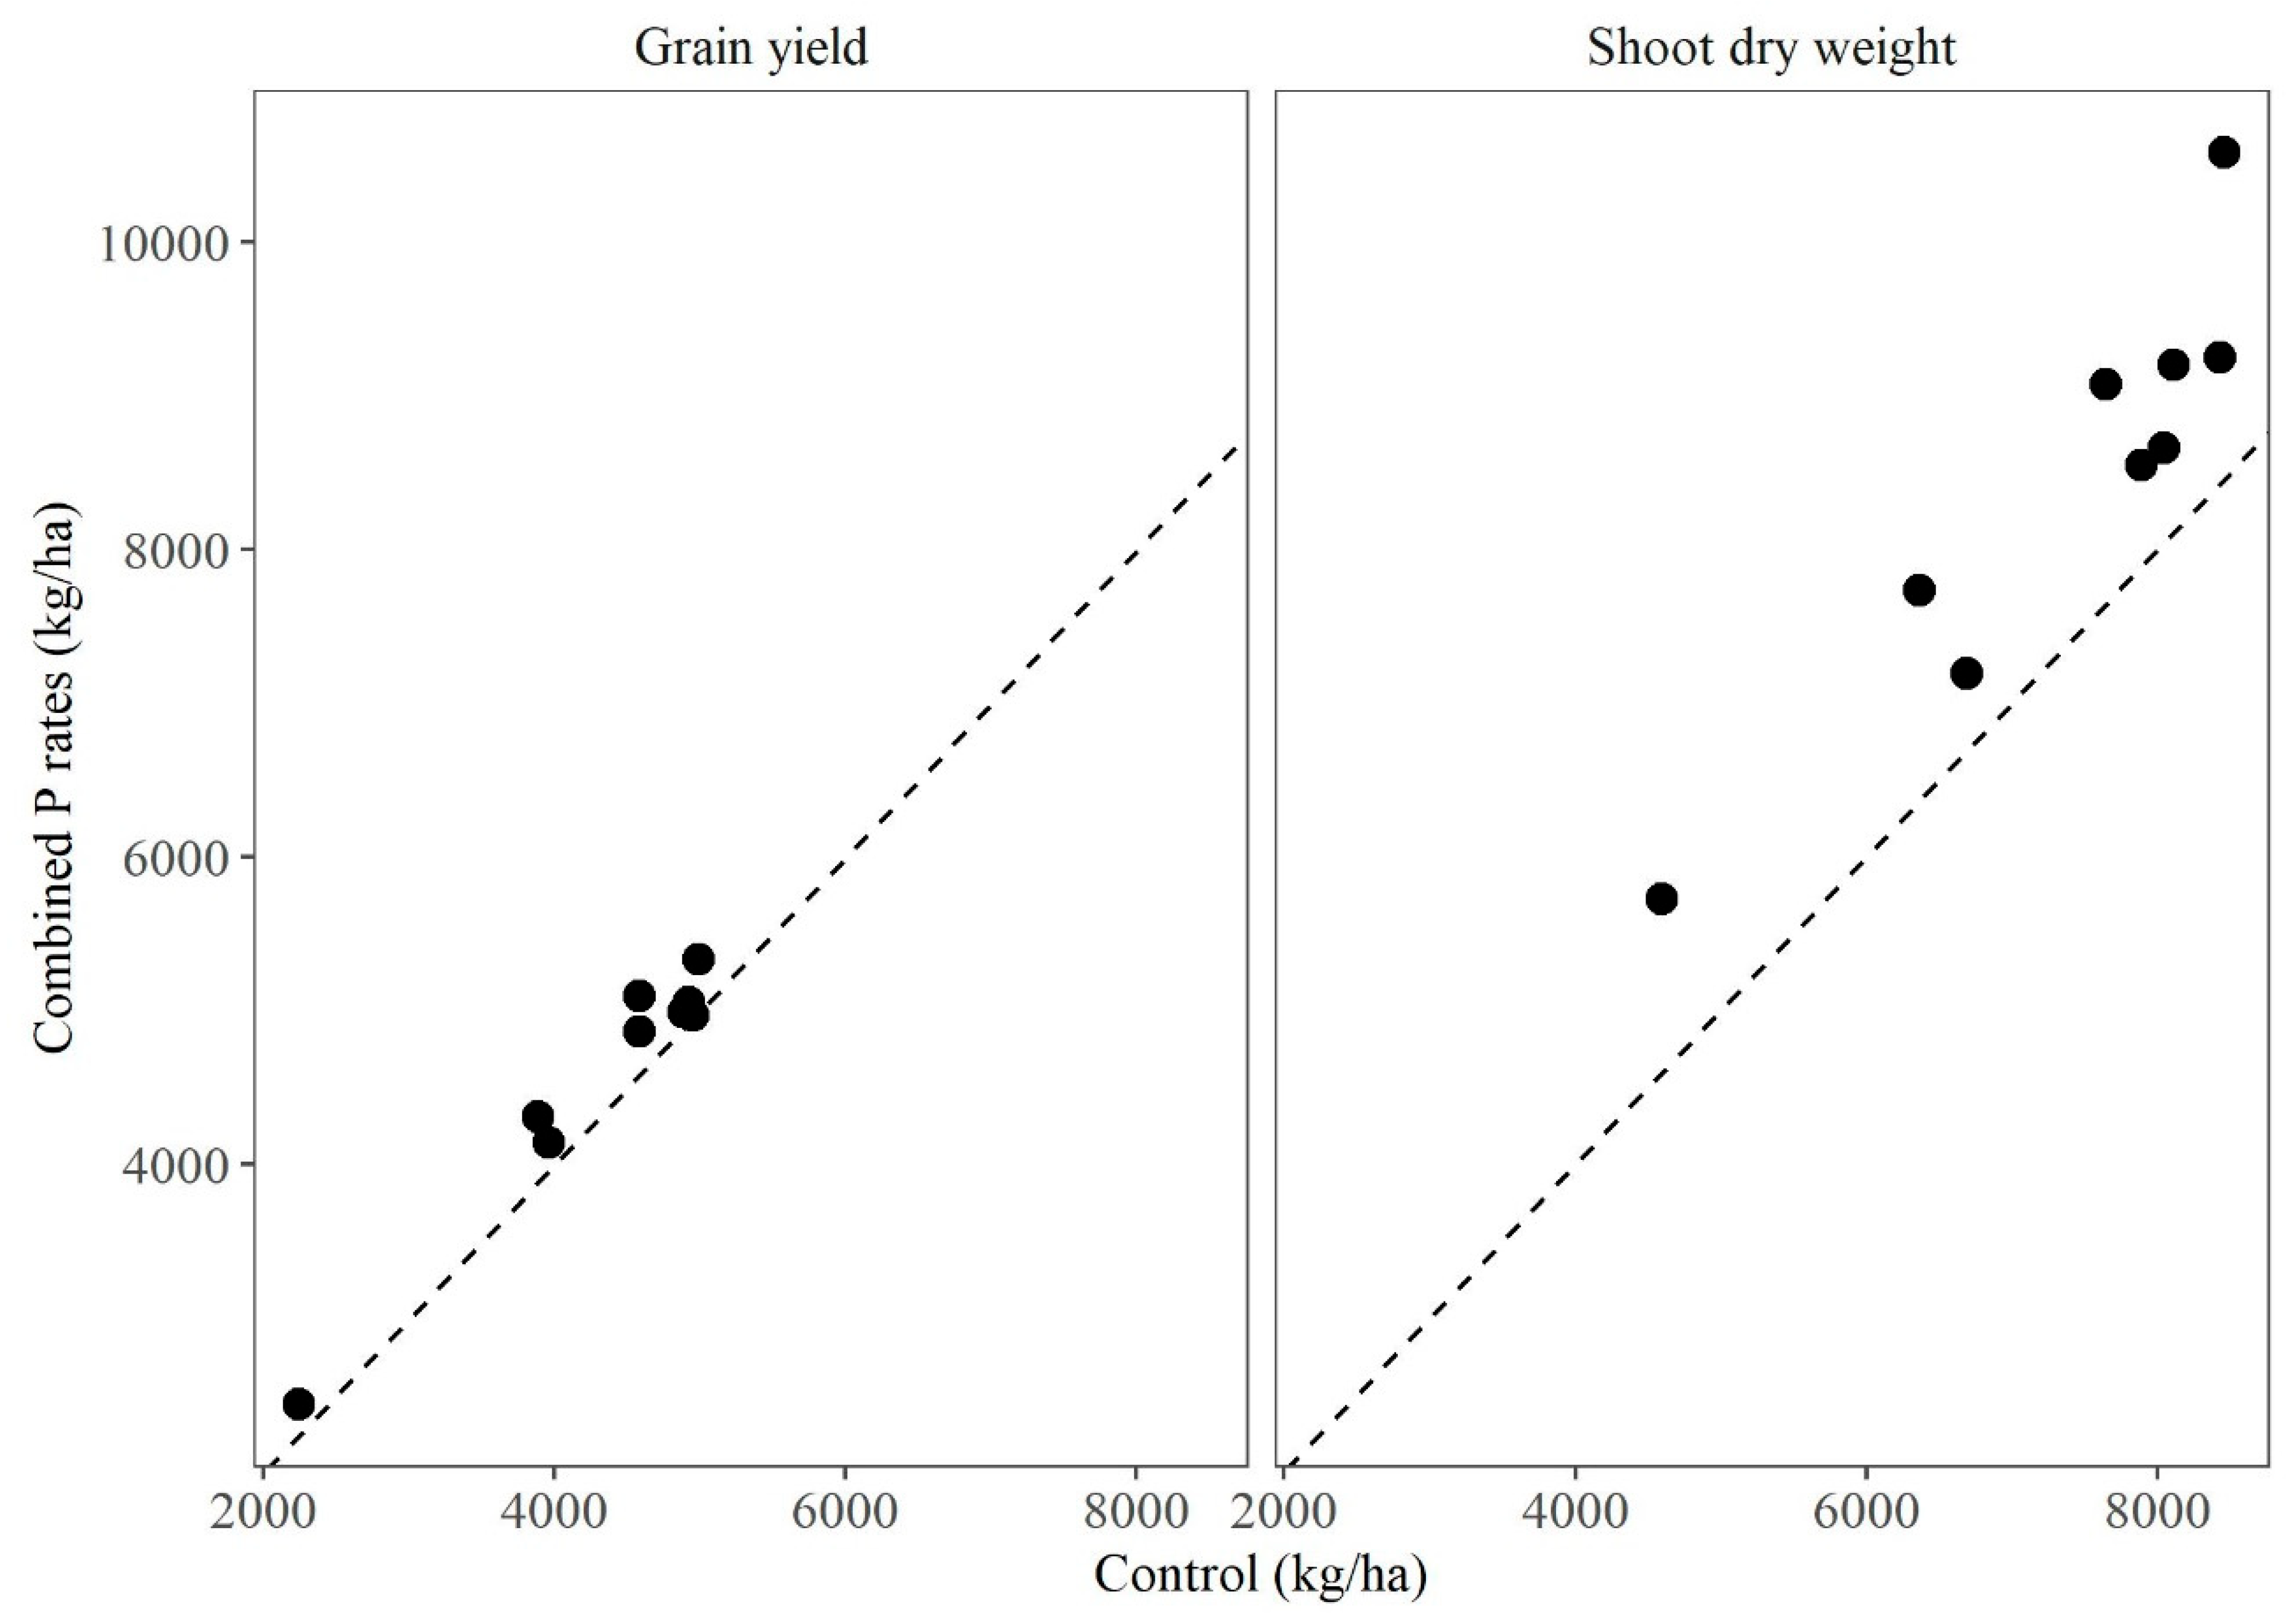
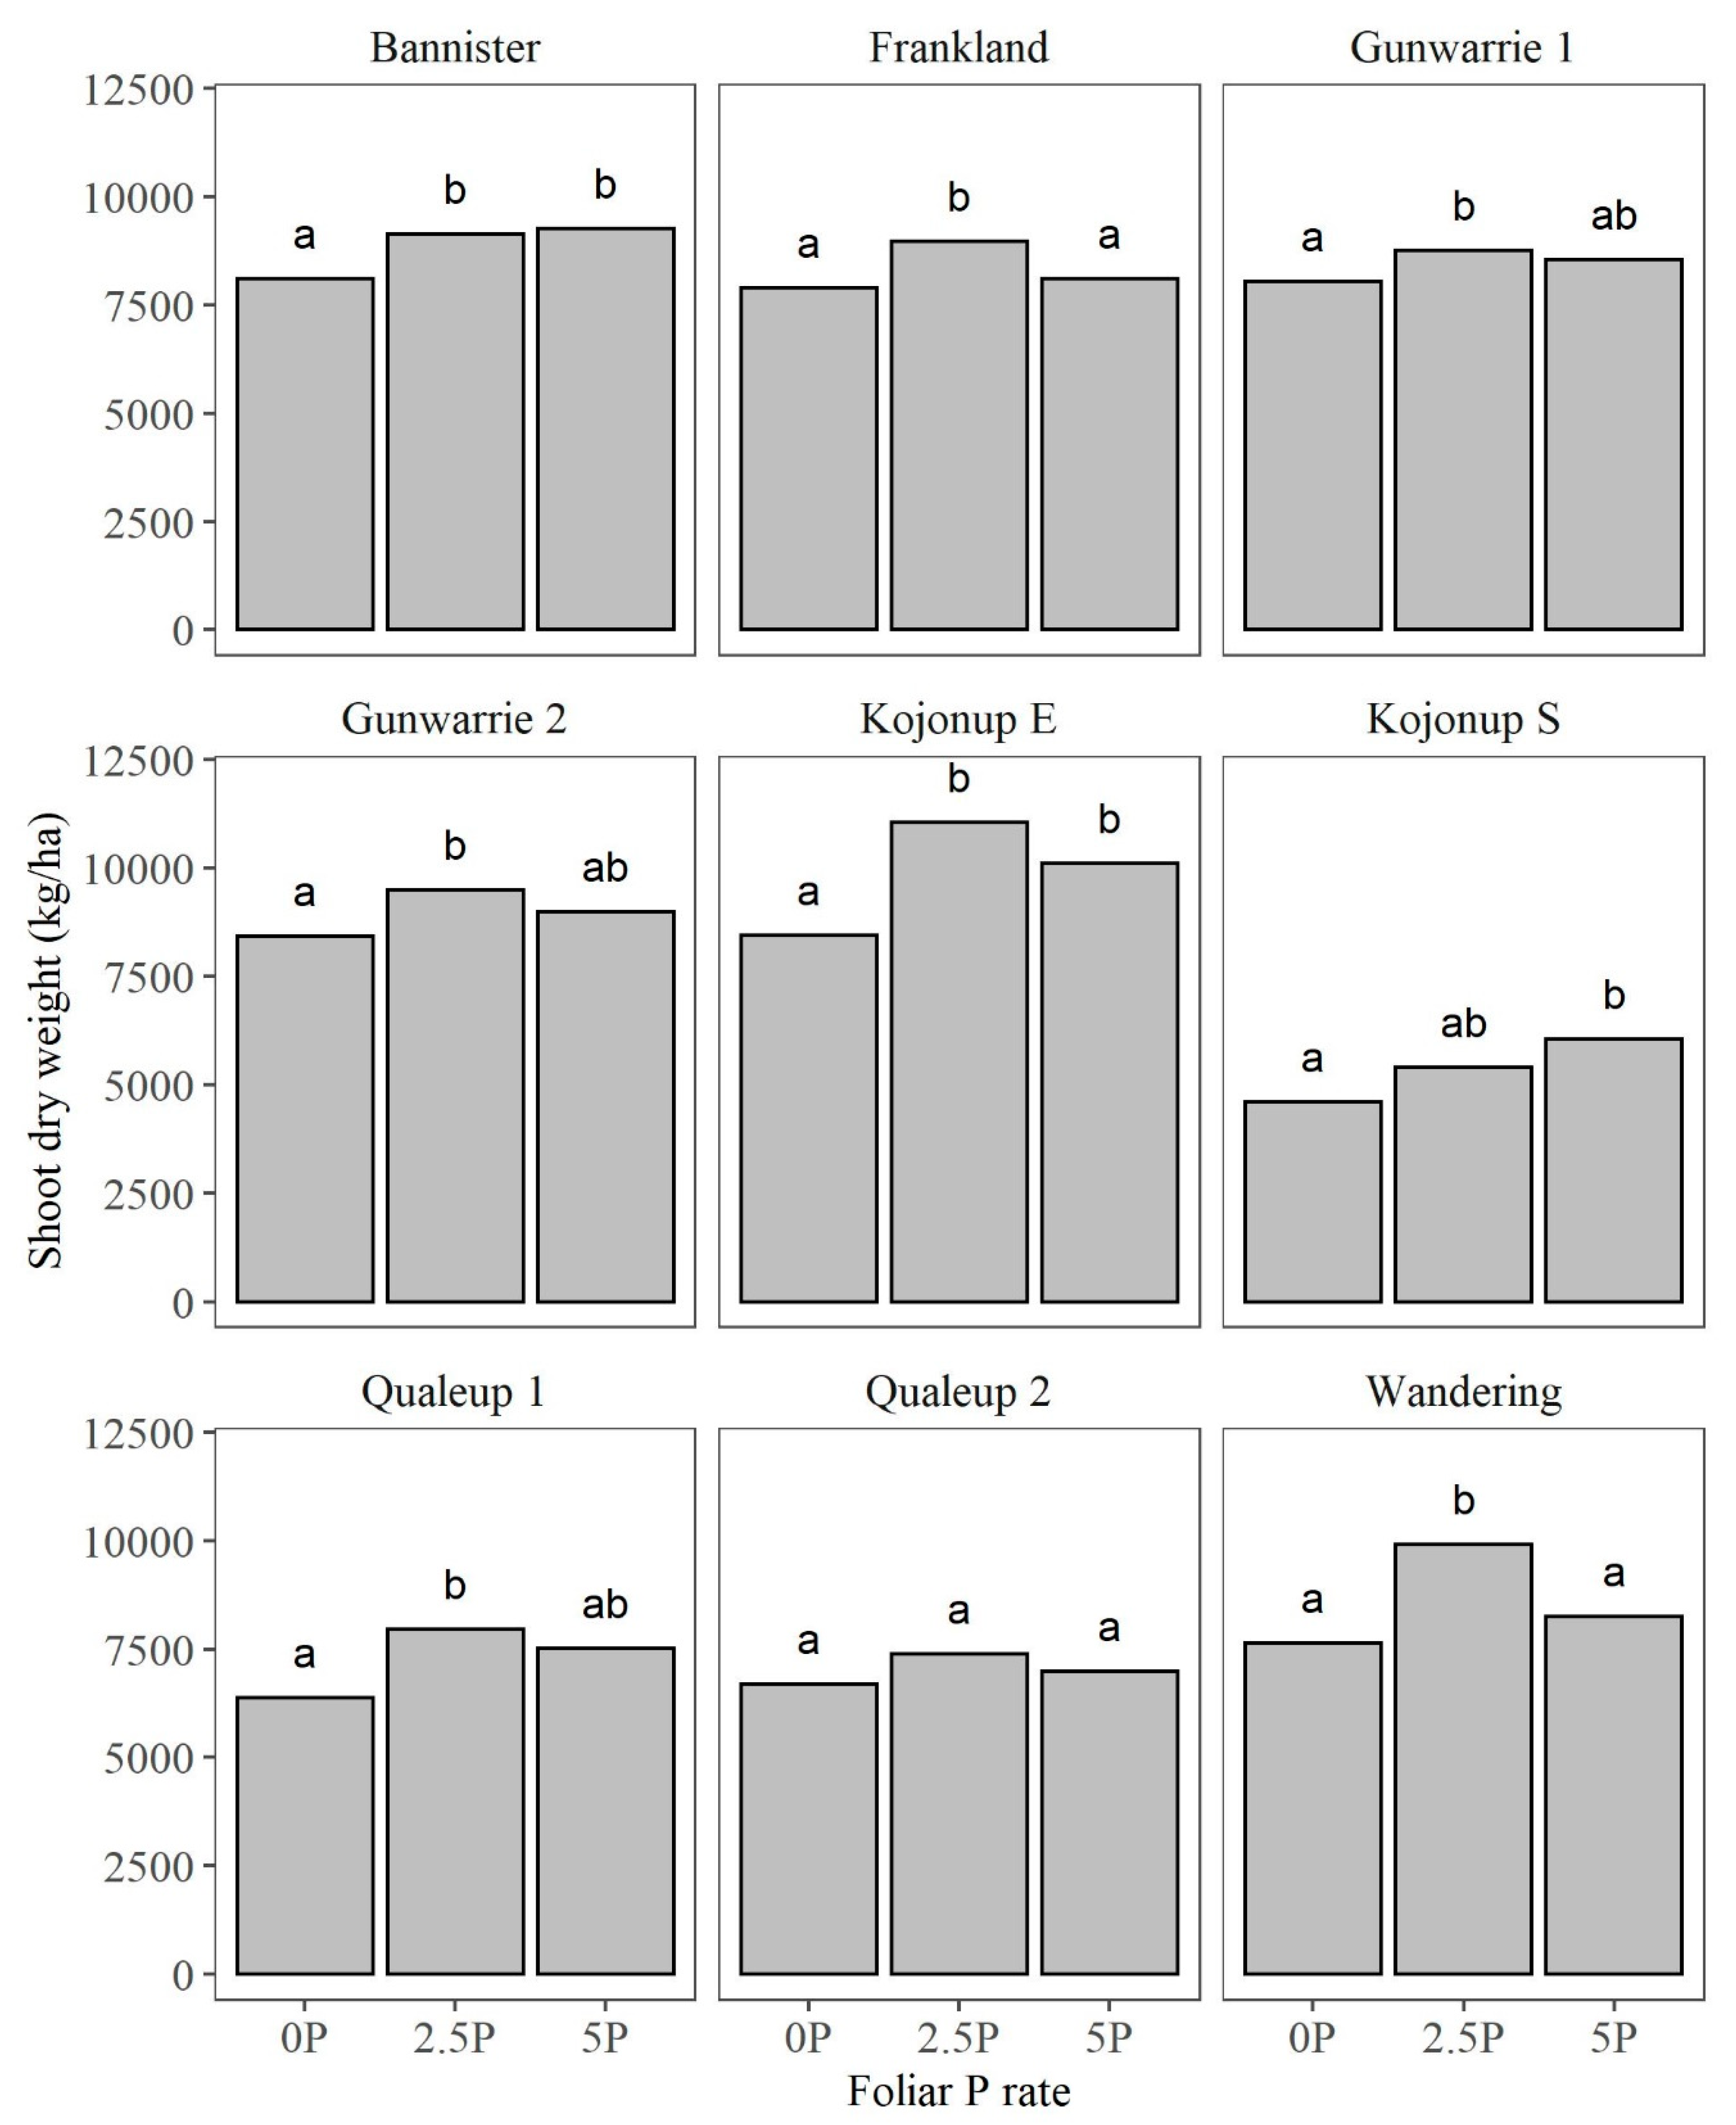
3.4. Shoot Dry Weight (SDW)

Shoot dry weight at anthesis significantly increased due to foliar P application in seven out of nine experiments (Control vs. applied P, Table 3; Figure 2). During these experiments, the increase in SDW due to foliar P ranged from 0.6 t/ha to 2.1 t/ha. For seven of the nine experiments, SDW significantly increased with 2.5 kg/ha P (Figure 7), with an average increase of 18%.
The combined analysis for all experiments showed that mean SDW increased from 7.4 t/ha to 8.4 t/ha (15% increase) by applying foliar P (Control vs. applied P, p < 0.001, Table 3).
The timing of foliar P application had a significant effect on SDW in four out of nine experiments, where a SDW reduction of 2.3 t/ha, 2.1, 1.7 and 1.2 t/ha was observed at Qualeup 1, Kojonup S, Qualeup 2 and Frankland experiments at Z39 compared to Z21. Combined analysis for all experiments showed that SDW declined with late applications with a reduction of 5% at Z31 and 9% at Z39 (p = 0.006, Table 3) compared to Z21.

3.5. Shoot P Concentration and Uptake at Anthesis

Applied P increased the shoot P concentration in four out of nine experiments (Control vs. applied P, Table 3). Combined analysis of all experiments showed that application of foliar P increased the shoot P concentration with an average of 3% and 19% increase at 2.5 P and 5 P treatments, respectively (p < 0.001, Table 3). Shoot P concentration at 5 P was the highest in six out of nine experiments (Table 4).
Combined analysis across all experiments showed that there was a significant interaction between P rate and timing effects on shoot P concentration at anthesis (p = 0.003, Table 3). The shoot P concentration of 0.18% at 5 P for the Z39 application was significantly higher than the 0.13% for the Control and all other treatments.
Foliar P application significantly increased wheat P uptake at anthesis in six experiments (Table 3). Across all experiments, P uptake increased from 9.6 kg/ha at 0 P to 11.7 kg/ha (21%) at 2.5 P and further increased to 12.8 kg/ha (33%) at 5 P (p = 0.006, Table 3). The timing of foliar P application had no significant (p < 0.05) effect on P uptake at any of the experiments except at Gunwarrie 2, where P uptake was lower at Z21.
Table 4. Effect of foliar P application rates and timings on P concentration and uptake in plant shoot and grain in nine experiments.
Experiment IDTreatmentsShoot P (%)Shoot P Uptake (kg/ha)Grain P (%)Grain P Uptake (kg/ha)
BannisterControl0.129.840.2812.13
2.5 P0.1211.420.2812.13
5 P0.1514.020.2912.38
Mean0.1311.760.2912.21
LSD (p < 0.05)0.022.340.010.54
Z210.1413.630.2812.09
Z310.1311.590.2812.15
Z390.1512.930.2912.52
LSD (p < 0.05)0.033.170.010.55
Kojonup SControl0.187.990.318.35
2.5 P0.158.140.318.23
5 P0.179.650.308.21
Mean0.178.590.318.26
LSD (p < 0.05)0.041.770.030.70
Z210.149.350.308.20
Z310.159.050.308.17
Z390.198.280.318.30
LSD (p < 0.05)0.042.010.030.74
Gunwarrie 1Control0.129.280.249.50
2.5 P0.1210.590.2510.44
5 P0.1210.660.2610.69
Mean0.1210.180.2510.21
LSD (p < 0.05)0.022.070.010.70
Z210.1210.340.2510.87
Z310.129.950.2510.48
Z390.1411.580.2610.35
LSD (p < 0.05)0.042.010.030.74
FranklandControl0.1511.460.2311.23
2.5 P0.1513.550.2513.43
5 P0.1814.340.2513.15
Mean0.1613.120.2412.60
LSD (p < 0.05)0.032.470.010.98
Z210.1513.620.2412.88
Z310.1714.450.2513.63
Z390.1713.760.2513.35
LSD (p < 0.05)0.043.740.011.19
Gunwarrie 2Control0.119.070.2210.79
2.5 P0.1110.110.2311.59
5 P0.1311.320.2311.02
Mean0.1110.170.2211.13
LSD (p < 0.05)0.021.900.021.08
Z210.108.830.2210.97
Z310.1211.180.2311.51
Z390.1312.150.2411.43
LSD (p < 0.05)0.022.360.021.61
Kojonup EControl0.1311.530.219.79
2.5 P0.1314.260.2311.70
5 P0.1615.490.2411.85
Mean0.1413.760.2311.11
LSD (p < 0.05)0.034.210.011.29
Z210.1415.300.2211.11
Z310.1313.000.2412.40
Z390.1616.300.2411.81
LSD (p < 0.05)0.035.860.011.45
Qualeup 1Control0.138.060.168.03
2.5 P0.1410.880.178.86
5 P0.1611.500.199.50
Mean0.1410.150.188.80
LSD (p < 0.05)0.021.840.010.99
Z210.1311.750.189.33
Z310.1511.500.189.44
Z390.1610.310.198.77
LSD (p < 0.05)0.032.820.021.37
Qualeup 2Control0.138.830.167.40
2.5 P0.1712.470.188.56
5 P0.1812.790.188.84
Mean0.1611.360.178.27
LSD (p < 0.05)0.022.440.010.49
Z210.1713.730.188.85
Z310.1711.950.178.59
Z390.1912.210.198.67
LSD (p < 0.05)0.023.540.010.72
WanderingControl0.1410.610.157.37
2.5 P0.1413.870.178.81
5 P0.1815.270.188.47
Mean0.1513.250.178.22
LSD (p < 0.05)0.033.260.010.87
Z210.1412.040.168.10
Z310.1715.230.188.73
Z390.1716.460.189.10
LSD (p < 0.05)0.034.130.021.28

3.6. Grain P Concentration and Uptake

An increase in grain P concentration occurred at six sites due to foliar P application (Control vs. applied P, Table 3). At Kojonup E, Gunwarrie 1 and Qualeup 1, there was a significant grain P increase at 5 P compared to 2.5 P (Table 4). Timing of P application had a significant effect on the grain P concentration at Gunwarrie 2, Kojonup E and Qualeup 2, where grain P was higher with late application at Z39 compared to Z21.

3.7. P Efficiency Indices—Agronomic Efficiency (AE), P Use Efficiency (PUE) and Recovery Efficiency (RE)

Agronomic efficiency was significantly influenced by the foliar P application rate or timing in six out of nine experiments (Table 3) and was higher at 2.5 P compared to 5 P treatment (Figure 8) in the combined analysis. The highest AE at 2.5 P of 232 kg/kg was observed at Kojonup E, followed by Frankland 179 kg/kg and four other sites above 100 kg/kg (Table 5). The highest AE at 5 P of 112 kg/kg was observed at Bannister, followed by 86 kg/kg at Kojonup E. Across all experiments, the AE decreased from 111 kg/ka at 2.5 P to 41 kg/kg at 5 P treatment (Table 5).
Table 5. Effect of foliar P application rates on P on agronomic efficiency (AE) and phosphorus use efficiency (PUE) in nine experiments. (NS = Non-Significant).
P Rates (kg/ha) P Rates (kg/ha)
Experiment ID2.5 P5 PMeanLSD
(p ≤ 0.05)
2.5 P vs. 5 P
2.5 P5 PMeanLSD
(p ≤ 0.05)
2.5 P vs. 5 P
AEPUE
Bannister114112113NS0.000.050.03NS
Kojonup S565053NS−0.04−0.03−0.04NS
Gunwarrie 11022061740.380.240.31NS
Frankland179461131270.880.380.630.33
Gunwarrie 225−69NS0.320.050.19NS
Kojonup E232861591460.760.410.59NS
Qualeup 1681843NS0.330.290.31NS
Qualeup 21036182NS0.460.290.380.17
Wandering121−2051950.140.010.08NS
Combined analysis1114176360.360.190.270.10
The AE was also affected by the timing of foliar P application. The AE declined as the time of application was delayed from Z21 to Z39 (Figure 8). Combined analysis across all experiments showed that AE declined from 102 kg/kg at Z21 to 30 kg/kg at Z39 (p < 0.05).
P rates also had an effect on PUE, and it declined at higher P rates. When the P rate increased from 2.5 P to 5 P, the PUE at Frankland decreased from 0.88 kg/kg to 0.38 kg/kg (p = 0.006) and at Qualeup 2 decreased from 0.46 kg/kg to 0.29 kg (p = 0.039) (Table 5).
Averaged over all experiments, the PUE declined from 0.36 kg/kg at 2.5 P to 0.19 kg/kg at 5 P (Table 5). The timing of foliar P application did not have an effect on PUE in any of the experiments.
There was no effect of foliar P rate on RE in any of the experiments, and only one experiment showed a significant (p < 0.05) effect of foliar P timing. The grand mean RE for 2.5 P and 5 P from the combined analysis was 0.73 kg/kg.

3.8. Grain Quality Response to Foliar P

No treatment effect on grain protein or average grain weight was detected at any of the sites. Treatment effects on hectolitre weight were only detected at Kojonup S, which was lower at 2.5 P and 5 P compared to 0 P.

4. Discussion

This research demonstrates that foliar P has the potential to increase the P concentration in wheat shoot and grain, increase P uptake, and increase grain and biomass yield and P use efficiency indices, when P deficiency is detected early in the season.

4.1. Grain Yield Response to Foliar P in Relation to Soil PBI

Our analysis showed that PBI was the key soil property controlling the yield response of wheat to foliar P. The grain yield increase due to foliar P was highest at sites where PBI was in the very low category (36 to 70) and lowest at sites where PBI was moderate (>140) [25]. The negative relationship between percent yield gain and PBI observed in this study is attributed to the increasing adsorption of foliar P by the soil at higher PBI levels and, consequently, decreasing availability of the applied P to the plant. The impact of PBI suggests that some of the applied P is taken up from the soil, which was not intercepted by the plant canopy. The average canopy area for spray interception was 54, 81 and 83% at Z21, Z31 and Z39, respectively, meaning that 46, 19 and 17% of foliar P fell on the soil surface at these growth stages and was subjected to sorption. Previous work has shown that fertiliser that is applied to soil is readily adsorbed, whether in a liquid or granular form and, hence, reduced availability depending upon the P fixing capacity of the soil [30,31]. The negative relationship of grain yield and soil PBI may also be due to the low rates applied (2.5 and 5.0 kg P/ha) being insufficient to overcome deficiency at high PBI levels.

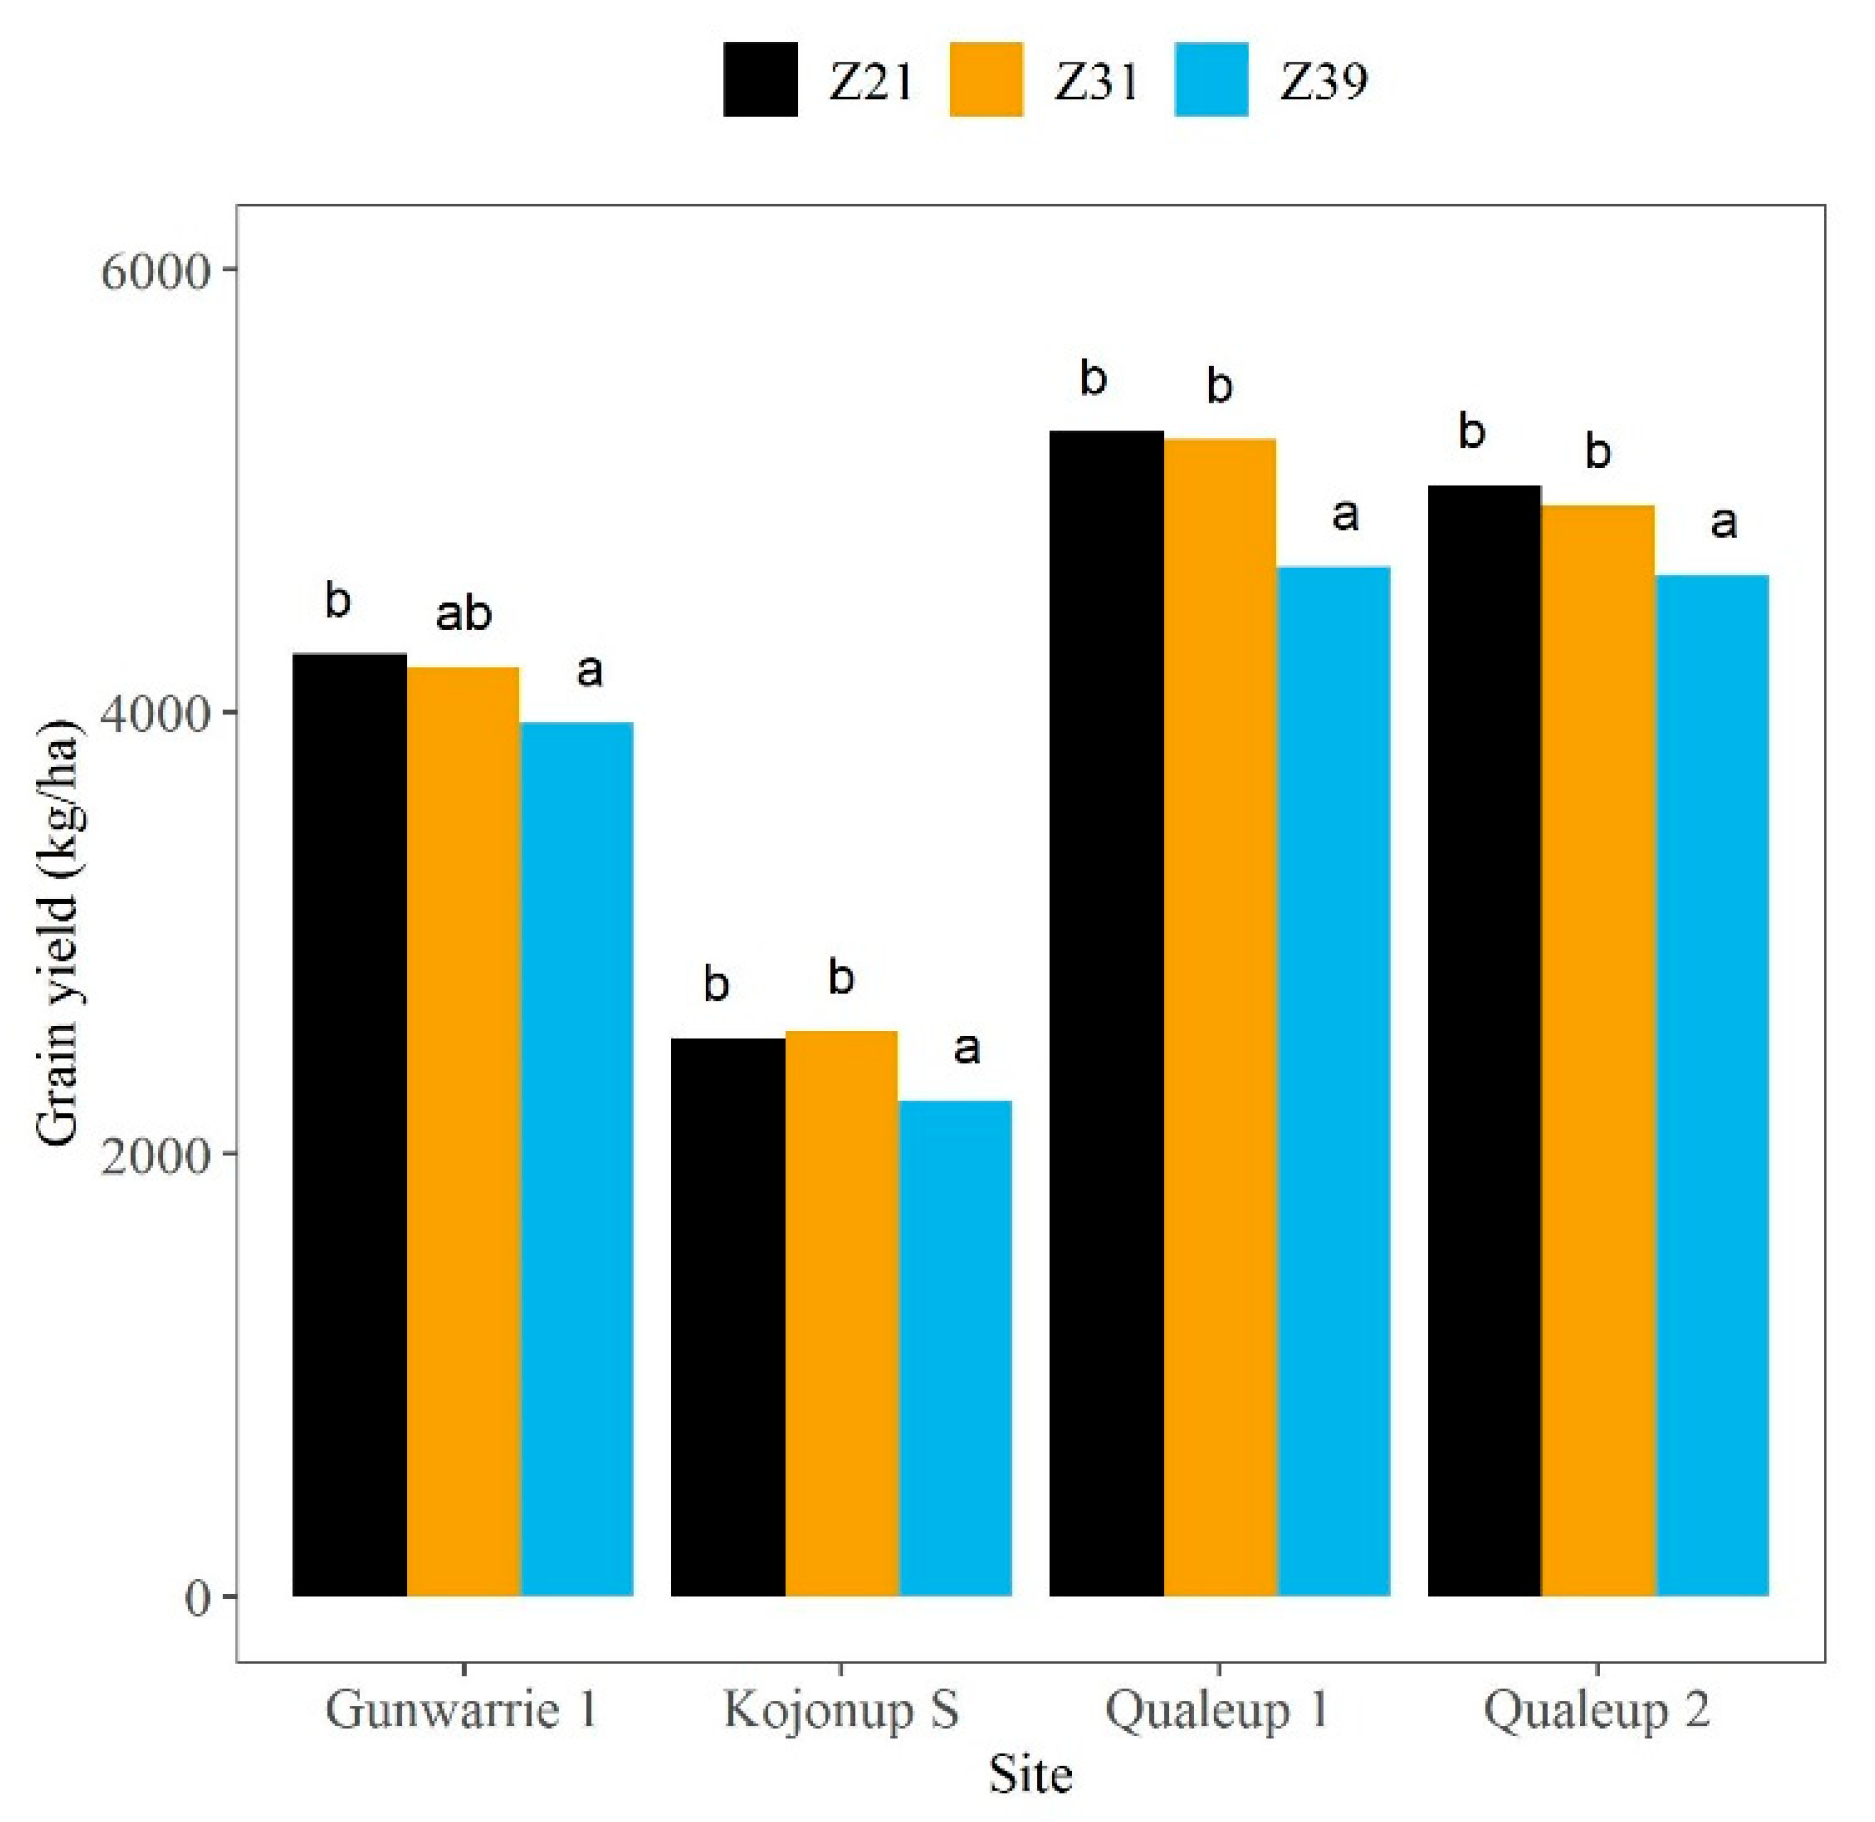
4.2. Grain Yield in Relation to Foliar-Applied Foliar P Rates, Timing, and Leaf Scorching

The timing of foliar P application was more important than the rates for yield response to foliar P. Grain yield was higher when the foliar P was applied early at Z21 or Z31 compared to later at Z39. This could be because, when P was applied at Z21, plants had a longer period of opportunity to recover from transient leaf scorching measured at Z65 compared to when applied at later stages, particularly at Z39. It is also plausible that new leaves emerged after foliar P treatment at this stage and continued until late tillering (Z24) [32,33]. Both the timing and rate of P application determined the level of leaf scorching, impairing leaf metabolism [34,35] and affecting P uptake and grain yield. The reduction in yield could also be due to differences in general or localised cell death (phytotoxicity), as has been documented for foliar-applied N fertilisers [36] and herbicides [37]. The phytotoxicity might have reduced the photosynthetic activity [38] and the ability of the cells to translocate P and other nutrients from the treated leaves to other plant parts [39].
The effect of timing in the current study is contrary to previous work in a glasshouse experiment [39]. In our study, maximum yield benefits were achieved with earlier P applications at Z21 and Z31 rather than late (Z39), whilst in a glasshouse study [39], early application (Z21) resulted in leaf damage, which reduced the plant’s ability to translocate nutrients. Our results are also contrary to a field experiment where delayed foliar P applications of different salts did not adversely affect leaf greenness [40], thus supporting continued photosynthesis during grain filling compared to without the foliar P, where more rapid senescence occurred. In our experiments, we used NDVI as a surrogate of leaf greenness (chlorophyll retention) [41] as the experiments were free of weeds and foliar diseases. Our observations of combined analysis at anthesis (Z65) showed that plants were significantly (p < 0.05) greener for the Z21 treatment (NDVI 0.64) than the Z39 treatment (NDVI 0.58).
The impact of foliar P application detected in this study can be attributed to the role of P in tiller initiation and survival as it is associated with the tissue P concentration. A study by [2] showed that at shoot P concentrations of less than 0.42% at tillering, the heterogeneity in the plant population increased with respect to the number of plants bearing a certain tiller, and at a shoot P concentration of 0.17%, the wheat tillering ceased completely. The tissue P concentration in our study ranged from 0.27 to 0.48% from the Z11 to Z21 growth stages, with a mean and median value of 0.35, and 75% of data values were above 0.32%. These shoot P concentrations are well within the reported tillering window, and, as a result, foliar P might have improved plant tillering capacity at early applications.

4.3. P Efficiency Indices

The values for AE observed in this study were high compared to values reported for granular P. The highest AE at 2.5 kg P/ha was 232 kg/kg P observed at the Kojonup E site and was over 100 kg/kg at five other sites. The mean AE for the 2.5 kg P/ha from the combined analysis was 111 kg/kg. These AE values are far higher than the AE value of granular P fertiliser reported in the literature, e.g., an average AE of 10.2 kg/kg P from 90 wheat experiments in China [42] and 17 kg/kg P from 53 wheat experiments in eastern Australia [43]. Our results are comparable to an 8-site year study [44], where the average AE in maize was higher for the foliar P application (350 kg/kg P) than for the granular band-applied (27 kg/kg P) and broadcast (6 kg/kg P). The PUE at Frankland (63%) and Kojonup E (59%) with relatively low PCol was higher than the rest of the experiments. These values are greater than 9.1% [45], estimated from 865 observations from 82 studies globally and 12–18% in Australia [46,47]. It should be noted that in this study, we did not measure the efficiency indices of soil-applied granular P, so any comparison of P efficiencies indices of foliar-applied P with that of granular P should be considered in context.

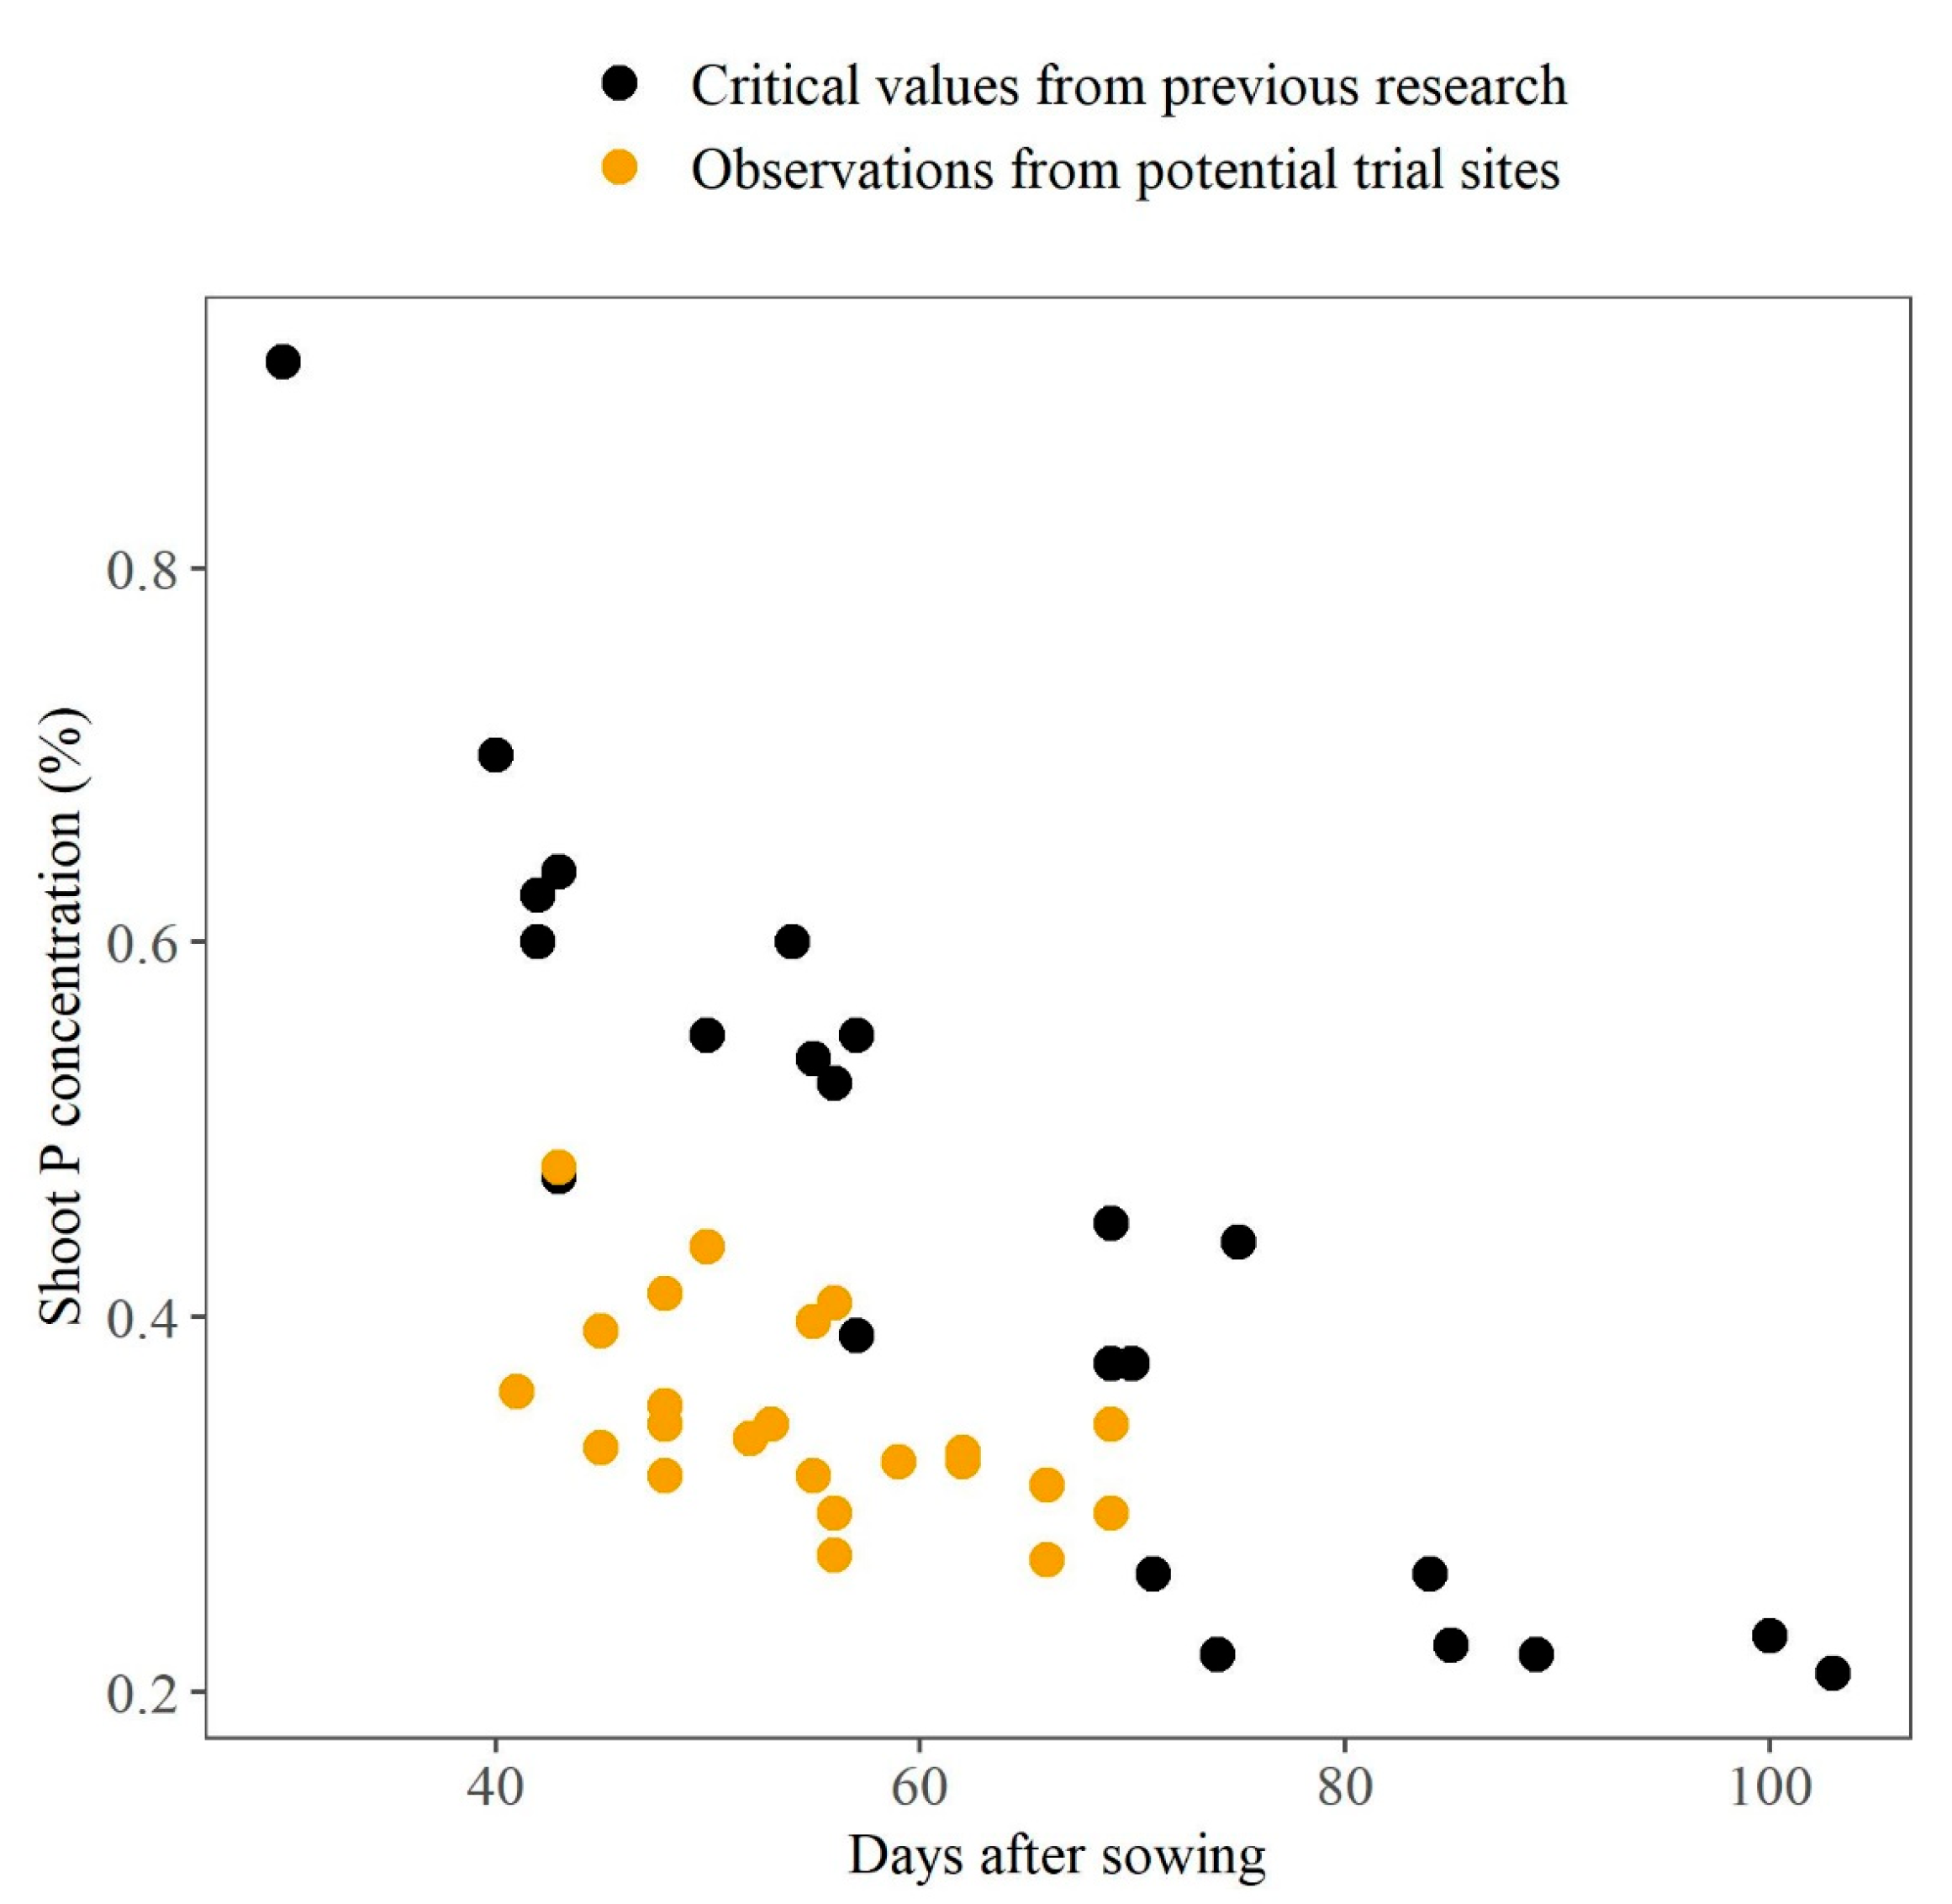
4.4. Value of Tissue Testing in Early Crop Growth

This study also demonstrated the value of plant tissue testing in early crop growth as soil testing alone may not be sufficient in determining whether to use foliar P. The soil PCol in all of our experiments was above the critical value of 20 to 21 mg/kg [28] for the soils used in this study (Chromosols, Tenosols and Sodosols) [28], suggesting there would be no response to fertiliser P. However, tissue testing identified P deficiency early in the season, and significant yield responses from foliar P occurred. Importantly, the responses to foliar P were observed even though the farmers applied about 2-times the average rate (~10 kg/ha) for WA cropping systems [48]. Our tissue testing provides evidence that periods of P deficiency are occurring, despite relatively high rates of P applied at seeding. A survey of farmers’ fields on similar soil types after this experiment showed a similar result; 29 out of 40 wheat samples (73%) were below the critical shoot P concentration at the tillering growth stage, despite soil PCol (37–153 mg/kg) being above critical levels and P fertiliser application at sowing [49]. The evidence we have suggests that P deficiency in wheat at the seedling stage is common and that a combination of tissue testing and PBI (0–10 cm soil depth) are reliable indicators of whether a yield response to foliar P will occur.

5. Conclusions

This study demonstrated that foliar P application can be integrated with soil-applied P as a top-up strategy to correct transient deficiency to improve the grain yield in soils with varied levels of PBI.
The grain yield increased significantly at six of the nine sites by application of foliar P, with the yield response ranging from 176 kg/ha (4%) to 505 kg/ha (11%) relative to the Control. The grain yield response to foliar P was related to PBI (0–10 cm soil depth), and it was highest where the PBI was low. The timing of foliar P application was more important than rates in driving the yield response. The grain yield was higher when the foliar P was applied early at Z21 compared to later at the Z31 and Z39 stages. Leaf scorching experienced at later application stages combined with higher P rates resulted in reduced grain yields. Agronomic efficiency of foliar P at 2.5 kg P/ha in this study was about 6- to 11-times the AE reported for granular P. This research demonstrates that P deficiency in the seedling stage in wheat is occurring in SWWA and that foliar P has potential as a tactical top-up strategy to overcome deficiency and increase the grain yield.

Supplementary Materials

The following supporting information can be downloaded at: https://www.mdpi.com/article/10.3390/agronomy14081630/s1, Table S1. Monthly rainfall and temperature of nine foliar applied P experiments conducted in SWWA in 2021–2022. Data sourced from Bureau of Meteorology (BOM) Australia and Department of Primary Industries and Regional Development (DPIRD) Western Australia weather stations.

Author Contributions

Conceptualization, R.M. and C.S.; methodology, R.M. and C.S.; formal analysis, R.M. and A.v.B.; data curation, A.v.B. and R.M.; writing—original draft preparation, R.M.; writing—review and editing, C.S., A.v.B. and B.S. All authors have read and agreed to the published version of the manuscript.

Funding

This research was funded by Grains Research and Development Corporation (GRDC) Australia, project number UWA1801-002RTX/UMU1801-006RTX.

Data Availability Statement

The original contributions presented in this study are included in the article/Supplementary Material; further inquiries can be directed to the corresponding author.

Acknowledgments

We gratefully acknowledge growers who hosted the experiments at their farms. Thanks to Doug Willock, Harmanpreet Kaur, and the Research Support Unit at Department of Primary Industries and Regional Development, Katanning, for providing technical assistance with the field experiments.

Conflicts of Interest

The authors declare no conflicts of interest. The funders had no role in the design of the study; in the collection, analyses, or interpretation of data; in the writing of the manuscript; or in the decision to publish the results.

References

  1. Nkebiwe, P.M.; Weinmann, M.; Bar-Tal, A.; Müller, T. Fertilizer placement to improve crop nutrient acquisition and yield: A review and meta-analysis. Field Crops Res. 2016, 196, 389–401. [Google Scholar] [CrossRef]
  2. Rodríguez, D.; Andrade, F.H.; Goudriaan, J. Effects of phosphorus nutrition on tiller emergence in wheat. Plant Soil. 1999, 209, 283–295. [Google Scholar] [CrossRef]
  3. Rodriguez, D.; Maria, G.S.; Pomar, M. Phosphorus deficiency affects the early development of wheat plants. J. Agron. Crop Sci. 1994, 173, 69–72. [Google Scholar] [CrossRef]
  4. Valle, S.R.; Calderini, D.F. Phyllochron and tillering of wheat in response to soil aluminum toxicity and phosphorus deficiency. Crop Pasture Sci. 2010, 61, 863–872. [Google Scholar] [CrossRef]
  5. Jacob, J.; Lawlor, D.W. Stomatal and mesophyll limitations of photosynthesis in phosphate deficient sunflower, maize and wheat Plants. J. Exppt. Bot. 1991, 42, 1003–1011. [Google Scholar] [CrossRef]
  6. Ali, M.S.; Sutradhar, A.; Edano, M.L.; Edwards, J.T.; Girma, K. Response of winter wheat grain yield and phosphorus uptake to foliar phosphite fertilization. Int. J. Agron. 2014, 2014, 801626. [Google Scholar] [CrossRef]
  7. Alston, A.M. Effects of soil water content and foliar fertilization with nitrogen and phosphorus in late season on the yield and composition of wheat. Aust. J. Agric. Res. 1979, 30, 577. [Google Scholar] [CrossRef]
  8. McBeath, T.M.; McLaughlin, M.J.; Noack, S.R. Wheat grain yield response to and translocation of foliar-applied phosphorus. Crop Pasture Sci. 2011, 62, 58–65. [Google Scholar] [CrossRef]
  9. McBeath, T.M.; Facelli, E.; Peirce, C.A.E.; Arachchige, V.K.; McLaughlin, M.J. Assessment of foliar-applied phosphorus fertiliser formulations to enhance phosphorus nutrition and grain production in wheat. Crop Pasture Sci. 2020, 71, 795–806. [Google Scholar] [CrossRef]
  10. Sherchand, K.; Paulsen, G.M. Response of wheat to foliar phosphorus treatments under field and high temperature regimes. J. Plant Nutr. 1985, 8, 1171–1181. [Google Scholar] [CrossRef]
  11. Torres, G.M. Foliar Phosphorus Fertilization and the Effect of Surfactants on Winter Wheat (Triticum aestivum L.). Master’s Thesis, Oklahoma State University, Stillwater, OK, USA, 2011. Available online: https://hdl.handle.net/11244/9374 (accessed on 6 May 2024).
  12. Harbi, S.F.A.; Ghoneim, A.M.; Modaihsh, A.S.; Mahjoub, M.O. Effect of foliar and soil application of phosphorus on phosphorus uptake, use efficiency and wheat grain yield in calcareous soil. J. Appl. Sci. 2013, 13, 188–192. [Google Scholar] [CrossRef]
  13. Mosali, J.; Desta, K.; Teal, R.K.; Freeman, K.W.; Martin, K.L.; Lawles, J.W.; Raun, W.R. Effect of foliar application of phosphorus on winter wheat grain yield, phosphorus uptake, and use efficiency. J. Plant Nutr. 2006, 29, 2147–2163. [Google Scholar] [CrossRef]
  14. Green, D.R.; Racz, G.J. The effect of foliar phosphate solution application on wheat yield and quality. In Proceedings of the Manitoba Soil Science Society Annual General Meeting, University of Manitoba, Winnipeg, Manitoba, 2 February 1999; pp. 90–96. [Google Scholar]
  15. Planfarm. Planfarm Benchmarks 2022; Planfarm Pty Ltd.; Bankwest Agribusiness Centre: Perth, WA, Australia, 2022; Available online: https://planfarm.com.au/resources/#benchmark (accessed on 8 May 2024).
  16. Mason, S.; McNeill, A.; McLaughlin, M.J.; Zhang, H. Prediction of wheat response to an application of phosphorus under field conditions using diffusive gradients in thin-films (DGT) and extraction methods. Plant Soil. 2010, 337, 243–258. [Google Scholar] [CrossRef]
  17. McQuaker, N.R.; Kluckner, P.D.; Chang, G.N. Calibration of an inductively coupled plasma-atomic emission spectrometer for the analysis of environmental materials. Anal. Chem. 1979, 51, 888–895. [Google Scholar] [CrossRef]
  18. Bolland, M.D.A.; Paynter, B.H. Critical phosphorus concentrations for burr medic, yellow serradella, subterranean clover, and wheat. Commun. Soil Sci. Plant Anal. 1994, 25, 385–394. [Google Scholar] [CrossRef]
  19. Elliott, D.E.; Reuter, D.J.; Reddy, G.D.; Abbott, R.J. Phosphorus nutrition of spring wheat (Triticum aestivum L.). 4. * Calibration of plant phosphorus test criteria from rain-fed field experiments. Aust. J. Agric. Res. 1997, 48, 899–912. [Google Scholar] [CrossRef]
  20. Rayment, G.E.; Lyons, D.J. Soil Chemical Methods—Australasia; CSIRO Publishing: Collingwood, Australia, 2011. [Google Scholar] [CrossRef]
  21. McDonald, R.C.; Isbell, R.F.; Speight, J.G.; Walker, J.; Hopkins, M.S. Department of Primary Industries and Energy and CSIRO Australia. In Australian Soil and Land Survey Field Handbook; CSIRO Publishing: Collingwood, Australia, 1998. [Google Scholar]
  22. Isbell, R.F. National Committee on Soil and Terrain. In The Australian Soil Classification; CSIRO Publishing: Collingwood, Australia, 2021; Available online: https://www.publish.csiro.au/ebook/download/pdf/8016 (accessed on 14 May 2024).
  23. Zadoks, J.C.; Chang, T.T.; Konzak, C.P. A decimal code for the growth stages of cereals. Weed Res. 1974, 14, 415–421. [Google Scholar] [CrossRef]
  24. Patrignani, A.; Ochsner, T.E. Canopeo: A powerful new tool for measuring fractional green canopy cover. Agron. J. 2015, 107, 2312–2320. [Google Scholar] [CrossRef]
  25. Moody, P.W. Interpretation of a single-point P buffering index for adjusting critical levels of the Colwell soil P test. Soil Res. 2007, 45, 55–62. [Google Scholar] [CrossRef]
  26. Mason, S. Soil Phosphorus Availability by DGT. 2024. Available online: https://www.soilquality.org.au/factsheets/dgt-phosphorus (accessed on 14 May 2024).
  27. Peverill, K.I.; Sparrow, L.A.; Reuter, D.J. Soil Analysis—An Interpretation Manual; CSIRO Publishing: Collingwood, Australia, 2001. [Google Scholar] [CrossRef]
  28. Bell, R.; Reuter, D.; Scott, B.; Sparrow, L.; Strong, W.; Chen, W. Soil phosphorus–crop response calibration relationships and criteria for winter cereal crops grown in Australia. Crop Pasture Sci. 2013, 64, 480–498. [Google Scholar] [CrossRef]
  29. Chien, S.H.; Sikora, F.J.; Gilkes, R.J.; McLaughlin, M.J. Comparing of the difference and balance methods to calculate percent recovery of fertilizer phosphorus applied to soils: A critical discussion. Nutr. Cycl. Agroecosyst. 2012, 92, 1–8. [Google Scholar] [CrossRef]
  30. Hedley, M.; McLaughlin, M.J. Reactions of phosphate fertilizers and by-products in soils. In Phosphorus: Agriculture and the Environment; Sims, G.T., Sharpley, A.N., Eds.; ASA; CSSA; SSSA: Madison, WI, USA, 2005; Volume 46, pp. 181–252. [Google Scholar] [CrossRef]
  31. McLaughlin, M.J.; McBeath, T.M.; Smernik, R.; Stacey, S.P.; Ajiboye, B.; Guppy, C. The chemical nature of P accumulation in agricultural soils—Implications for fertiliser management and design: An Australian perspective. Plant Soil. 2011, 349, 69–87. [Google Scholar] [CrossRef]
  32. Kirby, J.M.E.; Appleyard, M.; Fellowes, G. Leaf emergence and tillering in barley and wheat. Agronomie 1985, 5, 193–200. Available online: https://hal.science/hal-00884750 (accessed on 4 June 2024). [CrossRef]
  33. Grey, D. Crop Growth Stages Refresher. Available online: https://grdc.com.au/resources-and-publications/grdc-update-papers/tab-content/grdc-update-papers/2023/02/crop-growth-stages-refresher (accessed on 4 June 2024).
  34. Henningsen, J.N.; Görlach, B.M.; Quintero, J.M.; Garrido, R.R.; Mühling, K.H.; Fernández, V. Leaf wettability is the main driver for foliar P uptake in P-deficient maize. Plant Physiol. Biochem. 2023, 205, 108170. [Google Scholar] [CrossRef] [PubMed]
  35. Peirce, C.A.E.; McBeath, T.M.; Fernández, V.; McLaughlin, M.J. Wheat leaf properties affecting the absorption and subsequent translocation of foliar-applied phosphoric acid fertiliser. Plant Soil 2014, 384, 37–51. [Google Scholar] [CrossRef]
  36. Castro, S.A.Q.d.; Kichey, T.; Persson, D.P.; Schjoerring, J.K. Leaf Scorching following Foliar Fertilization of Wheat with Urea or Urea–Ammonium Nitrate Is Caused by Ammonium Toxicity. Agronomy 2022, 12, 1405. [Google Scholar] [CrossRef]
  37. Zabkiewicz. Adjuvants and herbicidal efficacy—Present status and future prospects. Weed Res. 2000, 40, 139–149. [Google Scholar] [CrossRef]
  38. Henningsen, J.N.; Görlach, B.M.; Fernández, V.; Dölger, J.L.; Buhk, A.; Mühling, K.H. Foliar P application cannot fully restore photosynthetic capacity, P nutrient status, and growth of P deficient maize (Zea mays L.). Plants 2022, 11, 2986. [Google Scholar] [CrossRef]
  39. Peirce, C.A.; McBeath, T.M.; Priest, C.; McLaughlin, M.J. The timing of application and inclusion of a surfactant are important for absorption and translocation of foliar phosphoric acid by wheat leaves. Front. Plant Sci. 2019, 10, 1532. [Google Scholar] [CrossRef]
  40. Haloi, B. Effect of foliar application of phosphorus salt on yellowing of wheat seedlings. J. Res. Assam Agric. Uni. 1980, 1, 108–109. Available online: https://www.cabidigitallibrary.org/doi/full/10.5555/19840765920 (accessed on 14 May 2024).
  41. Lopes, M.S.; Reynolds, M.P. Stay-green in spring wheat can be determined by spectral reflectance measurements (normalized difference vegetation index) independently from phenology. J. Exp. Bot. 2012, 63, 3789–3798. [Google Scholar] [CrossRef] [PubMed]
  42. Chuan, L.; He, P.; Pampolino, M.F.; Johnston, A.M.; Jin, J.; Xu, X.; Zhao, S.; Qiu, S.; Zhou, W. Establishing a scientific basis for fertilizer recommendations for wheat in China: Yield response and agronomic efficiency. Field Crops Res. 2013, 140, 1–8. [Google Scholar] [CrossRef]
  43. Holford, I.C.R.; Doyle, A.S. The recovery of fertilizer phosphorus by wheat, its agronomic efficiency, and their relationship to soil phosphorus. Aust. J. Agric. Res. 1993, 44, 1745–1756. [Google Scholar] [CrossRef]
  44. Limon-Ortega, A.; Baez-Perez, A. Maize yield and grain quality response to foliar-applied phosphorus in a soil testing high in P. Span. J. Agric. Res. 2024, 22, 1–11. [Google Scholar] [CrossRef]
  45. Yu, X.; Keitel, C.; Dijkstra, F.A. Global analysis of phosphorus fertilizer use efficiency in cereal crops. Glob. Food Secur. 2021, 29, 100545. [Google Scholar] [CrossRef]
  46. McLaughlin, M.J.; Alston, A.M.; Martin, J.K. Phosphorus cycling in wheat pasture rotations. I. The source of phosphorus taken up by wheat. Soil Res. 1988, 26, 323–331. [Google Scholar] [CrossRef]
  47. McLaughlin, M.J.; Alston, A.M. The relative contribution of plant residues and fertilizer to the phosphorus nutrition of wheat in a pasture cereal system. Soil Res. 1986, 24, 517–526. [Google Scholar] [CrossRef]
  48. Harries, M.; Flower, K.C.; Scanlan, C.A. Sustainability of nutrient management in grain production systems of south-west Australia. Crop Pasture Sci. 2021, 72, 197–212. [Google Scholar] [CrossRef]
  49. Malik, R. (DPIRD Katanning, W., Australia); Scanlan, C.A. (DPIRD Northam, W., Australia). Nutrient status of wheat and canola plants at early growth stages—A plant analysis survey in acid gravelly soils of south-west Western Australia. Personal communication. 2023. [Google Scholar]
Figure 1. Phosphorus concentration in whole shoots of wheat sampled between Z11 and Z21 growth stages (days after sowing). Red points are critical p values published by [18,19]. Blue points are shoot P concentrations (a total of 23 sampling observations).
Agronomy 14 01630 g001
Figure 2. Response of wheat grain yield and shoot dry weight (SDW) at anthesis (Z65) to applied foliar P in comparison with Control at nine experimental sites. Dashed line is 1:1.
Agronomy 14 01630 g002
Figure 3. Effect of foliar-applied P rates on wheat grain yields at nine experimental sites. Foliar P treatments were 0 P = control, 2.5 P = 2.5 kg P/ha, 5 P = 5.0 kg P/ha. Treatments within a site with no common letters above were significantly different (p < 0.05).
Agronomy 14 01630 g003
Figure 4. Effect of time of foliar P application on wheat grain yield at the 4 sites where an effect of time of application was detected with ANOVA. Time of application was based on Zadoks growth stage: Z21 = first tiller emergence, Z31 = first node detection and Z39 = flag leaf emergence. Treatments within a site with no common letters above were significantly different (p < 0.05).
Agronomy 14 01630 g004
Figure 5. Relationship between percent gain yield increase and phosphorus buffering index (PBI, 0–10 cm soil depth). Percent yield gain was calculated from the mean value of the applied P treatments and the control.
Agronomy 14 01630 g005
Figure 6. Relationship between leaf scorching and wheat grain yield, from treatments where foliar P was applied. Leaf scorching was based on a visual assessment at mid-anthesis (Z65). The solid line is a linear model, excluding the control.
Agronomy 14 01630 g006
Figure 7. Effect of foliar-applied P rates on wheat shoot dry weight (SDW) at mid-anthesis (Z65) at nine experimental sites. Foliar P treatments were 0 P = control, 2.5 P = 2.5 kg P/ha, 5 P = 5.0 kg P/ha. Treatments within a site with no common letters above were significantly different (p < 0.05).
Agronomy 14 01630 g007
Figure 8. Effect of foliar-applied P rates and timings on (a) agronomic efficiency (AE) and (b) phosphorus use efficiency (PUE), averaged across the nine experiments. LSD (p < 0.05) for AE and PUE is 63 kg/kg and 0.17 kg/kg, respectively. Foliar P treatments were 0 P = control, 2.5 P = 2.5 kg P/ha, 5 P = 5.0 kg P/ha. Time of application was based on Zadoks growth stage: Z21 = first tiller emergence, Z31 = first node detection and Z39 = flag leaf emergence.
Agronomy 14 01630 g008
Disclaimer/Publisher’s Note: The statements, opinions and data contained in all publications are solely those of the individual author(s) and contributor(s) and not of MDPI and/or the editor(s). MDPI and/or the editor(s) disclaim responsibility for any injury to people or property resulting from any ideas, methods, instructions or products referred to in the content.

