Abstract
The role of amino acid transporter (AAT) genes in facilitating the transmembrane movement of amino acids between cells and various cellular components has been characterized in several plant species. Quinoa (Chenopodium quinoa Willd.), a renowned nutritious crop known for its amino acid composition, has not yet had its AAT genes characterized. Therefore, the identification and characterization of AAT genes in quinoa will help bridge this knowledge gap and offer valuable insights into the genetic mechanisms underlying amino acid transport and metabolism. This study focuses on gene expression, gene structure, duplication events, and a comparison of functions studied to establish the role of AAT genes. A total of 160 non-redundant AAT genes were identified in quinoa and classified into 12 subfamilies, with 8 subfamilies belonging to the amino acid/auxin permease (AAAP) family and 4 to the amino acid-polyamine-organocation (APC) superfamily family. The chromosomal localization, gene structures, and conserved motifs of these genes were systematically analyzed. Expression profiling revealed diverse expression patterns across various tissues and in response to drought and salt stresses. Segmental and tandem duplications were found to contribute to the gene duplication and expansion of the CqAAT gene family. Additionally, CqCAT6 and CqAAP1 were predicted to regulate the long-distance transportation and distribution of amino acids, making them potential candidate genes for further research. Overall, this information could serve as a foundation for the identification and utilization of CqAATs in Quinoa, enhancing our understanding of amino acid transport mechanisms in this important crop.
1. Introduction
Quinoa (Chenopodium quinoa Willd.) is a highly nutritious pseudocereal crop with significant potential for expanded cultivation in diverse climates, especially in areas with poor soil quality such as high salinity under arid conditions [1,2]. Recognizing its importance, the FAO designated 2013 as the “International Year of Quinoa”, highlighting its crucial role in ensuring food security and promoting agrobiodiversity [3]. The seeds of quinoa are central to their nutritional value, as they are gluten-free, have a low glycemic index [4], and a rich array of amino acids, lipids, carbohydrates, vitamins, and minerals [5]. Quinoa is particularly notable for its high-quality protein content, as it contains all essential amino acids, with a high abundance of lysine, histidine, and methionine, surpassing common cereals in terms of human nutritional benefits. Understanding the mechanisms governing amino acid absorption, transport, and accumulation within quinoa grains is essential for developing high-quality quinoa varieties that enhance amino acid enrichment and transport through molecular pathways.
Amino acids are pivotal nitrogen carriers and indispensable compounds for plant growth and development [6]. Amino acid transporters (AATs) emerge as integral membrane proteins crucial for orchestrating the absorption and transportation of amino acids across membranes. They play diverse roles in plant growth and development processes, encompassing seed amino acid absorption [7,8], long-distance amino acid transport via the phloem or between the xylem and phloem [9,10,11], flower organ development [12], amino acid uptake from soil [13,14], and responses to both biotic and abiotic stresses [15,16].
Classification based on sequence similarity and absorption characteristics delineates the AAT gene family into two main groups: the amino acid/auxin permease transporter (AAAP) and the amino acid-polyamine-choline transporter (APC). The AAAP family comprises subfamilies such as amino acid permeases (AAPs), amino acid transporter-like a/b (ATLa/b) proteins, aromatic and neutral amino acid transporters (ANTs), auxin transporters (AUXs), γ-aminobutyric acid transporters (GATs), lysine–histidine transporters (LHTs), and proline transporters (ProTs) [17,18,19]. Meanwhile, the APC family encompasses subfamilies including cationic amino acid transporters (CATs), amino acid/choline transporters (ACTs), polyamine H+ symporters (PHSs), and tyrosine-specific transporters (TTPs) [8,20].
Extensive research has systematically identified and characterized the AAT gene family across various plant species, revealing its widespread presence in higher plants, with examples such as 104 genes in Tartary buckwheat [21], 94 genes in Foxtail Millet [22], 296 genes in wheat [23], 63 genes in Arabidopsis [6], 85 genes in rice [16], 189 genes in soybean [24], and 72 genes in potato [20].
In Arabidopsis, eight members (AtAAP1–AtAAP8) of the AtAAP subfamily have been identified and categorized into two groups. The broad specific transporters recognize acidic and neutral amino acids and ureides such as AAP1, AAP2, and AAP4, while the general amino acid transporters, besides acidic and neutral amino acids, also recognize basic amino acids like AAP3 and AAP5 [25,26,27]. Notably, AtAAP1, highly expressed in endosperm and cotyledons, regulates amino acid import into root cells or developing embryos [13,18,28]. AtAAP2 enhances seed yield and oil content by modulating amino acid transport to the phloem [29]. Similarly, AtAAP5 facilitates amino acid transport into developing embryos, constituting a crucial component of the root amino acid absorption system [14]. The regulating role of AtAAP6 in sieve element amino acid composition has been confirmed through the analysis of an aap6 mutant [17]. AtAAP8 emerged as essential for amino acid absorption in endosperm and developing embryos during early development. Other members like AtAUX1 and AtLAX3 have a role in regulating root gravitropism and lateral root formation [30,31], while AtLHT1 governs amino acids transport in leaves and roots [32,33] and AtLHT2 in floral organs [34], impacting root and reproductive organ development. Similarly, in rice, OsAAP1 influences grain yield by modulating neutral amino acid redistribution during grain filling [35], while OsAAP15, a nitrogen-responsive AAT, affects rice panicle branching and grain yield, particularly under extreme nitrogen concentrations [36]. Comparable roles have been identified in other species, such as barley, potato, Vicia faba, and cucumber [11,37,38,39,40,41].
Moreover, AATs serve indispensable functions in bolstering plant stress and disease resistance mechanisms. For instance, OsLHT1 in rice mediates amino acid homeostasis, reactive oxygen species accumulation, and jasmonic acid and salicylic acid production, regulating the interplay between leaf phenotype and resistance to rice blast fungus [36]. Likewise, ProT2 genes in Arabidopsis and barley were upregulated under salt stress, and similarly, GmProT1/2 overexpression enhanced resistance to drought and salt stress in soybean [42,43,44]. Further, various AAT genes are strongly induced under abiotic stresses to mitigate plant damage, exemplified by overexpressing SiAAP3, SiANT1, OsAAP11, and AtGAT1 genes.
Despite these advancements, the comprehensive characterization of the AAT gene family in quinoa remains lacking. Thus, this study systematically characterizes the AAT genes in quinoa. Our objectives encompass the accurate identification of the quinoa AAT gene family, phylogenetic analysis of CqATT genes into subfamilies, the investigation of gene duplication events, an analysis of tissue-specific expression patterns of CqAAT genes in response to abiotic stresses, and the prediction of functions of CqAAT genes based on their expression patterns and phylogenetic relationships. These findings offer profound insights into the roles of AAT genes in quinoa, furnishing theoretical support for functional analyses and facilitating quality improvement and resistance to abiotic stresses.
2. Materials and Methods
2.1. Identification of the AAT Gene Family in Quinoa
The quinoa (Chenopodium quinoa Willd.) variety JQ505, produced by Shanxi Jiaqi Seed Industry Co., Ltd. Taiyuan, China, was utilized for this study. To identify potential AAT proteins, a local protein database tailored specifically for quinoa was created within the BLAST tool. Seed sequences from known AAT proteins served as references for aligning with quinoa protein sequences using the BLASTP program (https://bioinformatics.psb.ugent.be/webtools/plantcare/html/). Subsequently, two hidden Markov models (PF00324 and PF01490) were obtained from the PFAM database to identify conserved domains within the putative AAT proteins using the HMMER tool (https://services.healthtech.dtu.dk/cgi-bin/sw_request?software=tmhmm&version=2.0c&packageversion=2.0c&platform=Linux). To confirm the presence of conserved domains, all filtered AAT protein sequences were submitted to the NCBI CDD and InterproScan databases. Further characterization of the AAT proteins involved obtaining detailed information such as cDNA lengths, protein lengths, and gene structures from the genome annotation file (.gff3). Physicochemical properties were elucidated using the “Compute pI/Mw” tool (https://services.healthtech.dtu.dk/services/TMHMM-2.0/). Additionally, the prediction of transmembrane (TM) regions and subcellular localizations was performed using the TMHMM Server 2.0 and LocTree 3 (https://web.expasy.org/compute_pi/), respectively.
2.2. Chromosomal Localization, Duplication, and Selective Pressure Analysis
Chromosome locations of CqAAT genes were obtained from the .gff3 genome annotation file. Duplication events in CqAAT genes were detected with the “Multiple Collinearity Scan toolkit X version”, and the duplication results were manually filtered [45,46]. The chromosomal distribution of CqAAT genes and duplication events were visualized by using TBtools [47]. In addition, the ratios of non-synonymous to synonymous mutations were calculated for paralogous gene pairs using “KaKs_Calculator 2.0” and visualized with the ggplot2 package of R [48].
2.3. Phylogenetic Analyses, Conserved Motifs and Structure
The multiple sequence alignment of AAT protein sequences in foxtail millet, Tartary buckwheat, rice and Arabidopsis was performed by ClustalW and visualized with ESPript 3.0 [49]. The phylogenetic tree was constructed using the maximum likelihood method in MEGA 6.06 [50] and optimized and visualized with iTOL v3. The UniProt database and published reports were used to obtain two monocotyledons (Sorghum bicolor and Oryza sativa), two dicotyledons (Arabidopsis thaliana and Solanum lycopersicum), and two closely related plants (Spinacia oleracea and Beta vulgaris).
The motif-based sequence analysis (MEME) server was utilized to identify the CqAAT conserved motifs. Conserved sequences of CqAUX proteins in the AUX subfamily were analyzed using the motif-based sequence analysis (MEME). All of the CqAUX protein sequences were submitted to the Protein Data Bank to obtain the secondary structure information of CqAUX proteins. Three-dimensional structures were predicted for paralogous AAT protein pairs belonging to several subfamilies. Variations in protein structures were identified by consulting the Phyre2 website.
2.4. Cis-Regulatory Element and AATs Expression in Quinoa
To assess cis-regulatory elements, the sequence of the promoter regions of CqAAT genes were extracted using TBtools [47] and subjected to cis-acting element prediction using the PlantCARE database. The predicted elements were manually grouped based on their functions [51]. Subsequently, the sequences were categorized, quantified, and visualized using the ggplot2 package in R.
The expression levels of CqAAT genes were visualized through a heatmap of log2 (FPKM + 1) values. Expression data for AtAATs, OsAATs, and TaAATs were obtained from publicly available databases, and trend analysis and clustering of expression patterns were performed using the Mfuzz package of RStudio.
2.5. Expression of CqAAT Genes in Quinoa under Drought and Salt Stress
To evaluate the response of AAT expression to abiotic stresses, quinoa “JQ505” seedlings were exposed to drought and salinity conditions. Seedlings were cultivated in a greenhouse at Shanxi Agricultural University, maintaining a temperature of 22 °C and a light/dark regime of 16 h and 8 h dark per day. After 21 days, to induce drought stress, the seedlings were treated with PEG-6000 (20% w/v) solution for 1 h and treated with NaCl solutions (200 mM) for 6 h to induce saline condition.
Three quinoa seedlings were harvested from each treatment (as three biological replicates) for RNA extraction to perform quantitative real-time PCR (qRT-PCR) analysis. Total RNA was isolated using TRIzol Reagent (Ambion®, Austin, TX, USA). Firstly, cDNA was synthesized using 1 µg total RNA according to the protocol of HiScript II RT SuperMix for qPCR (Vazyme). The CqAAT gene was used as an endogenous control to calibrate the gene expression levels, and the relative expression was calculated using the 2−ΔΔCT method [52]. The qRT-PCR analysis is listed in Table S6. The qRT-PCR was performed using an SYBR Green PCR Master Mix (Vazyme Biotech, Ltd., Nanjing, China) on the CFX96 Real-Time PCR detection system (Bio-Rad Laboratories, Inc., Hercules, CA, USA). The real-time PCR conditions are as follows: 95 °C for 3 min followed by 40 cycles of 95 °C for 15 s, 60 °C for 15 s and 72 °C for 30 s.
3. Results
3.1. Identification of AAT Gene Family Members in Quinoa
A total of 160 non-redundant AAT genes were identified in the quinoa genome (Table S1). Among these, 13 genes encoded short proteins of less than 300 amino acids. The CqAAT genes were renamed based on their localization on chromosomes and phylogenetic relationships with other species (Table S1). Quinoa has a higher number of AAT genes (160) compared to other dicotyledonous plants such as Tatar buckwheat (104), Arabidopsis (63), and potato (72) (Table 1). The lengths of AAT proteins in quinoa ranged from 68 aa to 1358 aa, with molecular weights ranging from 7623.75 to 149,710.57 Da and isoelectric points ranging from 4.79 to 10.35. The number of transmembrane (TM) regions in CqAAT proteins varies from 1 to 21.

Table 1.
Comparison of the gene abundance in 12 AAT gene subfamilies of 4 eudicots and 4 monocots.
Some AAT proteins exhibit significant variation in the number of TM regions among members such as ATLa, LHT, GAT, AAP, and ACT, while AUX, PHS, ANT, CAT, and ProT show fewer variations (Figure 1). ATLa subfamily proteins have 6–21 TM regions, whereas LHT subfamily proteins have 1–11 TM regions. All AUX and ANT subfamily proteins contain at least 10 TM regions. Based on the predicted subcellular localizations, 122 CqAATs are located on the cell membrane, 30 in the Golgi apparatus, 6 in the chloroplasts, and 2 in the cytoplasm (CqATLb22 and CqATLb26) (Table S1).
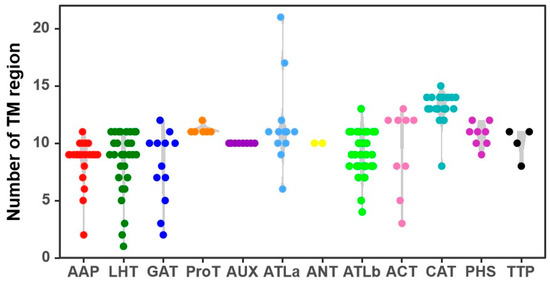
Figure 1.
Distribution of numbers of transmembrane (TM) regions in the amino acid transporter (AAT) family in quinoa.
3.2. Chromosomal Localizations of CqAAT Genes and Gene Duplication Events
The 160 CqAAT genes were unevenly mapped onto 18 chromosomes in quinoa. The highest number of genes, 16 in total, were found on chromosome 5B, while only 1 gene, the minimum number, was located on chromosome 8B. The pericentromeric areas of chromosomes 8A and 8B, the anterior ends of chromosomes 4A, 7A, 7B, and 9B, and the distal ends of chromosomes 3A, 3B, and 6B showed a high enrichment of the CqAAT genes (Figure S1). The results indicated that 140 CqAAT genes had undergone gene duplication events, constituting 87.50% of the total (160). Among these, 46 genes had undergone tandem duplication (TD) events, 94 genes had undergone segmental duplication (SD) events, and 15 genes had undergone both SD and TD events. The 46 TDs were classified into 20 groups, with 2 groups having four genes (TD2 and TD20), 2 groups having three genes (TD5 and TD12), and the remaining 16 groups having two genes each. The 94 SDs were classified into 47 groups, with each group containing two genes.
The Ka/Ks ratio was utilized to assess the selective pressure acting on duplicated CqAAT genes. Notably, all duplicated gene pairs exhibited Ka/Ks values below 1, clearly indicating purifying selection (Figure S2). A relatively wide range of Ka/Ks values was observed in the gene pairs with tandem duplication (TD), varying from 0.04 to 0.70 (Table S2). Additionally, Ka/Ks values showed variation across subfamilies, with different trends apparent. The median and spread of Ka/Ks values within the quinoa ATLb subfamily were particularly noteworthy, surpassing those of the other subfamilies. This disparity suggests that a significant proportion of CqATLbs underwent evolutionary changes due to the variability in selective pressure, leading to a shift in functional constraints (Figure S2).
Our results emphasize the central role that chromosome duplication and TD events play in the expansion of the CqAAT gene family. Similarly, TD events were observed during functional diversification within the ATLb subfamily in wheat, further emphasizing the importance of these mechanisms in shaping gene family evolution and adaptation. Comparisons of the TM regions of CqAAT genes showed variations in the number of TM regions in duplicate gene pairs, with 55% (40 out of 73) of the duplicate gene pairs exhibiting variation, including 16 tandem and 24 segmental duplicate gene pairs, respectively (Table 2). In terms of gene structure, the number of exons varied in 44% (32 out of 73) of duplicate gene pairs, with 15 tandem duplicate gene pairs accounting for 58% of the total and 17 segmental duplicate gene pairs comprising 36% of the total. Variations in conserved motifs were also observed in 42 duplicate gene pairs, with 16 in tandem repeats and 26 in segmental repeats. The Ka/Ks values were less than one for all homologous CqAAT gene pairs, indicating that these genes had been subjected to purifying selection (Table 2). The average Ka/Ks values for tandem and segmental duplications were 0.22 and 0.23, respectively.
Table 2.
The extensive variations in gene/protein structure and sequence of paralogous AAT genes produced by gene duplication in Quinoa.
3.3. Phylogenetic Tree and Structures of CqAAT Genes
The phylogenetic analysis of the AAT protein sequences of quinoa (160), Tatary buckwheat (104), Arabidopsis (63), rice (85) and foxtail millet (94) showed classification with high confidence into 12 distinct genetic groups, with a remarkable convergence of monocot and eudicot representatives within the same clusters (Figure 2). Among the 121 CqAAT proteins assigned to the AAAP family, eight subfamilies emerged comprising a variety of transporters, including 24 AAPs, two ANTs, 12 ATLas, 28 ATLbs, eight AUXs, lysine, 29 LHTs, six ProTs, and 12 GATs. The remaining 39 CqAATs, on the other hand, fell into four subfamilies within the APC family and included nine ACTs, 18 CATs, eight PHSs and four TTPs.
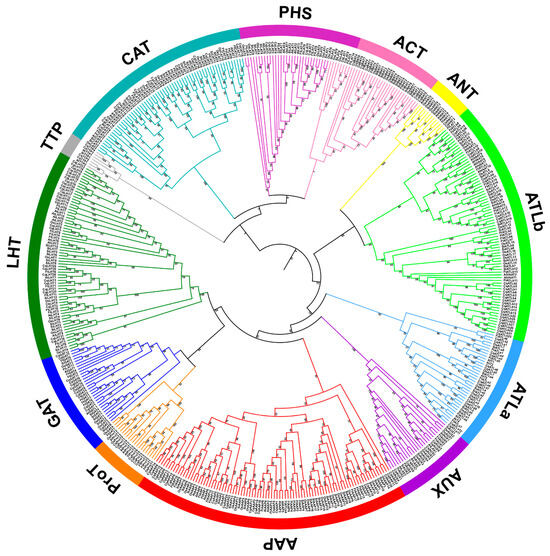
Figure 2.
Phylogenetic tree based on amino acid transporter (AAT) proteins in quinoa, Tartary buckwheat, Arabidopsis, rice, and foxtail millet. Multiple sequence alignment and phylogenetic tree construction were performed using MUSCLE v5.1 and MEGA 6.0, respectively. Different colored branches represent different AAT subfamilies and AATs are named according to previous studies.
Further scrutiny into the structures of CqAAT genes, based on the annotated quinoa genome, revealed intriguing patterns. While some genes within the same subfamily exhibited strikingly similar exon and intron structures, exemplified by CqAAP7 and CqAAP13, and CqAUX1 and CqAUX4, others displayed notable disparities, as observed in pairs like CqGAT4 and CqGAT8 and CqGAT3 and CqGAT11 (Figure 3).
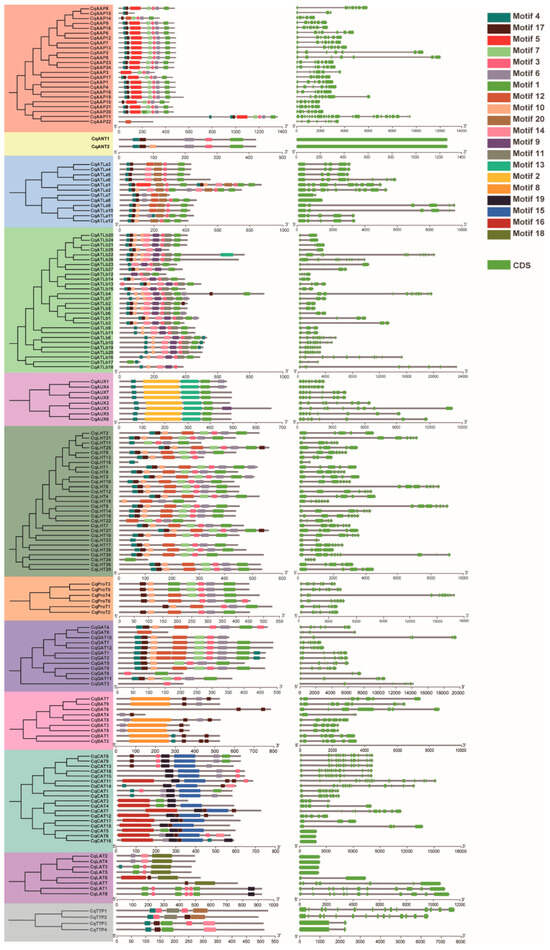
Figure 3.
Gene structures of CqAATs and conserved motifs in quinoa. Different color backgrounds represent different CqAAT subfamilies.
Moreover, the predicted conserved motifs in CqAAT proteins, as discerned through MEME analysis, closely mirrored the phylogenetic relationships and subfamily classifications of CqAATs. A total of 20 motif sequences were identified (Table S3), showcasing variability across different subfamilies. Notably, certain motifs were exclusive to specific subfamilies, such as Motif 8 in the BAT subfamily and Motifs 2 and 13 in the AUX subfamily.
To delve deeper into the relationships between conserved motifs and functional regions, multiple sequence alignment was performed on CqAUX proteins. This analysis revealed a substantial degree of similarity (59.65% overall), with 11 conserved motifs identified. The alignment also highlighted a strong correlation between TM regions and conserved motifs in terms of length and amino acid composition (Figure 4). Additionally, the annotation of secondary structures unveiled a complex interplay between motifs and transmembrane regions, with distinct motifs corresponding to specific helical structures crucial for the transport functions of AAT proteins.
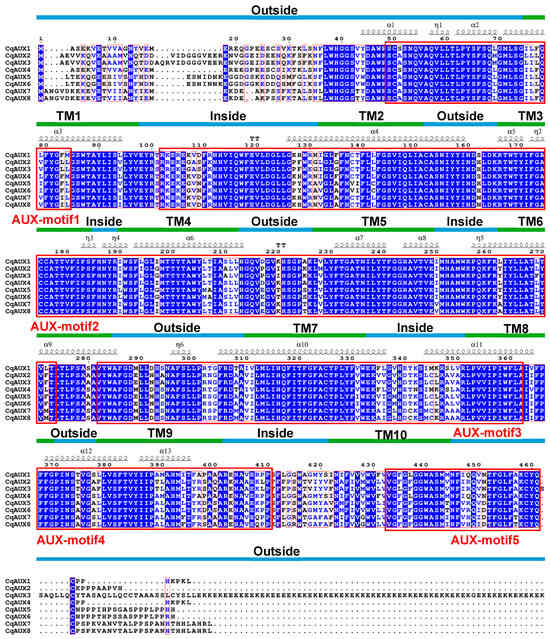
Figure 4.
Multiple sequence alignment for CqAUX in quinoa. TM regions, conserved motifs, and secondary structures are denoted by lines, boxes, and symbols, respectively.
Three-dimensional modeling predictions for CqAAT proteins indicated that they had complex structures comprising multiple secondary structures, including helix and coil (Figure 5). The three-dimensional structures of proteins were conserved between some homologues, such as SD6 (CqCAT1 and CqCAT2), SD9 (CqProT1 and CqProT2), TD1 (CqATLa4 and CqATLa6), and TD10 (CqGAT8 and CqGAT9). However, significant differences were found in the three-dimensional structures of paralogous proteins encoded by genes involved in genome-wide replication events, such as SD1 (CqAAP1 and CqAAP4), SD3 (CqATLa9 and CqATLa10), TD2 (CqAAP6 and CqAAP7), and TD4 (CqLHT12 and CqLHT13).
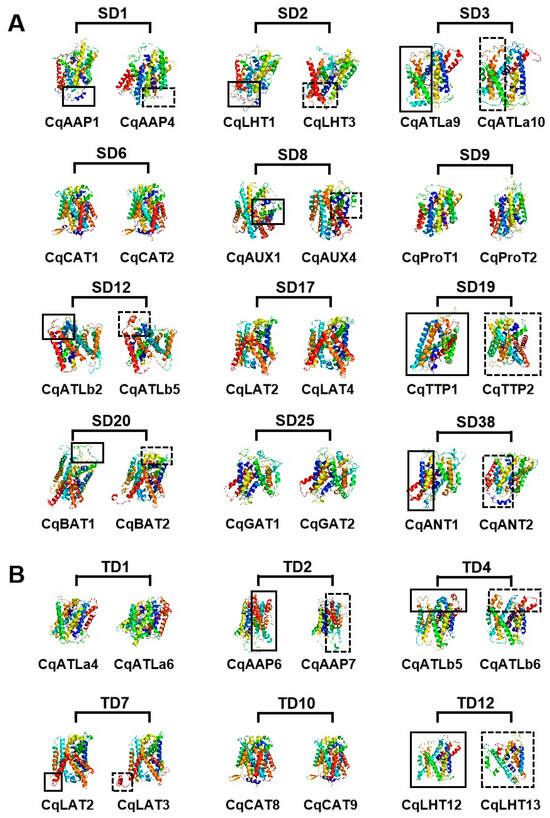
Figure 5.
Three-dimensional model of proteins encoded by duplicated CqAAT gene pairs in quinoa. (A) SD and (B) TD denote tandem duplication and segmental duplication, respectively.
3.4. Cis-Regulatory Elements of CqAATs and Collinearity Analysis
The cis-regulatory elements identified within the promoter regions (2000 bp upstream of the start codon) of all AAT genes were primarily categorized into three clusters: tissue specificity, stress response, and hormone response (Figure S3). Notably, a significant abundance of stress-responsive cis-regulatory elements, including those sensitive to light, MeJA, and abscisic acid, was observed within these regions, indicating the robust stress-responsive nature of AAT genes. Moreover, the detection of gibberellin and other hormone-responsive elements suggested potential involvement in multiple hormone signaling pathways. Additionally, multiple transcription factor binding sites, such as those for MYBs, were identified within the promoter regions, suggesting a complex regulatory network governing the expression of AAT genes.
To further elucidate the phylogenetic relationships within the AAT family, we constructed a collinearity diagram using AAT genes from Chenopodium quinoa and six representative species. These included two monocotyledon plants (Sorghum bicolor and Oryza sativa), two dicotyledon plants (Arabidopsis thaliana and Solanum lycopersicum), and two closely related plants (Spinacia oleracea and Beta vulgaris) (Figure 6; Table S4). We found that 82 CqAAT genes had collinear relationships with genes in Sorghum bicolor (12), Oryza sativa (13), Arabidopsis thaliana (37), Solanum lycopersicum (46), Spinacia oleracea (57), and Beta vulgaris (69). In addition, homologues were found in the six species comprising Sorghum bicolor (14), Oryza sativa (15), Arabidopsis thaliana (50), Solanum lycopersicum (64), Spinacia oleracea (57), and Beta vulgaris (69).
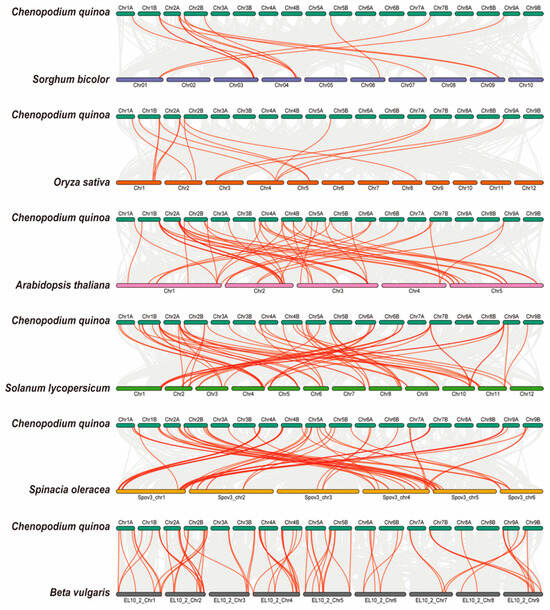
Figure 6.
Collinearity of AAT genes in quinoa and six other representative plants: monocotyledons (Sorghum bicolor and Oryza sativa), dicotyledons (Arabidopsis thaliana and Solanum lycopersicum), and closely related plants (Spinacia oleracea and Beta vulgaris). Gray lines represent collinearity between gene pairs in two species, and the red line represents the CqAAT gene pair.
Certain CqAAT genes, such as CqLHT18, CqProT1, CqGAT1, CqBAT3, and CqLAT6, were found to exhibit homologous gene pairs solely within two closely related dicotyledons representatives. Remarkably, each of these genes featured at least one pair of homologous genes within the four selected dicotyledonous representatives, suggesting a gradual evolutionary emergence after the independent divergence of dicotyledons. Conversely, other genes, such as CqATLa3, CqATLa4, CqAUX7, and CqAUX8, displayed homologues across all representative plants considered in our comparisons. This widespread presence hints at their significance as fundamental ancestral genes, resilient to loss or substantial differentiation throughout quinoa’s extensive evolutionary history.
3.5. Expression Patterns of CqAATs and Responses to Drought/Salt Stress
Transcriptome analysis showed that CqAAT genes showed different expression patterns in different tissues, and they were clustered into five clusters (Figure 7, Table S5). Cluster 1 contained 83 genes, which were specifically expressed in the roots, stems, and leaves, including CqAAP1, CqAUX2, and CqGAT5. Cluster 2 contained 19 genes, which were highly expressed in the stems, such as CqATLb25, CqBAT3, and CqLAT4. Cluster 3 contained 23 genes, from which 20 CqAAT genes showed higher expression in leaves, while the expression of CqAAP3 and CqAAP21 were mainly restricted to leaves and CqCAT15, CqATLb13, and CqBAT1 in roots and grains. Five genes (CqLHT11, CqLHT24, CqGAT4, CqAAP14, and CqATLb14) in Cluster 4 were generally not expressed in all four tissues, and there may be many explanations for this pattern. Cluster 5 contained 30 genes primarily showing expression in the grains.
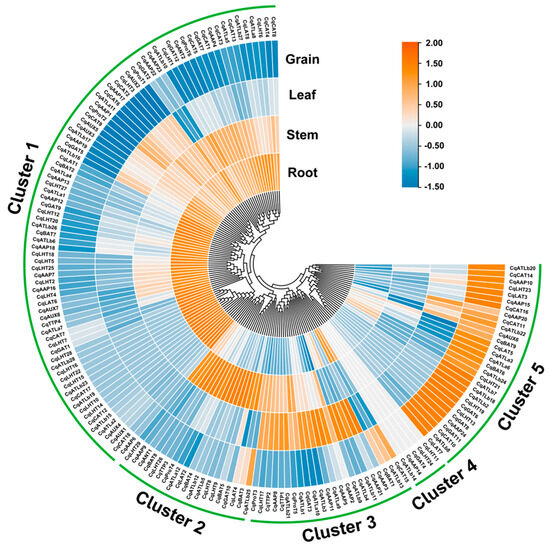
Figure 7.
Expression patterns of CqAAT genes in root, stem, leaf, and grain tissues.
All expression data were obtained from RNA-Seq and expression levels are shown as log2(FPKM + 1) values. The expression patterns of the twelve representative CqAAT genes were studied by qRT-PCR in salinity and drought-exposed quinoa seedlings (Figure 8, Table S6). Specifically, a total of 10 CqAAT genes were upregulated under drought stress, from which CqBAT3 and CqATLa2 were upregulated more than five times at 6 h after drought stress. CqCAT7 and CqProT1 were highly upregulated by salt stress. CqANT2, CqLAT1, CqLHT14, CqATLa2, and CqAAP23 showed higher expressions under both drought and salt stress. On the contrary, the expression pattern of seven genes including CqAAP23, CqATLb26, CqBAT3, CqGAT11, CqATLa2, CqTTP1 and CqANT2 showed increased and then decreased expression. Moreover, the CqAATs showed temporal variation under abiotic stress. For example, CqLAT1 and CqAUX7 were downregulated under 1 h drought stress, while they were upregulated under 6 h drought stress compared with the control. CqATLa2 showed continuous upregulation with the time of drought stress but was downregulated under 6 h of salt stress.
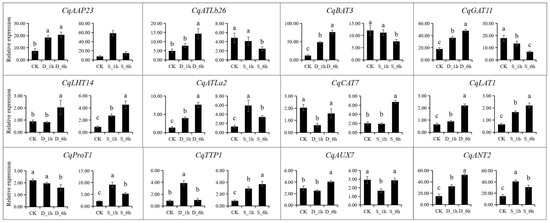
Figure 8.
Expression patterns of 12 selected CqAAT genes under drought stress and salt stress by quantitative real-time PCR. The 21-day-old seedlings were exposed to 20% polyethene glycol (PEG 6000) solution and NaCl solution (200 mM) for 1 h and 6 h to simulate drought stress (D) and salt stress (S), respectively. CqACT was used as an internal reference gene, and the relative expression levels of CqAAT genes were calculated using the 2−ΔΔCT method. Different small letters in the same column mean significant difference at p < 0.05 using Tukey’s multiple-comparison test.
3.6. Functional Predictions for AAT Genes in Quinoa
Expression cluster analysis was conducted based on 675 AAT genes in quinoa, Arabidopsis, Tartary buckwheat, rice, and wheat, resulting in the identification of nine clusters. However, five CqAAT genes were excluded from the analysis as they showed no expression in any tissues (Table S8). The analysis revealed that members of Cluster 2 and Cluster 8 exhibited high expression specifically in roots, members of Cluster 3 in stems, members of Cluster 5 in leaves, and members of Cluster 1 in grains. Additionally, certain genes displayed high expression levels across multiple tissues, such as members of Cluster 4 in roots and grains, members of Cluster 6 in roots and stems, members of Cluster 7 in roots and leaves, and members of Cluster 9 in stems and leaves.
The functions of CqAAT genes were predicted based on the reported functions of AAT genes in other species, tissue expression clustering characteristics, and phylogenetic relationships. A preliminary diagram outlining the functions of CqAAT genes in quinoa was prepared (Figure 9, Table 3). Previous studies categorized the main functional classifications of quinoa into four types: the regulation of amino acid distribution, root uptake and transport, grain development and quality formation, and long-distance transport and distribution. For instance, AtAAP8 was found to impact embryonic development through amino acid transport and distribution in Arabidopsis. Consequently, its homologous gene in quinoa, CqATLb7, was predicted to regulate grain development and quality formation due to similar expression patterns. Similarly, AtAAP2 and AtAAP6 influence amino acid transport from the xylem to the phloem in Arabidopsis. The homologous genes of AtAAP2 and AtAAP6 in quinoa, CqCAT6 and CqAAP1, were predicted to regulate long-distance transport and the distribution of amino acids based on their expression patterns.
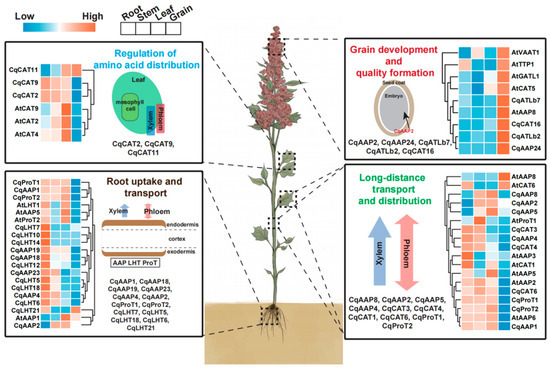
Figure 9.
Schematic diagram showing the predicted functions of CqAAT genes in quinoa. The diagram is based on the phylogenetic relationships and expression patterns of AAT genes in multiple species, and reports of AAT genes. All CqAAT genes in the figure are highly homologous to previously reported Arabidopsis AAT genes and their expression patterns are consistent. The heat map shows the homologous relationships between CqAAT and AtAAT genes and their expression patterns. The functions of CqAAT genes are based on previous studies and the corresponding references are listed in the text.
Table 3.
Functional prediction of AAT genes in Quinoa based on homology relationship, expression pattern and previous studies.
4. Discussion
Chenopodium quinoa, renowned for its protein-enriched edible seeds containing a favorable composition of essential amino acids, relies on intricate mechanisms for amino acid transport within tissues. Amino acids, vital building blocks synthesized through nitrogen fixation and photosynthesis, are transported through the action of amino acid transporters (AATs) within plants [53,54]. These transporters facilitate the movement of amino acids from source to sink tissues while regulating their levels within seeds. By ensuring a harmonious balance between amino acid uptake, storage, and utilization, AATs significantly influence the overall amino acid composition and content of seeds [9,55]. The role of AATs extends across various growth and development processes, encompassing amino acid absorption and translocation to seeds, long-distance transportation through the phloem, as well as transportation between the xylem and phloem, flower organ development, and responses to biotic and abiotic stresses.
Despite the fundamental importance of AATs in quinoa, comprehensive whole-genome studies on the AAT gene family in this species have been lacking. Such studies are invaluable for systematically identifying genes and unraveling their functions within the context of quinoa’s unique biology. Therefore, our study aimed to fill this gap by conducting a genome-wide analysis to identify and characterize AAT genes in quinoa, elucidating their family structures, assessing collinearity, examining expression patterns in different tissues, and exploring responses to abiotic stresses.
Our investigation revealed a total of 160 non-redundant AAT genes in quinoa, a number higher than that reported in several other plant species such as Arabidopsis (63), potato (72), rice (85), foxtail millet (94), Tartary buckwheat (104), and maize (107) but lower than the number of genes reported in hexaploid wheat (297) (Table 1). Subsequent analysis categorized these CqAAT genes into 12 subfamilies, including 8 subfamilies within the AAAP family and 4 within the APC gene family. Notably, the number of families identified in quinoa was relatively fewer compared to AAP subfamilies reported in monocots and ProT genes in eudicots (Table 1), indicating significant variations in AAT subfamily expansion between dicots and monocots.
Gene duplication events, a key driver of gene family expansion, directly contribute to the diversification of gene functions and species adaptation to changing environments by generating new genes. Both tandem duplication (TD) and segmental duplication (SD) events are key drivers of gene family expansion [55,56,57]. Our findings revealed that out of 160 genes, 140 CqAAT genes undergwent gene duplication events, with 46 and 94 genes involved in TD and SD events, respectively, and 15 genes were involved in both event types (Figure S1). SD may result in the duplication of larger DNA fragments and directly contributes to the increase in the number of CqAAT gene family members, thereby enhancing the functional diversity of the gene family. Additionally, the duplicated CqAAT genes may undergo mutations, recombination, and other genetic processes, potentially acquiring new functions that aid in organismal adaptation to environmental changes [58,59].
On the other hand, TD involves the alignment of identical or highly similar DNA sequences in close proximity within the CqAAT gene, forming contiguous repetitive sequences. The significance of TD in the CqAAT gene family lies in its ability to regulate gene expression through various mechanisms such as promoter enhancement, gene silencing, and post-transcriptional regulation. These regulatory mechanisms enable organisms to achieve precise physiological regulation in response to environmental stimuli [58,59].
The CqAAT protein structure further highlights the variability and diversity within different AAT subfamilies, with notable variations observed in the number of transmembrane (TM) regions in different subfamilies (Figure 1, Table S1). The number of TM regions ranged from 6–21 in ATLa subfamily proteins to 1–11 in LHT subfamily proteins (Table 2). Ka/Ks values were examined for all duplicated gene pairs to characterize the selective pressure on CqAAT genes, and a Ka/Ks value <1 was observed for all genes, suggesting a prevalence of purifying selection and signifying the maintenance of essential functions (Figure S2, Table S2).
Notably, TD gene pairs exhibited relatively higher Ka/Ks values than SD, emphasizing the critical role of TD in preserving integrity and removing deleterious alleles in the AAT gene family in quinoa. Similar trends were observed in other plant species such as Tartary buckwheat, foxtail millet, and wheat [22,23]. To reveal the uniqueness of this ancient crop in terms of genetic diversity and adaptive evolution, we constructed an evolutionary tree of quinoa (Figure 2). Previous studies have confirmed that the AAT gene family, existing widely in plants, is associated with a variety of biosynthetic pathways and plays an important role in plant growth and development and stress response [14,17]. By analyzing the evolution of the AAT gene subfamily in Quinoa, we found that this gene family experienced significant expansion and differentiation during the evolution of quinoa. These changes are closely related not only to the geographical distribution of quinoa, niche selection, and hybridization events with other species of quinoa but also to its unique nutritional properties such as high protein content, abundant mineral elements, and the production of natural phytoestrogens. These evolutionary characteristics of the AAT gene subfamily allow quinoa to respond to environmental stress and improve its survival but also give it a unique advantage as a human health food.
Moreover, we characterized the structures of the CqAAT genes and identified similar exon and intron structures. For instance, CqAAP7/CqAAP13 and CqAUX1/CqAUX4 exhibited consistent structures across most members of the same subfamily. However, variations in gene structures were also observed within AAT subfamilies, likely due to numerous gene pair duplications leading to structural differences (Figure 3). Moreover, the modification of the conserved AUX-motif 3 in CqAUX4 resulted in the differentiation of CqAUX genes and altered their three-dimensional conformations, impacting their functions (Figure 4 and Figure 5). Therefore, sequence variations, gene duplications, and changes in protein structure primarily account for the functional diversification of the AAT gene family in quinoa.
Clarifying spatiotemporal gene expression patterns is crucial for identifying essential functional genes and gathering evidence to predict gene functions [60]. Cis-acting elements, by binding to trans-acting factors and regulating gene expression, control the activity of target genes [61]. AAT genes exhibit robust responses to various stress factors, as evidenced by the abundance of stress-dependent cis-regulatory elements found in the promoter regions of the genes in this study. These elements encompass abiotic and biotic stress-responsive cis-elements such as defense, light, low temperature, and drought-responsive elements, as well as phytohormones like gibberellin, auxin, and salicylic acid-responsive elements. This observation suggests that AAT genes exhibit significant responsiveness to diverse stressors (Figure S3).
According to published transcriptome data, many CqAAT genes are expressed in grain, leaves, stems, and roots, potentially playing essential roles in the development of these tissues (Figure 7). Previous studies have indicated that AtAAP1 controls the import of amino acids into root cells or developing embryos and is significantly expressed in cotyledons and endosperm [13,18,28]. The early stages of developing embryos and endosperm may require AtAAP8 for amino acid uptake. In this study, we identified the highly specific expression of the homologues CqAAP15 and CqAAP24 in grain, suggesting that these two genes could primarily regulate the growth and development of grain, potentially influencing grain formation and quality. Additionally, CqAAP19 was found to be highly expressed in the roots and stems of quinoa, indicating its potential role in amino acid uptake by the roots. Similarly, AtAAP2, a homologous gene of CqAAP19, has been implicated in amino acid uptake in the root phloem in Arabidopsis, further supporting this evidence [29].
Drought and salinity are two major abiotic stresses affecting crops, leading to reduced yields and compromised quality. Studies have shown that under salinity and drought stress, plants typically adjust their osmotic potential by accumulating osmotically active substances and free amino acids. AAT genes can regulate amino acid compositions to cope with stress by accumulating excessive amounts of proline and other amino acids [20,26,62,63]. In this study, 12 representative AAT genes were selected for qRT-PCR verification to analyze quinoa’s responses to drought and salinity abiotic stresses. The results indicated that different members of the subfamily exhibit distinct stress response patterns (Figure 8). Notably, CqLHT14 and CqLAT1 showed continuous upregulation under both salinity and drought stress, suggesting a potential role in enhancing resistance and tolerance to drought and salt stress and positioning them as key candidate genes for further research.
We assessed the expression patterns of representative CqAAT genes in quinoa based on the known activities of AAT genes, evolutionary relationships, and expression patterns of AAT genes in different species (Figure 9). Similar to previous studies, the main functional classifications of AATs in quinoa were divided into four types comprising the regulation of amino acid distribution, root uptake and transport, grain development and quality formation, and long-distance transportation and distribution [64,65]. For example, Figure 9 shows the expression patterns of CqCAT11, CqCAT9, CqCAT2, CqCAT7, and CqCAT4 genes in different quinoa tissues (root, stem, leaf, and grain), suggesting their role in facilitating amino acid transport and balance across different parts of the plant. The expression patterns of these quinoa genes are consistent with their Arabidopsis homologs (AtCAT2, AtCAT4, AtCAT7, AtCAT9, and AtCAT11). Similarly, the expression levels of CqAAP1, CqAAP18, CqAAP19, CqAAP23, CqAAP4, and other related genes align with Arabidopsis homologs such as AtAAP1, AtAAP2, AtAAP4, AtAAP5, and others, indicating similar functional roles. These genes are responsible for the uptake and transport of amino acids from the soil through the roots.
CqAAP2, CqAAP24, CqATL7, CqATL2, CqCAT16, and other genes show homology with Arabidopsis genes such as AtVAA1, AtTTP1, AtGAT1, AtCAT5, and others, implying conserved functions in seed development and nutrient allocation. The genes are found crucial for grain development and the formation of quality traits in quinoa seeds. The expression of CqAAP8, CqAAP2, CqAAP5, CqCAT3, CqCAT4, and others was comparable with Arabidopsis homologs (e.g., AtAAP8, AtAAP2, AtCAT3, AtCAT4) suggest conserved roles in systemic amino acid transport. This process is essential for maintaining amino acid homeostasis throughout the plant. Therefore, we have high confidence in the functions of these genes, and they could be preferred candidate genes for investigating how to improve yields, quality, and abiotic stress resistance in quinoa.
5. Conclusions
Through genome-wide analysis, we have investigated 160 non-redundant CqAAT genes in quinoa, meticulously distributed across 18 chromosomes. These genes have been categorized into 12 distinct subfamilies, with 8 belonging to the AAAP category and 4 to the APC gene families. Our study has revealed gene duplication events in 140 CqAAT genes, with 46 genes involved in tandem duplications, 94 genes in segmental duplications, and 15 genes experiencing both tandem and segmental duplication events. These duplication events have significantly contributed to the expansion of the AAT gene family in quinoa. Moreover, the expression patterns of CqAAT gene family members across various tissues and their responses to drought and salt stress have unveiled unique expression profiles, indicating their roles in regulating amino acid distribution, root uptake and transport, grain development, quality formation, and long-distance transport. Notably, similarities with known functions in other species suggest potential roles of specific CqAAT genes, such as CqATLb7 in grain development and quality formation and CqCAT6 and CqAAP1 in the long-distance transport and distribution of amino acids. These comprehensive findings provide a solid foundation for a better understanding of the genomic organization, expression dynamics, and functional role of the AAT gene family. Future studies can focus on understanding the precise roles and mechanisms of CqCAT6 and CqAAP1 as potential regulators of long-distance amino acid transporters in improving amino acid distribution and overall plant health. Additionally, investigating the involvement of AAT genes in quinoa’s response to other abiotic stresses, such as cold, heat, and nutrient deficiencies, could be valuable. Comparative transcriptomic and metabolomic analyses could be utilized to understand how AAT genes contribute to the accumulation of osmoprotectants and stress-responsive metabolites.
Supplementary Materials
The following supporting information can be downloaded at: https://www.mdpi.com/article/10.3390/agronomy14081648/s1, Figure S1. Chromosomal localizations of CqAAT genes and gene duplication events. Tandem duplication and segmental duplication are denoted by blue shadows and red lines, respectively. Figure S2. Distribution of Ka/Ks values for CqAAT subfamily members and duplicated CqAAT gene pairs. (A) Distribution of Ka/Ks values for tandem duplicated (TD) and segmental duplicated (SD) gene pairs. (B) Ka/Ks density for all duplicated CqAAT gene pairs. (C) Distribution of Ka/Ks values for duplicated CqAAT gene pairs in different subfamilies. Figure S3. Numbers of cis-regulatory elements in CqAATs in quinoa. The heat map shows the number of cis-acting elements within 2000 bp upstream of CqAAT genes, and different colored fonts represent different types. Figure S4. Expression patterns of AAT genes in Arabidopsis, Tartary buckwheat, rice and wheat. The expression levels of AtAATs, FtAATs, OsAATs, and TaAATs were obtained from public databases, and the expression patterns of these genes were clustered and analyzed using the R package Mfuzz. Table S1. The detail information and sequence characterization of 160 putative AAT genes in Quinoa. Table S2. Analysis of selection pressure for duplicated gene pairs based on the ratios (Ka/Ks) of non-synonymous (Ka) and synonymous (Ks). Table S3. Protein sequence with 20 conserved motifs. Table S4. The collinearity diagram of AAT genes in quinoa and six other representative plants. Table S5. The expression characteristics and clustering of 160 CqAAT genes in Quinoa. Table S6. The primers used for Quantitative Real-Time PCR (qRT-PCR) under drought stress and salt stress. Table S7. The raw data of qRT-PCR in three replications. Table S8. Expression characteristics and clustering of AAT genes in Quinoa, Arabidopsis, Tartary buckwheat, Rice and Wheat.
Author Contributions
Conceptualization, M.S. and Z.G.; writing—review and editing, L.L.; methodology, J.H.; software, Y.Z.; validation, X.Y. and T.G.; formal analysis, P.D.; data curation, A.R.; resources, X.W. All authors have read and agreed to the published version of the manuscript.
Funding
This work was funded by the Scientific Research Project of Shanxi Province Outstanding Doctoral Work Award Fund (SXBYKY2022022), the Fundamental Research Program of Shanxi Province (202103021223158), and the Scientific and Technological Innovation Programs of Shanxi Agricultural University (2021BQ82). We thank the anonymous reviewer for the constructive scientific review of this manuscript.
Data Availability Statement
Data available on request due to restrictions ethical reasons.
Acknowledgments
We gratefully thank our team members for conducting the related experiment. We thank the anonymous reviewer for the constructive scientific review of this manuscript.
Conflicts of Interest
Author Xiangyun Wu was employed by the company Shanxi Jiaqi Agri-Tech Co., Ltd. The remaining authors declare that the research was conducted in the absence of any commercial or financial relationships that could be construed as a potential conflict of interest.
References
- Choukr-Allah, R.; Rao, N.K.; Hirich, A.; Shahid, M.; Alshankiti, A.; Toderich, K.; Gill, S.; Butt, K.U. Quinoa for marginal environments: Toward future food and nutritional security in MENA and Central Asia Regions. Front. Plant Sci. 2016, 7, 346. [Google Scholar] [CrossRef] [PubMed]
- López-Marqués, R.L.; Nørrevang, A.F.; Ache, P.; Moog, M.; Visintainer, D.; Wendt, T.; Østerberg, J.T.; Dockter, C.; Jørgensen, M.E.; Salvador, A.T.; et al. Prospects for the accelerated improvement of the resilient crop quinoa. J. Exp. Bot. 2020, 71, 5333–5347. [Google Scholar] [CrossRef]
- Grimberg, A.; Saripella, G.V.; Repo-Carrasco Valencia, R.A.; Bengtsson, T.; Alandia, G.; Carlsson, A.S. Transcriptional regulation of quinoa seed quality: Identification of novel candidate genetic markers for increased protein content. Front. Plant Sci. 2022, 13, 816425. [Google Scholar] [CrossRef] [PubMed]
- Bastidas, E.G.; Roura, R.; Rizzolo, D.A.D.; Massanés, T.; Gomis, R. Quinoa (Chenopodium quinoa Willd.), from nutritional value to potential health benefits: An integrative review. J. Nutr. Food Sci. 2016, 6, 3. [Google Scholar] [CrossRef]
- Vega-Galvez, A.; Miranda, M.; Vergara, J.; Uribe, E.; Puente, L.; Martinez, E.A. Nutrition facts and functional potential of quinoa (Chenopodium quinoa Willd.), an ancient Andean grain: A review. J. Sci. Food Agric. 2010, 90, 2541–2547. [Google Scholar] [CrossRef] [PubMed]
- Rentsch, D.; Schmidt, S.; Tegeder, M. Transporters for uptake and allocation of organic nitrogen compounds in plants. FEBS Lett. 2007, 581, 2281–2289. [Google Scholar] [CrossRef] [PubMed]
- Tegeder, M.; Offler, C.E.; Frommer, W.B.; Patrick, J.W. Amino acid transporters are localized to transfer cells of developing pea seeds. Plant Physiol. 2000, 122, 319–326. [Google Scholar] [CrossRef] [PubMed]
- Tegeder, M. Transporters for amino acids in plant cells: Some functions and many unknowns. Curr. Opin. Plant Biol. 2012, 15, 315–321. [Google Scholar] [CrossRef]
- Williams, L.; Miller, A. Transporters responsible for the uptake and partitioning of nitrogenous solutes. Annu. Rev. Plant Physiol. Plant Mol. Biol. 2001, 52, 659–688. [Google Scholar] [CrossRef]
- Koch, W.; Kwart, M.; Laubner, M.; Heineke, D.; Stransky, H.; Frommer, W.B.; Tegeder, M. Reduced amino acid content in transgenic potato tubers due to antisense inhibition of the leaf H+/amino acid symporter StAAP1. Plant J. 2003, 33, 211–220. [Google Scholar] [CrossRef]
- Tegeder, M.; Rentsch, D. Uptake and partitioning of amino acids and peptides. Mol. Plant 2010, 3, 997–1011. [Google Scholar] [CrossRef] [PubMed]
- Rolletschek, H.; Hosein, F.; Miranda, M.; Heim, U.; Götz, K.P.; Schlereth, A.; Borisjuk, L.; Saalbach, I.; Wobus, U.; Weber, H. Ectopic expression of an amino acid transporter (VfAAP1) in seeds of Vicia narbonensis and pea increases storage proteins. Plant Physiol. 2005, 137, 1236–1249. [Google Scholar] [CrossRef] [PubMed]
- Lee, Y.H.; Foster, J.; Chen, J.; Voll, L.M.; Weber, A.P.; Tegeder, M. AAP1 transports uncharged amino acids into roots of Arabidopsis. Plant J. 2007, 50, 305–319. [Google Scholar] [CrossRef] [PubMed]
- Svennerstam, H.; Ganeteg, U.; Nasholm, T. Root uptake of cationic amino acids by Arabidopsis depends on functional expression of amino acid permease 5. New Phytol. 2008, 180, 620–630. [Google Scholar] [CrossRef]
- Wipf, D.; Loque, D.; Lalonde, S.; Frommer, W.B. Amino acid transporter inventory of the selaginella genome. Front. Plant Sci. 2012, 3, 36. [Google Scholar] [CrossRef] [PubMed]
- Zhao, H.; Ma, H.; Yu, L.; Wang, X.; Zhao, J. Genome-wide survey and expression analysis of amino acid transporter gene family in rice (Oryza sativa L.). PLoS ONE 2012, 7, e49210. [Google Scholar] [CrossRef]
- Hunt, E.; Gattolin, S.; Newbury, H.J.; Bale, J.S.; Tseng, H.M.; Barrett, D.A.; Pritchard, J. A mutation in amino acid permease AAP6 reduces the amino acid content of the Arabidopsis sieve elements but leaves aphid herbivores unaffected. J. Exp. Bot. 2010, 61, 55–64. [Google Scholar] [CrossRef] [PubMed]
- Sanders, A.; Collier, R.; Trethewy, A.; Gould, G.; Sieker, R.; Tegeder, M. AAP1 regulates import of amino acids into developing Arabidopsis embryos. Plant J. 2009, 59, 540–552. [Google Scholar] [CrossRef]
- Okumoto, S.; Pilot, G. Amino acid export in plants: A missing link in nitrogen cycling. Mol. Plant 2011, 4, 453–463. [Google Scholar] [CrossRef]
- Ma, H.; Cao, X.; Shi, S.; Li, S.; Gao, J.; Ma, Y.; Zhao, Q.; Chen, Q. Genome-wide survey and expression analysis of the amino acid transporter superfamily in potato (Solanum tuberosum L.). Plant Physiol. Biochem. 2016, 107, 164–177. [Google Scholar] [CrossRef]
- Yang, Y.; Wang, X.; Zheng, J.; Men, Y.; Zhang, Y.; Liu, L.; Han, Y.; Hou, S.; Sun, Z. Amino acid transporter (AAT) gene family in Tartary buckwheat (Fagopyrum tataricum L. Gaertn.): Characterization, expression analysis and functional prediction. Int. J. Biol. Macromol. 2022, 217, 330–344. [Google Scholar] [CrossRef] [PubMed]
- Yang, Y.; Chai, Y.; Liu, J.; Zheng, J.; Zhao, Z.; Amo, A.; Cui, C.; Lu, Q.; Chen, L.; Hu, Y.G. Amino acid transporter (AAT) gene family in foxtail millet (Setaria italica L.): Widespread family expansion, functional differentiation, roles in quality formation and response to abiotic stresses. BMC Genom. 2021, 22, 519. [Google Scholar] [CrossRef] [PubMed]
- Tian, R.; Yang, Y.; Chen, M. Genome-wide survey of the amino acid transporter gene family in wheat (Triticum aestivum L.): Identification, expression analysis and response to abiotic stress. Int. J. Biol. Macromol. 2020, 162, 1372–1387. [Google Scholar] [CrossRef] [PubMed]
- Cheng, L.; Yuan, H.Y.; Ren, R.; Zhao, S.Q.; Han, Y.P.; Zhou, Q.Y.; Ke, D.X.; Wang, Y.X.; Wang, L. Genome-wide identification, classification, and expression analysis of amino acid transporter gene family in Glycine max. Front. Plant Sci. 2016, 7, 515. [Google Scholar] [CrossRef] [PubMed]
- Fischer, W.N.; Kwart, M.; Hummel, S.; Frommer, W.B. Substrate specificity and expression profile of amino acid transporters (AAPs) in Arabidopsis. J. Biol. Chem. 1995, 270, 16315–16320. [Google Scholar] [CrossRef] [PubMed]
- Okumoto, S.; Schmidt, R.; Tegeder, M.; Fischer, W.N.; Rentsch, D.; Frommer, W.B.; Koch, W. High affinity amino acid transporters specifically expressed in xylem parenchyma and developing seeds of Arabidopsis. J. Biol. Chem. 2002, 277, 45338–45346. [Google Scholar] [CrossRef] [PubMed]
- Couturier, J.; de Fay, E.; Fitz, M.; Wipf, D.; Blaudez, D.; Chalot, M. PtAAP11, a high affinity amino acid transporter specifically expressed in differentiating xylem cells of poplar. J. Exp. Bot. 2010, 61, 1671–1682. [Google Scholar] [CrossRef] [PubMed]
- Hirner, B.; Fischer, W.N.; Rentsch, D.; Kwart, M.; Frommer, W.B. Developmental control of H+/amino acid permease gene expression during seed development of Arabidopsis. Plant J. 1998, 14, 535–544. [Google Scholar] [CrossRef]
- Zhang, L.; Tan, Q.; Lee, R.; Trethewy, A.; Lee, Y.H.; Tegeder, M. Altered xylem-phloem transfer of amino acids affects metabolism and leads to increased seed yield and oil content in Arabidopsis. Plant Cell 2010, 22, 3603–3620. [Google Scholar] [CrossRef]
- Swarup, R.; Kargul, J.; Marchant, A.; Zadik, D.; Rahman, A.; Mills, R.; Yemm, A.; May, S.; Williams, L.; Millner, P.; et al. Structure-function analysis of the presumptive Arabidopsis auxin permease AUX1. Plant Cell 2004, 16, 3069–3083. [Google Scholar] [CrossRef]
- Swarup, K.; Benkova, E.; Swarup, R.; Casimiro, I.; Peret, B.; Yang, Y.; Parry, G.; Nielsen, E.; De Smet, I.; Vanneste, S.; et al. The auxin influx carrier LAX3 promotes lateral root emergence. Nat. Cell Biol. 2008, 10, 946–954. [Google Scholar] [CrossRef] [PubMed]
- Hirner, A.; Ladwig, F.; Stransky, H.; Okumoto, S.; Keinath, M.; Harms, A.; Frommer, W.B.; Koch, W.J. Arabidopsis LHT1 is a high-affinity transporter for cellular amino acid uptake in both root epidermis and leaf mesophyll. Plant Cell 2006, 18, 1931–1946. [Google Scholar] [CrossRef]
- Forsum, O.; Svennerstam, H.; Ganeteg, U.; Nasholm, T. Capacities and constraints of amino acid utilization in Arabidopsis. New Phytol. 2008, 179, 1058–1069. [Google Scholar] [CrossRef] [PubMed]
- Lee, Y.H.; Tegeder, M. Selective expression of a novel high-affinity transport system for acidic and neutral amino acids in the tapetum cells of Arabidopsis flowers. Plant J. 2004, 40, 60–74. [Google Scholar] [CrossRef]
- Ji, Y.; Huang, W.; Wu, B.; Fang, Z.; Wang, X. The amino acid transporter AAP1 mediates growth and grain yield by regulating neutral amino acid uptake and reallocation in Oryza sativa. J. Exp. Bot. 2020, 71, 4763–4777. [Google Scholar] [CrossRef]
- Yang, X.; Yang, G.; Wei, X.; Huang, W.; Fang, Z. OsAAP15, an amino acid transporter in response to nitrogen concentration, mediates panicle branching and grain yield in rice. Plant Sci. 2023, 330, 111640. [Google Scholar] [CrossRef]
- Su, Y.H.; Frommer, W.B.; Ludewig, U. Molecular and functional characterization of a family of amino acid transporters from Arabidopsis. Plant Physiol. 2004, 136, 3104–3113. [Google Scholar] [CrossRef] [PubMed]
- Kohl, S.; Hollmann, J.; Blattner, F.R.; Radchuk, V.; Andersch, F.; Steuernagel, B.; Schmutzer, T.; Scholz, U.; Krupinska, K.; Weber, H.; et al. A putative role for amino acid permeases in sink-source communication of barley tissues uncovered by RNA-seq. BMC Plant Biol. 2012, 12, 154. [Google Scholar] [CrossRef]
- Yu, S.T.; Yu, H.B.; Yu, G.Q.; Zhao, L.R.; Sun, H.X.; Tang, Y.Y.; Wang, X.Z.; Wu, Q.; Sun, Q.X.; Wang, C.T. Isolation of differentially expressed genes from developing seeds of a high-protein peanut mutant and its wild type using genefishing TM Technology. In Adv Appl Biotechnol: Proceedings of the 2nd International Conference on Applied Biotechnology (ICAB 2014) 2015; Springer: Berlin/Heidelberg, Germany, 2015; Volume I, pp. 37–45. [Google Scholar] [CrossRef]
- Berg, J.A.; Hermans, F.W.K.; Beenders, F.; Abedinpour, H.; Vriezen, W.H.; Visser, R.G.F.; Bai, Y.; Schouten, H.J. The amino acid permease (AAP) genes CsAAP2A and SlAAP5A/B are required for oomycete susceptibility in cucumber and tomato. Mol. Plant Pathol. 2021, 22, 658–672. [Google Scholar] [CrossRef]
- Yao, X.; Li, H.; Nie, J.; Liu, H.; Guo, Y.; Lv, L.; Yang, Z.; Sui, X. Disruption of the amino acid transporter CsAAP2 inhibits auxin-mediated root development in cucumber. New Phytol. 2023, 239, 639–659. [Google Scholar] [CrossRef]
- Lehmann, S.; Gumy, C.; Blatter, E.; Boeffel, S.; Fricke, W.; Rentsch, D. In planta function of compatible solute transporters of the AtProT family. J. Exp. Bot. 2011, 62, 787–796. [Google Scholar] [CrossRef] [PubMed]
- Ueda, A.; Shi, W.; Sanmiya, K.; Shono, M.; Takabe, T. Functional analysis of salt-inducible proline transporter of barley roots. Plant Cell Physiol. 2001, 42, 1282–1289. [Google Scholar] [CrossRef] [PubMed]
- Na, G.U.O.; Dong, X.U.E.; Zhang, W.; Zhao, J.M.; Xue, C.C.; Qiang, Y.A.N.; Xue, J.Y.; Wang, H.T.; Zhang, Y.M.; Han, X.I.N.G. Overexpression of GmProT1 and GmProT2 increases tolerance to drought and salt stresses in transgenic Arabidopsis. J. Integ Agric. 2016, 15, 1727–1743. [Google Scholar] [CrossRef]
- Wang, Y.; Tang, H.; DeBarry, J.D.; Tan, X.; Li, J.; Wang, X.; Lee, T.H.; Jin, H.; Marler, B.; Guo, H.; et al. MCScanX: A toolkit for detection and evolutionary analysis of gene synteny and collinearity. Nucleic Acids Res. 2012, 40, e49. [Google Scholar] [CrossRef] [PubMed]
- Wang, M.; Yue, H.; Feng, K.; Deng, P.; Song, W.; Nie, X. Genome-wide identification, phylogeny and expressional profiles of mitogen activated protein kinase kinase kinase (MAPKKK) gene family in bread wheat (Triticum aestivum L.). BMC Genom. 2016, 17, 668. [Google Scholar] [CrossRef] [PubMed]
- Chen, C.; Chen, H.; Zhang, Y.; Thomas, H.R.; Frank, M.H.; He, Y.; Xia, R. TBtools: An Integrative Toolkit Developed for Interactive Analyses of Big Biological Data. Mol. Plant 2020, 13, 1194–1202. [Google Scholar] [CrossRef] [PubMed]
- Wang, D.; Zhang, Y.; Zhang, Z.; Zhu, J.; Yu, J.J.G. Proteomics, Bioinformatics, KaKs_Calculator 2.0: A toolkit incorporating gamma-series methods and sliding window strategies. Genom. Proteom. Bioinform. 2010, 8, 77–80. [Google Scholar] [CrossRef] [PubMed]
- Tamura, K.; Stecher, G.; Peterson, D.; Filipski, A.; Kumar, S. MEGA6: Molecular evolutionary genetics analysis version 6.0. Mol. Biol. Evol. 2013, 30, 2725–2729. [Google Scholar] [CrossRef]
- Robert, X.; Gouet, P. Deciphering key features in protein structures with the new ENDscript server. Nucleic Acids Res. 2014, 42, W320–W324. [Google Scholar] [CrossRef]
- Lescot, M.; Déhais, P.; Thijs, G.; Marchal, K.; Moreau, Y.; Van de Peer, Y.; Rouzé, P.; Rombauts, S. PlantCARE, a database of plant cis-acting regulatory elements and a portal to tools for in silico analysis of promoter sequences. Nucleic Acids Res. 2002, 30, 325–327. [Google Scholar] [CrossRef]
- Livak, K.J.; Schmittgen, T.D. Analysis of relative gene expression data using real-time quantitative PCR and the 2− ΔΔCT method. Methods 2001, 25, 402–408. [Google Scholar] [CrossRef] [PubMed]
- Ortiz-Lopez, A.; Chang, H.C.; Bush, D.R. Amino acid transporters in plants. Biochim. Biophys. Acta Biomembr. 2000, 1465, 275–280. [Google Scholar] [CrossRef] [PubMed]
- Williams, L.E.; Bick, J.A.; Neelam, A.; Weston, K.N.; Hall, J.L. Biochemical and molecular characterization of sucrose and amino acid carriers in Ricinus communis. J. Exp. Bot. 1996, 47, 1211–1216. [Google Scholar] [CrossRef] [PubMed]
- Kong, H.; Landherr, L.L.; Frohlich, M.W.; Leebens-Mack, J.; Ma, H.; DePamphilis, C.W. Patterns of gene duplication in the plant SKP1 gene family in angiosperms: Evidence for multiple mechanisms of rapid gene birth. Plant J. 2007, 50, 873–885. [Google Scholar] [CrossRef] [PubMed]
- Moore, R.C.; Purugganan, M.D. The early stages of duplicate gene evolution. Proc. Natl. Acad. Sci. USA 2003, 100, 15682–15687. [Google Scholar] [CrossRef] [PubMed]
- Li, W.H.; Gojobori, T.; Nei, M. Pseudogenes as a paradigm of neutral evolution. Nature 1981, 292, 237–239. [Google Scholar] [CrossRef] [PubMed]
- Die, J.V.; Castro, P.; Millán, T.; Gil, J. Segmental and tandem duplications driving the recent NBS-LRR gene expansion in the asparagus genome. Genes 2018, 9, 568. [Google Scholar] [CrossRef] [PubMed]
- Li, Q.; Yu, H.; Cao, P.B.; Fawal, N.; Mathé, C.; Azar, S.; Cassan-Wang, H.; Myburg, A.A.; Grima-Pettenati, J.; Marque, C.; et al. Explosive tandem and segmental duplications of multigenic families in Eucalyptus grandis. Genome Biol. Evol. 2015, 7, 1068–1081. [Google Scholar] [CrossRef]
- Schilling, S.; Kennedy, A.; Pan, S.; Jermiin, L.S.; Melzer, R. Genome-wide analysis of MIKC-type MADS-box genes in wheat: Pervasive duplications, functional conservation and putative neofunctionalization. New Phytol. 2020, 225, 511–529. [Google Scholar] [CrossRef]
- Liu, Y.; Patra, B.; Pattanaik, S.; Wang, Y.; Yuan, L. GATA and phytochrome interacting factor transcription factors regulate light-induced vindoline biosynthesis in Catharanthus roseus. Plant Physiol. 2019, 180, 1336–1350. [Google Scholar] [CrossRef]
- Tarczynski, M.C.; Jensen, R.G.; Bohnert, H.J.J.S. Stress protection of transgenic tobacco by production of the osmolyte mannitol. Science 1993, 259, 508–510. [Google Scholar] [CrossRef] [PubMed]
- Rentsch, D.; Hirner, B.; Schmelzer, E.; Frommer, W.B. Salt stress-induced proline transporters and salt stress-repressed broad specificity amino acid permeases identified by suppression of a yeast amino acid permease-targeting mutant. Plant Cell 1996, 8, 1437–1446. [Google Scholar] [CrossRef] [PubMed]
- Dinkeloo, K.; Boyd, S.; Pilot, G. Update on amino acid transporter functions and on possible amino acid sensing mechanisms in plants. Semin. Cell Dev. Biol. 2018, 74, 105–113. [Google Scholar] [CrossRef] [PubMed]
- Dhatterwal, P.; Mehrotra, S.; Miller, A.J.; Mehrotra, R. Promoter profiling of Arabidopsis amino acid transporters: Clues for improving crops. Plant Mol. Biol. 2021, 107, 451–475. [Google Scholar] [CrossRef]


Disclaimer/Publisher’s Note: The statements, opinions and data contained in all publications are solely those of the individual author(s) and contributor(s) and not of MDPI and/or the editor(s). MDPI and/or the editor(s) disclaim responsibility for any injury to people or property resulting from any ideas, methods, instructions or products referred to in the content. |
© 2024 by the authors. Licensee MDPI, Basel, Switzerland. This article is an open access article distributed under the terms and conditions of the Creative Commons Attribution (CC BY) license (https://creativecommons.org/licenses/by/4.0/).