Article

Optimizing the Water and Nitrogen Management Scheme to Enhance Potato Yield and Water–Nitrogen Use Efficiency

1
College of Water Conservancy and Hydropower Engineering, Gansu Agricultural University, Lanzhou 730070, China
2
DAYU IRRIGATION GROUP Co., Ltd., Lanzhou 730050, China
*
Author to whom correspondence should be addressed.
Agronomy 2024, 14(8), 1651; https://doi.org/10.3390/agronomy14081651 (registering DOI)
Submission received: 25 June 2024 / Revised: 20 July 2024 / Accepted: 22 July 2024 / Published: 27 July 2024
(This article belongs to the Section Water Use and Irrigation)

Abstract

:
Water and nitrogen are the primary constraints on improving agricultural productivity. The aims of this study are to investigate the synergistic effects of water and nitrogen, optimize their combination schemes under mulched drip irrigation systems in the northwest region of China, and offer scientific insight into enhancing water and nitrogen use efficiency in potato cultivation. The traditional cultivar “Qing Shu 10” was chosen for the test material. A two-year field study on potato water–nitrogen interaction was conducted in the central Hexi Corridor, within Ganzhou District of Zhangye City, with three irrigation levels (W1 (336 mm), W2 (408 mm), and W3 (480 mm)) and three nitrogen application rates (N1 (44 kg ha−1), N2 (192 kg ha−1), and N3 (240 kg ha−1)) using a fully randomized combination design, resulting in nine treatments. This study examined the varying responses in potato yield and water–nitrogen use efficiency to different water–nitrogen combinations in the Hexi Corridor region, developed a mathematical regression model to predict the economic benefit of potatoes based on water–nitrogen interactions, and refined the application strategy. The results indicated that both the volume of irrigation water and the rate of nitrogen application significantly influenced potato yield and water–nitrogen utilization efficiency. A distinct interactive effect was observed between irrigation volume and nitrogen application rate. The reduced irrigation volume restricted nitrogen uptake, with an average increase of 31.87% in nitrogen fertilizer partial productivity and 31.54% in potato yield when moving from W1 to W2 over two years and only a 6.02% and 5.48% increase from W2 to W3, respectively. Similarly, reduced nitrogen application rates also hindered water uptake by potatoes, with increases of 9.05% in water use efficiency, 12.14% in irrigation water use efficiency, 12.12% in yield from N1 to N2, and only 1.98% and 1.69% increases in irrigation water use efficiency and yield from N2 to N3, while water use efficiency decreased by 1.17%. The highest yield values over the two-year period were observed in the N2W3 treatment, with 43,493.54 and 43,082.19 kg ha−1. The irrigation volume, nitrogen application rate, and potato economic benefit were well modeled by a quadratic regression, with an R2 of 0.996 for both predicted and actual economic benefit over two years, indicating a trend of initial increase followed by a decrease as water and nitrogen levels increased. Through simulation optimization and a thorough analysis of multiple indicators, the N2W3 treatment yielded an economic benefit exceeding 25,391.13 CNY ha−1 and demonstrated a high water–nitrogen utilization efficiency. This treatment not only enhances potato economic benefit but also minimizes agricultural resource inputs, establishing it as the optimal water and fertilizer management strategy for this study.

1. Introduction

The frequent occurrence of extreme weather, local conflicts, reduced arable land, and the deteriorating trade environment significantly challenge agricultural production [1,2,3]. Concurrently, growing global populations and rising consumption levels are driving a sustained, rigid increase in food demand [4,5]. Food security is essential for societal and economic progress and human survival [6]. Thus, increasing grain yields and achieving sustainable agricultural development are major challenges for governments and academic institutions globally. Potatoes, the fourth most abundant staple crop globally, only yield less than corn, rice, and wheat and are crucial for food security, poverty alleviation, and enhancing nutrition [7,8,9]. Since 2015, China has initiated a project to cultivate potatoes as a key staple, resulting in a continuous increase in potato cultivation areas [10]. Particularly in China’s northwest, the cool climate is ideal for tuberous crops such as potatoes, making it a major potato-growing region in the country. However, due to an arid climate and a harsh natural environment, potato yields vary widely, from 5.1 to 70.6 t ha−1 [11], and practices like flood irrigation and excessive fertilization are prevalent [12]. Therefore, enhancing water use efficiency, minimizing fertilizer application, and stabilizing potato yields are crucial for environmental stewardship and rural revitalization in this region.
Water is the principal constraint on agricultural development in semi-arid and arid regions. Potatoes, as shallow-rooted plants, are sensitive to water requirements throughout their entire growth period, and both insufficient and excessive water can affect the formation of tuber yield [13]. Nevertheless, the northwest region experiences sparse and erratic rainfall, and the reliance on excessive irrigation for an increasing number of crops, including potatoes, significantly impacts both agricultural productivity and the ecological environment [14,15]. Furthermore, excessive irrigation can disrupt the natural water cycle and balance, overconsume groundwater resources, and easily lead to significant water waste through deep percolation [16,17,18,19]. At the same time, the irrational matching between agronomic water-saving and irrigation technologies can also hinder potato yield development. Thus, transforming the pathways of farmland water use and improving the water use efficiency of potatoes are vital strategies for alleviating the water resource contradiction in the northwest region. Nitrogen fertilizer is also one of the main factors limiting potato yield. A nitrogen deficiency can impede root development and chlorophyll synthesis, diminish photosynthetic capacity, disrupt the allocation of photosynthetic products, and result in reduced crop yields [20]. In contrast, an over-application of nitrogen can escalate economic costs and lead to soil salinization, groundwater contamination, and other soil degradation issues [21,22]. Additionally, the yield-increasing effect of nitrogen fertilizer is subject to the law of diminishing returns, which can result in excessive vegetative growth, or “lankiness”, negatively impacting economic benefits. It is clear that optimizing nitrogen fertilizer use is essential for the sustainable development of agriculture.
Water and fertilizer are pivotal environmental factors influencing plant growth, development, yield, and quality and are among the more manageable aspects of environmental control. Thus, balancing water and fertilizer is an effective strategy for enhancing crop production efficiency. Numerous studies indicate that proper water and fertilizer management is essential for achieving high yields, improving quality, increasing the efficiency of resource use, boosting economic returns, and enhancing soil fertility [23,24,25]. Yet, in practice, farmers often neglect the synergistic effects of water and fertilizer, mistakenly assuming that high-input practices are the key to high potato yields, resulting in nitrogen leaching that degrades soil fertility. Hence, adopting a model that adjusts fertilizer application according to water availability and yield potential while ensuring soil health, stable yields, and environmental sustainability is crucial for the sustainable management of potato cultivation. Despite extensive research on the interplay of water and fertilizer in the context of cereal crop growth, development, yield, and resource efficiency, few studies address the optimal water–fertilizer integration for potatoes under mulched drip irrigation in the northwest, and even fewer explore the quantitative optimization of water and nitrogen management strategies using regression models and optimization algorithms. In view of this, the aim of this study was to investigate the synergistic effects of water and nitrogen on potato yield and water–nitrogen use efficiency and to optimize their management under mulched drip irrigation systems in the Hexi Corridor.

2. Materials and Methods

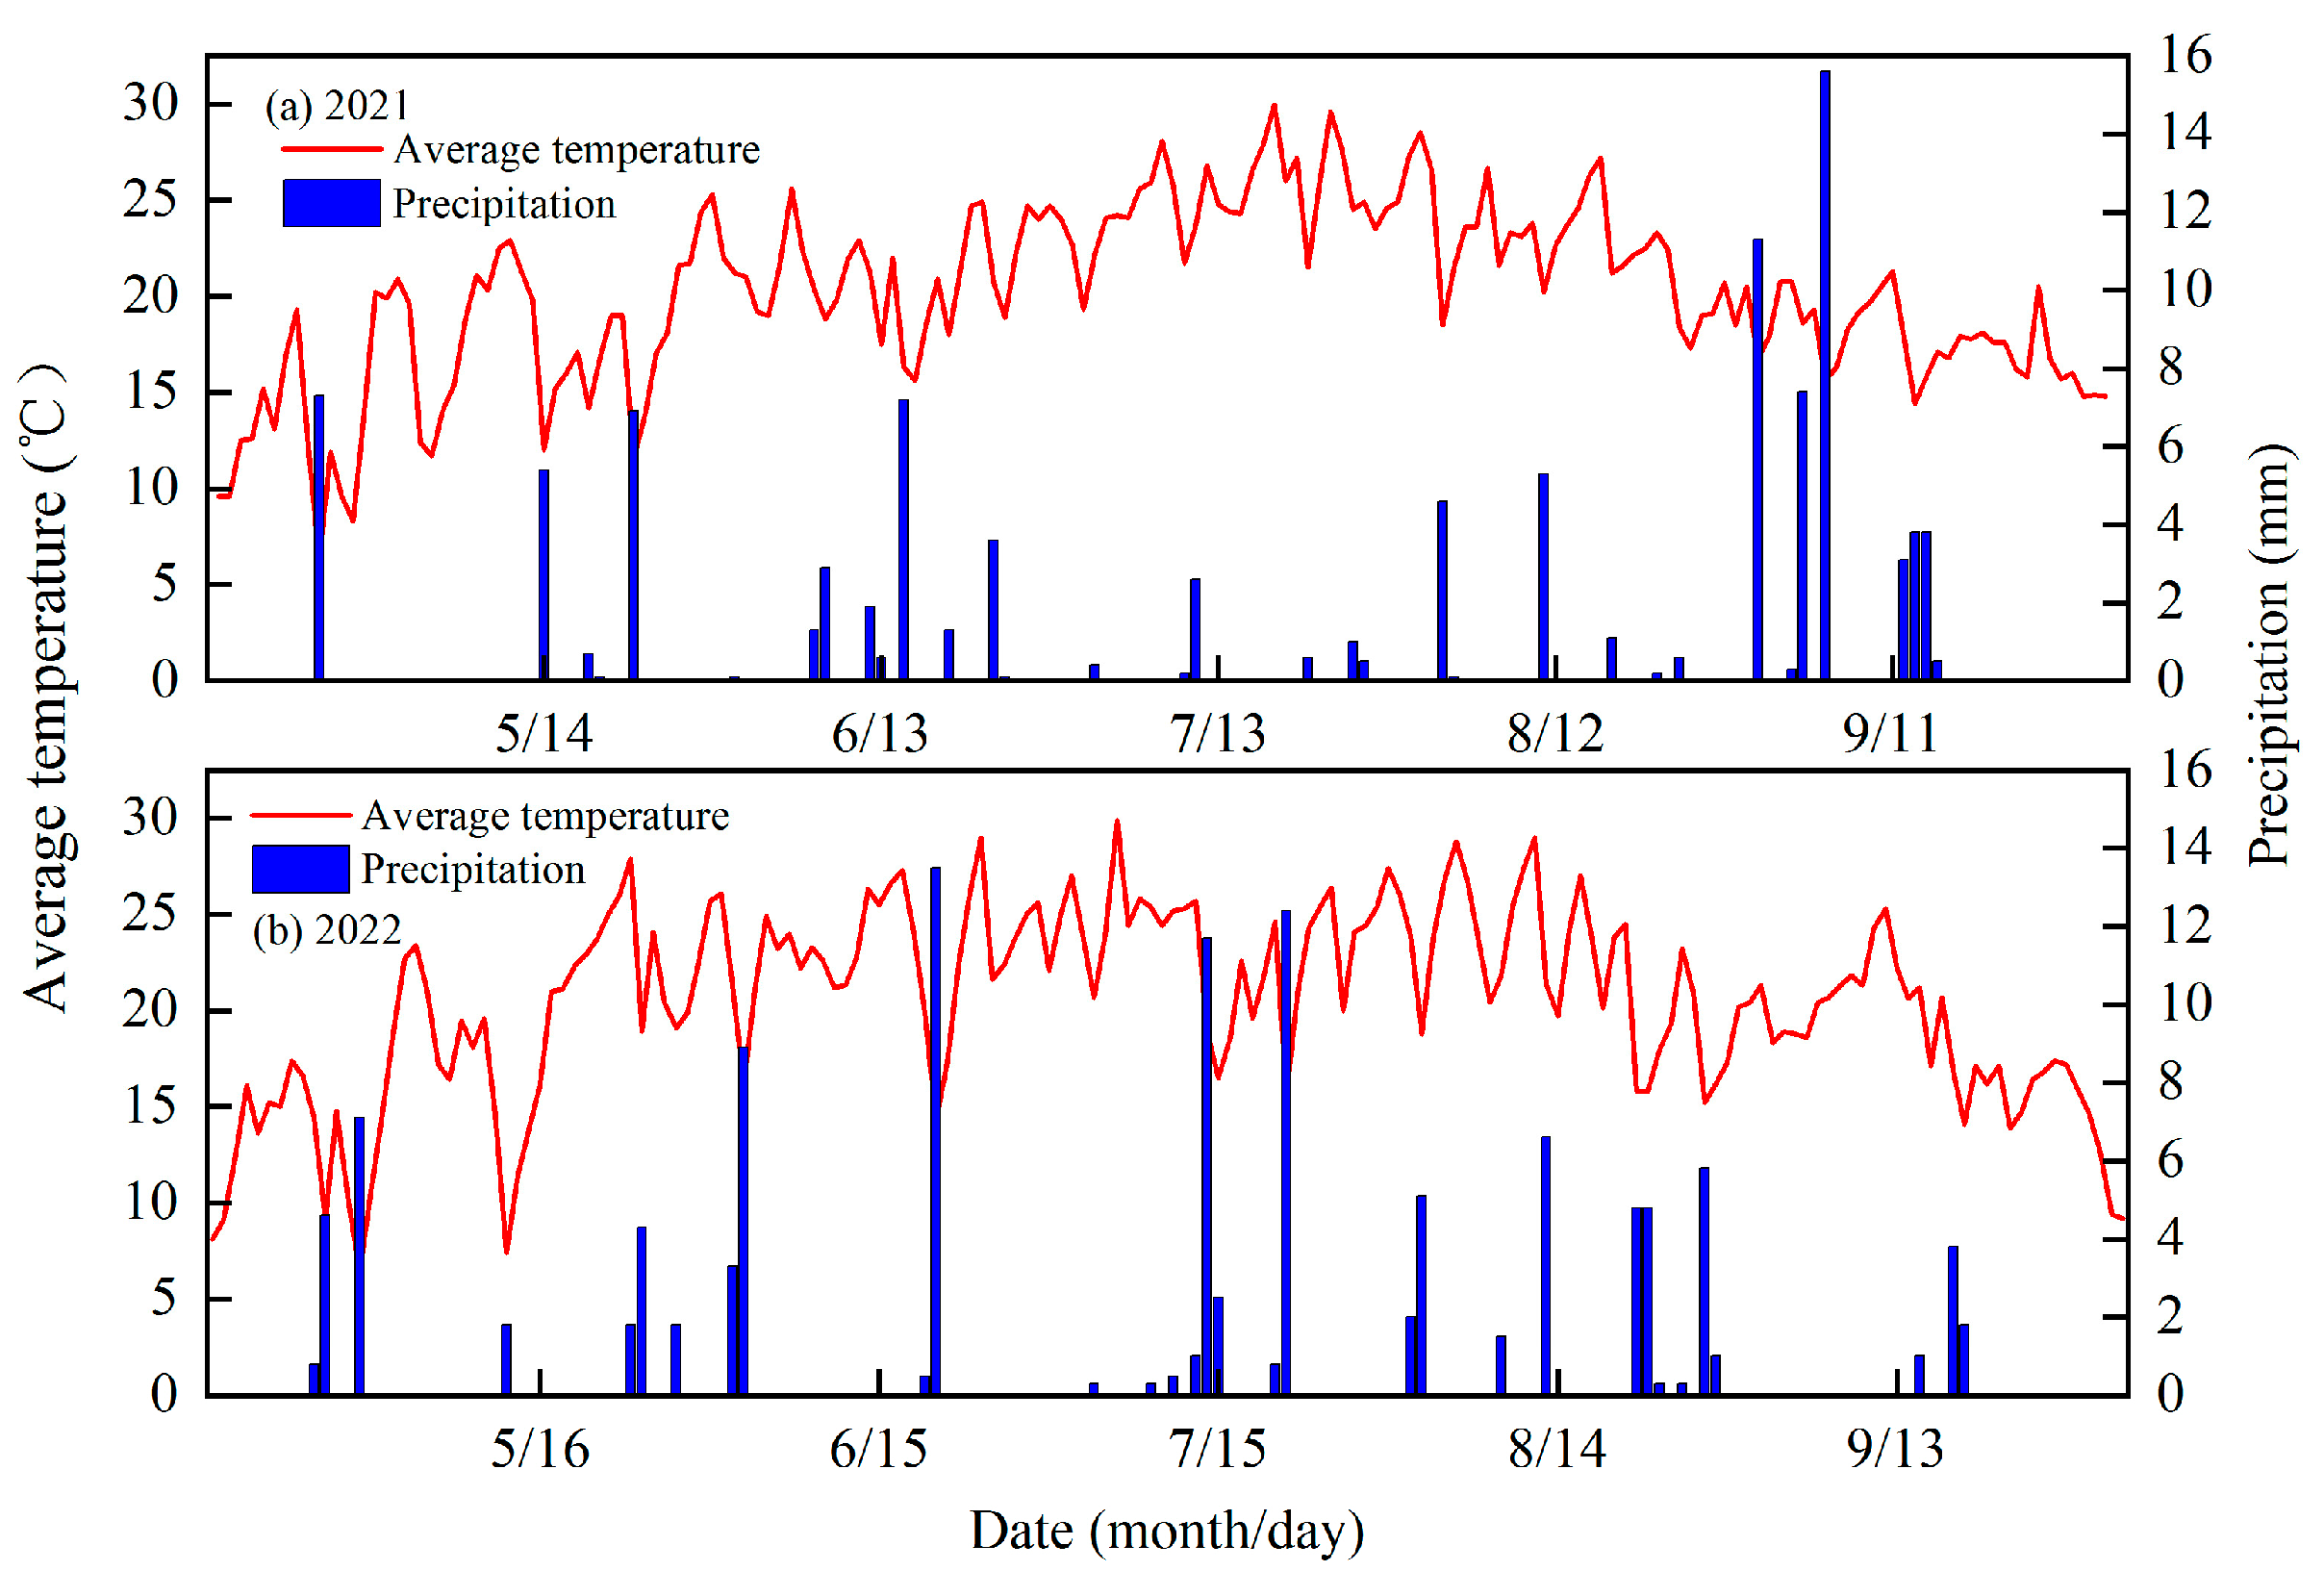
2.1. Research Area Profile

The experimental site is located at the Tianjia Sluice Irrigation Experiment Station in Ganzhou District, Zhangye City, Gansu Province (100°6′~100°52′ E, 38°32′~39°24′ N). The region has a temperate continental climate, with an elevation of 1474 m, an average annual temperature of 7.2 °C, an average annual precipitation of about 130 mm, approximately 2970 h of sunshine per year, and a frost-free period of about 157 d. The experimental field soil is a loamy sand soil, with a maximum field water holding capacity of the plow layer at 26.8%, a wilting coefficient of 7.35%, a soil bulk density of 1.36 g cm−3, soil pH values of 8.30, organic matter content of 16.30 g kg−1, and available phosphorus, ammonium nitrogen, and potassium contents of 15.74, 45.62, and 126.01 mg kg−1, respectively, in the 0~40 cm plow layer. The rainfall and average temperature during the growth period of potatoes are shown in Figure 1.

2.2. Experimental Materials

The experimental variety selected is the locally conventionally cultivated variety “Qing Shu 10”, which is a mid-to-late maturing variety. The plant is erect with strong growth vigor, the tuber is flat and round, the skin is white, the flesh is white, the buds are few and shallow, and the tubers are concentrated. The planting method combines ridge planting with mulching (Tianshui Tianbao Plastic Industry Co., Ltd., Tianshui, China) and drip irrigation (DAYU IRRIGATION GROUP Co., Ltd., Tianjin, China) in a single-ridge, double-row cultivation model. The planting depth is 8 cm, the plant spacing is 40 cm, the row spacing is 20 cm, the ridge width is 80 cm, the ridge height is 30 cm, and the ridge furrow spacing is 20 cm. The seeds were sown on 15 April 2021, and harvested on 2 October; in 2022, they were sown on 17 April and harvested on 3 October.

2.3. Experimental Design

The experiment was designed with two variable factors, irrigation water and nitrogen application, in a complete combination design. The levels of irrigation water and nitrogen application were set based on previous research results in the study area, combined with the actual local conditions [26]. Three irrigation gradients were set at 336 mm (W1), 408 mm (W2), and 480 mm (W3), and three fertilization (Xindagong Agricultural Chemical Co., Ltd., Zhangye, China) gradients were set at 144 kg ha−1 (N1), 192 kg ha−1 (N2), and 240 kg ha−1 (N3), resulting in a total of 9 treatments. Each treatment was replicated three times, and the experimental plots were arranged in a randomized block design with an area of 80 m2 (8 m × 10 m). Before sowing, all treatment plots were uniformly applied with phosphate fertilizer (P2O5) (Xindagong Agricultural Chemical Co., Ltd., Zhangye, China) at 120 kg ha−1 and potash (K2O) (Xindagong Agricultural Chemical Co., Ltd., Zhangye, China) at 90 kg ha−1, with no further application of phosphate or potash later on. Nitrogen fertilizer was applied with 40% as the base fertilizer, and 60% was top-dressed according to the growth stage and irrigation water distribution (5% during the seedling stage, 10% at the bud stage, and 45% during the flowering and tuber formation stage). Drip irrigation and fertilization were conducted in a mode that both efficiently utilizes fertilizer and avoids clogging the drippers, which is to irrigate with clear water for the first 1/4 of the time, apply fertilizer with the fertilizer tank open for the middle 1/2 of the time, and then irrigate with clear water to flush for the last 1/4 of the time. To facilitate the calculation of the potato economic benefit regression equation, the irrigation water and nitrogen application amounts for potatoes were coded. The specific experimental design and coding values are shown in Table 1.

2.4. Measurement Items and Methods

2.4.1. Dry Matter

At the end of the potato maturity period, three potato plants were randomly selected from each plot and brought back to the laboratory for dissection by organ. They were placed in a preheated drying oven and subjected to a 105 °C blanching process for 30 min, after which the temperature was adjusted to 80 °C for constant temperature drying until a constant weight was achieved to measure the dry matter content.

2.4.2. Yield and Its Constituent Elements

At the end of the potato maturity period, 10 potato plants were randomly excavated from each plot and brought back to the laboratory for washing and drying. The horizontal and vertical diameters of the tubers and the weight of individual plants were then measured. Concurrently, a 1.6 m × 3 m area was randomly selected in each plot for yield measurement, and the potato yield was finally calculated based on the plot area.

2.4.3. Water Use Efficiency and Nitrogen Fertilizer Partial Productivity

The water consumption of potatoes (ET) was calculated using the water balance equation, with the specific formula as follows:
ET = P + I + U + ΔWDS
In the formula, ET represents the total water consumption during the entire growth period of the potatoes, in millimeters (mm); P represents effective precipitation, in mm; I represents the amount of irrigation water, in mm; ΔW represents the change in soil water storage between potato planting and harvest, in mm; D represents surface runoff (mm), which is taken as 0 because the experimental site is flat and there is no surface runoff; U represents the amount of groundwater replenishment (mm), also taken as 0 because the groundwater table in the experimental area is deeper than 10 m; and S represents the change in soil water storage at the end of the season, in mm.
The water use efficiency (WUE) is calculated with the following formula:
WUE = Y/ET
In this formula, WUE represents the water use efficiency, in units of kg mm−1 ha−1. Y denotes the potato yield, in kilograms per hectare (kg ha−1). ET is the evapotranspiration, in millimeters (mm).
The irrigation water use efficiency (IWUE) is calculated with the following formula:
IWUE = Y/I
In this formula, IWUE stands for the irrigation water use efficiency, in units of kg mm−1 ha−1. Y is again the potato yield, in kg ha−1. I is the irrigation amount, in millimeters (mm).
The Partial Factor Productivity of Nitrogen (PFPN), which refers to the crop yield produced per unit of nitrogen applied, is calculated with the following formula:
PFPN = Y/N
In this formula, PFPN denotes the Partial Factor Productivity of Nitrogen, in units of kg kg−1 ha−1. Y is the potato yield, in kg ha−1. N signifies the nitrogen fertilizer application, in kilograms per hectare (kg ha−1).

2.4.4. Water-Nitrogen Regression Model

This study explores the regression relationship among irrigation volume, nitrogen application, and economic benefit in mulched potato cultivation. Using irrigation volume and nitrogen application as independent variables and economic benefit as the dependent variable, this study establishes a regression model to quantify the interplay among water, nitrogen, and economic benefit. The model’s formula is presented as follows:
y = A0 + A1x1 + A2x2 + A12x12 + A11x12 + A12x22
In the formula, y represents the predicted economic benefit of potatoes, measured in CNY ha−1; A0 represents the constant term in the regression model; A1 and A2 represent the coefficients of the first-order terms; A12 represents the coefficient of the interaction term; and A11 and A22 represent the coefficients of the second-order terms.

2.5. Data Analysis

Data organization was carried out using Microsoft Excel 2010 software, while data statistical analysis and regression model construction were performed using SPSS 22.0 software. ANOVA was performed to analyze the effects of different treatments, and the Duncan method was used to compare differences in means at a 5% or 1% level of significance. Charting was performed with Origin 2021 software.

3. Results

3.1. Yield and Constituent Elements

Scientific water–nitrogen management is an inevitable choice for high crop yield and efficient use of water and nitrogen. The experimental results of the interaction effects of water and nitrogen on the components of potato yield and its components in 2021 and 2022 follow similar patterns (Table 2). A statistical analysis shows that both irrigation water and nitrogen application have extremely significant (p < 0.01) and very extremely significant (p < 0.001) impacts on potato yield and its components, while the interaction of water and nitrogen has no significant effect (p > 0.05).
The crop yield effect is a key indicator for measuring the quality of water–nitrogen coupling. As can be seen from Table 2, under the same nitrogen application treatment, potato yield tends to continuously increase with the increase in irrigation water. After averaging the same irrigation water, the potato yield in 2021 and 2022 increased by 29.94% and 33.14% from W1 to W2, with an average increase of 31.54% over two years, and increased by 5.43% and 5.52% from W2 to W3, with an average increase of 5.48% over two years. It can be seen that although the treatment with higher irrigation water also has a higher potato yield, the effect of increasing potato yield with the increase in irrigation water is significantly reduced. The impact of high and low nitrogen applications on potato yield is also very obvious. After averaging the same nitrogen application, the yield in 2021 and 2022 increased by 11.7% and 12.33% from N1 to N2, with an average increase of 12.12%, and increased by 1.33% and 2.04% from N2 to N3, with an average of 1.69%, indicating that the effect of increasing nitrogen fertilizer on increasing potato yield also gradually decreases.
Under the interaction of water and nitrogen, the treatments with the highest tuber yield are the high-water medium-nitrogen (N2W3) treatment and the high-water high-nitrogen (N3W3) treatment, which yielded 43,493.54 and 43,082.19 kg ha−1 in 2021 and 2022, respectively, indicating that under high-water conditions, too low or too high nitrogen application will affect the formation of potato tuber yield, while the yield of the N1W1 treatment was the lowest in both years, at 27,932.65 and 26,537.83 kg ha−1, respectively. The horizontal diameter and weight per plant of potatoes are roughly similar to the trend of yield change, with the maximum value being the N2W3 treatment. Both irrigation and nitrogen application promote the growth of the above-ground part of potatoes, increasing the accumulation of dry matter in potatoes, with the N3W3 treatment having the highest accumulation of dry matter, followed by N2W3, and there is no significant difference between the two (p > 0.05). In addition, the trend of change in the longitudinal diameter of the tuber is consistent with the accumulation of dry matter.

3.2. Water Use Efficiency and Nitrogen Fertilizer Partial Productivity

Ensuring high crop yields while improving the efficiency of water and nitrogen use can effectively reduce the risk of soil moisture loss and environmental pollution from nitrogen fertilizer leaching. The results from two years of experiments indicate that both irrigation water and nitrogen application have extremely significant (p < 0.01) and very extremely significant (p < 0.001) impacts on potato water and nitrogen use efficiency. The interaction of water and nitrogen has significant (p < 0.05) and extremely significant (p < 0.01) effects on the partial productivity of nitrogen fertilizer, while it has no significant effect (p > 0.05) on water consumption, water use efficiency, or irrigation water use efficiency (Table 3).
As shown in Table 3, both irrigation and nitrogen application can promote the absorption of water and nutrients by the potato root system, thereby improving its water and nitrogen use efficiency. Both nitrogen application and irrigation can increase the water consumption of potatoes. After averaging the same nitrogen application level, the water consumption of potatoes increased by 2.28% and 3.15% over two years from N1 to N2, with an average increase of 2.72%, and increased by 3.58% and 2.56% from N2 to N3, with an average increase of 3.06%; after averaging the same irrigation level, the water consumption increased by an average of 14.28% from W1 to W2 over two years, and by an average of 9.43% from W2 to W3. This indicates that an increase in irrigation water and nitrogen application will increase the water consumption of potatoes. Irrigation and nitrogen application also have a significant impact on potato water use. After averaging the same nitrogen application level, the water use efficiency and irrigation water use efficiency increased by an average of 9.05% and 12.14% over two years from N1 to N2, while the irrigation water use efficiency increased by 1.98% from N2 to N3, and the water use efficiency decreased by 1.17%. This indicates that excessive nitrogen application can reduce the water use efficiency of potatoes. In addition, after averaging the same irrigation level, the water use efficiency and irrigation water use efficiency increased by an average of 15.01% and 8.29% from W1 to W2, respectively, but excessive irrigation can reduce the water use efficiency and irrigation water use efficiency of potatoes, decreasing by 3.53% and 10.34% from W2 to W3, respectively.
Under the interaction of water and nitrogen, the highest water and nitrogen combination for water use efficiency and irrigation water use efficiency is the N3W2 treatment, with an average water use efficiency and irrigation water use efficiency of 6.93 and 10.23 kg m−3 over two years. Comparing the results of the partial productivity of nitrogen fertilizer for different water and nitrogen treatments over two years, the N1W3 treatment had the highest partial productivity of nitrogen fertilizer over two years, with 347.43 kg kg−1 in 2021 and 335.42 kg kg−1 in 2022, while the N3W1 treatment had the lowest partial productivity of nitrogen fertilizer, at 136.03 kg kg−1 and 131.46 kg kg−1, respectively. When the irrigation water is the same, the partial productivity of nitrogen fertilizer is significantly negatively correlated with the nitrogen application; that is, it decreases with the increase in nitrogen application, and there are significant differences between different nitrogen treatments over two years. In addition, when the nitrogen application is the same, the partial productivity of nitrogen fertilizer is positively correlated with the irrigation water; that is, it continues to rise with the increase in irrigation water. The partial productivity of nitrogen fertilizer at the W1 irrigation level is significantly lower than that at the W2 and W3 irrigation levels, and the partial productivity of nitrogen fertilizer increased by 30.11% and 30.72% over two years from W1 to W2, with an average increase of 31.87%, while the partial productivity of nitrogen fertilizer increased by 6.22% and 5.81% from W2 to W3, with an average increase of 6.02%.

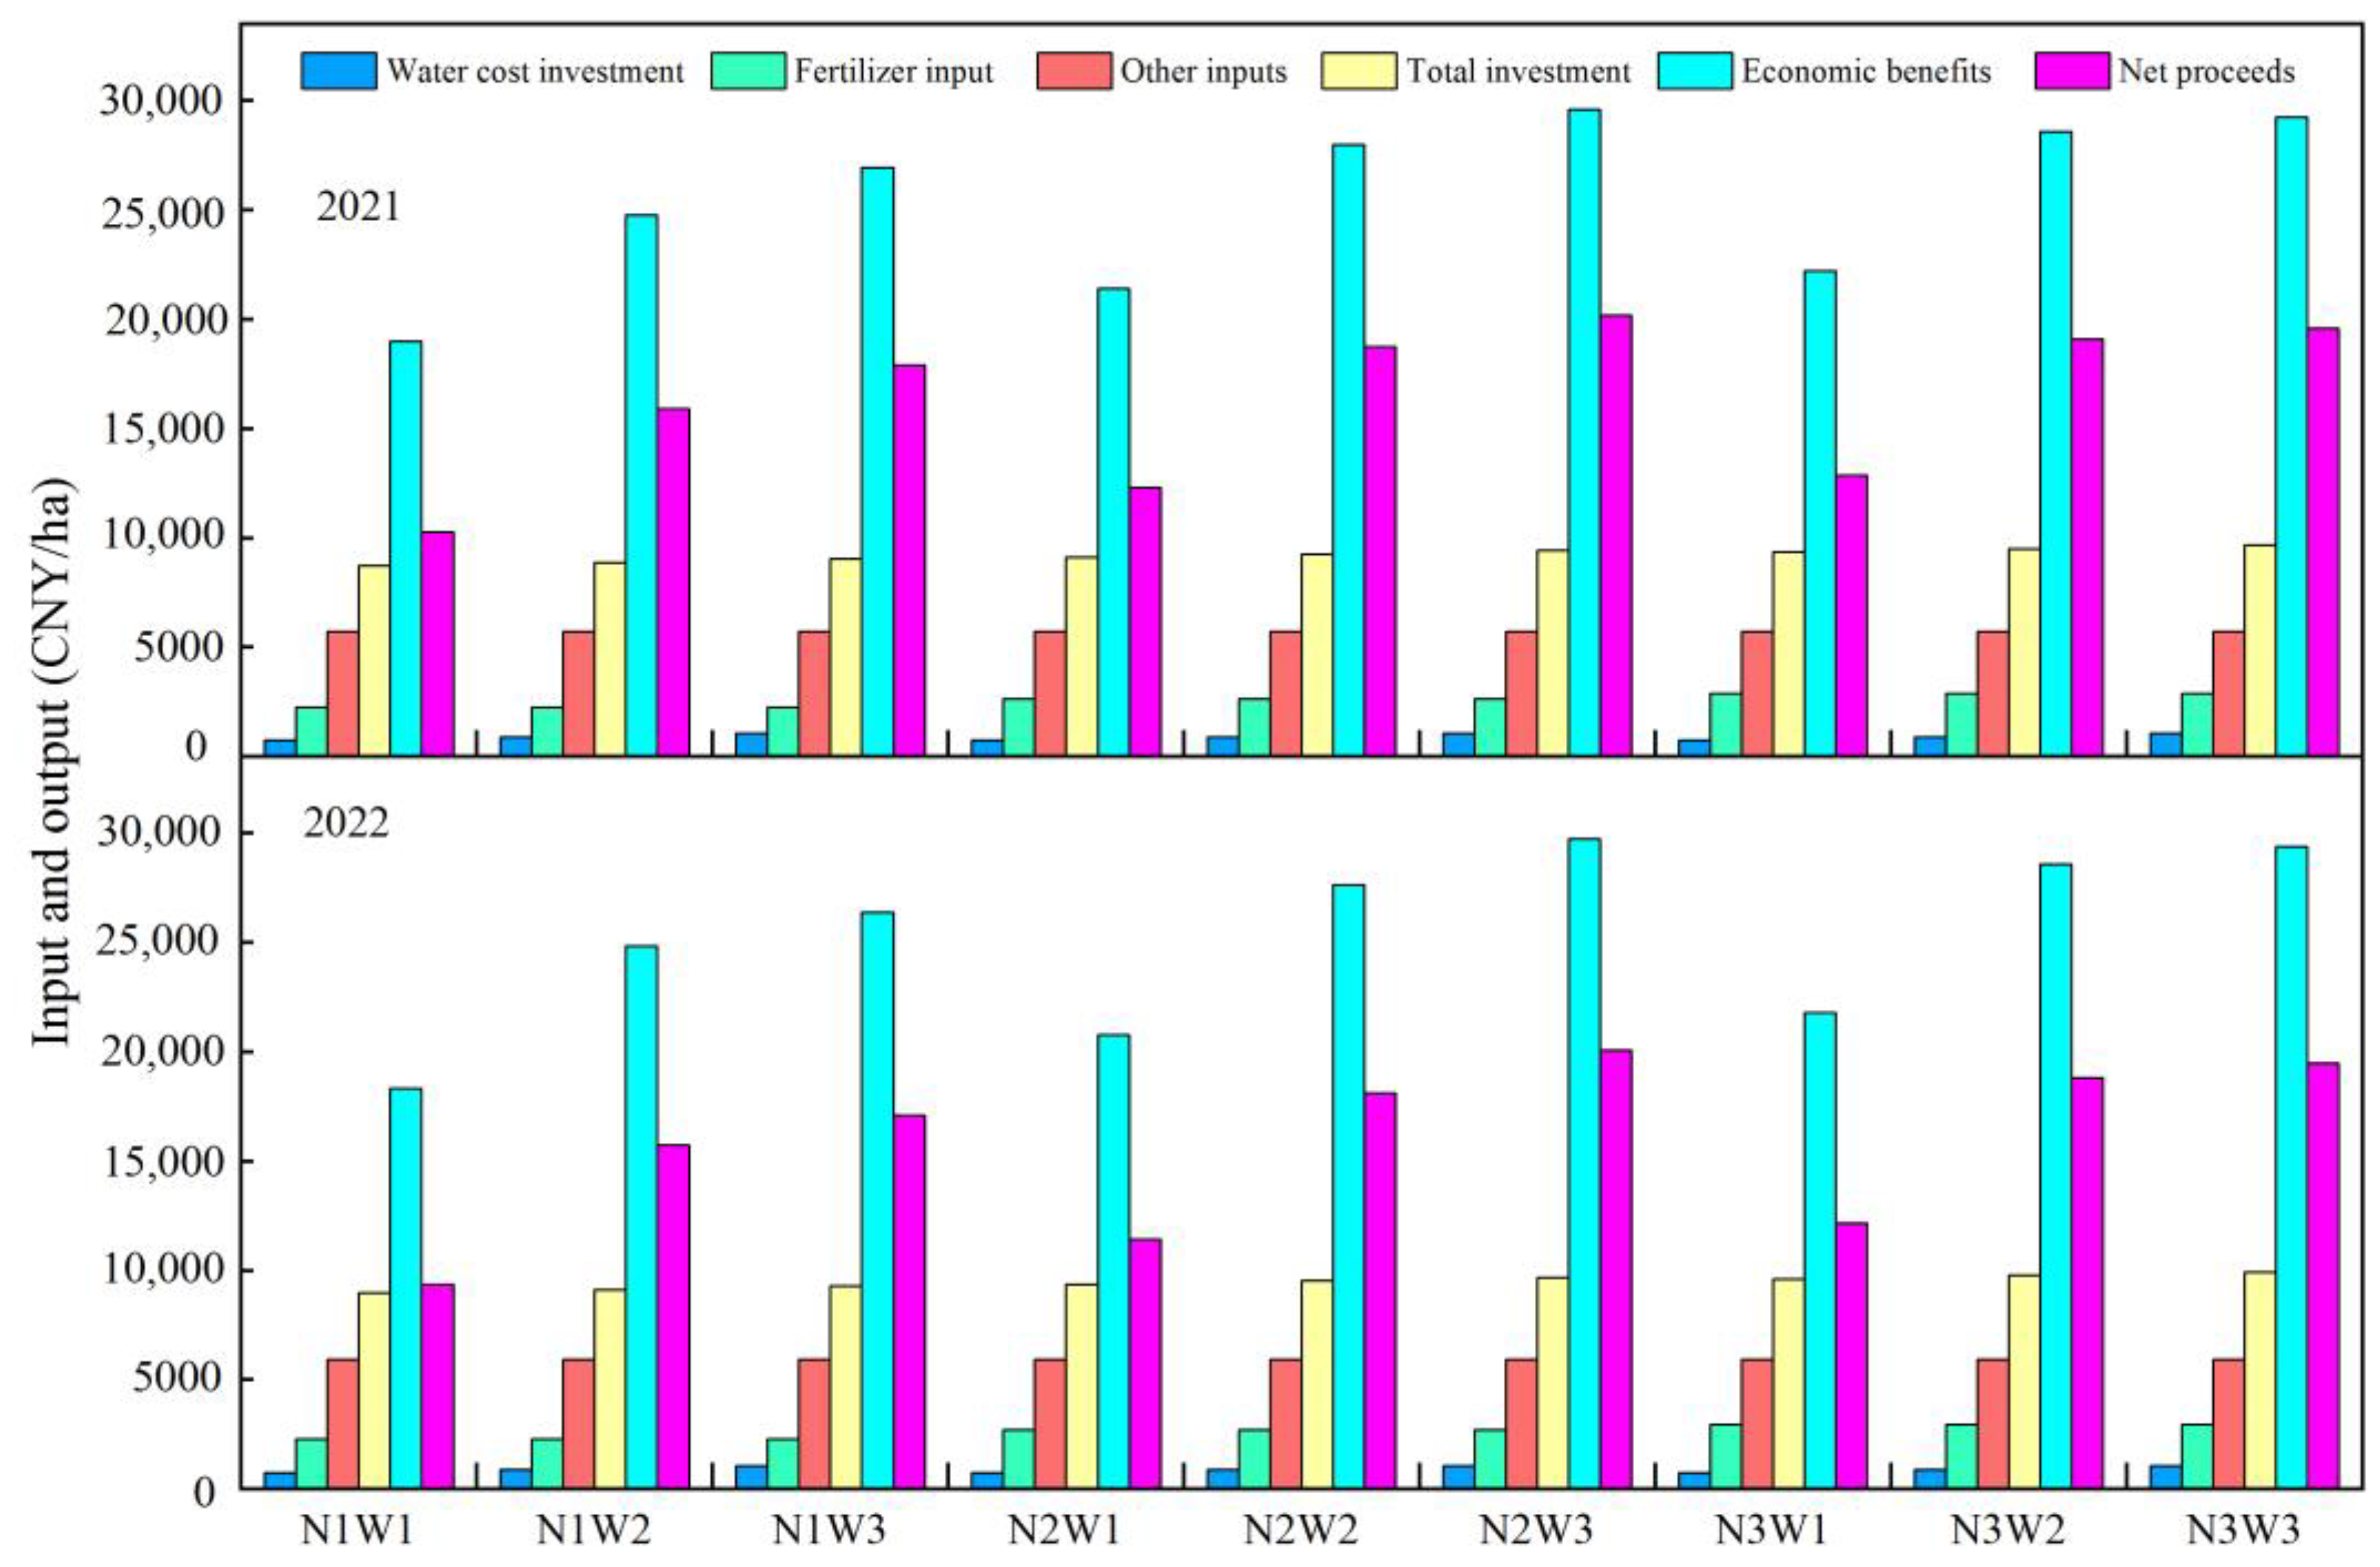
3.3. Economic Benefit Analysis

Potato economic benefits are closely related to inputs such as water and fertilizer. As shown in Figure 2, averaging the same nitrogen application level indicates that an increase in nitrogen fertilizer application raises the total agricultural production input, with an increase of 390 CNY ha−1 and 400.17 CNY ha−1 over two years from N1 to N2, averaging an increase of 395.09 CNY ha−1; from N2 to N3, the increase was 240 CNY ha−1 and 246.42 CNY ha−1, averaging an increase of 243.13 CNY ha−1. The trend of increased irrigation water affecting farm input costs is consistent with nitrogen application, indicating that a reasonable water–nitrogen ratio can control farm input costs and improve the economic benefit of potato fields. The economic benefits of potatoes are influenced by yield and follow a similar trend of change. The highest economic benefit in all treatments was achieved in the N2W3 treatment over two years, with 29,572.61 CNY ha−1 in 2021 and 29,726.71 CNY ha−1 in 2022, averaging an economic benefit of 29,649.6586 CNY ha−1. The level of irrigation water and nitrogen application also significantly affects the net income of potatoes. Averaging the same nitrogen application level shows an average increase of 16.78% from N1 to N2 and an average increase of 1.18% from N2 to N3, indicating that the impact of increased nitrogen application on the economic benefit of potatoes gradually decreases. Averaging the same irrigation level shows an average increase of 55.52% from W1 to W2 and an average increase of 7.47% from W2 to W3. Due to the interaction of water and nitrogen, the N2W3 treatment had the highest net income, with 20,156.99 CNY ha−1 in the first year and 20,050.74 CNY ha−1 in the second year, averaging 20,103.86 CNY ha−1 over two years.

3.4. Establishment and Optimization of Water–Nitrogen Coupling Model

3.4.1. Equation Construction of Water–Nitrogen Coupling Model

To optimize the water and nitrogen management system for potatoes in oasis irrigation areas, a binary quadratic regression simulation was used with economic benefit data to establish regression models for the economic benefit (y) concerning the coded values of nitrogen application (x1) and irrigation water (x2) for the years 2021 and 2022, respectively.
2021 : y = 27915.069 + 1553.370 x 1 + 3860.098 x 2 1203.483 x 1 2 2388.208 x 2 2 223.492 x 1 x 2
2022 : y = 27780.033 + 1695.405 x 1 + 4106.275 x 2 1162.185 x 1 2 2615.395 x 2 2 116.200 x 1 x 2
Performing a significance test on Equations (5) and (6), the determination coefficient is R2 = 0.996 for both, indicating that the predicted economic benefits of potatoes have a good fit with the actual economic benefit. After testing, F1 = 133.238, p1 < 0.01, and F2 = 144.470, p2 < 0.01, indicating that the regression relationship has reached a highly significant level over two years, accurately reflecting the change process in potato economic benefit with the variation in water and nitrogen input.

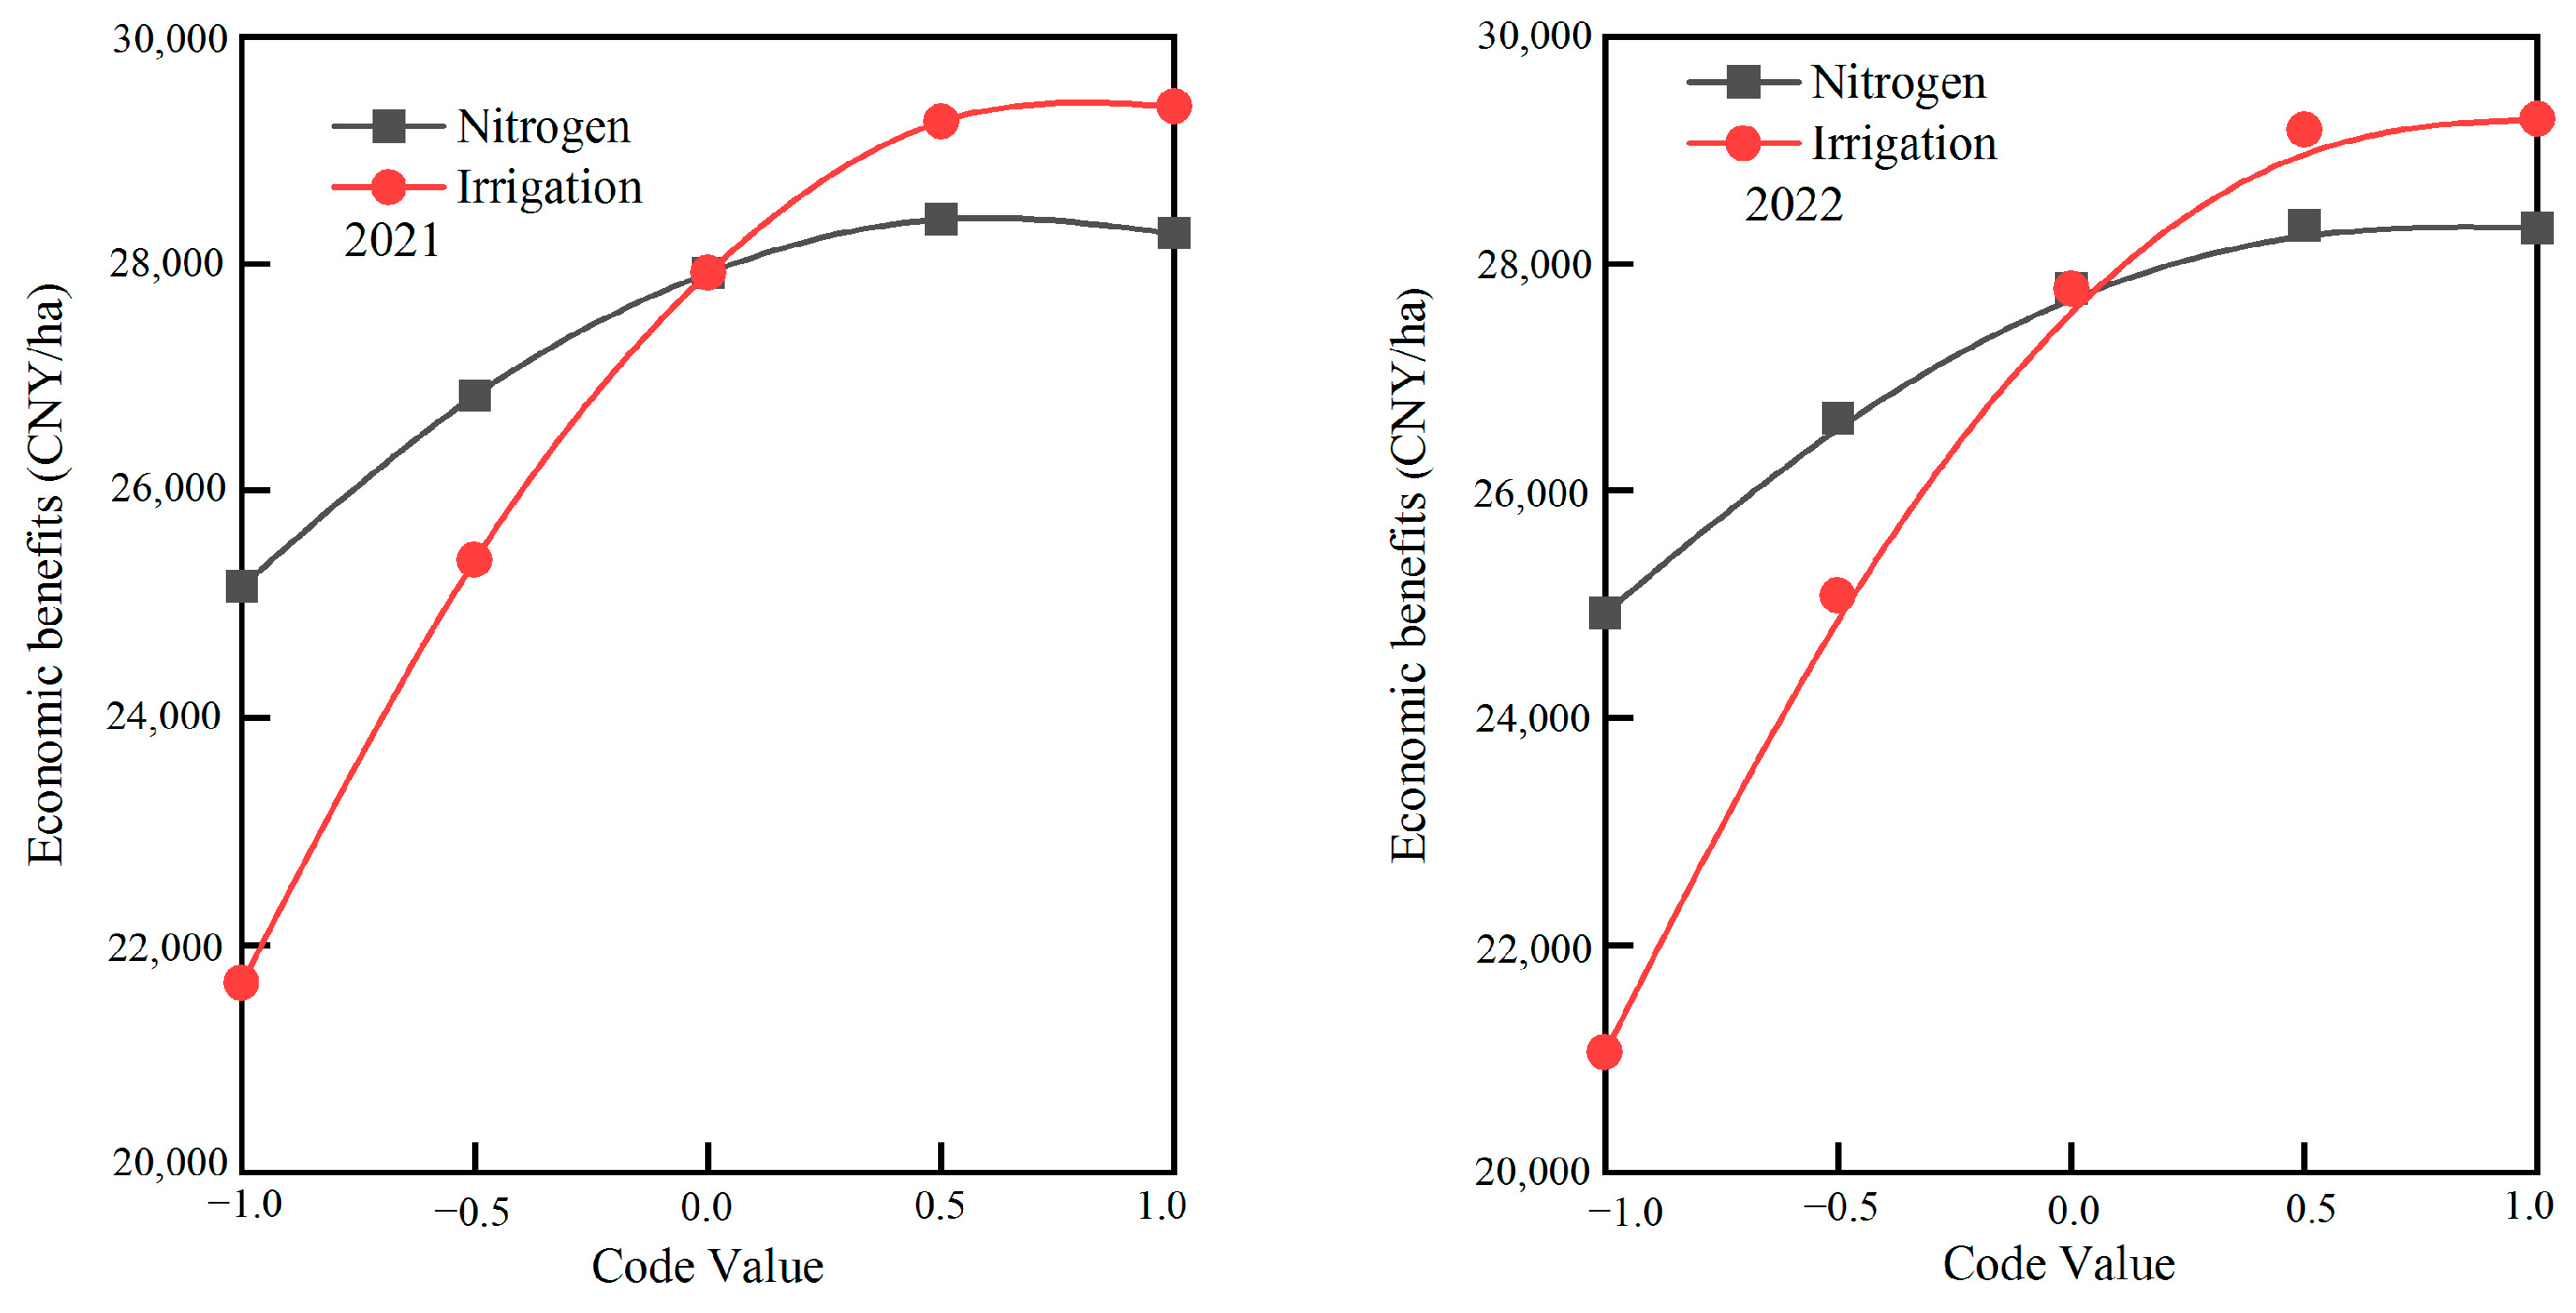
3.4.2. Single-Factor Effect Analysis

To further analyze the impact of individual factors on the economic benefit of potatoes, dimensionality reduction is performed on Equations (5) and (6). This involves setting either the irrigation or the nitrogen application level to zero in the equations to derive the single-factor effect functions for irrigation water (yW) and nitrogen application (yN), respectively.
2021 : y N = 27915.069 + 1553.370 x 1 1203.483 x 1 2
y W = 27915.069 + 3860.098 x 2 2388.208 x 2 2
2022 : y N = 27780.033 + 1695.405 x 1 1162.185 x 1 2
y W = 27780.033 + 4106.275 x 2 2615.395 x 2 2
Within the range of factor levels in the experimental design, the effects of each factor on economic benefit are shown in Figure 3. It can be seen from Figure 3 that in both 2021 and 2022, the economic benefit of potatoes changes with the input of water and nitrogen as downward-opening parabolic curves, indicating that the effect of water and nitrogen as single factors on economic benefit is positive. However, as the amount of water and nitrogen increases, the increase in economic benefit slows down, which is consistent with the law of diminishing returns, and there is a maximum point of economic benefit. In 2021, when x1 = 0.645, corresponding to a nitrogen application of 222.96 kg ha−1, the economic effect of potatoes reaches the maximum value of 28,416.31 CNY ha−1. When x1 < 0.645, the economic benefit of potatoes increases with the increase in nitrogen application; when x1 > 0.645, the economic benefit of potatoes decreases with the increase in nitrogen application. When x2 = 0.808, corresponding to an irrigation water amount of 466.18 mm, the economic benefit of potatoes reaches its maximum value of 29,474.85 CNY ha−1. When x2 < 0.808, the economic benefit of potatoes increases with the increase in irrigation water; when x2 > 0.808, the economic benefit of potatoes decreases with the increase in irrigation water. In 2022, when x1 = 0.729, corresponding to a nitrogen application of 226.99 kg ha−1, the economic effect of potatoes reaches the maximum value of 28,398.35 CNY ha−1. When x1 < 0.729, the economic benefit of potatoes increases with the increase in nitrogen application; when x1 > 0.729, the economic benefit of potatoes decreases with the increase in nitrogen application. When x2 = 0.785, corresponding to an irrigation water amount of 464.52 mm, the economic benefit of potatoes reaches its maximum value of 29,391.79 CNY ha−1. When x2 < 0.785, the economic benefit of potatoes increases with the increase in irrigation water; when x2 > 0.785, the economic benefit of potatoes decreases with the increase in irrigation water.

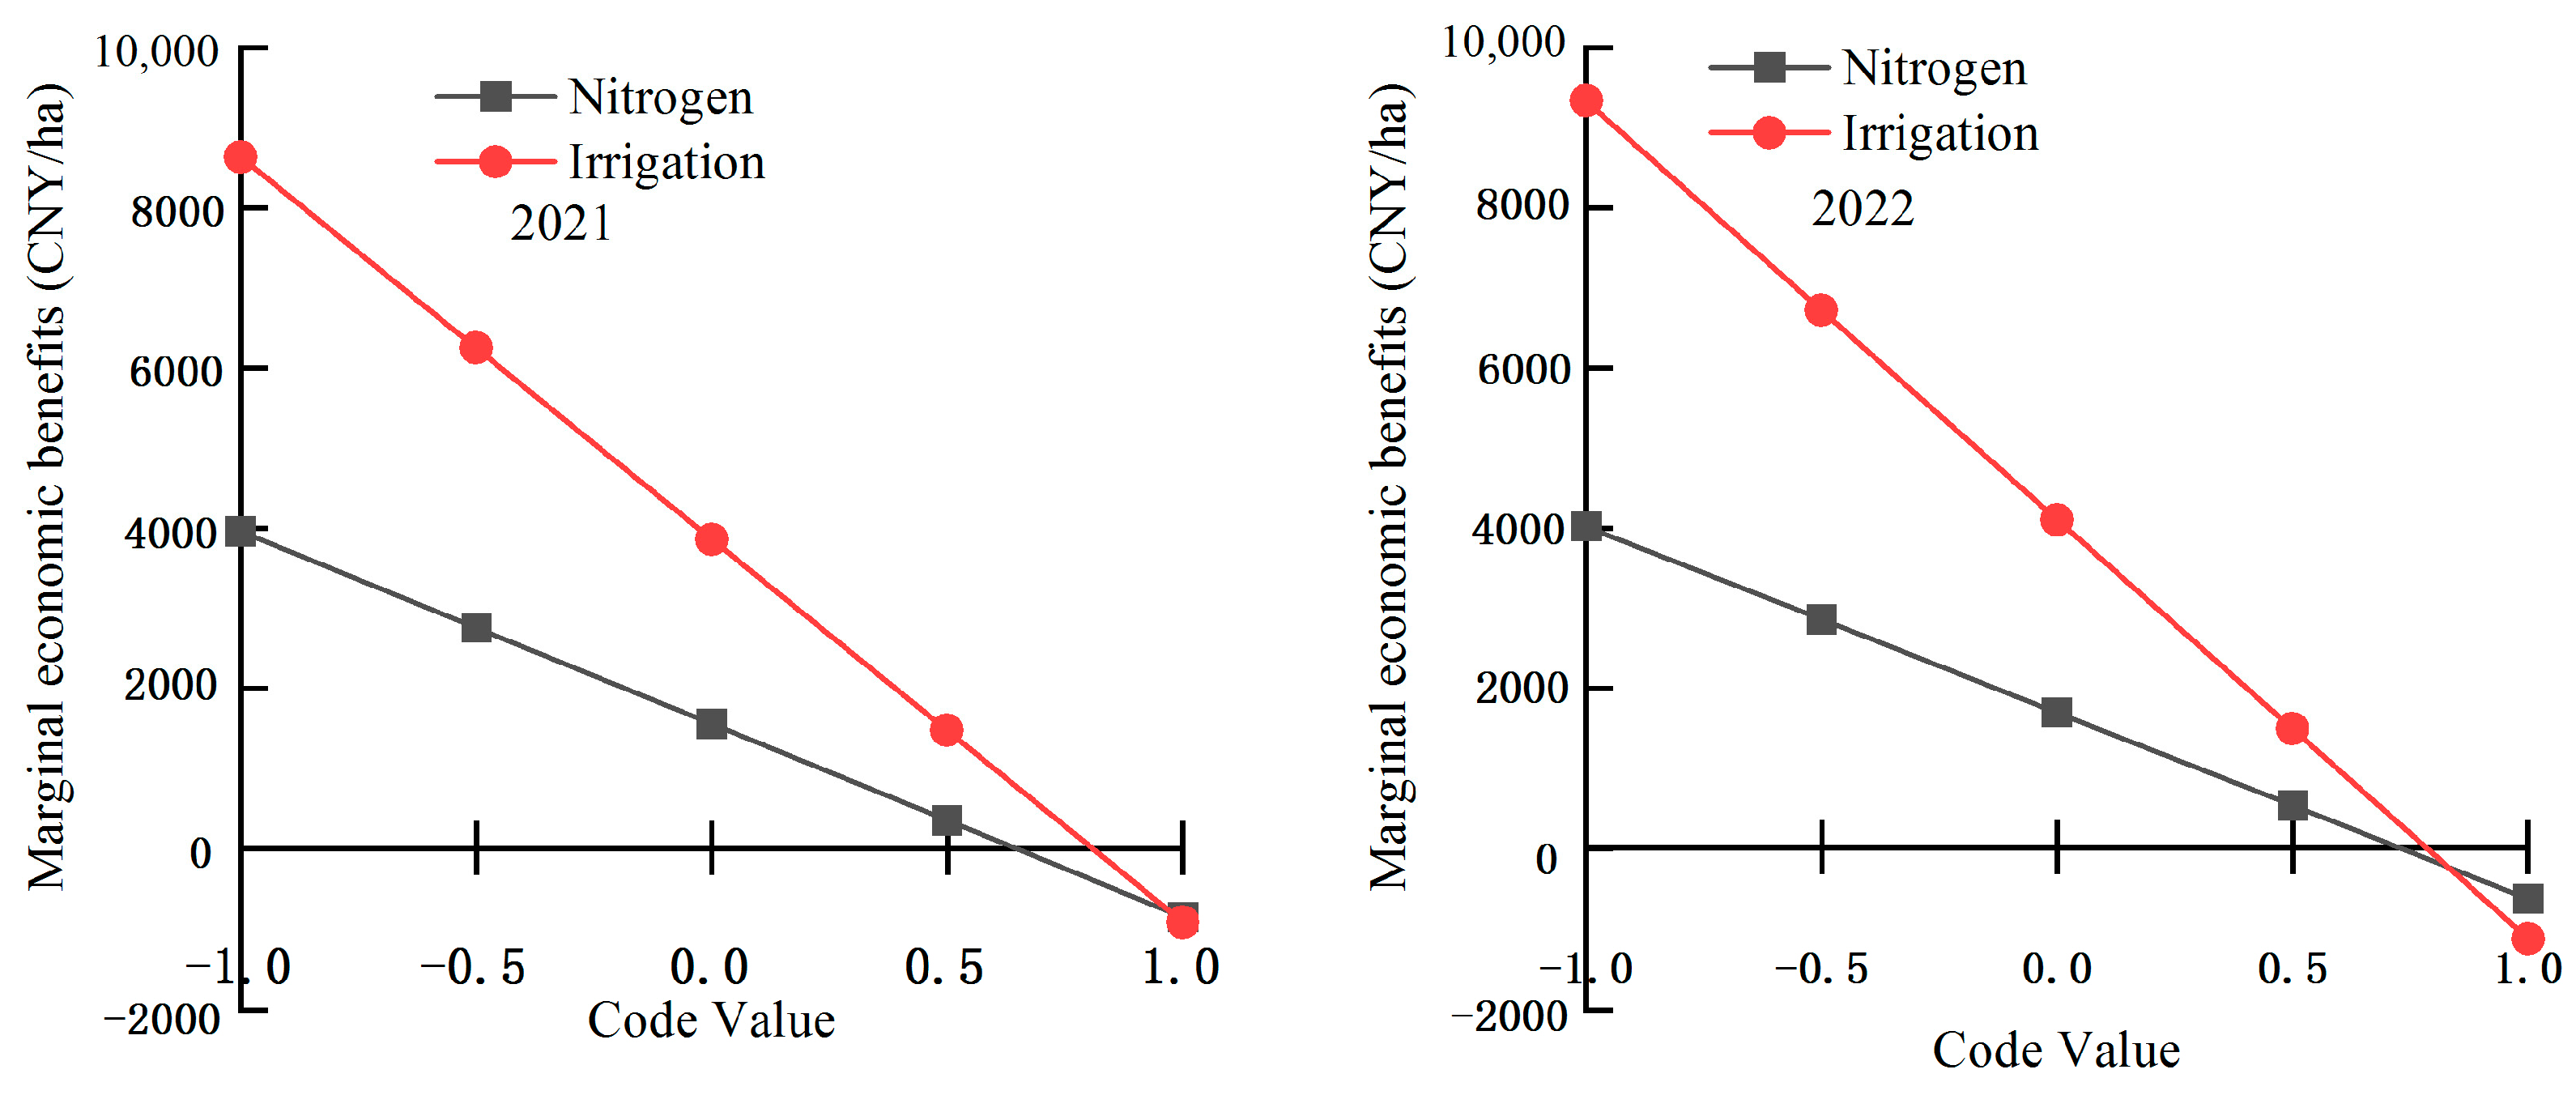
3.4.3. Single-Factor Marginal Effect Analysis

Marginal economic benefits reflect the optimal input levels of various factors and the impact of unit-level input on economic benefit. The marginal yield at different levels can be derived by taking the first-order partial derivatives of Equations (7)–(10). The marginal effect equations for irrigation water and nitrogen application over two years are as follows:
2021 : d y N / d x 1 = 1553.370 2406.966 x 1
d y W / d x 2 = 3860.098 4776.416 x 2
2022 : d y N / d x 1 = 1695.405 2324.364 x 1
d y W / d x 2 = 4106.275 5230.790 x 2
Based on the two-year single-factor marginal equations, the corresponding marginal effect diagrams (Figure 4) were created. Figure 4 shows that as irrigation water and nitrogen application increase, the marginal economic benefit of potatoes gradually decreases until the marginal economic benefit becomes negative. A value above zero on the vertical axis of Figure 4 indicates an improvement in the economic benefit of potatoes, while a value below zero indicates a reduction in economic benefit. In 2021, when x1 < 0.645, nitrogen application could improve the economic benefit of potatoes, but when x1 > 0.645, nitrogen application could reduce the economic benefit of potatoes. Similarly, when x2 < 0.808, irrigation could improve the economic benefit of potatoes, but when x2 > 0.808, irrigation could reduce the economic benefit. In 2022, when x1 < 0.729, nitrogen application could improve the economic benefit of potatoes, but when x1 > 0.729, nitrogen application could reduce the economic benefit of potatoes. Likewise, when x2 < 0.785, irrigation could improve the economic benefit of potatoes, but when x2 > 0.785, irrigation could reduce the economic benefit. These results highlight the importance of precise management of water and nitrogen inputs to maximize economic benefit while avoiding excessive inputs that can lead to diminishing returns and potentially negative impacts on profitability.

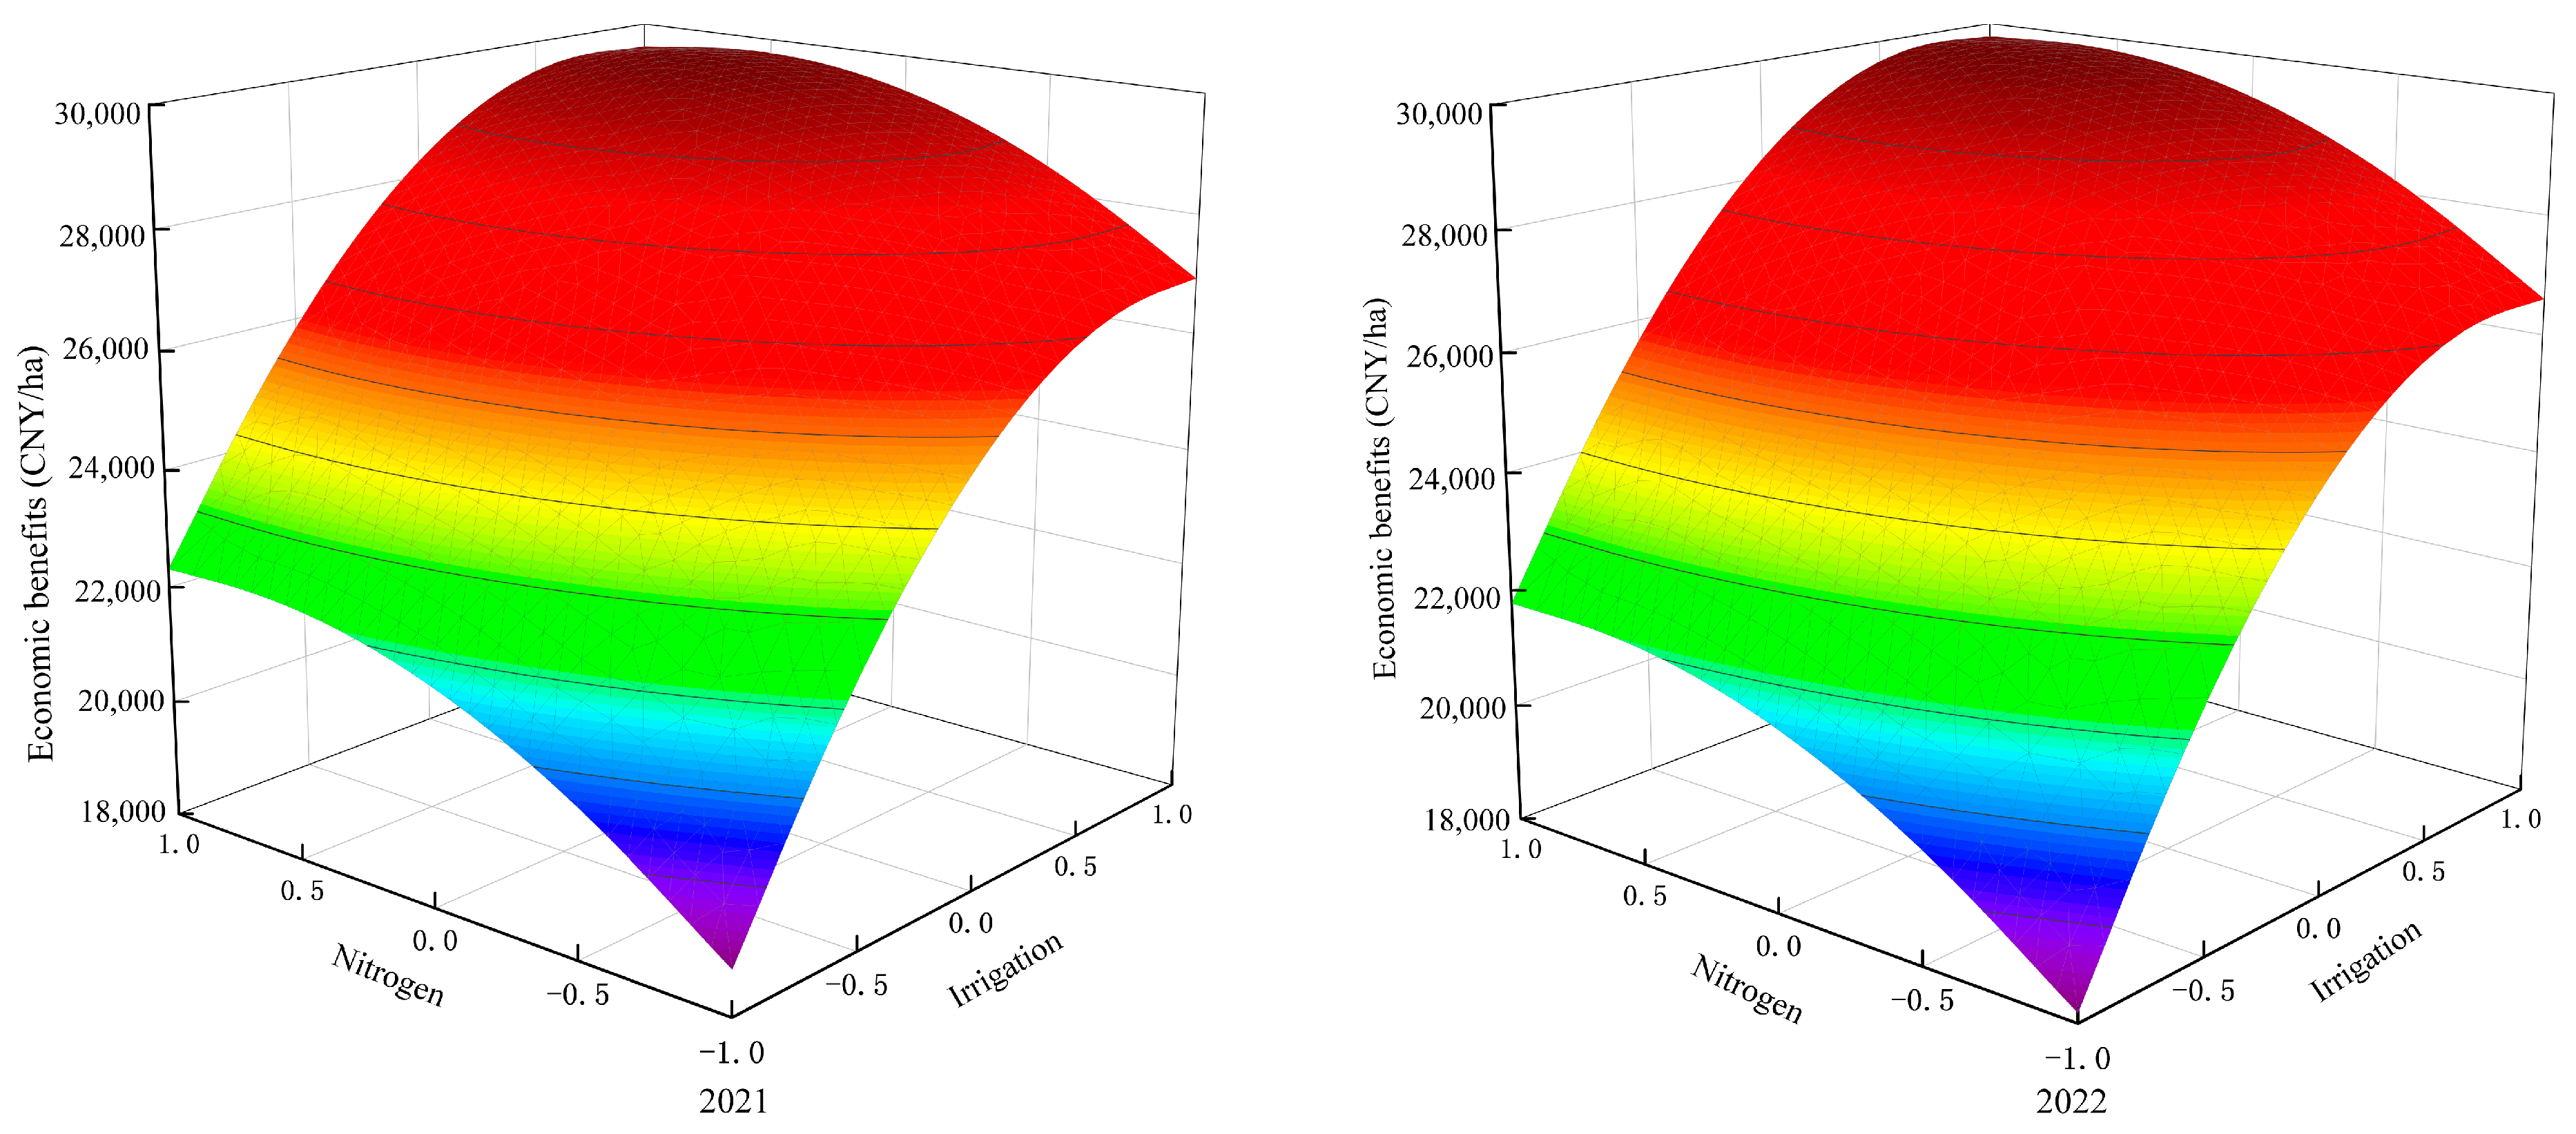
3.4.4. Water–Nitrogen Interaction Analysis

Potato economic benefits are influenced by the combined effects of water and nitrogen, which can either promote or inhibit each other. Figure 5 is a three-dimensional interaction effect diagram showing the relationship between irrigation water and nitrogen application on potato economic benefit. As can be seen from Figure 5, when the amount of irrigation water is constant, the economic benefit of potatoes first increases and then decreases with the increase in nitrogen application; similarly, when the nitrogen application is constant, the economic benefit of potatoes also follows a similar trend with the increase in irrigation water. In 2021, when x1 = 0.5726 and x2 = 0.7814, that is, with a nitrogen application of 219.48 kg ha−1 and an irrigation water amount of 464.26 mm, the simulated maximum economic benefit was 29,769.97 CNY ha−1. In 2022, when x1 = 0.6909 and x2 = 0.7696, that is, with a nitrogen application of 225.16 kg ha−1 and an irrigation water amount of 463.41 mm, the simulated maximum economic benefit was 29,902.16 CNY ha−1. It can be observed that there is a good coupling effect between the amount of irrigation water and nitrogen application, and the maximum economic benefit of potatoes occurs at a medium-to-high-level combination of water and nitrogen.

3.4.5. Optimization of Water–Nitrogen Combination Scheme

Due to the absence of changes in irrigation water and nitrogen application during the experimental period and the consistent frequency of occurrence for both irrigation water and nitrogen application across the two years of model optimization, the simulation and optimization plan do not distinguish between the years of the experiment. Aiming to optimize the water–nitrogen management system for the average economic benefit of potatoes, the average economic benefit for 2021 and 2022 was 25,520.61 and 25,261.65 CNY ha−1, respectively. To derive the optimal water–nitrogen combination schemes for different target economic benefits of potatoes, the frequency method was used to further analyze and calculate Equations (5) and (6), taking five levels at equal intervals between −1 and 1 (−1, −0.5, 0, 0.5, 1). Through simulation, it was found that among the 25 calculated schemes, 16 schemes had greater economic benefit than the average and 9 schemes had lower, with the corresponding optimization combination schemes shown in Table 4. The 95% confidence intervals, frequencies, and standard errors were calculated using SPSS 24 software. As shown in Table 4, the water–nitrogen combination schemes for different target economic benefits of potatoes are the following: when greater than the average economic benefit, the corresponding irrigation water is 354.33 to 434.67 mm, and the nitrogen application is 123.17 to 194.83 kg ha−1; when lower than the average economic benefit, the irrigation water is 191.86 to 272.21 mm, and the nitrogen application is 64.79 to 169.87 kg ha−1.

4. Discussion

4.1. Effect of Water–Nitrogen Coupling on Potato Yield and Its Constituent Elements

Water and nitrogen are very important factors in the growth and development process of crops [27], and their coupling effect has a significant impact on the distribution of photosynthetic products and yield formation. Reasonable water–nitrogen management measures are an effective way to increase the accumulation of crop dry matter and yield and can also reduce the risk of nitrogen leaching and save water resources [28]. The results of this study show that both irrigation water and nitrogen application can promote the growth of potatoes. The average increase in potato yield under the same irrigation level shows that irrigation can significantly increase potato yield, with an average increase of 31.54% from N1 to N2 over two years and an average increase of 5.48% from W2 to W3. This indicates that the increase in irrigation water has a positive effect on the increase in potato yield, but this effect gradually weakens with the increase in irrigation water, which is similar to the research results of Li et al. [29]. This shows that irrigation is one of the important ways to increase potato yield, and excessive irrigation has no significant effect on the increase in potato yield. Under the same nitrogen application level, the trend of potato yield change is similar to the influence of irrigation. When the nitrogen application exceeds 192 kg ha−1, the effect of nitrogen fertilizer on increasing potato yield gradually decreases, which is similar to the research conclusions of Natalia et al. [30] and Wang et al. [31]. However, due to factors such as the experimental area environment, fertilizer management mode, and crop variety, there are differences in the threshold of nitrogen fertilizer input. Under the dual influence of water and fertilizer, the maximum value of potato yield appears in the middle- and high-level combination of water and nitrogen, with an average yield of 43,287.87 kg ha−1 over two years, which was an increase of 1.16% to 58.94% over other treatments. This indicates that a small amount of excessive irrigation and nitrogen application has a weaker effect on increasing potato yield, which is similar to the research conclusions of Shrestha [32] and Tang [33]. The results of this study also show that water and nitrogen input have a significant impact on the accumulation of potato dry matter. Nitrogen application can promote the absorption of soil moisture by potatoes and regulate the composition of potato yield, and irrigation can also promote the absorption of nitrogen fertilizer. This is similar to the research conclusions of Yang et al. [34]. It can be seen that water and fertilizer input have a significant impact on the growth and yield formation of potatoes. A reasonable water–nitrogen ratio can achieve the goal of “regulating water with fertilizer, and promoting fertilizer with water” and ultimately increase the yield of potatoes.

4.2. The Effect of Water–Nitrogen Coupling on Potato WUE and NFPP

The water–nitrogen utilization efficiency is very sensitive to the ratio of water to nitrogen, and a scientific water–nitrogen ratio can promote the water–nitrogen utilization efficiency of crops. The water–nitrogen utilization efficiency index is an important basis for judging whether crops meet the requirements of high yield and high efficiency. The results of this study show that, under the same nitrogen application, an increase in irrigation water can improve the partial productivity of nitrogen fertilizer. Xing Yingying et al. [35] also reached similar conclusions, but there are differences due to different environmental conditions, water–nitrogen management measures, etc., in the experimental area. Soil moisture plays a decisive role in the absorption of nutrients by crops and can affect the rate of nutrient absorption by crops [36]. However, when water supply conditions are good, water is not a factor limiting the effectiveness of nitrogen fertilizer [37]; nitrogen fertilizer can increase the availability of soil moisture, prompting plants to absorb more soil moisture, thereby improving the physiological functions of crops and increasing their water use efficiency [38]. The effectiveness of fertilizer is also closely related to a reasonable water–nitrogen system. Reasonable water–nitrogen regulation can not only increase the accumulation of crop dry matter but also reduce nitrogen leaching [39], significantly improve water–nitrogen utilization efficiency, reduce nitrogen loss, and decrease pollution in farmland environments, shallow groundwater, and surface water bodies [40]. Under the same level of irrigation water, the trend of increasing nitrogen application and improving water use efficiency is consistent, which can promote the growth and development of crops, but to some extent, it inhibits the partial productivity of nitrogen fertilizer. This is consistent with the research results of Zhu et al. [41] and Zhang et al. [42], who found that the partial productivity of fertilizer decreases with the increase in fertilizer application. It can be seen that in the arid northwest region, ensuring good water conditions and providing appropriate nitrogen fertilizer can achieve the maximum yield benefit; otherwise, it will lead to resource waste. Therefore, further exploration is needed for research under different water–nitrogen models to achieve a balance between the amount of nutrient absorption and supply of crops, providing an effective way for high efficiency and increased yield of crops.

4.3. Potato Water–Nitrogen Coupling Model and Optimization of Combination Schemes

Water and nitrogen input plays a crucial role in the economic benefit of crops. In this study, a water–nitrogen coupling model was established to demonstrate that the interaction of water and nitrogen can have a positive effect on economic benefit, thereby enhancing the economic benefit of potatoes. The economic benefit follows an initial increase and subsequent decrease as nitrogen application increases, primarily because the yield will first increase and then decrease with the linear input of nitrogen fertilizer. That is, excessive nitrogen application can lead to excessive economic investment, resulting in a decrease in economic benefit [43]. The increase in irrigation water also needs to be within a certain range; beyond the limit, excessive irrigation water will lead to a gradual decrease in economic benefit. Studies have shown that economic benefits are suppressed after irrigation water exceeds a threshold [44]. Excessive irrigation water can reduce resource utilization efficiency and lead to waste, which does not conform to the advocated concept of water-saving irrigation. Over-application of nitrogen fertilizer can also lead to a decrease in fertilizer utilization efficiency. In this study, through the optimization of targeted economic benefit, it was found that the treatment combination with a nitrogen application of 192 kg ha−1 and an irrigation water amount of 480 mm can achieve the goal of maximizing economic benefit.

5. Conclusions

A rational water–nitrogen management model can promote nutrient absorption, encourage the transport of photosynthetic products to the tubers, and enhance potato yield and water–nitrogen utilization efficiency.
Under different water–nitrogen management models, the accumulation of dry matter and the yield and constituent elements of potatoes increase with the increase in irrigation water and nitrogen application. Increasing the amount of irrigation water can promote the absorption of nitrogen fertilizer by potatoes, improving the partial productivity of nitrogen fertilizer. Similarly, nitrogen application can also enhance the water use efficiency of potatoes.
Both the yield of potatoes and economic benefit are highest with the N2W3 treatment (irrigation water 480 mm, nitrogen application 192 kg ha−1). Verified by the regression model equation, the economic benefit of this water–nitrogen treatment is close to the simulated economic benefit, with a high water–nitrogen utilization efficiency, and can be considered the optimal water–nitrogen management model for the arid northwest region.

Author Contributions

Data curation, data analysis, formal analysis, and writing—original draft preparation, Z.J.; writing—review and editing, D.S., D.L., D.S. and Y.C.; supervision, D.S.; funding acquisition, Y.C. All authors have read and agreed to the published version of the manuscript.

Funding

This research was funded by the Gansu Agricultural University Doctoral Research Start-up Funding Project (GAU-KYQD-2021-35).

Data Availability Statement

The original contributions presented in the study are included in the article, further inquiries can be directed to the corresponding author.

Conflicts of Interest

Zhiqiang Ju and Dongrong Li was employed by the company Dayu Water Conservation Group Co., Ltd. The remaining authors declare that the research was conducted in the absence of any commercial or financial relationships that could be construed as a potential conflict of interest.

References

  1. Marcinkowski, P.; Piniewski, M. Future changes in crop yield over Poland driven by climate change, increasing atmospheric CO2 and nitrogen stress. Agric. Syst. 2024, 213, 103813. [Google Scholar] [CrossRef]
  2. Su, B.; Wu, Y.; Yan, B.; Niu, J. Spatiotemporal variations and impacts on cultivated land resources in Huaihe Eco-Economic Belt during 1990–2020. Trans. Chin. Soc. Agric. Eng. 2023, 39, 247–258. [Google Scholar] [CrossRef]
  3. Zhou, Z.; Sharif, A.; Inglesi-Lotz, R.; Bashir, M.F. Analysing the interplay between energy transition, resource consumption, deforestation, and environmental factors on agricultural productivity: Insights from APEC countries. J. Clean. Prod. 2024, 446, 141408. [Google Scholar] [CrossRef]
  4. Kabir, K.; Baldos, U.L.C.; Hertel, T.W. The new Malthusian challenge in the Sahel: Prospects for improving food security in Niger. Food Secur. 2023, 15, 455–476. [Google Scholar] [CrossRef]
  5. Shi, C.; Wu, C.; Zhang, J.; Zhang, C.; Xiao, Q. Impact of urban and rural food consumption on water demand in China—From the perspective of water footprint. Sustain. Prod. Consum. 2022, 34, 148–162. [Google Scholar] [CrossRef]
  6. Hayden, B.T. Incomplete documentation, social isolation, and culinary estrangement: Factors affecting food security among urban migrant populations in Mexico. Glob. Food Secur. 2024, 42, 100779. [Google Scholar] [CrossRef]
  7. Qin, R.; Feng, Z.; Yu, C.; Zhang, Q.; Qi, J.; Li, F. Contributions made by rain-fed potato with mulching to food security in China. Eur. J. Agron. 2022, 133, 126435. [Google Scholar] [CrossRef]
  8. Zhang, T.; Li, C.; Wang, S.; Cheng, Z.; Li, Z.; Xu, T.; Zhou, X.; Chen, W.; Hong, J. Promoting sustainable potato production-Insights from an integrated life cycle environmental-economic assessment. Agric. Syst. 2024, 219, 104029. [Google Scholar] [CrossRef]
  9. Yimam, A.M.; Andreini, M.; Carnevale, S.; Muscaritoli, M. Perspective: Could Ethiopian potatoes contribute to environmental sustainability, the Ethiopian economy, and human health? Front. Sustain. Food Syst. 2024, 8, 1371741. [Google Scholar] [CrossRef]
  10. Xu, J.; Zhu, J.; Yang, Y.; Tang, H.; Lv, H.; Fan, M.; Shi, Y.; Dong, D.; Wang, G.; Wang, W.; et al. Status of major diseases and insect pests of potato and pesticide usage in China. Sci. Agric. Sin. 2019, 52, 2800–2808. [Google Scholar] [CrossRef]
  11. Xu, Y.; He, P.; Qiu, S.; Xu, X.; Ma, J.; Ding, W.; Zhao, S.; Gao, Q.; Zhou, W. Regional variation of yield and fertilizer use efficiency of potato in China. Plant Nutr. Fertil. Sci. 2019, 25, 22–35. [Google Scholar] [CrossRef]
  12. Su, D.; Zhang, H.; Deng, H.; Zhou, C.; Chen, X. Effect of irrigation and fertilization on yield and water and fertilizer use efficiency of potato in the northwestern China: A Meta-analysis. J. Irrig. Drain. 2024, 43, 19–26. [Google Scholar] [CrossRef]
  13. Cheng, M.; Wang, H.; Zhang, F.; Wang, X.; Liao, Z.; Zhang, S.; Yang, Q.; Fan, J. Effects of irrigation and fertilization regimes on tuber yield, water-nutrient uptake and productivity of potato under drip fertigation in sandy regions of northern China. Agric. Water Manag. 2023, 287, 108459. [Google Scholar] [CrossRef]
  14. Zhang, F.; Cai, Y.; Tan, Q.; Wang, X. Spatial water footprint optimization of crop planting: A fuzzy multiobjective optimal approach based on MOD16 evapotranspiration products. Agric. Water Manag. 2021, 256, 107096. [Google Scholar] [CrossRef]
  15. Liu, J.; Sun, B.; Shen, H.; Ding, P.; Ning, D.; Zhang, J.; Qiu, X. Crop water requirement and utilization efficiency-based planting structure optimization in the Southern Huang-Huai-Hai Plain. Agronomy 2022, 12, 2219. [Google Scholar] [CrossRef]
  16. Fan, X.; Schütze, N. Assessing crop yield and water balance in crop rotation irrigation systems: Exploring sensitivity to soil hydraulic characteristics and initial moisture conditions in the North China Plain. Agric. Water Manag. 2024, 300, 108897. [Google Scholar] [CrossRef]
  17. Dari, J.; QuintanaSeguí, P.; BarellaOrtiz, A.; Rahmati, M.; Saltalippi, C.; Flammini, A.; Brocca, L. Quantifying the hydrological impacts of irrigation on a mediterranean agricultural context through explicit satellite-derived irrigation estimates. Water Resour. Res. 2024, 60, WR036510. [Google Scholar] [CrossRef]
  18. Wu, P.; Wang, Y.; Li, Y.; Yu, H.; Shao, J.; Zhao, Z.; Qiao, Y.; Liu, C.; Liu, S.; Gao, C.; et al. Optimizing irrigation strategies for sustainable crop productivity and reduced groundwater consumption in a winter wheat-maize rotation system. J. Environ. Manag. 2023, 348, 119469. [Google Scholar] [CrossRef]
  19. Wang, Y.; He, Y.; Li, Z.; Qu, J.; Wang, G. Soil water dynamics and deep percolation in an agricultural experimental area of the North China Plain over the past 50 years: Based on field monitoring and numerical modeling. Sci. Total Environ. 2024, 928, 172367. [Google Scholar] [CrossRef]
  20. Dang, K.; Ran, C.; Tian, H.; Gao, D.; Mu, J.; Zhang, Z.; Geng, Y.; Zhang, Q.; Shao, X.; Guo, L. Combined effects of straw return with nitrogen fertilizer on leaf ion balance, photosynthetic capacity, and rice yield in saline-sodic paddy fields. Agronomy 2023, 13, 2274. [Google Scholar] [CrossRef]
  21. Shen, W.; Ni, Y.; Gao, N.; Bian, B.; Zheng, S.; Lin, X.; Chu, H. Bacterial community composition is shaped by soil secondary salinization and acidification brought on by high nitrogen fertilization rates. Appl. Soil Ecol. 2016, 108, 76–83. [Google Scholar] [CrossRef]
  22. Hu, M.; Xue, H.; Wade, A.J.; Gao, N.; Qiu, Z.; Long, Y.; Shen, W. Biofertilizer supplements allow nitrogen fertilizer reduction, maintain yields, and reduce nitrogen losses to air and water in China paddy fields. Agric. Ecosyst. Environ. 2024, 362, 108850. [Google Scholar] [CrossRef]
  23. Sun, Y.; Duan, L.; Zhong, H.; Cai, H.; Xu, J.; Li, Z. Effects of irrigation-fertilization-aeration coupling on yield and quality of greenhouse tomatoes. Agric. Water Manag. 2024, 299, 108893. [Google Scholar] [CrossRef]
  24. Qi, Z.; Gao, Y.; Sun, C.; Ramos, T.B.; Mu, D.; Xun, Y.; Huang, G.; Xu, X. Assessing water-nitrogen use, crop growth and economic benefits for maize in upper Yellow River basin: Feasibility analysis for border and drip irrigation. Agric. Water Manag. 2024, 295, 108771. [Google Scholar] [CrossRef]
  25. Shen, F.; Fei, L.; Tuo, Y.; Peng, Y.; Yang, Q.; Zheng, R.; Wang, Q.; Liu, N.; Fan, Q. Effects of water and fertilizer regulation on soil physicochemical properties, bacterial diversity and community structure of Panax notoginseng. Sci. Hortic. 2024, 326, 112777. [Google Scholar] [CrossRef]
  26. Li, P.; Qi, X.; Wu, H.; Fan, X.; Qiao, D.; Fan, T.; Zhao, Z.; Huang, Z.; Zhu, D.; Hu, C. Improving Water and Nitrogen Use Efficiency of Potato by Partial Root-Zone Drying Irrigation in the Semi-Arid Area in China: A Field Experimental Study; Canadian Society for Bioengineering: Québec City, QC, Canada, 2010. [Google Scholar]
  27. Azeem, B.; KuShaari, K.; Man, Z.B.; Basit, A.; Thanh, T.H. Review on materials & methods to produce controlled release coated urea fertilizer. J. Control. Release 2014, 181, 11–21. [Google Scholar] [CrossRef]
  28. Jyolsna, T.; Vashisht, B.B.; Yadav, M.; Kaur, R.; Jalota, S.K. Field and simulation studies on yield, water and nitrogen dynamics and use efficiency in rice-wheat crops in sequence. Field Crops Res. 2024, 311, 109366. [Google Scholar] [CrossRef]
  29. Li, Y.; Wang, J.; Fang, Q.; Hu, Q.; Huang, M.; Chen, R.; Zhang, J.; Huang, B.; Pan, Z.; Pan, X. Optimizing water management practice to increase potato yield and water use efficiency in North China. J. Integr. Agric. 2023, 22, 3182–3192. [Google Scholar] [CrossRef]
  30. Cassino, M.N.; Giletto, C.M.; Zamuner, E.C.; Sainz Rozas, H.R.; Barbieri, P.A.; Reussi Calvo, N. Nitrogen fertilization effects on boron and chloride concentration, yield and quality in potato. Commun. Soil Sci. Plant Anal. 2023, 55, 828–845. [Google Scholar] [CrossRef]
  31. Wang, Y.; Zhang, R.; Li, S.; Guo, X.; Li, Q.; Hui, X.; Wang, Z.; Wang, H. An evaluation of potato fertilization and the potential of farmers to reduce the amount of fertilizer used based on yield and nutrient requirements. Agronomy 2024, 14, 612. [Google Scholar] [CrossRef]
  32. Shrestha, B.; Stringam, B.L.; Darapuneni, M.K.; Lombard, K.A.; Sanogo, S.; Higgins, C.; Djaman, K. Effect of irrigation and nitrogen management on potato growth, yield, and water and nitrogen use efficiencies. Agronomy 2024, 14, 560. [Google Scholar] [CrossRef]
  33. Tang, J.; Bai, H.; Zhang, S.; Xiao, D.; Tianzhu, Z.; Liu, D.L.; Wang, B.; Feng, P. Adaptations of potato production to future climate change by optimizing planting date, irrigation and fertilizer in the Agro-Pastoral Ecotone of China. Clim. Risk Manag. 2024, 44, 100604. [Google Scholar] [CrossRef]
  34. Yang, Y.; Yin, J.; Ma, Z.; Wei, X.; Sun, F.; Yang, Z. Water and nitrogen regulation effects and system optimization for potato (Solanum tuberosum L.) under film drip irrigation in the dry zone of Ningxia China. Agronomy 2023, 13, 308. [Google Scholar] [CrossRef]
  35. Xing, Y.; Zhang, F.; Wu, L.; Fan, J.; Zhang, Y.; Li, J. Determination of optimal amount of irrigation and fertilizer under drip fertigated system based on tomato yield, quality, water and fertilizer use efficiency. Trans. Chin. Soc. Agric. Eng. 2015, 31, 110–121. [Google Scholar] [CrossRef]
  36. Li, S.; Zhou, D.; Li, J. Effect of different nitrogen application on yield, nitrogen distribution and utilization in winter wheat under soil water stress. Acta Agric. Boreali-Sin. 2001, 16, 86–91. [Google Scholar] [CrossRef]
  37. Lu, L.; Dong, Z.; Zhang, J.; Zhang, L.; Liang, S.; Jia, X.; Yao, H. Effect of water and nitrogen on yield and nitrogen utilization of winter wheat and summer maize. Sci. Agric. Sin. 2014, 47, 3839–3849. [Google Scholar] [CrossRef]
  38. Zhao, L.; Jing, H.; Wang, S. Study on the effect of fertilization on winter wheat under rainfed conditions. Agric. Res. Arid Areas 1991, 9, 46–52. [Google Scholar]
  39. Zhang, L.; Yang, Y.; Yin, J.; Wu, J.; Pan, X. Effects of drip fertigation on accumulation and translocation of dry matter and nitrogen together with yield in wheat. Trans. Chin. Soc. Agric. Mach. 2021, 52, 275–282+319. [Google Scholar] [CrossRef]
  40. Gao, Y.; Qi, G.; Ma, Y.; Yin, M.; Wang, J.; Wang, C.; Tian, R.; Xiao, F.; Lu, Q.; Wang, J. Regulation effects of water and nitrogen on yield, water, and nitrogen use efficiency of wolfberry. J. Arid Land 2024, 16, 29–45. [Google Scholar] [CrossRef]
  41. Zhu, Z.; Chen, D. Nitrogen fertilizer use in China–Contributions to food production, impacts on the environment and best management strategies. Nutr. Cycl. Agroecosyst. 2002, 63, 117–127. [Google Scholar] [CrossRef]
  42. Zhang, N.; Luo, H.; Li, H.; Bao, M.; Liu, E.; Shan, W.; Ren, X.; Jia, Z.; Siddique, K.H.M.; Zhang, P. Maximizing potato tuber yields and nitrogen use efficiency in semi-arid environments by precision fertilizer depth application. Eur. J. Agron. 2024, 156, 127147. [Google Scholar] [CrossRef]
  43. Cong, X.; Zhang, L.; Xu, Z.; Pang, G.; Feng, Y.; Zhao, D. Effects of irrigation and nitrogen interaction on water and fertilizer use efficiency and economic benefits of winter wheat. Trans. Chin. Soc. Agric. Mach. 2021, 52, 315–324. [Google Scholar] [CrossRef]
  44. Liu, M.; Zhang, Z.; Zheng, E.; Chen, P.; Chen, S.; Shang, W. Photosynthesis, water and nitrogen use efficiency of maize as impacted by different combinations of water and nitrogen applications. J. Irrig. Drain. 2018, 37, 27–34. [Google Scholar] [CrossRef]
Figure 1. Distribution of rainfall and temperature during the growth period of potatoes in 2021 and 2022.
Agronomy 14 01651 g001
Figure 2. Economic benefit of potatoes under different water–nitrogen treatments in 2021 and 2022.
Agronomy 14 01651 g002
Figure 3. Effect curves of single factors on the economic benefit of potatoes in 2021 and 2022.
Agronomy 14 01651 g003
Figure 4. Single-factor marginal effect curves for potato economic benefit in 2021 and 2022.
Agronomy 14 01651 g004
Figure 5. Economic benefit of potatoes under water–nitrogen coupling treatments in 2021 and 2022.
Agronomy 14 01651 g005
Table 1. Experimental design and coding values.
TreatmentsIrrigation Volume (mm)Code Value
(x2)
Nitrogen Application
(kg ha−1)
Code Value
(x1)
Early SeedlingSeedling BuddingFloweringPotato SettingMaturity
N1W1283747281960−1144−1
N1W23445573423800144−1
N1W34053674028001144−1
N2W1283747281960−11920
N2W234455734238001920
N2W340536740280011920
N3W1283747281960−12401
N3W234455734238002401
N3W340536740280012401
Table 2. Impact of different water–nitrogen combinations on potato yield and its constituent elements.
YearTreatmentYield (kg ha−1)Longitudinal Diameter (mm)Horizontal Diameter (mm)Weight per Plant (g)Dry Mass (g plant−1)
2021N1W127,932.65 ± 267.63 e77.32 ± 1.82 b50.07 ± 0.53 e1127.84 ± 17.83 f281.05 ± 9.93 d
N1W236,427.81 ± 928.22 c81.74 ± 2.36 ab54.83 ± 1.17 cd1327.95 ± 42.39 de308.29 ± 4.83 cd
N1W339,607.53 ± 1387.99 bc83.68 ± 3.14 ab57.63 ± 0.65 bc1453.08 ± 56.56 cd329.73 ± 7.94 bc
N2W131,468.95 ± 252.74 d79.53 ± 0.49 ab52.96 ± 2.05 de1242.62 ± 45.97 ef291.43 ± 10.21 d
N2W241,168.07 ± 1079.13 ab85.72 ± 1.54 a60.59 ± 1.56 ab1574.21 ± 60.46 bc343.87 ± 9.44 ab
N2W343,493.54 ± 1473.77 a87.01 ± 2.98 a63.84 ± 1.19 a1792.84 ± 38.91 a364.01 ± 8.29 a
N3W132,647.39 ± 1300.91 d82.30 ± 3.31 ab56.58 ± 1.70 bcd1400.73 ± 49.12 d310.64 ± 3.55 cd
N3W242,019.18 ± 1330.58 ab86.54 ± 0.87 a62.04 ± 1.54 a1683.02 ± 53.46 ab357.62 ± 15.30 ab
N3W343,007.62 ± 1444.73 ab87.38 ± 3.08 a62.85 ± 0.86 a1745.07 ± 41.26 a375.85 ± 14.15 a
N14.32 ***2.79 ns18.53 ***35.40 ***13.47 ***
W83.07 ***5.78 *30.34 ***59.15 ***30.42 ***
N × W0.30 ns0.09 ns0.89 ns2.01 ns0.55 ns
2022N1W126,537.83 ± 772.89 e76.51 ± 2.52 b49.64 ± 1.46 e1076.08 ± 38.03 g274.97 ± 6.42 e
N1W236,001.81 ± 1475.01 c81.18 ± 3.21 ab54.21 ± 1.00 cde1289.15 ± 39.42 ef297.42 ± 8.13 de
N1W338,237.95 ± 980.89 bc82.94 ± 2.99 ab58.36 ± 1.53 abc1415.29 ± 25.51 de324.61 ± 11.35 cd
N2W130,102.08 ± 1054.02 de78.83 ± 2.11 ab52.48 ± 2.08 de1212.36 ± 37.66 f285.29 ± 11.07 e
N2W240,017.62 ± 1531.39 ab85.07 ± 3.18 a60.13 ± 1.28 ab1498.73 ± 58.76 cd337.06 ± 8.49 bc
N2W343,082.19 ± 1092.45 a86.23 ± 1.42 a63.09 ± 1.39 a1758.04 ± 65.14 a359.15 ± 11.29 ab
N3W131,549.54 ± 1013.13 d81.58 ± 2.15 ab56.25 ± 1.07 bcd1373.52 ± 14.20 de304.78 ± 11.36 de
N3W241,394.66 ± 1621.62 ab85.46 ± 2.30 a61.58 ± 2.15 a1607.61 ± 39.10 bc348.63 ± 12.14 bc
N3W342,576.05 ± 1207.60 a86.95 ± 2.39 a62.47 ± 1.66 a1663.75 ± 57.81 ab383.54 ± 6.99 a
N13.97 ***2.45 ns12.12 ***35.10 ***16.87 ***
W80.42 ***5.25 ***23.42 ***59.25 ***35.06 ***
N × W0.22 ns0.07 ns0.70 ns2.56 ns0.87 ns
Note: Different letters following the data in the same column indicate significant differences at the p < 0.05 level. * indicates a significant difference at the p < 0.05 level, *** indicates a significant difference at the p < 0.001 level, and ns indicates no significant difference.
Table 3. Impact of different water–nitrogen treatments on potato water and nitrogen use efficiency.
YearTreatmentET (mm)WUE (kg m−3)IWUE (kg m−3)PFPN (kg kg−1)
2021N1W1485.73 ± 8.87 g5.75 ± 0.06 f8.31 ± 0.08 d245.02 ± 2.35 c
N1W2559.44 ± 9.32 de6.51 ± 0.08 cde8.93 ± 0.23 cd319.54 ± 8.14 b
N1W3626.33 ± 9.31 ab6.32 ± 0.21 de8.25 ± 0.29 d347.43 ± 12.18 a
N2W1501.15 ± 9.51 fg6.28 ± 0.07 de9.37 ± 0.08 bc163.90 ± 1.31 e
N2W2576.06 ± 6.62 cd7.14 ± 0.11 a10.09 ± 0.26 ab214.42 ± 5.62 d
N2W3632.48 ± 8.72 a6.87 ± 0.19 abc9.06 ± 0.31 cd226.53 ± 7.68 cd
N3W1530.47 ± 10.16 ef6.15 ± 0.14 ef9.72 ± 0.39 abc136.03 ± 5.42 f
N3W2598.50 ± 13.41 bc7.02 ± 0.17 ab10.30 ± 0.33 a175.08 ± 5.54 e
N3W3641.92 ± 13.45 a6.70 ± 0.09 bcd8.96 ± 0.30 cd179.20 ± 6.02 e
N8.14 **14.70 ***16.31 ***349.06 ***
W119.67 ***30.04 ***10.80 **88.37 ***
N × W0.61 ns0.09 ns0.55 ns5.09 **
2022N1W1495.32 ± 7.54 f5.36 ± 0.09 e7.90 ± 0.23 c232.79 ± 6.78 b
N1W2571.85 ± 6.27 d6.29 ± 0.20 bcd8.82 ± 0.36 bc315.81 ± 12.94 a
N1W3633.74 ± 7.46 ab6.03 ± 0.12 cd7.97 ± 0.20 c335.42 ± 8.60 a
N2W1516.46 ± 11.22 ef5.83 ± 0.23 d8.96 ± 0.32 b156.78 ± 5.49 d
N2W2593.02 ± 11.92 cd6.74 ± 0.13 ab9.81 ± 0.38 ab208.43 ± 7.98 c
N2W3645.01 ± 4.98 a6.68 ± 0.12 ab8.98 ± 0.23 b224.39 ± 5.69 bc
N3W1537.74 ± 14.88 e5.87 ± 0.08 d9.39 ± 0.30 ab131.46 ± 4.22 e
N3W2605.88 ± 14.61 bc6.83 ± 0.11 a10.15 ± 0.40 a172.48 ± 6.76 d
N3W3655.76 ± 12.00 a6.50 ± 0.25 abc8.87 ± 0.25 bc177.40 ± 5.03 d
N7.13 **10.65 **14.16 ***259.35 ***
W109.47 ***28.85 ***9.27 **78.87 ***
N × W0.25 ns0.22 ns0.32 ns4.04 *
Note: Different letters after the data in the same column indicate significant differences at the p < 0.05 level. * indicates a significant difference at the p < 0.05 level, ** indicates a significant difference at the p < 0.01 level, *** indicates a significant difference at the p < 0.001 level, and ns indicates no significant difference. ET denotes potato water consumption; WUE denotes potato water use efficiency; IWUE denotes potato irrigation water use efficiency; and PFPN denotes potato nitrogen fertilizer bias productivity.
Table 4. Optimal search schemes for target economic benefit.
Target Economic Benefit Level CodesLarger than Average Economic BenefitLower than Average Economic Benefit
x1x2x1x2
TimesFrequencyTimesFrequencyTimesFrequencyTimesFrequency
−1212.5000333.30555.60
−0.5318.80212.50222.20333.30
0318.80425.00222.20111.10
0.5425.00531.30111.1000
1425.00531.30111.1000
Total number of times161699
Standard error0.17500.13090.23730.1211
95% confidence interval−0.21700.52950.12730.6852−0.82510.2695−1.001−0.443
Optimization123.17–194.83354.33–434.6764.79–169.87191.86–272.21
Disclaimer/Publisher’s Note: The statements, opinions and data contained in all publications are solely those of the individual author(s) and contributor(s) and not of MDPI and/or the editor(s). MDPI and/or the editor(s) disclaim responsibility for any injury to people or property resulting from any ideas, methods, instructions or products referred to in the content.

