Article

Response of the Edamame Germplasm to Early-Season Diseases in the United States

1
School of Plant and Environmental Sciences, Virginia Tech, Blacksburg, VA 24060, USA
2
Department of Horticultural Sciences, Tropical Research and Education Center, University of Florida, Homestead, FL 33031, USA
3
Department of Entomology and Plant Pathology, University of Arkansas, Fayetteville, AR 72701, USA
4
Department of Plant, Soil and Microbial Sciences, Michigan State University, East Lansing, MI 48824, USA
*
Authors to whom correspondence should be addressed.
Agronomy 2024, 14(8), 1660; https://doi.org/10.3390/agronomy14081660
Submission received: 20 June 2024 / Revised: 22 July 2024 / Accepted: 24 July 2024 / Published: 29 July 2024
(This article belongs to the Special Issue Research Progress on Pathogenicity of Fungi in Crops—2nd Edition)

Abstract

:
Edamame (Glycine max (L.) Merr.) is a specialty soybean newly grown in the United States that has become the second most widely consumed soy food (25,000–30,000 tons annually). Poor crop establishment caused by soilborne diseases is a major problem limiting edamame production in the U.S. This study investigated 24 edamame cultivars/lines to determine their response to three soilborne pathogens causing seed rot and seedling damping off, including Rhizoctonia solani, Sclerotium rolfsii, Pythium irregulare, and Xanthomonas campestris pv. glycines, a seedborne pathogen that caused severe outbreaks of bacterial leaf pustules in mid-Atlantic regions in 2021. The hypothesis was that resistant variations existed among the genotypes, which could be used for production and future breeding efforts. The results reveal that all genotypes were affected, but partially resistant varieties could be clearly recognized by a significantly lower disease index (p < 0.05), and no genotype was resistant to all four diseases. Newly developed breeding lines showed overall higher disease resistance than commercial cultivars, particularly to R. solani and P. irregulare. This study found genetic variability in edamame, which can be helpful in breeding for resistance or tolerance to early-season diseases. The result will promote domestic edamame production and further strengthen and diversify agricultural economies in the U.S.

1. Introduction

Edamame is a specialty soybean, harvested while still green and immature, and is consumed by humans as a vegetable. Originating from China, edamame has enjoyed surging popularity and has become the second most consumed soy food in the United States [1]. This burgeoning demand has led to an increase in its cultivation and introduced new challenges in edamame production. Being harvested while green makes edamame avoid many of the late-season diseases that occur in traditional soybeans [2]. Early-season diseases, such as seed and root rot and seedling damping-off and blights, cause poor standing and are generally problematic in edamame production [3]. Most early-season diseases are caused by soilborne fungal and oomycete pathogens, such as Rhizoctonia solani, Pythium sp., and Sclerotium rolfsii. These pathogens can survive in the soil for many years, causing seed rot or seedling death shortly after emergence (damping-off or seedling blight), resulting in serious or even complete yield loss. Between 2010 and 2014, the estimated annual soybean yield losses caused by seedling diseases in the southern U.S. averaged 67,117 (kg in thousands) [4].
Many strategies have been explored to control edamame soilborne diseases, including using fungicide seed treatments, biocontrol products, and cultural practices, such as crop rotation, soil solarization, anaerobic soil disinfestation, soil steam sterilization, biofumigants, avoiding fields where damping-off has been an issue in the past, and avoiding overirrigation or poorly drained fields [5,6]. Fungicide seed treatments have been broadly applied as a cheap and mostly reliable approach to defend against soilborne diseases. There are still a few seed treatments that are labeled for edamame currently, and most seeds are sold nontreated. A recent study reported that edamame emergence can be improved up to 47% more than a nontreated control using seed treatment with fludioxonil + mefenoxam (at 2.5 and 3.75 g/100 kg seed, respectively), which is currently registered for use on grain-type soybean [3]. Other studies reported that the commonly used fungicides are toxic to nontargeted microorganisms, such as bradyrhizobia, a nitrogen-fixing bacteria capable of forming symbiotic nodules, therefore negatively impacting the N2 fixation of legumes [7,8]. The usage of agrochemicals has been more and more questioned nowadays due to their potential hazards to the environment and human and animal health, as well as with the increasing demand for organic edamame, which constitutes a large portion of the market.
A cost-effective, efficient, and environmentally safe approach to avoid economically significant losses from soilborne diseases has been well proven to be the cultivation of resistant varieties [9]. Breeding for resistance requires identifying germplasm with levels of resistance; however, there have been no documented reports on resistance in edamame toward damping-off and early root/hypocotyl damage caused by these three major soybean soilborne pathogens, including R. solani, Pythium sp., and S. rolfsii. Edamame remains a relatively new specialty crop in the U.S., and breeders are charged to develop new edamame cultivars characterized by disease resistance and sensory trait enhancements, with the overarching goal of improving both agronomic performance and consumer acceptability.
Moreover, from July to September of 2021, severe outbreaks of bacterial leaf pustule (BLP) were observed in edamame trails in Kentland farm, Whitethorne, Virginia, and symptom severity varied by genotypes. BLP has been regarded as an important disease of soybean and occurs in grain-type soybean growing areas worldwide. The disease is characterized by the development of large leaf lesions, which have the potential to trigger premature leaf shedding, resulting in a substantial decline in soybean yields of up to 60% [10]. Additionally, BLP increases the susceptibility of pods to sun scalding due to excessive sunlight exposure, thereby significantly compromising the quality of edamame pods. To date, no bacterial pustule-resistant edamame cultivars have been reported, and studies and resistant edamame sources are still very limited in the U.S.
Thus, the purpose of this research was (1) to assess the occurrence and severity variations in BLP at various stages of plant growth within the twenty-four prominent edamame genotypes recently developed by the breeding programs at Virginia Tech and the University of Arkansas and (2) to evaluate the response of these twenty-four genotypes to early-season diseases, including Rhizoctonia root and stem rot (RR, caused by Rhizoctonia solani), southern blight (SB, caused by Sclerotium rolfsii), and Pythium root rot (PR, caused by Pythium irregulare). This study is the first to characterize the response diversity of newly developed genotypes in relation to major edamame diseases in the U.S., which is intended to provide guidance in developing strategies to deploy integrated disease management for this emerging crop. The resilient genotypes identified in this research will serve as key contributors not only to edamame production but also as drivers for future breeding endeavors. These advancements will also benefit producers by strengthening and diversifying agricultural economies in both local and regional U.S. markets.

2. Materials and Methods

2.1. Plant Materials

After a preliminary screening of over a hundred conventional genotypes to eliminate the genotype with either poor agronomic performance or sensory attributes, 24 advanced edamame (Glycine max (L.) Merr.) genotypes with desirable edamame traits (e.g., big seed size, good pod appearance, high sugar, and protein content) were selected to evaluate their disease resistance in this study (Table 1). These prospective edamame genotypes consisted of nine breeding lines, newly developed from the breeding program of the University of Arkansas, and thirteen lines from Virginia Tech. ‘UA Kirksey’ [11] and ‘VT Sweet’ [12], two major commercial edamame varieties grown in the midsouthern region of the U.S., were also included as the commercial checks (standard). All the seeds were harvested and stored under the same conditions to minimize differences in seed quality and germination performance.

2.2. Field Resistance Screening for Bacterial Pustule

Disease surveys were conducted in 2021 from June to September to assess the incidence and severity of BLP among the 24 advanced edamame genotypes at Kentland Farm in Whitethorne, Virginia. These surveys were conducted from the juvenile stage (i.e., V5, when symptoms were first observed in the field) up to the pod harvest stage (i.e., R6), encompassing five survey dates (i.e., 23 July, 30 July, 15 August, 30 August, and 8 September). Seeds were sowed in a randomized complete blocks design (RCBD) with four replications. Each line was planted in a single-row plot with 0.75 m row spacing and 5.5 m long. Plots were machine planted with a cone-type soybean planter in late May at a seeding rate of 20 seeds/m. Plots were entirely rainfed; no irrigation was carried out prior to or during planting. Each plot was assessed for the presence of bacterial pustule disease. The disease severity rate (DSR) was estimated as the percentage of the total leaf surface area that was covered with bacterial pustule symptoms. The mean severity rate was calculated across all four replications for all of these five survey dates. Our methods for estimating disease incidence and severity were in accordance with the study by Kang [10].

2.3. Identification of the Causative Agent of Edamame Bacteria Pustule

2.3.1. Collection of Samples in the Field and Bacteria Isolation

In late August 2021, approximately 20 to 30 infected plants from different edamame genotypes were collected in the field of Kentland farm. The pustule-containing leaf tissues were surface sterilized with 1% sodium hypochlorite for 90 s, followed with 70% alcohol for 60 s, rinsed three times in sterile water, and then macerated with sterile water for 2 min. The suspension was streaked onto a nutrient agar (NA) medium. Single colonies obtained were further purified on the new NA plates at 28 °C. A total of 21 isolates were obtained. Their pathogenicity was determined by Koch’s postulates, which were completed by reisolating the strains from lesions of the artificially inoculated leaves.
The pathogenicity was accessed on edamame ‘UA Kirksey’, a bacterial pustule susceptible cultivar found in this study, following topical spray application. The edamame plants (V3 stage) were slightly wounded with a sterilized toothpick and then sprayed with the bacterial suspension (optical density at 600 nm = 0.2; approximately 108 CFU/mL) of each isolate [13]. Negative controls were sprayed with water. All plants were kept under a 16 h photoperiod at 28 °C with above 90% relative humidity. The disease symptom was assessed 7 to 10 days after inoculation. The pathogenic isolates were reisolated from the infected leaves and were further preserved in 30% glycerol at −80 °C.

2.3.2. DNA Extraction, Sequencing, and Phylogenetic Analyses

Well-separated fluidal colonies of each isolate were selected for genomic DNA extraction after growing them for 48 h at 28 °C under 200 rpm in LB broth. Total DNA was extracted using a GeneJET Genomic DNA Purification Kit (Thermo Scientific™, Waltham, MA, USA). DNA quantity and quality were determined using a NanoDrop 2000 spectrophotometer (Thermo Scientific). These isolates were subjected to 16S rDNA amplification [14], sequencing, and BLASTn NCBI (http://www.ncbi.nlm.nih.gov/blast/, accessed on 20 April 2024). As the sequence of some isolates shared 100% identities with each other, seven of the 21 isolates (EX1, EX4, EX7, E8, EX13, EX16, and EX21) were selected as the representative strains for further analyses. This involved sequencing and the phylogenetic analysis of two housekeeping genes, namely DNA gyrase subunit B gene (gyrB) and ATP synthase β-subunit gene (atpD), which are typically employed for Xanthomonas pathotype classification [15,16].
The PCR conditions for amplifying 16S rDNA, gyrB, and atpD genes were as follows: an initial denaturation step at 94 °C for 5 min, followed by 30 cycles of denaturation at 94 °C for 30 s, annealing at temperatures specified in Table S1 for each gene’s primer pair for 1 min, and extension at 72 °C for 3 min; a final extension step was performed at 72 °C for 10 min. A 50 μL PCR reaction volume was made by mixing 25 μL of SYBR® Premix Ex Taq™ (TaKaRa, Shiga, Japan), 22 µL of sterilized ddH2O, 1 μL of each primer (10 pmol), and 1 µL of cDNA template. A total of 10 μL of the PCR product was separated on a 1.5% agarose gel with 0.5 μg mL−1 of ethidium bromide in 0.5× TAE buffer at 150 volts for 25 min. Gels were visualized and imaged in a Bio-Rad Imager (Bio-Rad, Hercules, CA, USA). The amplified region was purified using GeneJET Gel Extraction Kit (Thermo Scientific™) following the instructions and was subjected to sequencing by Genomics Sequencing Center, Virginia Tech. The detailed information on the primers used here is shown in Supplementary Table S1.
The gyrB and atpD sequences of these seven strains were aligned using ClustalW multiple alignments of MEGA X software (version 10.0.4). Two phylogenetic trees of these seven strains, as well as other published closely related Xanthomonas bacteria in the NCBI database, were constructed based on their gyrB and atpD sequences, respectively. The construction of these trees was executed through the application of the neighbor-joining method [17], and each tree was subjected to 1000 bootstrap replications. All the gyrB and atpD gene sequences generated from these newly isolated seven strains were deposited in the GenBank database under the accession numbers shown in Supplementary Table S1.

2.4. Growth Chamber Screening for Seedling Diseases

All twenty-four genotypes were evaluated for their resistance to the three major soilborne diseases on edamame (i.e., Rhizoctonia root and stem rot, Pythium root rot, southern blight, and sudden death syndrome). Seeds were surface sterilized using sodium hypochlorite (10%, v/v) for 5 min, washed several times with distilled H2O [18], and allowed to dry on a paper towel before sowing. Agate, (i.e., PI 548296) and Gardensoy 21 (i.e., PI 662,954), which were reported to be susceptible and tolerant to broad soilborne diseases were used as reference checks in this work [3]. The tests for R. solani and S. rolfsii were carried out by the Soybean Breeding Program at Virginia Tech. Meanwhile, the P. ultimum test was undertaken by the Soilborne Pathology and Ecology Lab at the University of Arkansas.

2.4.1. Inoculum Preparation and Resistance Evaluation for Rhizoctonia Root and Stem Rot

The inoculum of mycelial suspension made by R. solani Potato Dextrose Agar (PDA, Criterion, Santa Maria, CA, USA) culture was prepared according to a previous study [19]. Sterilized seeds were sowed in 72-hole trays (12 × 6 cells, cell volume = 65 mL), with two seeds for each hole, fully filled by sterilized Promix potting soil (Miracle-Gro, Lawn Products Inc., Marysville, OH, USA). Upon the seeds being sowed, a syringe was used to apply 2 mL (about 0.07 oz) of the R. solani mycelial suspension at each of the four edges of the hole around the seeds. Ten seedlings of each genotype were inoculated with R. solani per replication. The twenty-four genotypes were arranged in a Completely Randomized Design (CRD) with three replications, and the experiment was repeated three times. Soil inoculated with suspension made by plain PDA served as control. Trays were placed in the growth chamber (2500 lux, temperature at 28 °C, 16 h daylight, >90% relative humidity). To prevent pathogen leakage from the soil, all trays were watered from the bottom.
Plants were removed from trays after 3 weeks of inoculation. The soil was removed from the roots by washing with running tap water, and the roots and hypocotyl of each plant were evaluated using the 1-to-9 scale developed by Peña [20], where 1 = No visible symptoms, normal plant development; 2 = 10% root infection, small (<3 mm) superficial root lesions, normal plant development; 3 = 10–20% infection. Small (3–5 mm) superficial lesions surrounding hypocotyls or roots. Normal plant development; 4 = 20–35% infection. Small (3–5 mm) deep lesions surrounding hypocotyls or roots. Normal plant development; 5 = 35–50% infection. Deep (3–5 mm) lesions surrounding hypocotyls or roots. Secondary roots and plant development were reduced; 6 = 50–65% infection. Deep (5–10 mm) lesions surrounding hypocotyls or roots. Few secondary roots were visible. Plant development was highly reduced; 7 = 65–80% infection. Deep (10 mm) lesions surrounding hypocotyls or roots. Few or no secondary roots were visible. Elongation of hypocotyl, and no formation of the first trifoliolate leaf; 8 = 80–95% infection. Emergence followed by loss of cotyledon and absence of secondary roots; 9 = 95–100% infection. Seed dead. No emergence. The disease severity rating (DSR) = ∑(class frequency × score of rating class)/total number of observations. The same formula was applied to the analysis of the following three soilborne diseases.

2.4.2. Southern Blight

The inoculum was prepared according to [21], with modifications. Briefly, a 5 mm diameter plug of the S. rolfsii culture was transferred to a 9 cm diameter petri dish containing PDA and incubated at 27 °C for 5 days. The inoculum of S. rolfsii was prepared by first soaking barley grains (100 g) with water (40 mL) in 250 mL flasks overnight and sterilized by autoclaving at 120 °C for 1 h each on two consecutive days. Eight 5-mm plugs taken from the edge of the growing colony hyphal tip of the 5-day-old S. rolfsii PDA agars were inoculated into each flask and incubated at 27 °C for a week for the active growth of the fungus. Each flask will be shaken at least twice within the week to ensure even and thorough colonization of the medium. The pure inoculum of the S. rolfsii was then mixed with sterilized Promix potting soil at the ratio of 1% (w/w) and kept at 27 °C in the darkness for 4 days for proper growth of the pathogen.
Nine sterilized soybean seeds were sown into a 15 cm diameter plastic pot filled with inoculated soil. Four pots were for each genotype and the experiment was repeated three times. Control treatments will have the same amount of clean barely in the soil. After inoculation, plants were placed in a growth chamber under the same conditions described above. Southern blight severity was assessed at 10 days after inoculation using a scale modified by Paparu [22], where 1 = No symptoms, the plant was healthy; 2 = Yellow superficial lesions (<3 mm) present on stem above the soil, but no visible fungal outgrowth; 3 = Deep (3–5 mm) lesions surrounding hypocotyls or roots, secondary roots reduced, no visible fungal outgrowth; 4 = Deep lesions (>5 mm) girdling the stem and visible fungal outgrowth on stem base, characterized by silky-white mycelia or sclerotia, younger leaves begin to wilt and stems begin to shrivel; 5 = Seedling damped-off, desiccation, and browning of leaves and stem; plant collapse and death (rot); 6 = Preemergence damping-off; complete seed rot, with no sign of germination, or evidence of germination hampered by fungal colonization.

2.4.3. Pythium Root Rot

The oomycete pathogen P. ultimum was grown and maintained on PDA. For the inoculum preparation, five hundred grams of millet seed were soaked overnight in 1 L of deionized water on spawn bags. The soaked millet was autoclaved at 40 min sterilization, and 10 min dry. After cooling down, the millet was autoclaved again the following day under the same conditions. Two plates of the isolate grown on solid PDA were transferred into the spawn bag, sealed with a heat impulse sealer, and kept at room temperature for 7–10 days. The bags containing the inoculated millet were periodically shaken to ensure even colonization of the millet. Once sufficiently colonized, the inoculum was air-dried in laminar flow cabinets. Fully colonized millet was checked for contamination from environmental or opportunistic fungi or bacteria by plating a gram of the colonized millet onto solid PDA and plates were incubated for 5 days.
In order to assess the plant resistance, a seedling cup assay was conducted in the greenhouse using the prepared inoculum [23]. Sixteen-ounce (16 oz) foam cups perforated with four 10 mm diameter holes at the base for draining were used in this experiment. Ten grams of the inoculum were thoroughly mixed with sterile vermiculite per cup. Ten filled cups were placed in plastic greenhouse trays (1020 Trays, Greenhouse Megastore, Danville, IL, USA). Next, six sterilized seeds of each genotype were sown about 5 mm below the surface in the vermiculite containing the inoculum or vermiculite with sterile millet in the control. Plants were watered regularly, and each treatment was replicated three times. Plants were harvested after 14 days, and the vermiculite was washed off the roots to assess the root disease severity using a scale by Klepadlo [23]. Plants in each cup were rated on a 1-to-5 scale, in which 1 = a healthy root system with no symptoms of lesions or rot on the root system; 2 = small lesions on the lateral roots, with approximately 1 to 20% of roots with visible symptoms; 3 = rot on lateral roots and visible symptoms of rot beginning on the main tap root, with approximately 21 to 75% of the roots with visible symptoms; 4 = both lateral roots and main tap roots with visible symptoms of root and approximately 76 to 100% of the roots infected; and 5 = no germination, complete colonization of the seed.

2.5. Statistics Analysis

For the twenty-four edamame genotypes, individual seedlings were evaluated using the specific disease severity scale for each soilborne disease. The disease severity index (DSI) was calculated as per Chiang [24]:
D S I = c l a s s   f r e q u e n c y × s c o r e   o f   r a t i n g   c l a s s total   number   of   observations × maximal   disease   index  
Mean values for each genotype were computed based on the evaluated seedlings within each replication and were subsequently employed for the purpose of data analysis. Means were compared using the one-way factorial analysis of variance (ANOVA) with Tukey’s HSD test at p = 0.05. Values were arcsine square root transformed prior to analysis to ensure homogeneity of variance [22]. For the statistical analysis of BLP, arcsine square root transformed DSR values were utilized due to the different severity evaluation methods used. Pearson’s correlation coefficient (r) for the severity of these four diseases was computed using R (version 4.0.2, https://www.r-project.org/, accessed on 20 April 2024).

3. Results

3.1. Evaluation of Edamame Bacterial Pustule

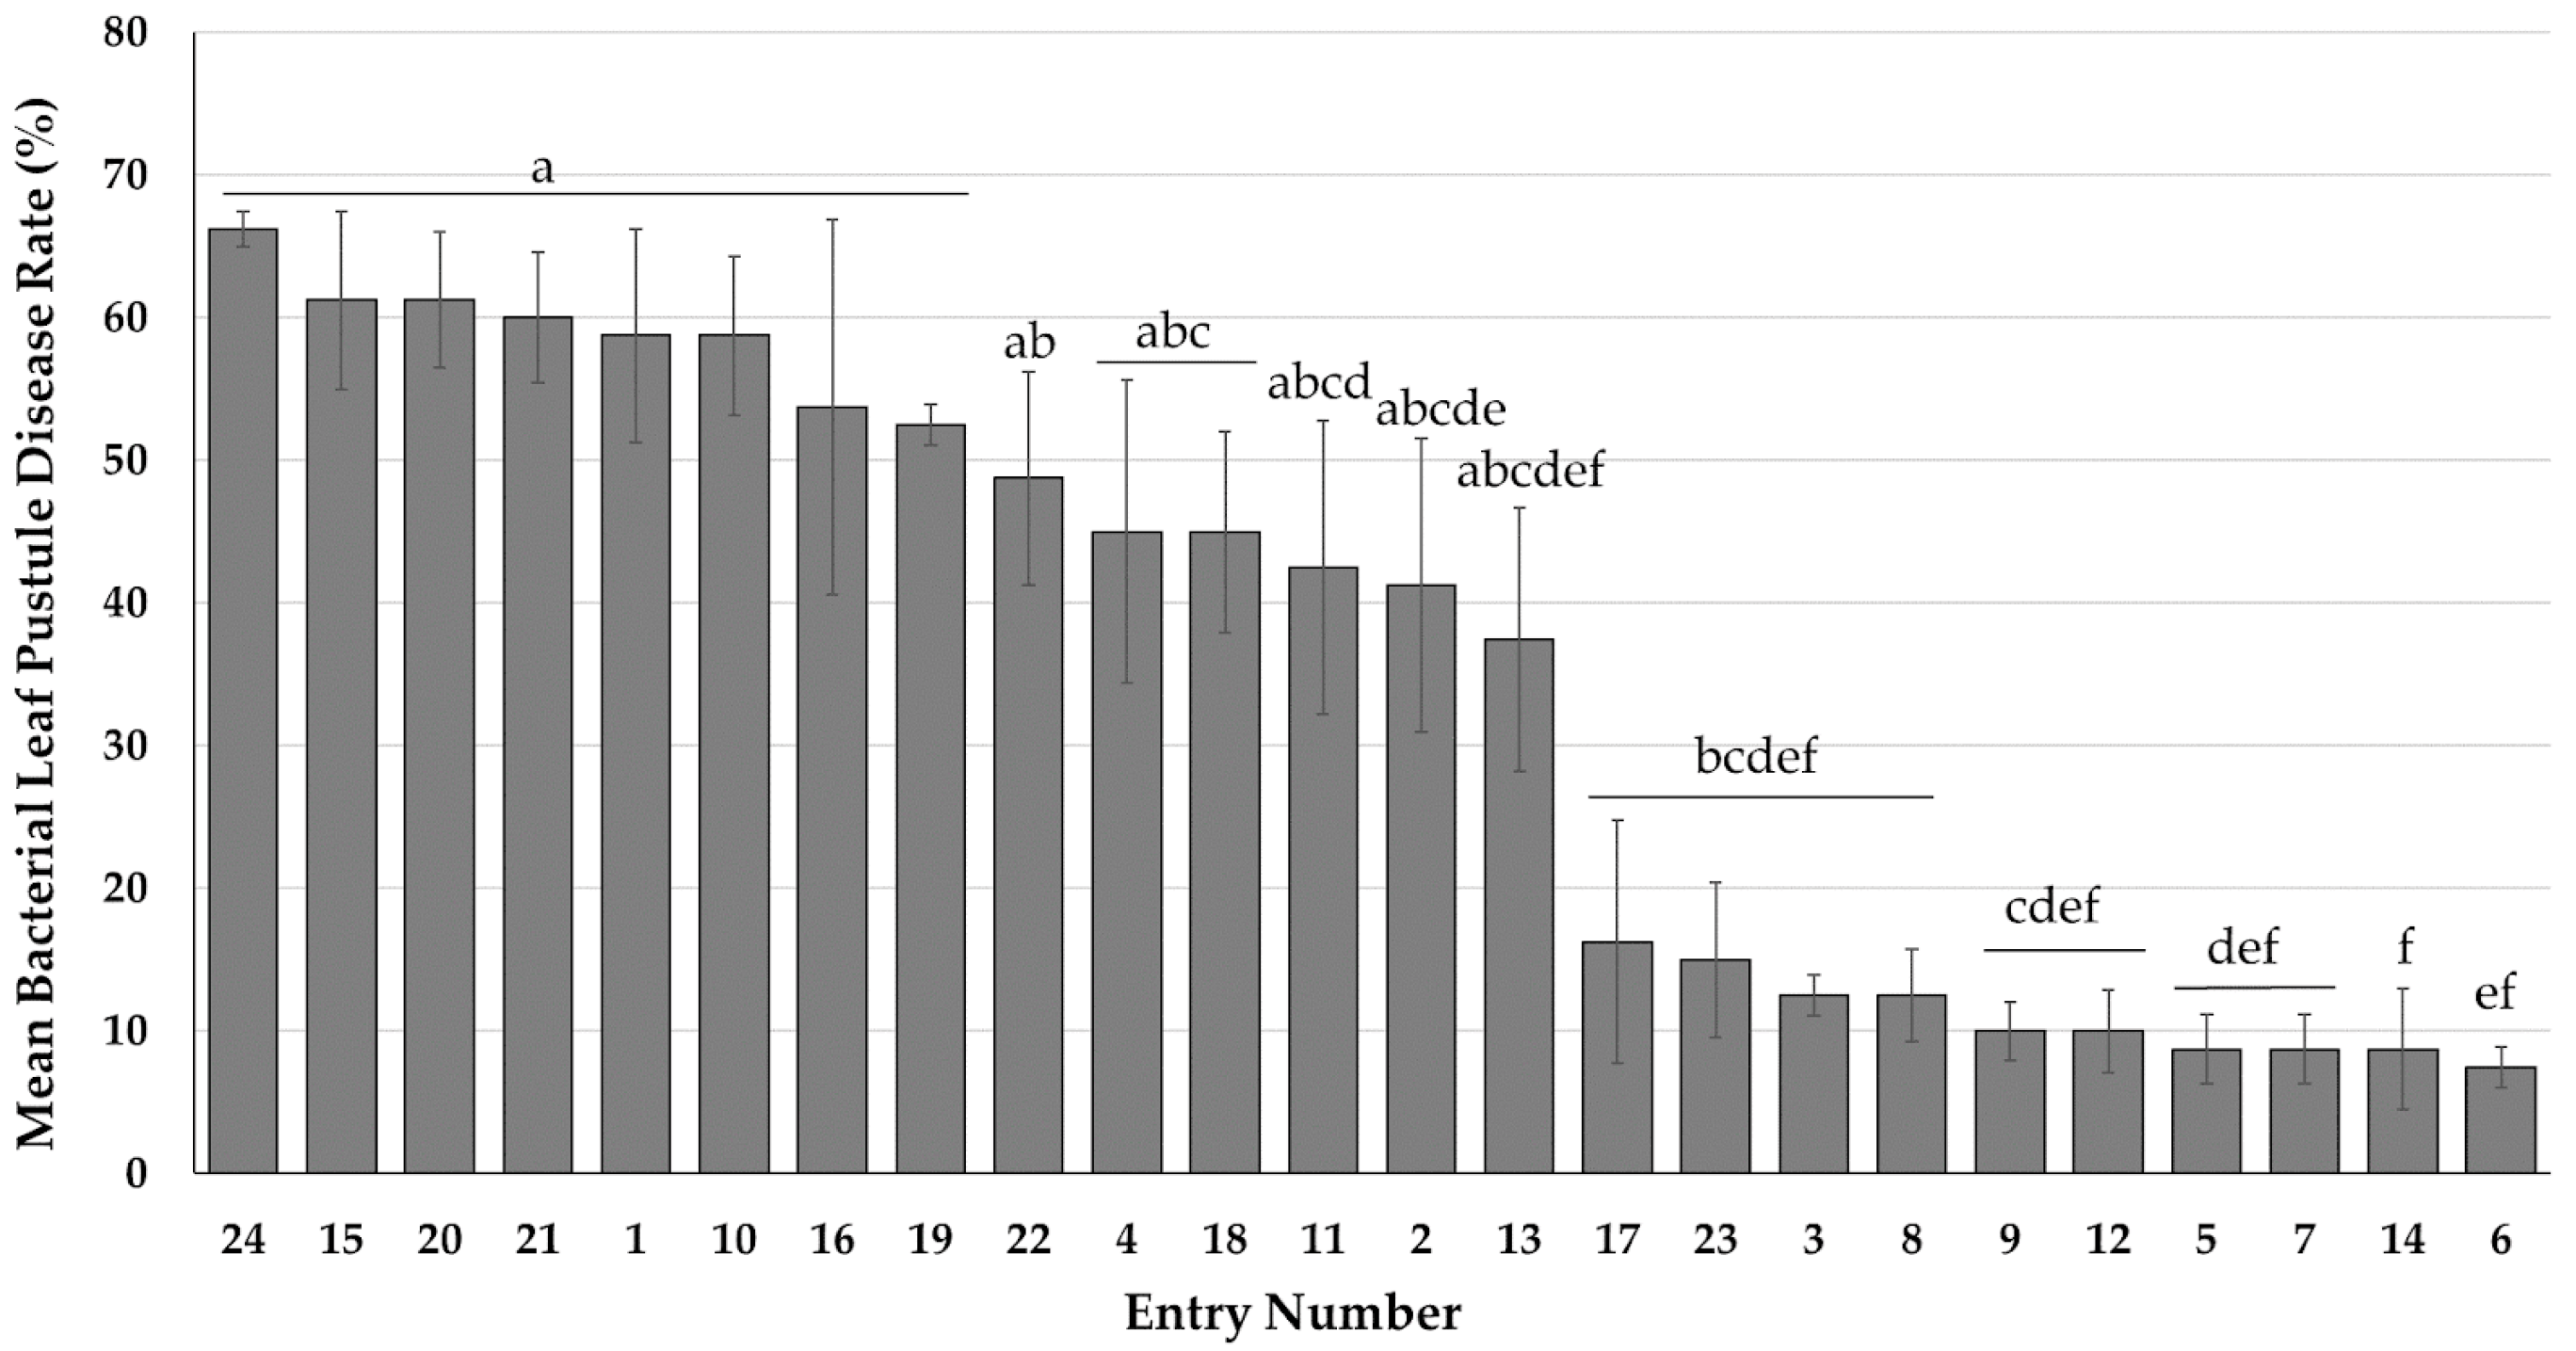
3.1.1. Disease Incidence and Severity of Bacterial Pustule in Virginia

During the period from July to September 2021, bacterial pustules were observed in edamame trails of Kentland farm, Whitethorne, Virginia. The disease manifested during the V5 stage of edamame growth, initially presenting as small, raised pustules on the leaves, accompanied by a distinctive yellow halo. As the disease developed, the pustules became more conspicuous, particularly on newly formed leaves. Ranging in diameter from 1 to 5 mm, these pustules had the capacity to coalesce, forming larger, irregularly shaped lesions during the progressive stages of the disease. Subsequently, these lesions contributed to the defoliation of leaves in plants, especially in those were susceptible to the disease. No plant wilting or mortality due to the disease were observed throughout the study period.
By the end of the survey on 8 September 2021, all 24 edamame genotypes exhibited disease symptoms, albeit with varying degrees of severity, ranging from 7.5% to 66.3% (depicted in Figure 1). Specifically, four genotypes (R17-2965, R18-9770, V16-0523HP, and R18-9725) exhibited resistance, with severity rates ranging from 7.5% to 8.8%. Bacterial pustule symptoms were mainly localized to the lower leaves, showing sporadic pustule formation. Six genotypes displayed severity rates within the range of 10% to 16.3%, while an additional six genotypes exhibited severity rates ranging from 37.5% to 48.8%. The remaining eight genotypes had the highest severity rates, ranging from 52.5% to 66.3%. These genotypes showed a wider distribution of bacterial pustules on both older and newer leaves, with a higher density of pustules present on the new leaves. Notably, UA Kirksey and VT Sweet, two prominent commercial edamame cultivars commonly grown in the midsouthern region of the United States, displayed significant severity rates of 58.8% and 42.5%, respectively, which fell within the high range of severities observed in these genotypes.

3.1.2. Variations in Disease Development across Various Edamame Reaction Groups

The progression of BLP was assessed across 24 edamame genotypes, spanning from the vegetative stage (V5) where initial disease symptoms emerged to the stage just prior to pod harvest (R6). This investigation was conducted over five time points: 23 July (when plants were approximately at the V5 stage, roughly eight weeks post-planting), 30 July, 15 August, 30 August, and 8 September (Table S2). By 23 July, all genotypes exhibited minimal disease, with a collective disease rate below 5%. Notably, 29.1% of the genotypes tested, including five resistant and two moderately resistant ones, remained entirely asymptomatic at the time. By 15 August, lesions were evident across all genotypes, with disease severity varying significantly from 1.3% to 48.8%. The disease severity reached its peak on 8 September, approximately 15 weeks post planting, with severity values for each genotype depicted in Figure 1.
The genotypes showing similar severity and disease development trends were grouped together, resulting in the formation of three distinct groups: Group 1, Group 2, and Group 3 (Table 1). Group 3 showed remarkably reduced disease responses when compared with the other two groups, across the entire observation period (illustrated in Figure 2a). Significant differences were also observed between Group 1 and Group 2 across all survey dates, except 23 July, primarily due to the low severity observed during the initial phase of disease development. Group 1 displayed a noticeable increase in disease severity, starting at 4.2% initially and surpassing the 50% threshold on 30 August (reaching 51.9%), reaching approximately 60% prior to pod harvest. Conversely, Group 3 consistently maintained disease severity levels below 20% throughout the study.
Regarding disease progression, it is noteworthy that the growth rate of Group 3 consistently exhibited a significant lag compared with both Group 1 and Group 2 throughout the entire disease development period, as illustrated in Figure 2b. To be more specific, the disease growth rate of Group 3 was 4.1 times slower than that of Group 2 and 5.5 times slower than that of Group 1. This observation underscores the considerable advantage in disease resistance and resilience demonstrated by the resistant genotypes.
Table 1. The twenty-four edamame genotypes evaluated in this study.
Entry No.Variety NameTypeSourceGroup a
1UA KirkseyCVUA, USA1
2R15-10280BLUA, USA2
3R17-2750BLUA, USA3
4R17-2776BLUA, USA2
5R17-2965BLUA, USA3
6R18-9725BLUA, USA3
7R18-9770BLUA, USA3
8R18-9782BLUA, USA3
9R18-9794BLUA, USA3
10R18-9808BLUA, USA1
11VT SweetCVVT, USA2
12V16-0293BLVT, USA3
13V16-0521BLVT, USA2
14V16-0523HPBLVT, USA3
15V16-0527BLVT, USA1
16V16-0546BLVT, USA1
17V16-0688HPBLVT, USA3
18V18-0785BLVT, USA2
19V18-1025BLVT, USA1
20V19-0196BLVT, USA1
21V19-0288BLVT, USA1
22V19-0290BLVT, USA2
23V19-0322BLVT, USA3
24V19-0368BLVT, USA1
CK1AgateCVJapanNA
CK2Gardensoy 21CVUI, USANA
Note: CV: Commercial variety; BL: Breeding line; UA: University of Arkansas; VT: Virginia Tech; UI: University of Illinois Urbana-Champaign; CK1 (Agate, i.e., PI 548296) and CK2 (Gardensoy 21, i.e., PI 662954) were used as reference checks of susceptible and tolerant genotypes, respectively, to broad soilborne diseases, according to the study of Williams and Bradley (2017) [3]. Group a: The genotypes exhibiting similar severity and trends in bacterial leaf pustule disease development were grouped together into three distinct categories, Group 1, Group 2, and Group 3, based on the results of this study, as shown in Figure 2. NA: not to be tested.

3.2. Identification of the Causative Agent of Bacterial Pustule

3.2.1. Isolation of Xanthomonas and Pathogenicity Determination

A total of 21 isolates were obtained from symptomatic leaves of different edamame genotypes. These isolates exhibited characteristics similar to Xanthomonas, including the typical yellow mucoid colonies. All of the isolates were cultured over 2 days at 28 °C and were subsequently assessed for virulence on the vulnerable cultivar ‘UA Kirksey’. The infected plants started to exhibit bacterial pustules a week after inoculation, while the control plants didn’t show any symptoms. Bacterial colonies were subsequently reisolated from the inoculated plants and confirmed to be identical to the original isolates through both morphological and molecular analysis, thus satisfying Koch’s postulates [25].

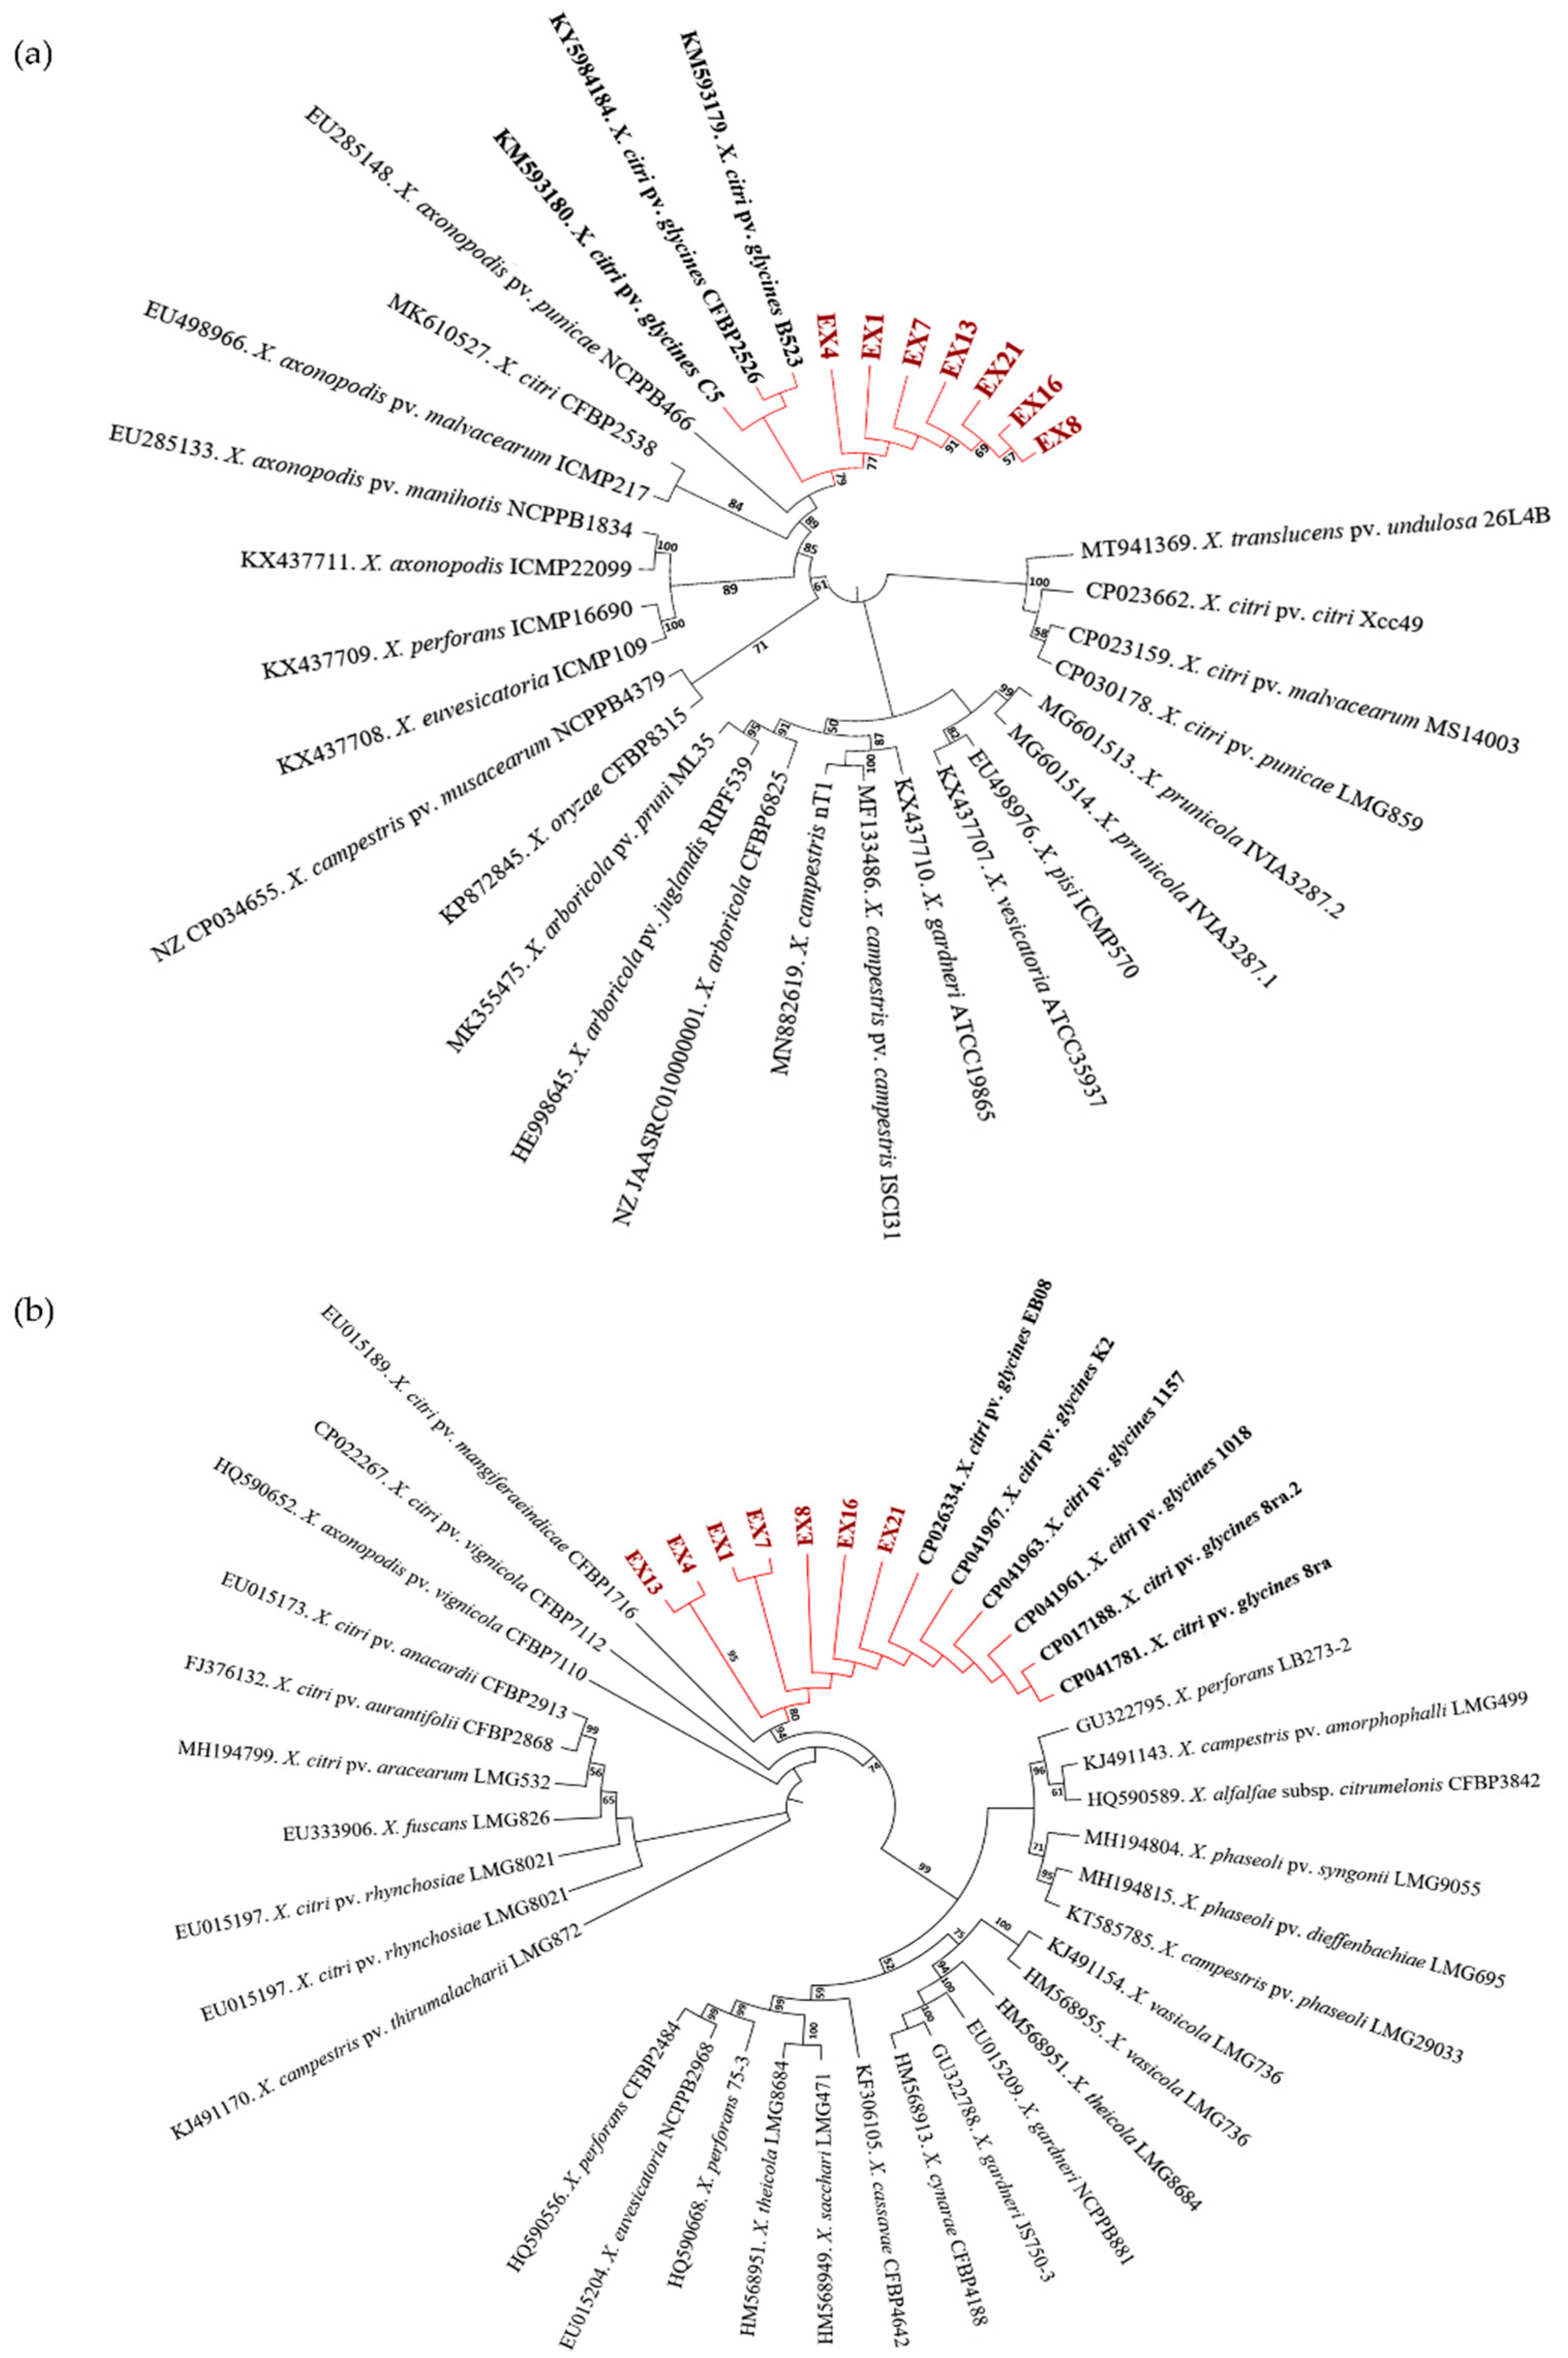
3.2.2. PCR Amplification and Phylogenetic Analysis

The 16S rDNA of these isolates was amplified and yielded 1400–1500 bp long fragments, all of which were identified as Xanthomonas. Given that certain isolates exhibited identical nucleotide sequences, seven strains (i.e., EX1, EX4, EX7, E8, EX13, EX16, and EX21) were selected as representative strains for the subsequent analysis. The phylogenetic analysis of the gyrB gene sequence revealed that all seven strains examined formed a distinct cluster along with the pathotype strain of Xanthomonas citri pv. glycines (Xcg), i.e., CFBP 2526 [26], as well as other published Xcg strains. The Xcg group further clustered together with X. axonopodis pv. malvacearum and X. axonopodis pv. punicae, which have recently been reclassified as pathovars under Xanthomonas citri [27], forming a more extensive group (Figure 3a). Additionally, another phylogenetic analysis based on the atpD gene sequences provided further confirmation of the classification of these newly isolated strains, as all of them consistently clustered together with the previously published Xcg strains (Figure 3b).

3.3. Seedling Resistance Screening to Soilborne Diseases

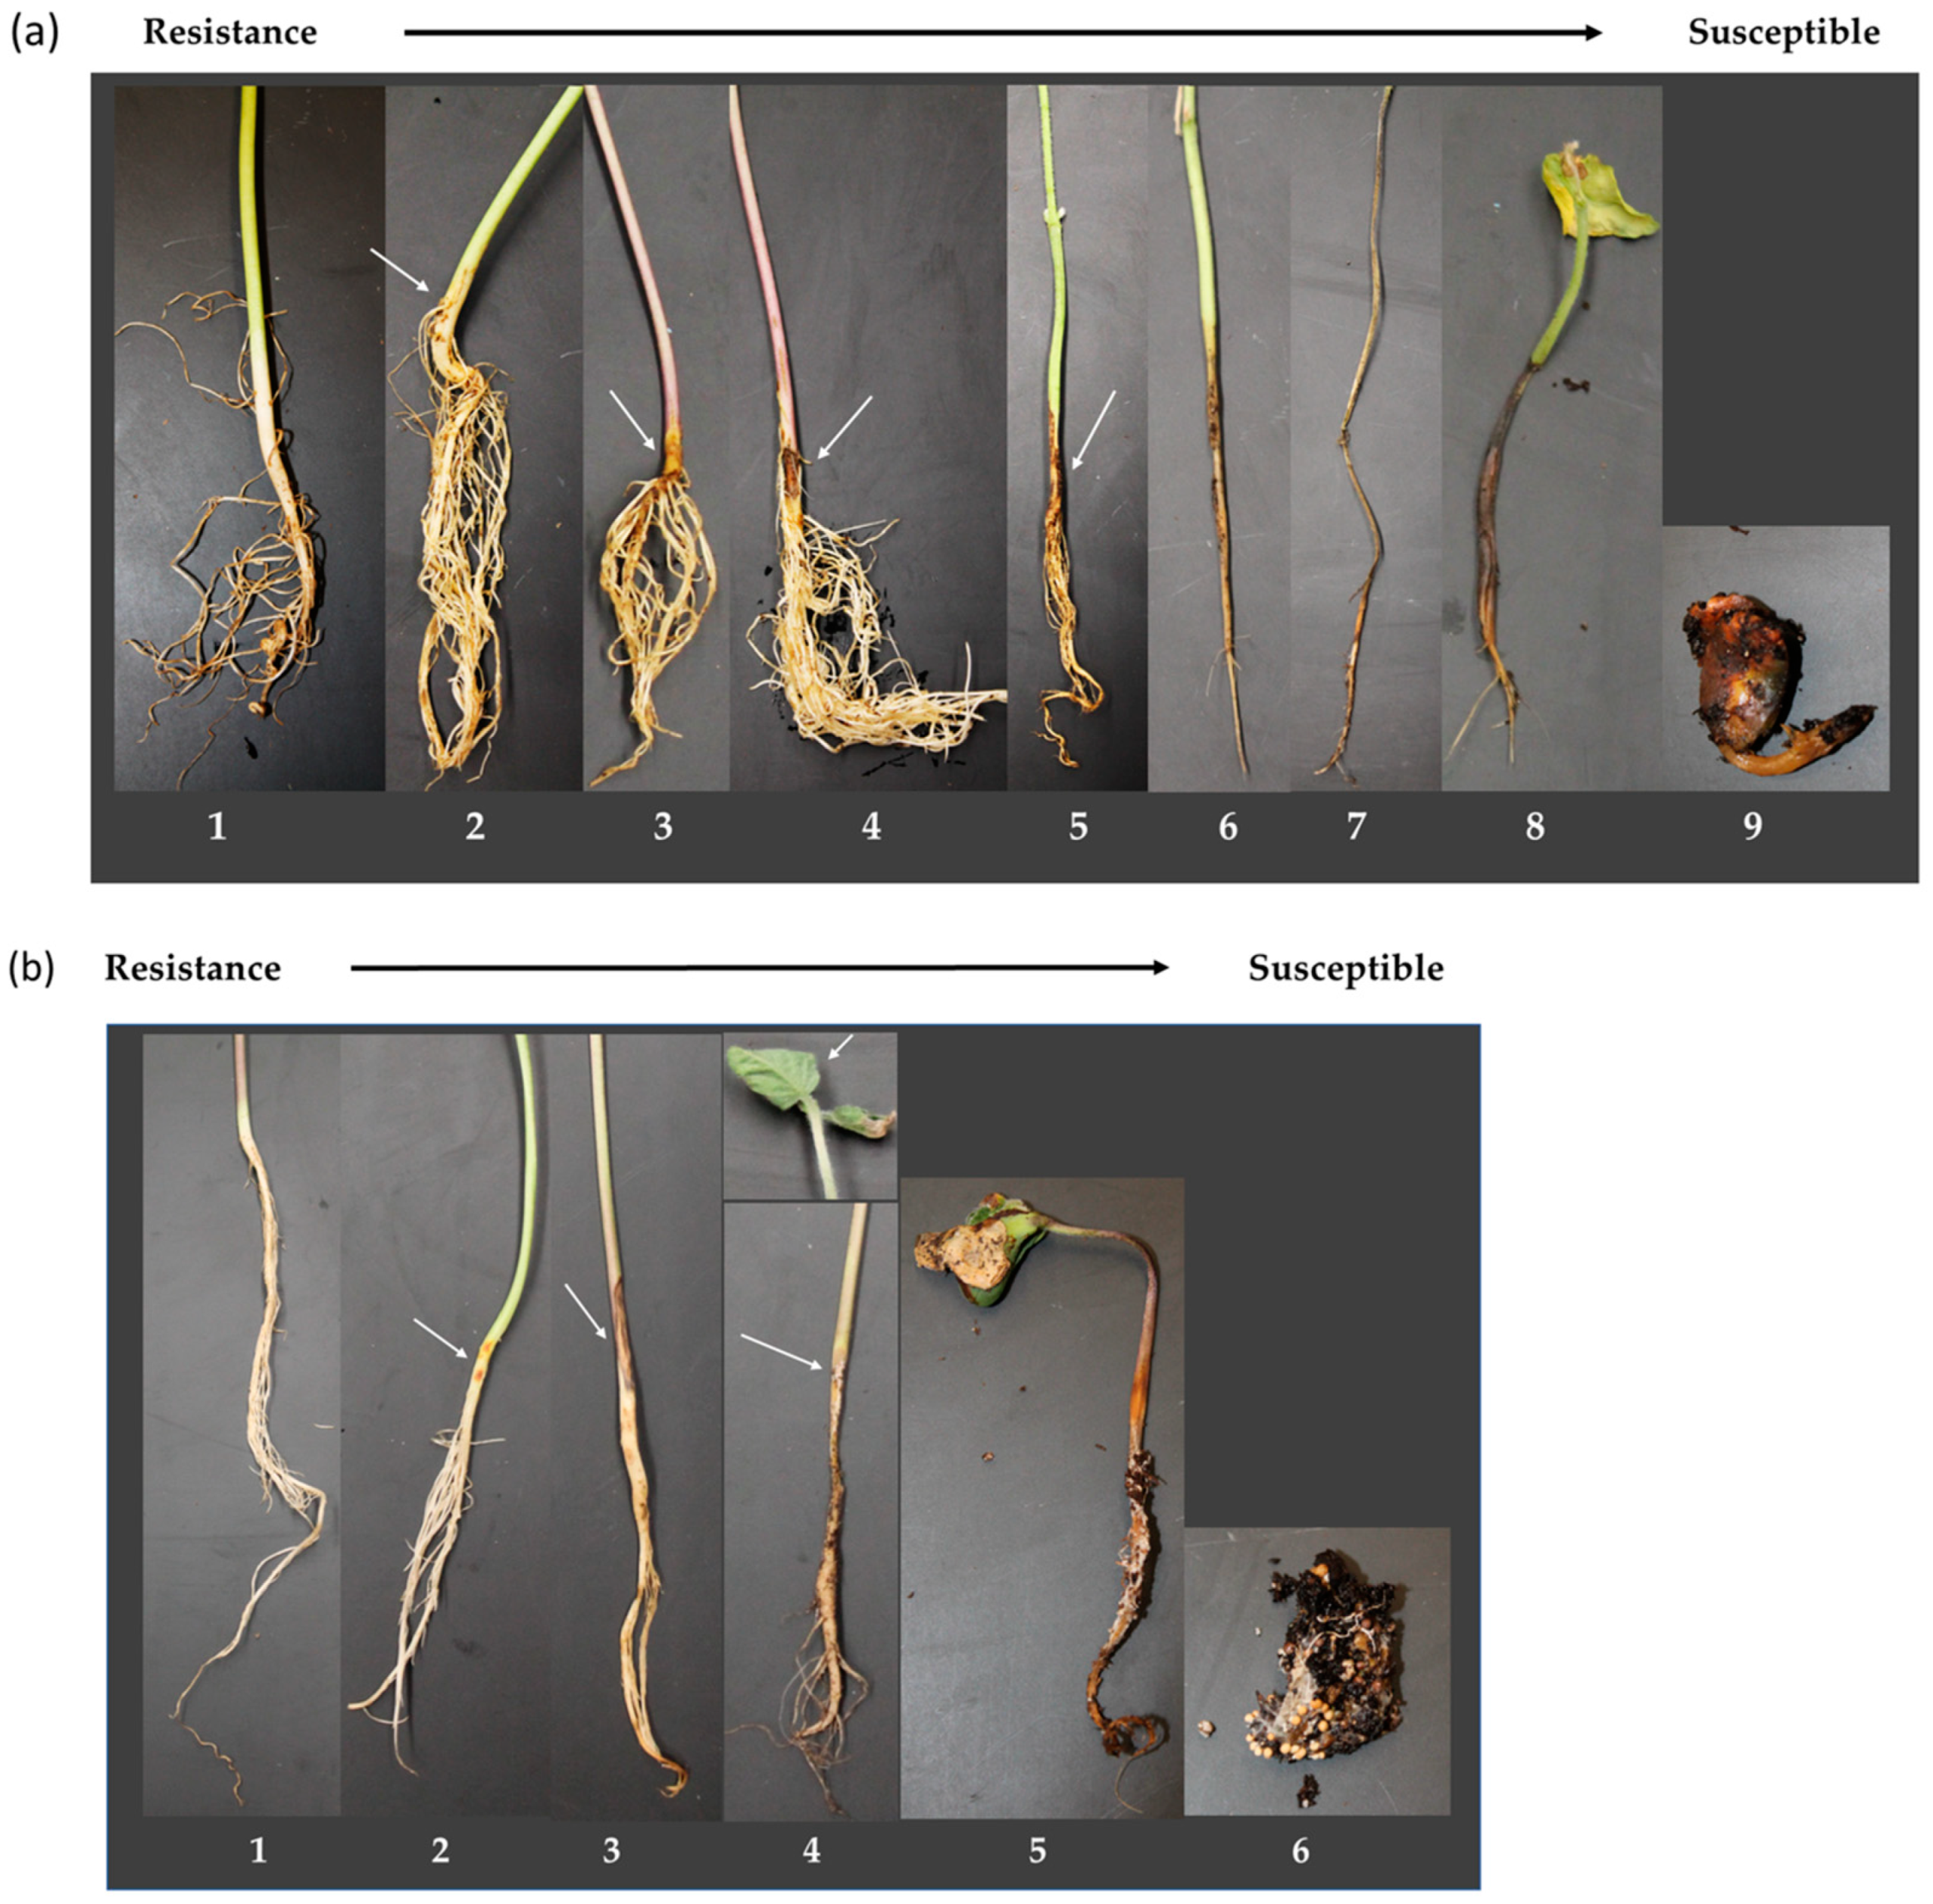
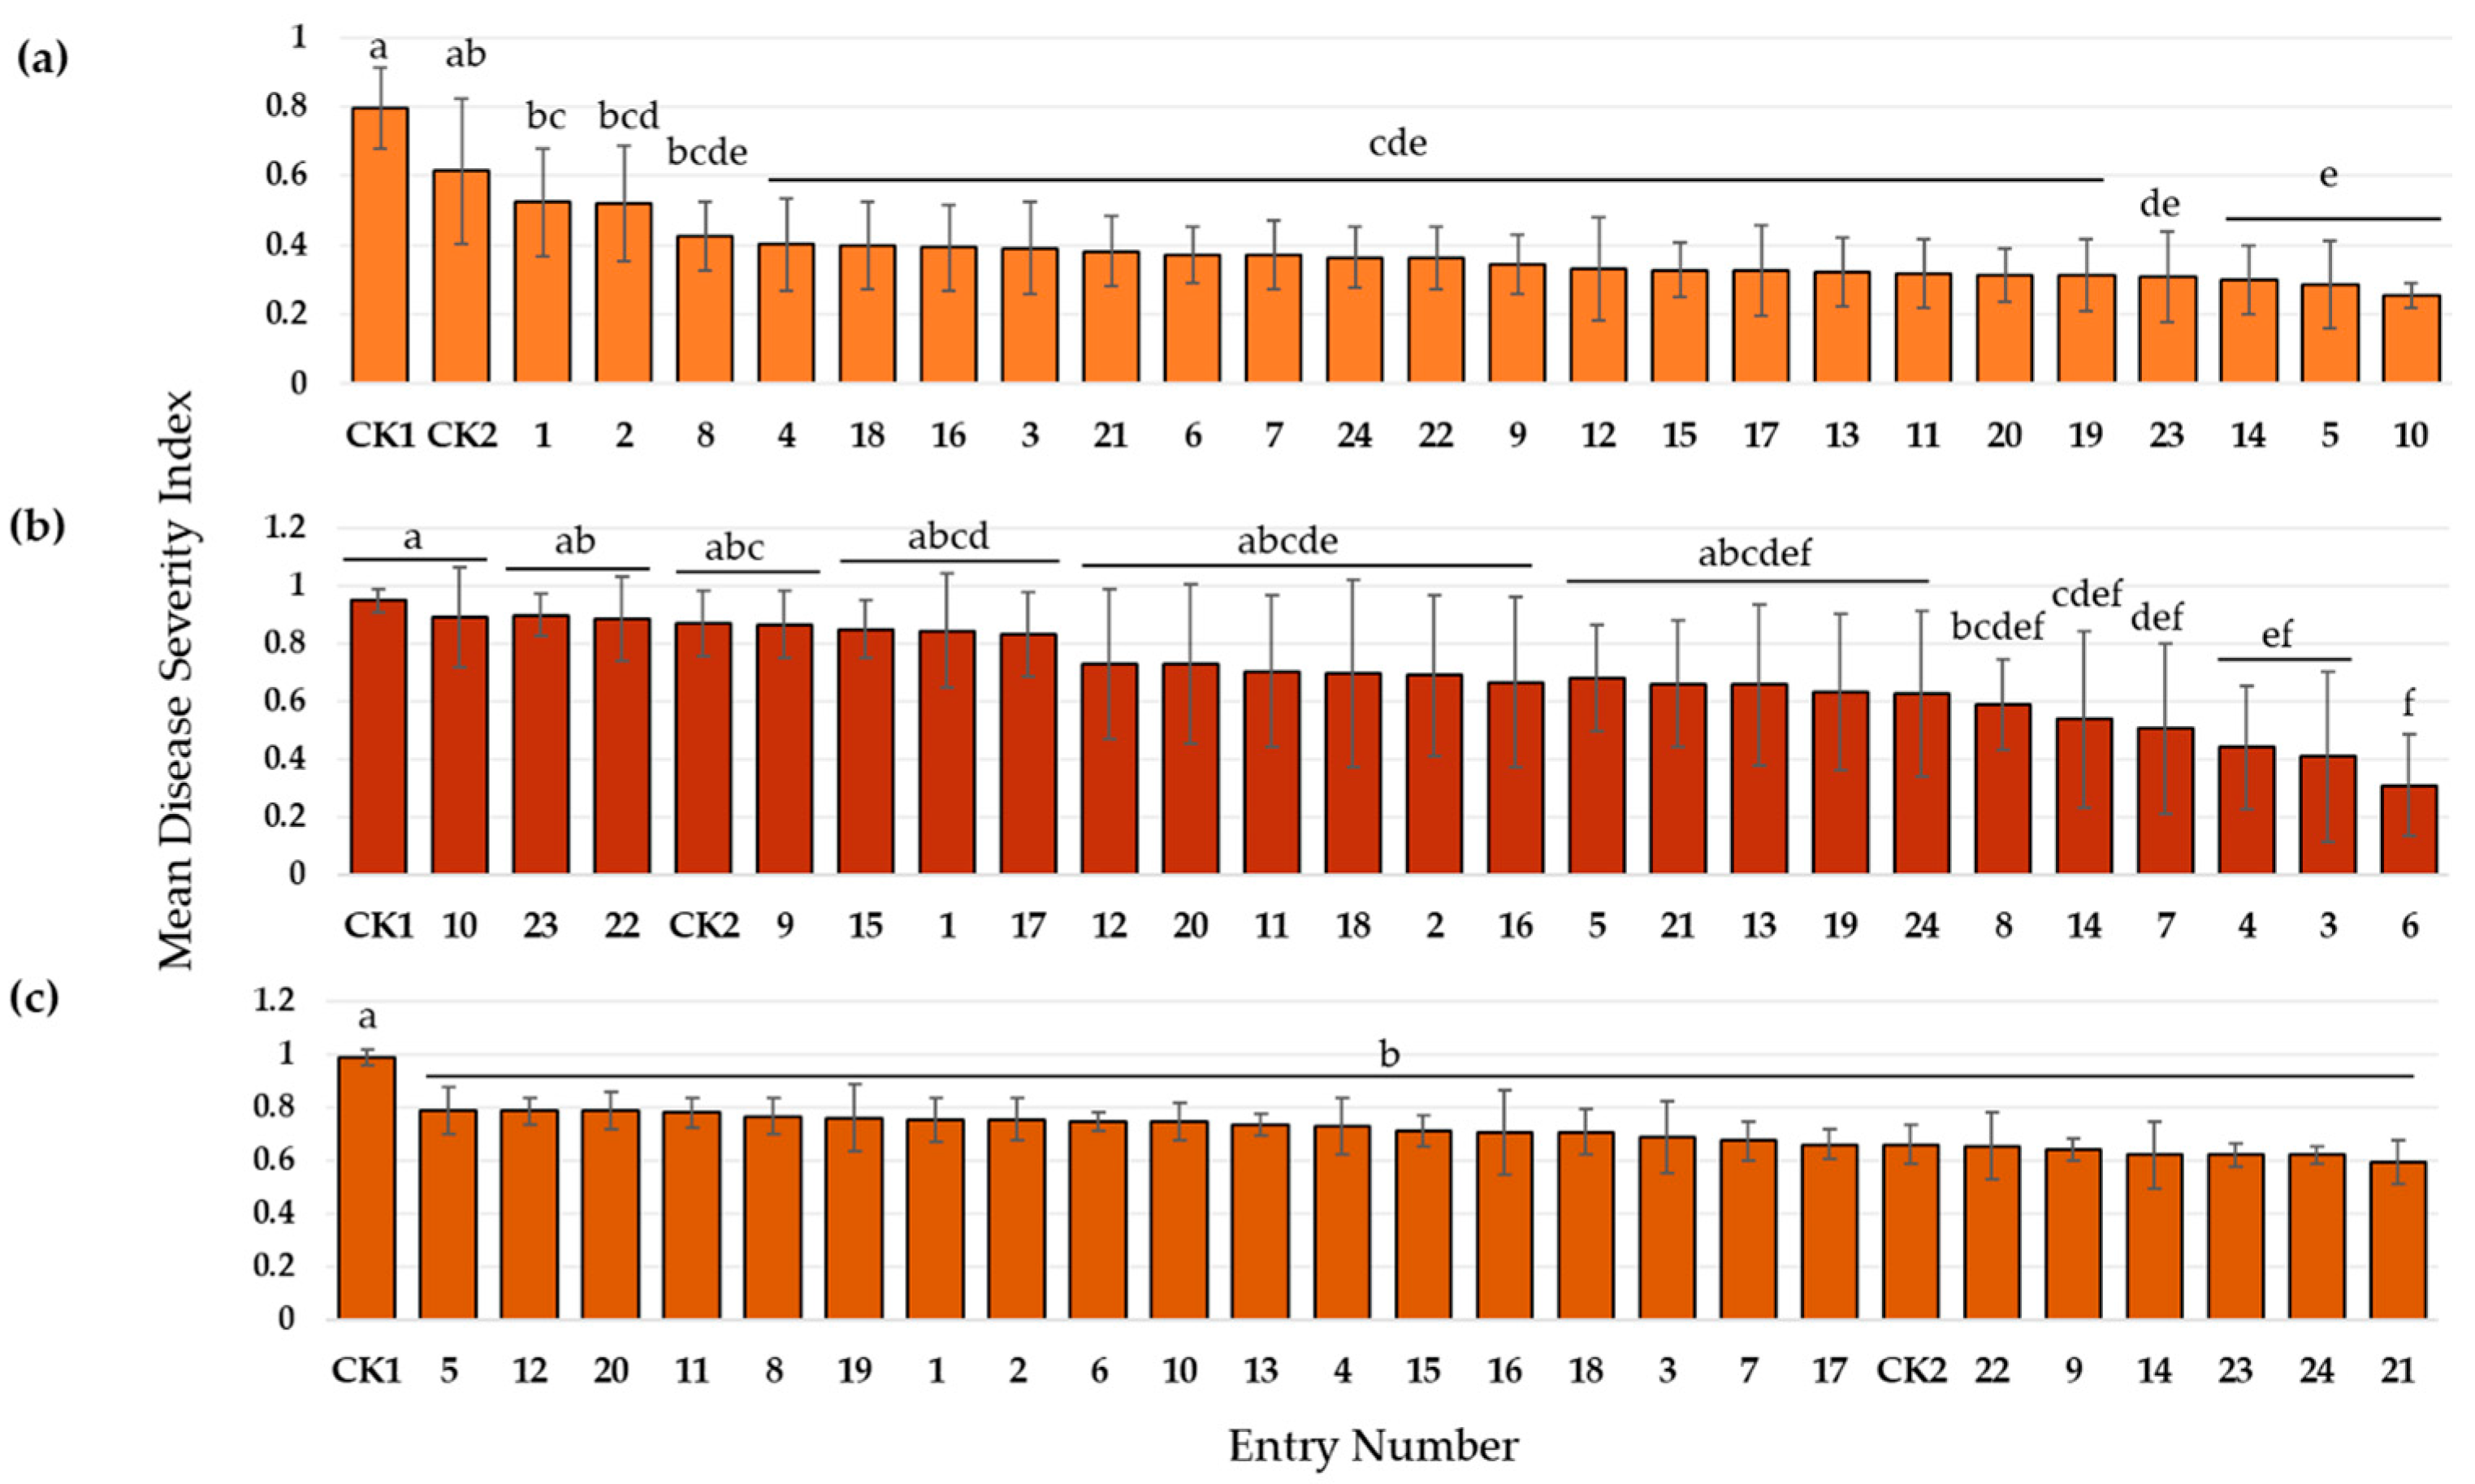
3.3.1. Resistance to Rhizoctonia Root and Stem Rot

In this study, all 24 edamame cultivars and breeding lines, plus two commercial cultivars, Agate and Gardensoy 21, the susceptible and tolerant checks, respectively [3], were screened for disease resistance. After 3 weeks of inoculation, obvious root and stem rot were observed on the susceptible check cultivar, and all plants were removed from trays. Each plant was then assessed and rated on a scale of 1 to 9 based on the symptom severity (refer to Figure 4a).
The disease severity ratings (DSR) for the 24 genotypes spanned a range from 2.29 to 4.71 (Table S3). Among these, R18-9808 exhibited the lowest DSR at 2.29, along with a DSI of 0.25. Following closely, R17-2965 displayed DSR and DSI values of 2.57 and 0.29, respectively, while V16-0523HP had a DSR of 2.70 and a DSI of 0.30 (as shown in Figure 5a). These genotypes exhibited minimal symptoms characterized by sporadic and minor superficial discoloration spots measuring less than 3 mm on their hypocotyls. Nineteen other genotypes, including the commercial cultivar VT sweet (DSR: 2.87; DSI: 0.32), displayed small superficial lesions measuring less than 5 mm on hypocotyls or roots, without detrimental effects on normal plant growth. In contrast, the remaining two genotypes, UA Kirksey (DSR: 4.71; DSI: 0.52) and R15-10280 (DSR: 4.68; DSI: 0.52), exhibited deep lesions surrounding hypocotyls and roots, resulting in delayed root and overall plant growth. Interestingly, both the susceptible check, Agate (DSR: 7.15; DSI: 0.79), and the tolerant check, Gardensoy 21 (DSR: 5.52; DSI: 0.61), demonstrated significantly higher disease severity compared with other edamame genotypes (p < 0.05), with no discernible difference in severity between them. Both exhibited seedling mortality due to extensive root necrosis, particularly evident in Agate, where no discernible secondary roots were present, and the formation of the first trifoliolate leaf was hindered.

3.3.2. Resistance to Southern Blight

The severity of symptoms of all the plants was assessed using a scale of 1 to 6 at 10 days after inoculation (Figure 4b). Twenty-four lines displayed an average disease severity rating that varied between 1.84 and 5.69 (Table S3). These genotypes showed statistically significant differences (Figure 5b). The breeding line R18-9725 displayed the lowest severity, boasting DSR and DSI values of 1.84 and 0.31, respectively. Notably, this differed significantly from both Agate (DSR: 5.69; DSI: 0.95) and Gardensoy 21 (DSR: 5.22; DSI: 0.87) (p < 0.05). Conversely, five genotypes, namely R17-2750, R17-2776, R18-9770, R18-9782, and V16-0523HP3, exhibited an average lesion severity ranging from 2.44 to 3.54, indicating a degree of resistance to S. rolfsii. They were distinctly different from Agate. The remaining genotypes, including VT sweet (DSR: 4.21; DSI: 0.70) and UA Kirksey (DSR: 5.06; DSI: 0.84), showed no significant difference when compared with Agate. Furthermore, no significant difference was observed between Agate and Gardensoy 21 either.

3.3.3. Resistance to Pythium Root Rot

All genotypes exhibited pronounced root rot symptoms at 14 days post-inoculation. The severity of these plants was subsequently quantified using a scale of 1 to 5. Notably, all 24 genotypes displayed high ratings spanning 2.97 to 3.93 (Table S3) and the corresponding DSI values ranged from 0.59 to 0.79 (Figure 5c). However, their severity values were statistically lower than those of Agate (DSR: 4.93; DSI: 0.99) (p < 0.05). No significant differences were observed among the 24 genotypes, and none of them were significantly different from Gardensoy 21 (DSR: 3.30; DSI: 0.66).

3.3.4. Overall Performance of Newly Developed Genotypes against Four Edamame Diseases

All 24 of the newly developed genotypes were susceptible to infections from the four examined diseases, exhibiting discernible symptoms albeit with varied severities. As delineated in Figure 6b, southern blight posed a significant threat, with 75% of the genotypes recording severity ratings between 3.5 and 5.5 on a 1-to-6 scale. This result reveals vulnerability in the genotypes, as evidenced by deep stem lesions, the presence of mycelia or sclerotia, diminished secondary roots, and in severe instances, seedling collapse and death. Similarly, for Pythium root rot, most genotypes (95.8%) exhibited ratings between 3 and 4 on a 1-to-5 scale (Figure 6c), displaying visible root rot symptoms that impacted seedling growth. Interestingly, while these 24 genotypes appeared susceptible to the diseases, a substantial 91.7% of genotypes showed a degree of resistance to Rhizoctonia root and stem rot. Their severity ratings were below 4 on a 1-to-9 scale (Figure 6a), exhibiting only superficial and limited lesions on the hypocotyl and/or roots, with no evident effect on secondary root growth or overall plant stability. In contrast to the prevailing tendencies of genotypes demonstrating severe or light disease symptoms to the three soilborne diseases, the genotypic responses to the seedborne bacterial leaf pustule disease showed clear polarization (Figure 6d). A total of 42% of genotypes displayed minor disease symptoms, with severity ratings under 20%, while a significant 54.2% demonstrated pronounced symptoms, with bacterial pustules covering more than 40% of their total leaf surface area. Finally, there was no significant correlation observed in the severity reactions of the edamame genotypes across the four diseases (p < 0.5).

4. Discussion

Soilborne diseases pose a significant threat to worldwide crop production, resulting in compromised crop health, reduced yields, and increased production costs [6]. The magnitude of this issue is accentuated by the prevailing trends of extended monoculture and intensive agricultural practices. The continual upswing in global temperatures, a direct outcome of climate change, serves to exacerbate the prevalence of soilborne pathogens, intensifying the associated challenges [28]. Concurrently, bacterial leaf pustule is also becoming a central concern in global crop production, particularly in regions with elevated temperatures and humidity, which are favorable for pathogenic proliferation. The growing prevalence and intensity of BLP incidents worldwide can be attributed not merely to climatic warming but also to a surge in storm frequency, highlighting the multifaceted challenges faced by modern agriculture [29].
One effective strategy in mitigating disease impact is leveraging resistant cultivars or varieties. Developing cultivars combining resistance and desired commercial traits through plant breeding, however, is time-consuming. This research focused on 24 newly developed edamame cultivars and breeding lines, all adapted to the local climate and exhibiting commendable sensory traits, to evaluate their resilience against predominant edamame diseases. It is common knowledge that no single plant genotype is entirely resistant to all disease threats [6]. Likewise, none of these 24 genotypes evaluated exhibited immunity against all four diseases in this work. However, four specific genotypes—R17-2750, R18-9725, R18-9770, and V16-0523HP—showed overall better performance in disease resistance, outperforming other genotypes and the standard tolerance check, Gardensoy 21. On the other hand, two genotypes, UA Kirksey and R15-10280 performed relatively poorly, exhibiting susceptibility to all diseases. The other commercial cultivar examined in this study, VT Sweet—recently released in 2022 by Virginia Tech—was found susceptible to three diseases but showed enhanced resistance to Rhizoctonia root and stem rot when compared with UA Kirksey.
Notably, Agate, the susceptible check used in the soilborne disease tests, consistently exhibited the highest severity among the genotypes for all three soilborne diseases. It was closely followed by Gardensoy 21, which also displayed significant disease severity. Gardensoy 21 served as a disease-tolerant check because of its proven ability to maintain a robust seedling stand in a previous field study encompassing a broad range of soilborne diseases [3]. However, as the previous study did not specify the exact pathogens, our results revealed that GardenSoy 21 is not tolerant to either of the diseases studied in this work. This finding expands our understanding of its disease resistance profile. Additionally, the elevated severity observed in this cultivar is partly attributed to the evaluations being conducted in growth chambers with targeted pathogens, high inoculum loads, and an optimal environment for pathogen proliferation. Moreover, our results indicate that the recently developed breeding lines exhibit superior disease resistance compared with commercial cultivars, especially against R. solani and P. irregulare, likely due to the integration of disease resistance in the visual assessment of plant progenies during the breeding process.
This study further examined the dynamics of BLP across diverse edamame genotypes during the entire course of disease progression. Our findings revealed that the onset of bacterial pustule symptoms occurred before bloom and began to increase when plants were in full bloom. Disease severity reached 50% in susceptible genotypes during edamame growth stages R5 (beginning of seed formation) to R6 (full seed), potentially elucidating previous findings associating BLP with decreased seed size and number [30,31]. This correlation is crucial concerning the quality and yield of edamame, given the commercial market’s preference for larger beans and pods containing more than one bean [32,33]. Significantly, ten genotypes identified in this work, including R18-9725, V16-0523HP, V16-0293, and R18-9794 demonstrated considerable resilience by delaying disease progression and manifesting reduced severity (Figure 2; Table 1). Multiyear field trials are necessary to fully capture the complex interactions between disease, genotype, and yield and to explain germplasm performance across different seasons.

5. Conclusions

This study examined the reactions of newly developed edamame cultivars and breeding lines to prevalent diseases affecting edamame production. The findings underscore the significant threat these diseases pose to edamame cultivation and highlight the disease resistance variations among edamame genotypes. Notably, the newly developed breeding lines exhibited higher overall disease resistance compared with commercial cultivars, particularly against Rhizoctonia solani and Pythium irregulare. This information is crucial for efficient disease management. Additionally, the study provided a deeper understanding of the dynamics of BLP disease progression, illustrating the adaptive responses of resilient genotypes at various stages of disease development. Given that this research revealed the vulnerability of commercial cultivars to several diseases and their widespread cultivation in the United States, these findings underscore the critical need for ongoing research and specialized breeding efforts to improve disease resistance in future edamame cultivars.

Supplementary Materials

The following are available online at https://www.mdpi.com/article/10.3390/agronomy14081660/s1, Table S1: General information of primer sequences used and GenBank accession numbers obtained in this study; Table S2: Bacterial pustule disease severity ratings of twenty-four edamame genotypes across five survey dates; Table S3: Mean disease severity rating of twenty-four edamame genotypes to the three soilborne diseases studied.

Author Contributions

Conceptualization, B.Z., G.E.W., S.R. and X.L.; data curation, X.L., R.Z., A.R. and K.L.; formal analysis, X.X. and X.L.; funding acquisition, B.Z., S.R., G.E.W. and X.L.; investigation, X.L. and K.L.; methodology, X.L., R.Z., M.D.S. and A.R.; project administration, B.Z., G.E.W. and S.R.; resources, S.R.; supervision, B.Z., G.E.W. and S.R.; writing, X.L. All authors have read and agreed to the published version of the manuscript.

Funding

This research was supported by USDA-NIFA (Grant No. 2018-51181-28384; Accession No. 1016465) and awards of USDA-SCBGP 419441.

Data Availability Statement

The original contributions presented in this study are included in the article/Supplementary Material. Further inquiries can be directed to the corresponding authors.

Acknowledgments

The authors wish to acknowledge the Graduate Students Kemper Sutton and Carlos Saint-Preux for helping to collect the field data, as well as Anna Flowers and Lina Lee for helping to revise the code for statistical analysis used in this work. We also acknowledge Vander Rocha Lacerda who helped to revise the manuscript format.

Conflicts of Interest

The funders had no role in the design of the study; in the collection, analyses, or interpretation of data; in the writing of the manuscript; or in the decision to publish the results.

References

  1. Zeipiņa, S.; Alsiņa, I.; Lepse, L. Insight in Edamame Yield and Quality Parameters: A Review. Res. Rural. Dev. 2017, 2, 40–45. [Google Scholar]
  2. Kaiser, C.; Ernst, M. Edamame. University of Kentucky, College of Agriculture, Food and Enviroment, Cooperative Extension Service. 2020. CCD-CP-94. Available online: https://www.uky.edu/ccd/sites/www.uky.edu.ccd/files/edamame.pdf (accessed on 25 July 2024).
  3. Williams, M.M.; Bradley, C.A. Fludioxonil + Mefenoxam Seed Treatment Improves Edamame Seedling Emergence. Horttechnology 2017, 27, 846–851. [Google Scholar] [CrossRef]
  4. Allen, T.W.; Bradley, C.A.; Sisson, A.J.; Byamukama, E.; Chilvers, M.I.; Coker, C.M.; Collins, A.A.; Damicone, J.P.; Dorrance, A.E.; Dufault, N.S.; et al. Soybean Yield Loss Estimates Due to Diseases in the United States and Ontario, Canada, from 2010 to 2014. Plant Health Prog. 2017, 18, 19–27. [Google Scholar] [CrossRef]
  5. Reiter, M.; Samtani, J.; Quezada, E.Q.; Singh, V.; Doughty, H.; Kuhar, T. 2022–2023 Mid-Atlantic Commercial Vegetable Production Recommendations. Available online: https://www.pubs.ext.vt.edu/456/456-420/456-420.html (accessed on 19 December 2022).
  6. Panth, M.; Hassler, S.C.; Baysal-Gurel, F. Methods for Management of Soilborne Diseases in Crop Production. Agriculture 2020, 10, 16. [Google Scholar] [CrossRef]
  7. Campo, R.J.; Araujo, R.S.; Hungria, M. Nitrogen Fixation with the Soybean Crop in Brazil: Compatibility between Seed Treatment with Fungicides and Bradyrhizobial Inoculants. Symbiosis 2009, 48, 154–163. [Google Scholar] [CrossRef]
  8. Zilli, J.É.; Ribeiro, K.G.; Campo, R.J.; Hungria, M. Influence of Fungicide Seed Treatment on Soybean Nodulation and Grain Yield. Rev. Bras. Ciência Solo 2009, 33, 917–923. [Google Scholar] [CrossRef]
  9. Lin, F.; Li, W.; McCoy, A.G.; Wang, K.; Jacobs, J.; Zhang, N.; Huo, X.; Wani, S.H.; Gu, C.; Chilvers, M.I.; et al. Identification and Characterization of Pleiotropic and Epistatic QDRL Conferring Partial Resistance to Pythium Irregulare and P. Sylvaticum in Soybean. Theor. Appl. Genet. 2022, 135, 3571–3582. [Google Scholar] [CrossRef] [PubMed]
  10. Kang, I.-J.; Kim, K.S.; Beattie, G.A.; Chung, H.; Heu, S.; Hwang, I. Characterization of Xanthomonas citri Pv. Glycines Population Genetics and Virulence in a National Survey of Bacterial Pustule Disease in Korea. Plant Pathol. J. 2021, 37, 652–661. [Google Scholar] [CrossRef] [PubMed]
  11. Chen, P.; Scaboo, A.M.; Dombek, D.G.; Rupe, J.C.; Robbins, R.T.; Chen, P. Soybean Cultivar UA Kirksey. U.S. Patent US8,766,051, 23 January 2014. [Google Scholar]
  12. Zhang, B.; Lord, N.; Kuhar, T.; Duncan, S.; Huang, H.; Ross, J.; Rideout, S.; Arancibia, R.; Reiter, M.; Li, S.; et al. ‘VT Sweet’: A Vegetable Soybean Cultivar for Commercial Edamame Production in the Mid-Atlantic USA. J. Plant Regist. 2022, 16, 29–33. [Google Scholar] [CrossRef]
  13. Capobiango da Fonseca, P.; Maria Barbosa, R.; de Oliveira Ferreira, D.; Badel, J.L.; Schuster, I.; Vieira, R.F.; Lopes da Silva, F. Genome-wide Association Study Reveals Molecular Markers and Genes Potentially Associated with Soybean (Glycine max) Resistance to Xanthomonas citri Pv. Glycines. Plant Breed. 2022, 141, 37–48. [Google Scholar] [CrossRef]
  14. Galkiewicz, J.P.; Kellogg, C.A. Cross-Kingdom Amplification Using Bacteria -Specific Primers: Complications for Studies of Coral Microbial Ecology. Appl. Environ. Microbiol. 2008, 74, 7828–7831. [Google Scholar] [CrossRef] [PubMed]
  15. Mondal, K.K.; Verma, G.; Mani, C. Phylogenetic Relatedness of Xanthomonas Axonopodis Pv. Punicae, the Causal Agent of Bacterial Blight of Pomegranate Based on Two Loci, 16S RRNA and GyrB. Ann. Microbiol. 2013, 63, 801–804. [Google Scholar] [CrossRef]
  16. Martins, L.; Fernandes, C.; Blom, J.; Dia, N.C.; Pothier, J.F.; Tavares, F. Xanthomonas Euroxanthea Sp. Nov., a New Xanthomonad Species Including Pathogenic and Non-Pathogenic Strains of Walnut. Int. J. Syst. Evol. Microbiol. 2020, 70, 6024–6031. [Google Scholar] [CrossRef] [PubMed]
  17. Gagnevin, L.; Leach, J.E.; Pruvost, O. Genomic Variability of the Xanthomonas Pathovar Mangiferaeindicae, Agent of Mango Bacterial Black Spot. Appl. Environ. Microbiol. 1997, 63, 246–253. [Google Scholar] [CrossRef] [PubMed]
  18. El-Esawi, M.A.; Alaraidh, I.A.; Alsahli, A.A.; Alamri, S.A.; Ali, H.M.; Alayafi, A.A. Bacillus Firmus (SW5) Augments Salt Tolerance in Soybean (Glycine max L.) by Modulating Root System Architecture, Antioxidant Defense Systems and Stress-Responsive Genes Expression. Plant Physiol. Biochem. 2018, 132, 375–384. [Google Scholar] [CrossRef] [PubMed]
  19. Bradley, C.A.; Hartman, G.L.; Nelson, R.L.; Mueller, D.S.; Pederson, W.L. Response of Ancestral Soybean Lines and Commercial Cultivars to Rhizoctonia Root and Hypocotyl Rot. Plant Dis. 2001, 85, 1091–1095. [Google Scholar] [CrossRef] [PubMed]
  20. Peña, P.A.; Steadman, J.R.; Eskridge, K.M.; Urrea, C.A. Identification of Sources of Resistance to Damping-off and Early Root/Hypocotyl Damage from Rhizoctonia Solani in Common Bean (Phaseolus vulgaris L.). Crop. Prot. 2013, 54, 92–99. [Google Scholar] [CrossRef]
  21. Singh, B.; Technol, R.U.-J.A. Undefined Management of Southern Stem Blight of Soybean by PCNB-Resistant Mutants of Trichoderma Harzianum 4572 Incited by Sclerotium Rolfsii. Ijat-Aatsea. Com. 2009, 5, 85–98. [Google Scholar]
  22. Paparu, P.; Acur, A.; Kato, F.; Acam, C.; Nakibuule, J.; Nkuboye, A.; Musoke, S.; Mukankusi, C. Morphological and Pathogenic Characterization of Sclerotium Rolfsii, the Causal Agent of Southern Blight Disease on Common Bean in Uganda. Plant Dis. 2020, 104, 2130–2137. [Google Scholar] [CrossRef]
  23. Klepadlo, M.; Balk, C.S.; Vuong, T.D.; Dorrance, A.E.; Nguyen, H.T. Molecular Characterization of Genomic Regions for Resistance to Pythium Ultimum Var. Ultimum in the Soybean Cultivar Magellan. Theor. Appl. Genet. 2019, 132, 405–417. [Google Scholar] [CrossRef]
  24. Chiang, K.S.; Liu, H.I.; Bock, C.H. A Discussion on Disease Severity Index Values. Part I: Warning on Inherent Errors and Suggestions to Maximise Accuracy. Ann. Appl. Biol. 2017, 171, 139–154. [Google Scholar] [CrossRef]
  25. Segre, J.A. What Does It Take to Satisfy Koch’s Postulates Two Centuries Later?: Microbial Genomics and Propionibacteria Acnes. J. Investig. Dermatol. 2013, 133, 2141–2142. [Google Scholar] [CrossRef] [PubMed]
  26. Darrasse, A.; Bolot, S.; Serres-Giardi, L.; Charbit, E.; Boureau, T.; Fisher-Le Saux, M.; Briand, M.; Arlat, M.; Gagnevin, L.; Koebnik, R.; et al. High-Quality Draft Genome Sequences of Xanthomonas axonopodis pv. glycines Strains CFBP 2526 and CFBP 7119. Genome Announc. 2013, 1, 6. [Google Scholar] [CrossRef] [PubMed]
  27. Schoch, C.L.; Ciufo, S.; Domrachev, M.; Hotton, C.L.; Kannan, S.; Khovanskaya, R.; Leipe, D.; Mcveigh, R.; O’Neill, K.; Robbertse, B.; et al. NCBI Taxonomy: A Comprehensive Update on Curation, Resources and Tools. Database 2020, 2020, baaa062. [Google Scholar] [CrossRef]
  28. Delgado-Baquerizo, M.; Guerra, C.A.; Cano-Díaz, C.; Egidi, E.; Wang, J.-T.; Eisenhauer, N.; Singh, B.K.; Maestre, F.T. The Proportion of Soil-Borne Pathogens Increases with Warming at the Global Scale. Nat. Clim. Chang. 2020, 10, 550–554. [Google Scholar] [CrossRef]
  29. Zhao, F.; Cheng, W.; Wang, Y.; Gao, X.; Huang, D.; Kong, J.; Antwi-Boasiako, A.; Zheng, L.; Yan, W.; Chang, F.; et al. Identification of Novel Genomic Regions for Bacterial Leaf Pustule (BLP) Resistance in Soybean (Glycine max L.) via Integrating Linkage Mapping and Association Analysis. Int. J. Mol. Sci. 2022, 23, 2113. [Google Scholar] [CrossRef]
  30. Weber, C.R.; Dunleavy, J.M.; Fehr, W.R. Effect of Bacterial Pustule on Closely Related Soybean Lines 1. Agron. J. 1966, 58, 544–545. [Google Scholar] [CrossRef]
  31. Prathuangwong, S.; Amnuaykit, K. Studies on Tolerance and Rate-Reducing Bacterial Pustule of Soybean Cultivars/Lines. Agric. Nat. Resour. 1987, 21, 408–426. [Google Scholar]
  32. Duppong, L.M.; Hatterman-Valenti, H. Yield and Quality of Vegetable Soybean Cultivars for Production in North Dakota. Horttechnology 2005, 15, 896–900. [Google Scholar] [CrossRef]
  33. Li, X.; Welbaum, G.E.; Rideout, S.L.; Singer, W.; Zhang, B. Vegetable Soybean and Its Seedling Emergence in the United States. In Legumes Research; IntechOpen: London, UK, 2022; Volume 1. [Google Scholar]
Figure 1. Bacterial pustule incidence and disease severity rate of the twenty-four edamame genotypes in the field. The data used here were those of the last survey conducted on 8 September 2021 (close to the pod harvest stage). The y-axis shows the mean disease severity rate calculated by those of four replications, and the severity rate was estimated as the percentage of the total leaf surface area that was covered with bacterial pustule symptoms. The x-axis shows the entry numbers responding to the genotype names listed in Table 1. The identical letters above the columns shared by different genotypes indicate no significant difference, as determined by Tukey’s HSD (p < 0.05).
Agronomy 14 01660 g001
Figure 2. Disease severity rates of different reaction groups were recorded on five dates: 23 July, 30 July, 15 August, 30 August, and 8 September (a). The genotypes assigned to Groups 1, 2, and 3 are listed in Table 1. The median values were indicated by the horizontal lines at the center of each box. Quartiles are represented by the box bounds, while the upper and lower bars show the maximum and minimum values, respectively. Numbers above the box denoted the means ± standard deviation, calculated from the values of each genotype within a class. Means followed by the same letters are not significantly different according to Tukey’s HSD (p < 0.05) within the data collected on the same date. The progression of disease development was monitored based on the severity rates of each class from 23 July to 8 September (b). Each data point represented the average severity rate value of each genotype within a reaction class. The shading of the regression line corresponded to the 95% confidence interval. Both images were made using ggplot (version 3.5.1) in R.
Agronomy 14 01660 g002
Figure 3. Neighbor-joining tree constructed using gyrB (a) and atpD (b) gene sequence analysis of Xanthomonas strains sourced from Whitethorne, Virginia. The values at the nodes indicated the percentage bootstrap scores (1000 replicates). Bootstrap values >50 from 1000 iterations are shown on the branches. The strains highlighted in red are the ones isolated in this study.
Agronomy 14 01660 g003
Figure 4. Screening scale from 1 to 9 used to evaluate the Rhizoctonia damping-off symptom of edamame (a). 1. No visible symptoms. Normal plant development. 2. 10% root infection. Small (<3 mm) superficial root lesions. Normal plant development. 3. 10–20% infection. Small (3–5 mm). superficial lesions surrounding hypocotyls or roots. Normal plant development. 4. 20–35% infection. Small (3–5 mm) deep lesions surrounding hypocotyls or roots. Normal plant development. 5. 35–50% infection. Deep (3–5 mm) lesions surrounding hypocotyls or roots. Secondary roots and plant development reduced. 6. 50–65% infection. Deep (5–10 mm) lesions surrounding hypocotyls or roots. Few secondary roots visible. Plant development highly reduced. 7. 65–80% infection. Deep (10 mm) lesions surrounding hypocotyls or roots. Few or no secondary roots visible. Elongation of hypocotyl, and no formation of first trifoliolate leaf. 8. 80–95% infection. Emergence followed by loss of cotyledon and absence of secondary roots. 9. 95–100% infection. Seed dead. No emergence (Based on Peña [20]). Southern blight disease severity scale from 1 to 6 (b). 1. No symptoms, the plant was healthy. 2. Yellow superficial lesions (<3 mm) present on the stem above the soil, but no visible fungal outgrowth; 3. Deep (3–5 mm) lesions surrounding hypocotyls or roots, secondary roots reduced, no visible fungal outgrowth. 4. Deep lesions (>5 mm) girdling the stem and visible fungal outgrowth on the stem base, characterized by silky-white mycelia or sclerotia, younger leaves begin to wilt, and stems begin to shrivel. 5. Seedling damped-off, desiccation, and browning of leaves and stem; plant collapse and death (rot). 6. Preemergence damping-off; complete seed rot, with no sign of germination, or evidence of germination hampered by fungal colonization (modified from Paparu et al. [22]. All the pictures were made in this work.
Agronomy 14 01660 g004
Figure 5. Mean disease severity index of Rhizoctonia root and stem rot (a), southern blight (b), and Pythium root rot (c) observed on the 24 edamame genotypes. The y-axis indicated the mean disease severity index (DSI). DSI = ∑(class frequency × score of rating class)/(total number of observations × maximal disease index). The bar on the box indicated the standard deviation from the replicates. The same letters are not significantly different according to Tukey’s HSD (p < 0.05). Entry numbers corresponded to the genotype name in Table 1. No symptoms were observed on the water-inoculated plants.
Agronomy 14 01660 g005
Figure 6. Frequency distribution of the mean severity ratings of 24 edamame genotypes in the screenings of Rhizoctonia root and stem rot (a), southern blight (b), Pythium root rot (c), and bacterial leaf pustule (d). The x-axis shows the mean disease severity rating (DSR). The DSR for the three soilborne diseases was determined using the equation: DSR = ∑(class frequency × score of rating class)/total number of observations. Plants were rated on a 1-to-9 scale for Rhizoctonia root and stem rot, a 1-to-6 scale for southern blight, and a 1-to-5 scale for Pythium root rot. Regarding the bacterial leaf pustule, DSR was estimated as the percentage of the total leaf surface area that was covered with bacterial pustule symptoms. The y-axis represents the number of genotypes falling within the specified DSR range. CK1 (Agate) was used as the susceptible check and CK2 (Gardensoy 21) as the tolerant check for broad soilborne diseases, according to the study by Williams and Bradley (2017) [3].
Agronomy 14 01660 g006
Disclaimer/Publisher’s Note: The statements, opinions and data contained in all publications are solely those of the individual author(s) and contributor(s) and not of MDPI and/or the editor(s). MDPI and/or the editor(s) disclaim responsibility for any injury to people or property resulting from any ideas, methods, instructions or products referred to in the content.

