Article

New Insights into Structure and Function Predictions of TIFY Genes in Barley: A Genome-Wide Comprehensive Analysis

by
Jianjian Li
1,2,*,
Xiwen Xu
3,
Haoran Wang
1,2 and
Yuan Zhang
1,2
1
The National Forestry and Grassland Administration Engineering Research Center for Germplasm Innovation and Utilization of Warm-Season Turfgrasses, Institute of Botany, Jiangsu Province and Chinese Academy of Sciences, Nanjing Botanical Garden Mem. Sun Yat-sen, Nanjing 210014, China
2
Jiangsu Key Laboratory for the Research and Utilization of Plant Resources, Institute of Botany, Jiangsu Province and Chinese Academy of Sciences, Nanjing Botanical Garden Mem. Sun Yat-sen, Nanjing 210014, China
3
The Prataculture Research Center, Nanjing University of Chinese Medicine, Nanjing 210023, China
*
Author to whom correspondence should be addressed.
Agronomy 2024, 14(8), 1663; https://doi.org/10.3390/agronomy14081663 (registering DOI)
Submission received: 27 May 2024 / Revised: 21 July 2024 / Accepted: 24 July 2024 / Published: 29 July 2024
(This article belongs to the Section Crop Breeding and Genetics)

Abstract

:
Barley (Hordeum vulgare L.) is the fourth-largest cereal crop widely grown for livestock feed, brewing malts and human food. The TIFY family is a plant-specific protein family with diverse functions in plant growth, development and stress responses. However, a genome-wide comprehensive analysis of the TIFY gene family has not yet been characterized in Hordeum vulgare. In the present study, 21 and 22 TIFY family members were identified in the genomes of Hv_Morex and Hv_Barke, respectively. The HvTIFY proteins could be divided into the TIFY, ZIM/ZML and JAZ groups, and the JAZ group could be further clustered into six subgroups. HvTIFY genes were conserved in the two genotypes, and all of the duplicated gene pairs in the barley TIFY family were dominated by intense purifying selection. Tandem duplication was the main driving force for the expansion of the HvTIFY gene family. In silico gene expression profiling revealed most members of the Hv_Morex JAZ group were predominantly expressed in reproductive organs and root tissues and were also more involved in the responses to cold treatment and spot blotch infection than other groups. Quite a few JAZ genes (Hv_MoJAZ1, Hv_MoJAZ4, Hv_MoJAZ6, Hv_MoJAZ9, Hv_MoJAZ11, Hv_MoJAZ12 and Hv_MoJAZ14) were found to be tightly associated with the growth of barley and the responses to cold and spot blotch infection stresses. The genome-wide comprehensive analysis of the structure and function of the HvTIFY genes will contribute further to our understanding of the functions of these genes in response to abiotic and biotic stresses in Hordeum vulgare.

1. Introduction

The TIFY gene family is plant-specific gene family coding for transcription factors (TFs) involved in the regulation of plant growth and development and a variety of stress responses. All TIFY factors feature a conserved TIFY motif (TIF[Y/F]XG) that is composed of approximately 36 conserved amino acids (AA) [1,2]. AT4G24470, the first characterized TIFY gene, was reported to be involved in inflorescence and flower development [1,3]. It was previously annotated as ZIM for its structure of a C2C2-GATA zinc-finger structure and later renamed as the TIFY family gene to avoid confusion with the ZIM nomenclature [1,4]. In general, TIFY genes can be classified into the four different subfamilies of JAZ (jasmonate ZIM-domain), ZIM/ZML (Zinc-finger Inflorescence Meristem: ZIM and ZIM-like), TIFY and PPD (PEAPOD) in dicots and the three distinct subfamilies of JAZ, ZIM/ZML and TIFY in monocots. For these subfamilies, the TIFY subfamily contains only a TIFY domain, while the others have at least one other structural domain besides the TIFY domain, with the JAZ subfamily containing a JA-associated (Jas, CCT2) domain for the inhibition of the jasmonate acid (JA) signaling pathway by interaction with the MYC2 proteins [5]; the ZIM/ZML subfamily holding a CCT (CONSTANS, CO-like and TOC1) domain and a GATA zinc-finger domain; and the PPD subfamily involving a PPD domain and a partial Jas domain that lack the conserved PY (Proline -Tyrosine) at their C-terminus region [6,7,8,9].
To date, quite a few TIFY genes have been identified to be involved in many biological processes of plant growth and development, as well as phytohormone responses. In addition to participating in the development of inflorescence and flowering, AtTIFY1 (ZIM) could promote the extension of petioles and hypocotyls by regulating cell elongation [3,5]. AtTIFY4a (PPD1) and its closest homolog AtTIFY4b (PPD2) participated in the synchronized growth process of leaves and could promote leaf growth by adjusting the lamina size and curvature [10,11], and the homolog AtTIFY4b (PPD2) could also regulate leaf flatness and lateral organ development [11,12]. OsTIFY3/OsJAZ1 was found to be involved in the development of spikelets through interaction with OsCOI1b and OsMYC2 during the rice reproductive stage [13]. OsTIFY11b/OsJAZ10 was related to increased grain-size through enhancing the accumulation and translocation of carbohydrates in the stems and leaf sheaths [14]. SlJAZ2 was involved in regulating vegetative growth and early flowering in tomatoes. Furthermore, several studies reported that the overexpression of truncated JAZ proteins, including AtTIFY6b/JAZ3 and AtTIFY9/JAZ10, could result in the occurrence of a jasmonate-insensitive phenotype [15,16,17,18].
Apart from their critical roles in plant development and phytohormone responses, the TIFY family genes also respond to various stresses through the regulation of defense responses in plants. On the one hand, many studies have shown that the TIFY genes are broadly involved in the response to abiotic stresses such as drought, low temperature, salt, alkaline conditions, etc. AtJAZ7-overexpressing plants exhibited a significant drought tolerance phenotype [19], and the overexpression of OsTIFY11a conferred enhanced tolerance to dehydration and salt stress in rice [20]. OsJAZ1 could also regulate drought tolerance through interaction with Osb-HLH148 in a jasmonate signaling pathway [21]. Overexpressed JAZ1 or JAZ4 caused negative responses to freezing stress in Arabidopsis thaliana [22]. GhJAZ2-overpressing cotton plants showed increased sensitivity to salt stress [23]. AtTIFY10a and AtTIFY10b, GsTIFY10a and OsJAZ8 were found to be involved in the response to alkaline and salt stresses, respectively [24,25]. On the other hand, TIFY genes also play crucial roles in regulating plants’ responses to biotic stresses. JAZ genes in Arabidopsis were reported to be involved in modulating the response to wounding and herbivory [26]. The overexpression of TaJAZ1 increased powdery mildew resistance in transgenic bread wheat by a reactive oxygen species-regulating strategy [27]. In addition, Arabidopsis AtJAZ10 and rice OsJAZ8 were reported to participate in responses to Pseudomonas syringae DC3000 and bacterial blight resistance, respectively [28,29]. Given the multiple roles of TIFY family genes in regulating plant growth and development, as well as stress responses, it is necessary to conduct a genome-wide survey of the TIFY family genes in crop plants.
Barley (Hordeum vulgare L.) is the fourth-largest cereal crop grown worldwide after maize, rice and wheat and is mainly used for livestock feed, brewing malts and human food. Barley is adaptable to a greater range of climate than its close relative wheat, with quite a few varieties suited to temperate, subarctic or subtropical areas [30]. However, with the degradation of global climate, barley is constantly facing various abiotic environmental stresses, such as cold damage and drought stress, during the growing season. Moreover, its productivity is limited due to the prevalence of pests and diseases in cultivated plant species. As a plant-specific protein family, the crucial roles of TIFY family in plant growth and development, stress responses and signal transduction have been attracting much attention. TIFY genes have been identified and functionally characterized in many cereal species, including wheat [31,32], rice [20], maize [33,34] and sorghum [35,36]. Yet, there are few reports on a comprehensive genome-wide survey and characterization of the TIFY gene family in barley and its involvement in abiotic and biotic stresses to date. In this study, we carried out a genome-wide identification and characterization of the TIFY family from two assembled barley genomes, including Hv_Morex (v3.0) and Hv_Barke. All identified barley TIFY genes were subjected to phylogenetic, gene structure, conserved domain or motif, cis-regulatory element, chromosome distribution and gene duplication analysis. Further, their synteny and evolutionary relationships with one dicotyledon (A. thaliana) and four monocotyledons (Oryza sativa, Brachypodium distachyon, Sorghum biocolor and Setaria italic) were also attempted. Moreover, the expression profiling of the barley TIFY genes in various tissues, and the responses to cold stress and spot blotch infection, were also analyzed. Our analysis results provide a foundation for further functional study of TIFYs in barley and also contribute to elucidating their roles in abiotic and biotic stress responses.

2. Materials and Methods

2.1. Genome-Wide Identification of TIFY Gene Family Members

We downloaded the whole-genome data of two barley genotypes Morex (version 3, a reference cultivar) and Barke (a successful German variety) from the Barley Genome Database (https://barley-pangenome.ipk-gatersleben.de, accessed on 10 August 2023) [30]. We performed a genome-wide identification of barley TIFY genes via two basic local alignment search tool (BLAST) methods. First, we aligned the whole barley genome with the TIFY genes of Arabidopsis thaliana [1,18] and rice (O. sativa) [20] to obtain candidate HvTIFY genes. We downloaded the TIFY protein sequences of A. thaliana and O. sativa from the European Nucleotide Archive (https://plants.ensembl.org/info/data/ftp/index.html, accessed on 15 August 2023). Second, we searched for the potential members of HvTIFY gene family through a hidden Markov model (HMM) profile of the conservative functional domain of TIFY (PF06200) using HMMER 3.0 software (http://HMMER.org/, accessed on 15 August 2023). Finally, using a Prosite search (https://prosite.expasy.org/, accessed on 15 August 2023) and the InterPro tool (https://www.ebi.ac.uk/interpro/, accessed on 15 August 2023), we further confirmed the conserved domain architectures of all candidate genes. We excluded those sequences without the typical functional domain of TIFY and used the remaining protein sequences containing the conservative TIFY domain for subsequent analysis. The basic physicochemical properties of each barley TIFY protein, including molecular weight (MW) and isoelectric point (pI), were analyzed by Expasy’s ProtParam server (https://web.expasy.org/protparam/, accessed on 15 August 2023). The subcellular localization of the barley TIFY proteins was predicted by the web-based software of Cell_PLoc 2.0 package (http://www.csbio.sjtu.edu.cn/bioinf/Cell-PLoc-2/, accessed on 15 August 2023).

2.2. Multiple Sequence Alignment and Phylogenetic Tree Construction

We performed multiple sequence alignments (MSAs) using MAFFT v7.487 [37] and manually edited them using Geneious Prime v2021.1.1. Phylogenetic analysis was carried out for the resultant MSAs using IQtree v2.2.0, and then the tree topology support was assessed based on bootstrap analysis with 1000 replicates. Furthermore, the phylogenetic tree was annotated and visualized with the iTOL v6 webserver (https://itol.embl.de/, accessed on 15 August 2023). Finally, the sequence logos of TIFY domain and Jas domain were generated by using WebLogo v3.7.4 (http://weblogo.threeplusone.com/, accessed on 15 August 2023) [38].

2.3. Analysis of Gene Structure, Conserved Motif and Cis-Acting Element

We identified the exon/intron organization of HvTIFY genes based on barley genome annotation data retrieved from the Barley Genome Database and also analyzed the domain composition of HvTIFY proteins using the Pfam database. The conserved motif patterns of HvTIFY proteins were further detected by using the MEME suite v5.5.0 (https://meme-suite.org/meme/tools/meme, accessed on 15 August 2023), with the maximum number of conserved motifs set to 10 [39]. Then, the gene structures and conserved motifs in the HvTIFY family were visualized by TBtools [40]. We extracted 2 kb upstream sequences of HvTIFY genes from the barley genome sequence as promoter sequences, and we performed a comprehensive analysis of the promoter region for cis-element identification using PlantCARE software (http://bioinformatics.psb.ugent.be/webtools/plantcare/html/, accessed on 15 August 2023) [41].

2.4. Analysis of Chromosomal Location, Gene Duplication and Gene Synteny

We obtained the position information of the HvTIFY genes along chromosomes based on barley genome assembly and annotation. MCScanX analysis was performed for detecting duplication types and the intraspecific/interspecific collinearity of TIFY family members. We constructed chromosomal location maps and analyzed the collinearity relationship of the TIFY genes in each genotype by selecting the Advanced Circles function in the TBtools software (version 2.003). The synteny relationship of the orthologous TIFY genes from Hv_Morex or Hv_Barke was determined and exhibited using the Multiple Synteny Plot function in TBtools. We also conducted the homology analysis of the TIFY genes between barley and model plants or closely related cereal species including A. thaliana, B. distachyon, O. sativa, S. biocolor and S. italica using the Dual Synteny Plot in TBtools. All the genome sequence information of the five selected plants has been downloaded from the European Nucleotide Archive. In addition, we calculated the nonsynonymous rate (Ka), synonymous rate (Ks) and the evolutionary constriction (Ka/Ks) using the Simple Ka/Ks Calculator (NG) of TBtools for duplicated and syntenic TIFY gene pairs [42].

2.5. In Silico Expression Analysis of Barley TIFY Genes

We performed expression pattern analysis of the TIFY genes in various tissues based on Hv_Morex tissue RNA-seq data downloaded from EoRNA (ERR1457163, ERR1457188 to ERR1457235, ERR1457259), a barley gene and transcript abundance database [43]. To determine the expression profiles of TIFY family genes in response to stress factors, the RNA-seq data of Hv_Morex after cold stress (4 °C for 2 h and 24 h) and a normal growth temperature (18 °C for 2 h and 24 h) were further mined from EoRNA (ERS3631845 to ERS3631859) and analyzed. To explore the expression patterns of HvTIFYs in response to biotic stress, we carried out a transcriptome analysis of Hv_Morex leaves infected by the spot blotch pathogen based on retrieved data from EoRNA (SRR3290245 to SRR3290262). Heat maps of the expression profile of TIFY genes have been generated through the Heatmap Illustrator in TBtools.

3. Results

3.1. Identification of TIFY Genes in Barley

We identified a total of 21 and 22 TIFY genes in the whole genome of Morex and Barke, respectively (Supplementary Table S1), and renamed these genes as Hv_MoTIFY, Hv_MoZML1 to Hv_MoZML4, Hv_MoJAZ1 to Hv_MoJAZ17 (absent for Hv_MoJAZ10) or Hv_BaTIFY, Hv_BaZML1 to Hv_BaZML4 and Hv_BaJAZ1 to Hv_BaJAZ17 on the basis of their homologous genes in Arabidopsis and rice and the corresponding chromosomes which they were being assigned. Extensive variation was noticed for the length of these identified TIFY genes. The amino acid sequence lengths of Hv_Morex TIFYs and Hv_Barke TIFYs varied from 136 aa (Hv_MoJAZ6 and Hv_MoJAZ13) to 380 aa (Hv_MoJAZ4) and from 138 aa (Hv_BaJAZ13 and Hv_BaJAZ14) to 417 aa (Hv_BaJAZ4), respectively (Supplementary Table S1). Meanwhile, the molecular weights of Hv_Morex TIFYs and Hv_Barke TIFYs ranged from 14.49 (Hv_MoJAZ13) to 40.20 (Hv_MoJAZ4) kDa and from 14.49 (Hv_BaJAZ14) to 44.06 (Hv_BaJAZ4) kDa, respectively. The isoelectric points (pI) of 17 out of 21 TIFYs in Hv_Morex and 17 out of 22 TIFYs in Hv_Barke were higher than 7.0, suggesting that most of the barley TIFYs were characterized by an enrichment of basic amino acids. Furthermore, all barley TIFYs were located in the nucleus based on subcellular localization prediction.

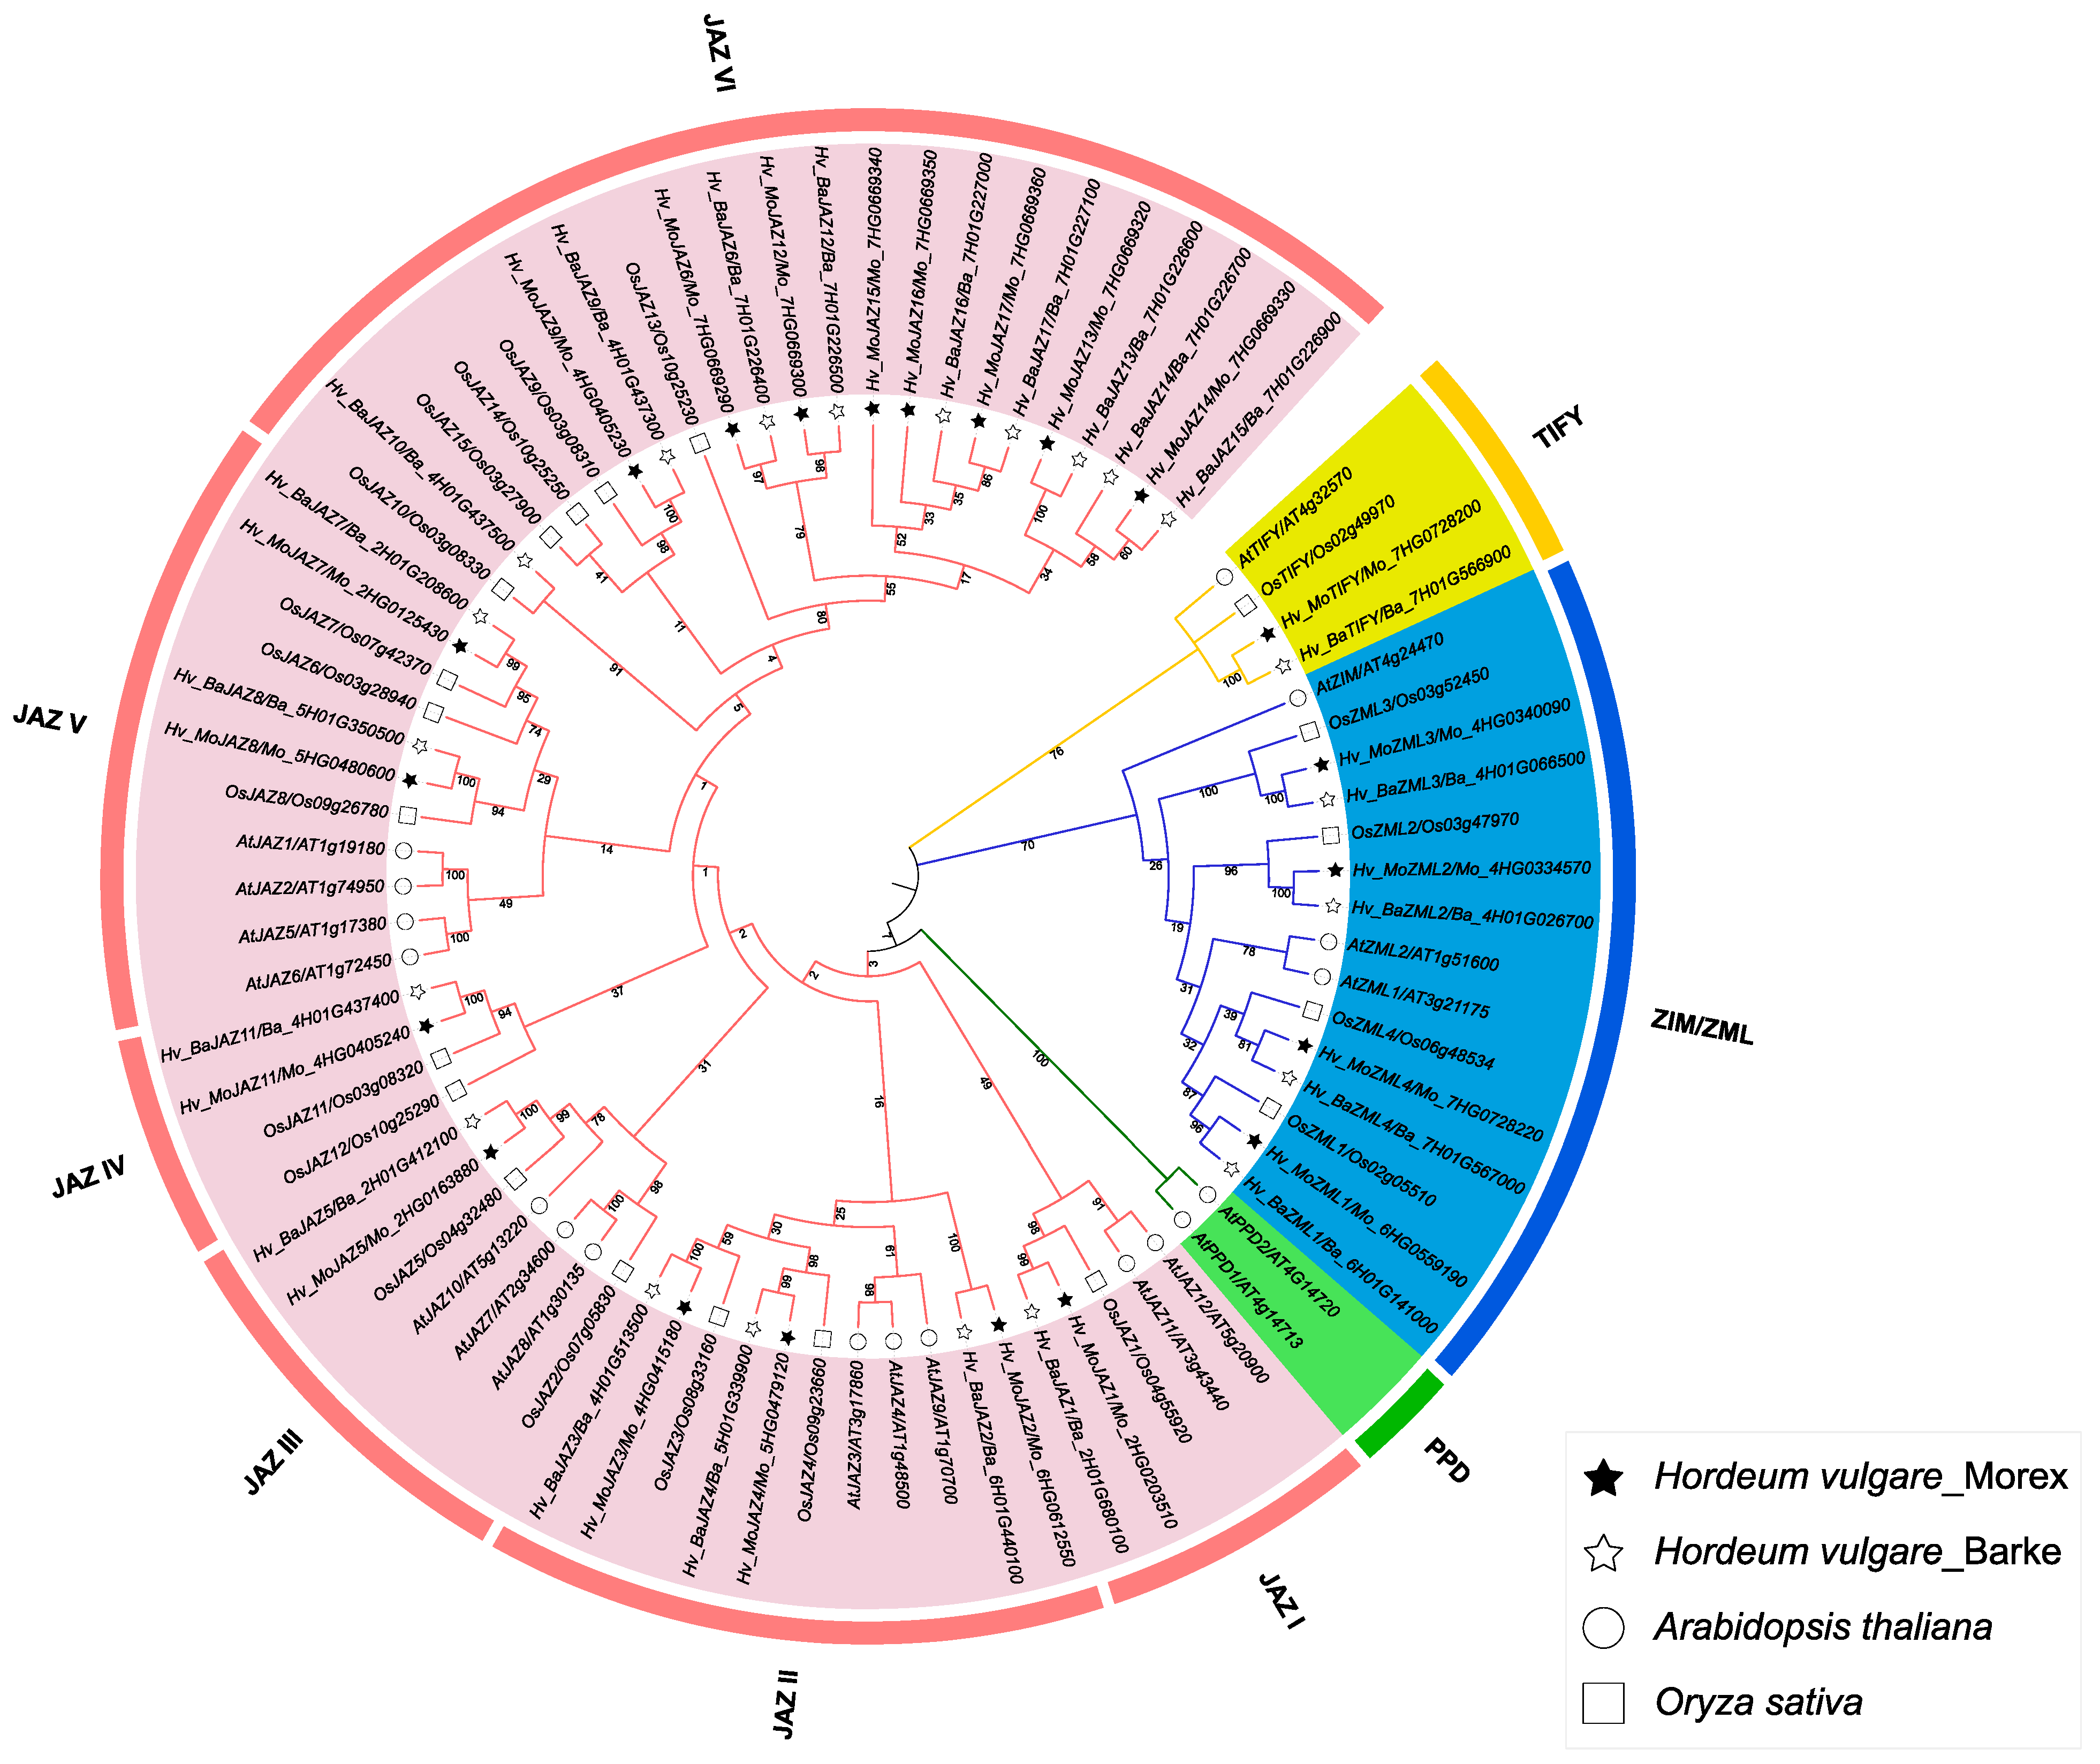
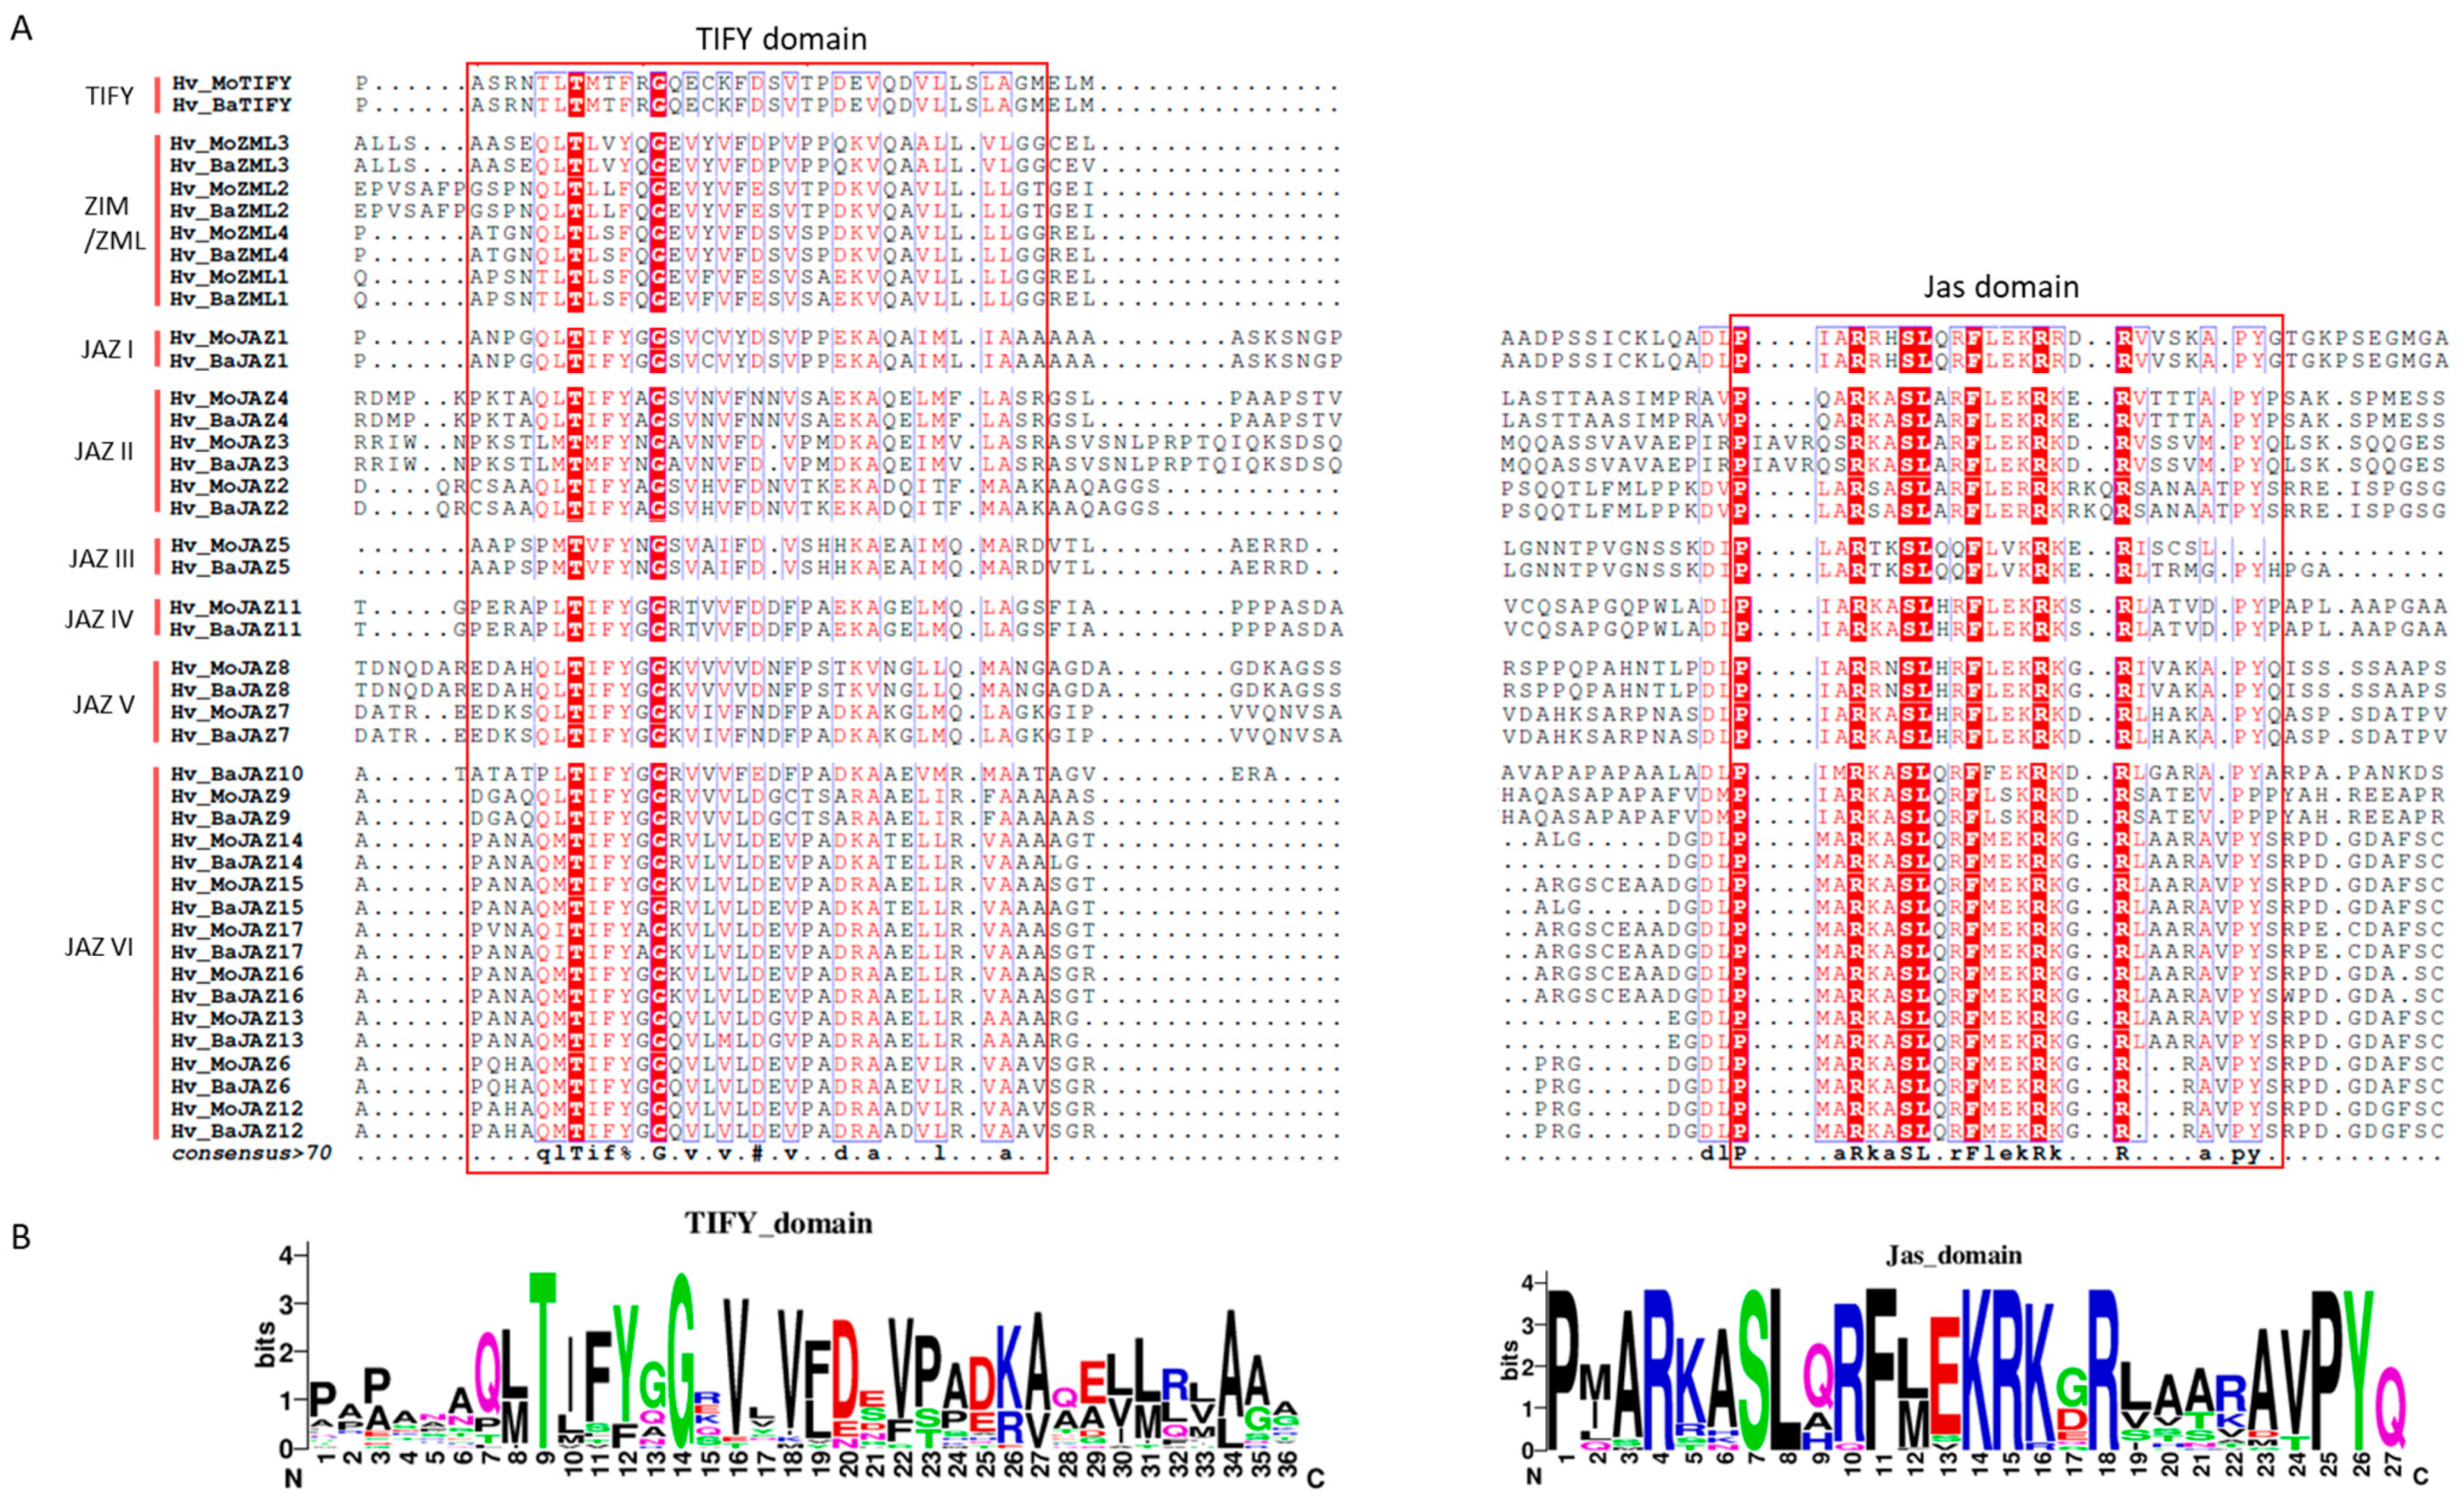
3.2. Multiple Sequence Alignment, Phylogenetic Analysis and Classification of the Barley TIFY Genes

To explore the classification and evolutionary relationship of the barley TIFY gene family, we constructed a phylogenetic tree based on the multiple sequence alignment of 81 TIFY protein sequences, including 21 TIFYs in Hv_Morex, 22 TIFYs in Hv_Barke, 18 TIFYs in Arabidopsis and 20 TIFYs in rice (Figure 1). According to the phylogenetic relationship reflected from the tree and the classification method of TIFY proteins previously reported in A. thaliana [1] and rice [20], 21 Hv_Morex TIFYs and 22 Hv_Barke TIFYs could be classified into three major phylogenetic groups: JAZ, ZIM/ZML, and TIFY. The group JAZ contained the highest number of members with 16 Hv_Morex JAZs and 17 Hv_Barke JAZs, and could be further clustered into six subgroups, i.e., JAZ I to JAZ VI (Figure 1 and Supplementary Table S1). Of the six JAZ subgroups, JAZ VI was the largest subgroup with eight Hv_Morer JAZ and nine Hv_Barke JAZ members, followed by JAZ II with three members and JAZ V with two members for both Hv_Morer and Hv_Barke, while each of the JAZ I, JAZ III and JAZ IV subgroups contained only one member for both Hv_Morex and Hv_Barke. The group ZIM/ZML was the second-largest group that included eight barley ZIM/ZML proteins, with each of the four members being from Hv_Morex and Hv_Barke, respectively. The TIFY group contained one Hv_Morex TIFY and one Hv_Barke TIFY (Figure 1 and Supplementary Table S1). In addition, we also analyzed the phylogenetic relationships among the members of the barley TIFY family based on phylogenetic tree construction using the alignment of the 43 protein sequences of Hv_Morex and Hv_Barke TIFYs characterized herein, and we found that the TIFY proteins derived from the same group were clustered in a common clade (Figure 2A), which was in accordance with that of the above constructed phylogenetic tree from barley, rice and Arabidopsis TIFY sequences (Figure 1).
To reveal the domain profiles of TIFYs in different groups, we conducted a comparative analysis focusing on the amino acid sequences of the domains of 43 HvTIFYs (21 in Hv_Morex and 22 in Hv_Barke). All 43 HvTIFY proteins within the three groups contained one TIFY domain with a conserved TX4G motif, 33 members of the group JAZ contained a Jas domain with a conserved RX2SLX2FX3RX2/4R motif in addition to the TIFY domain, and 8 proteins of the group ZIM/ZML had an additional CCT and GATA domain, whereas 2 members of the group TIFY were characterized by only the TIFY domain but lacking any other domain (Figure 2B and Supplementary Table S1).

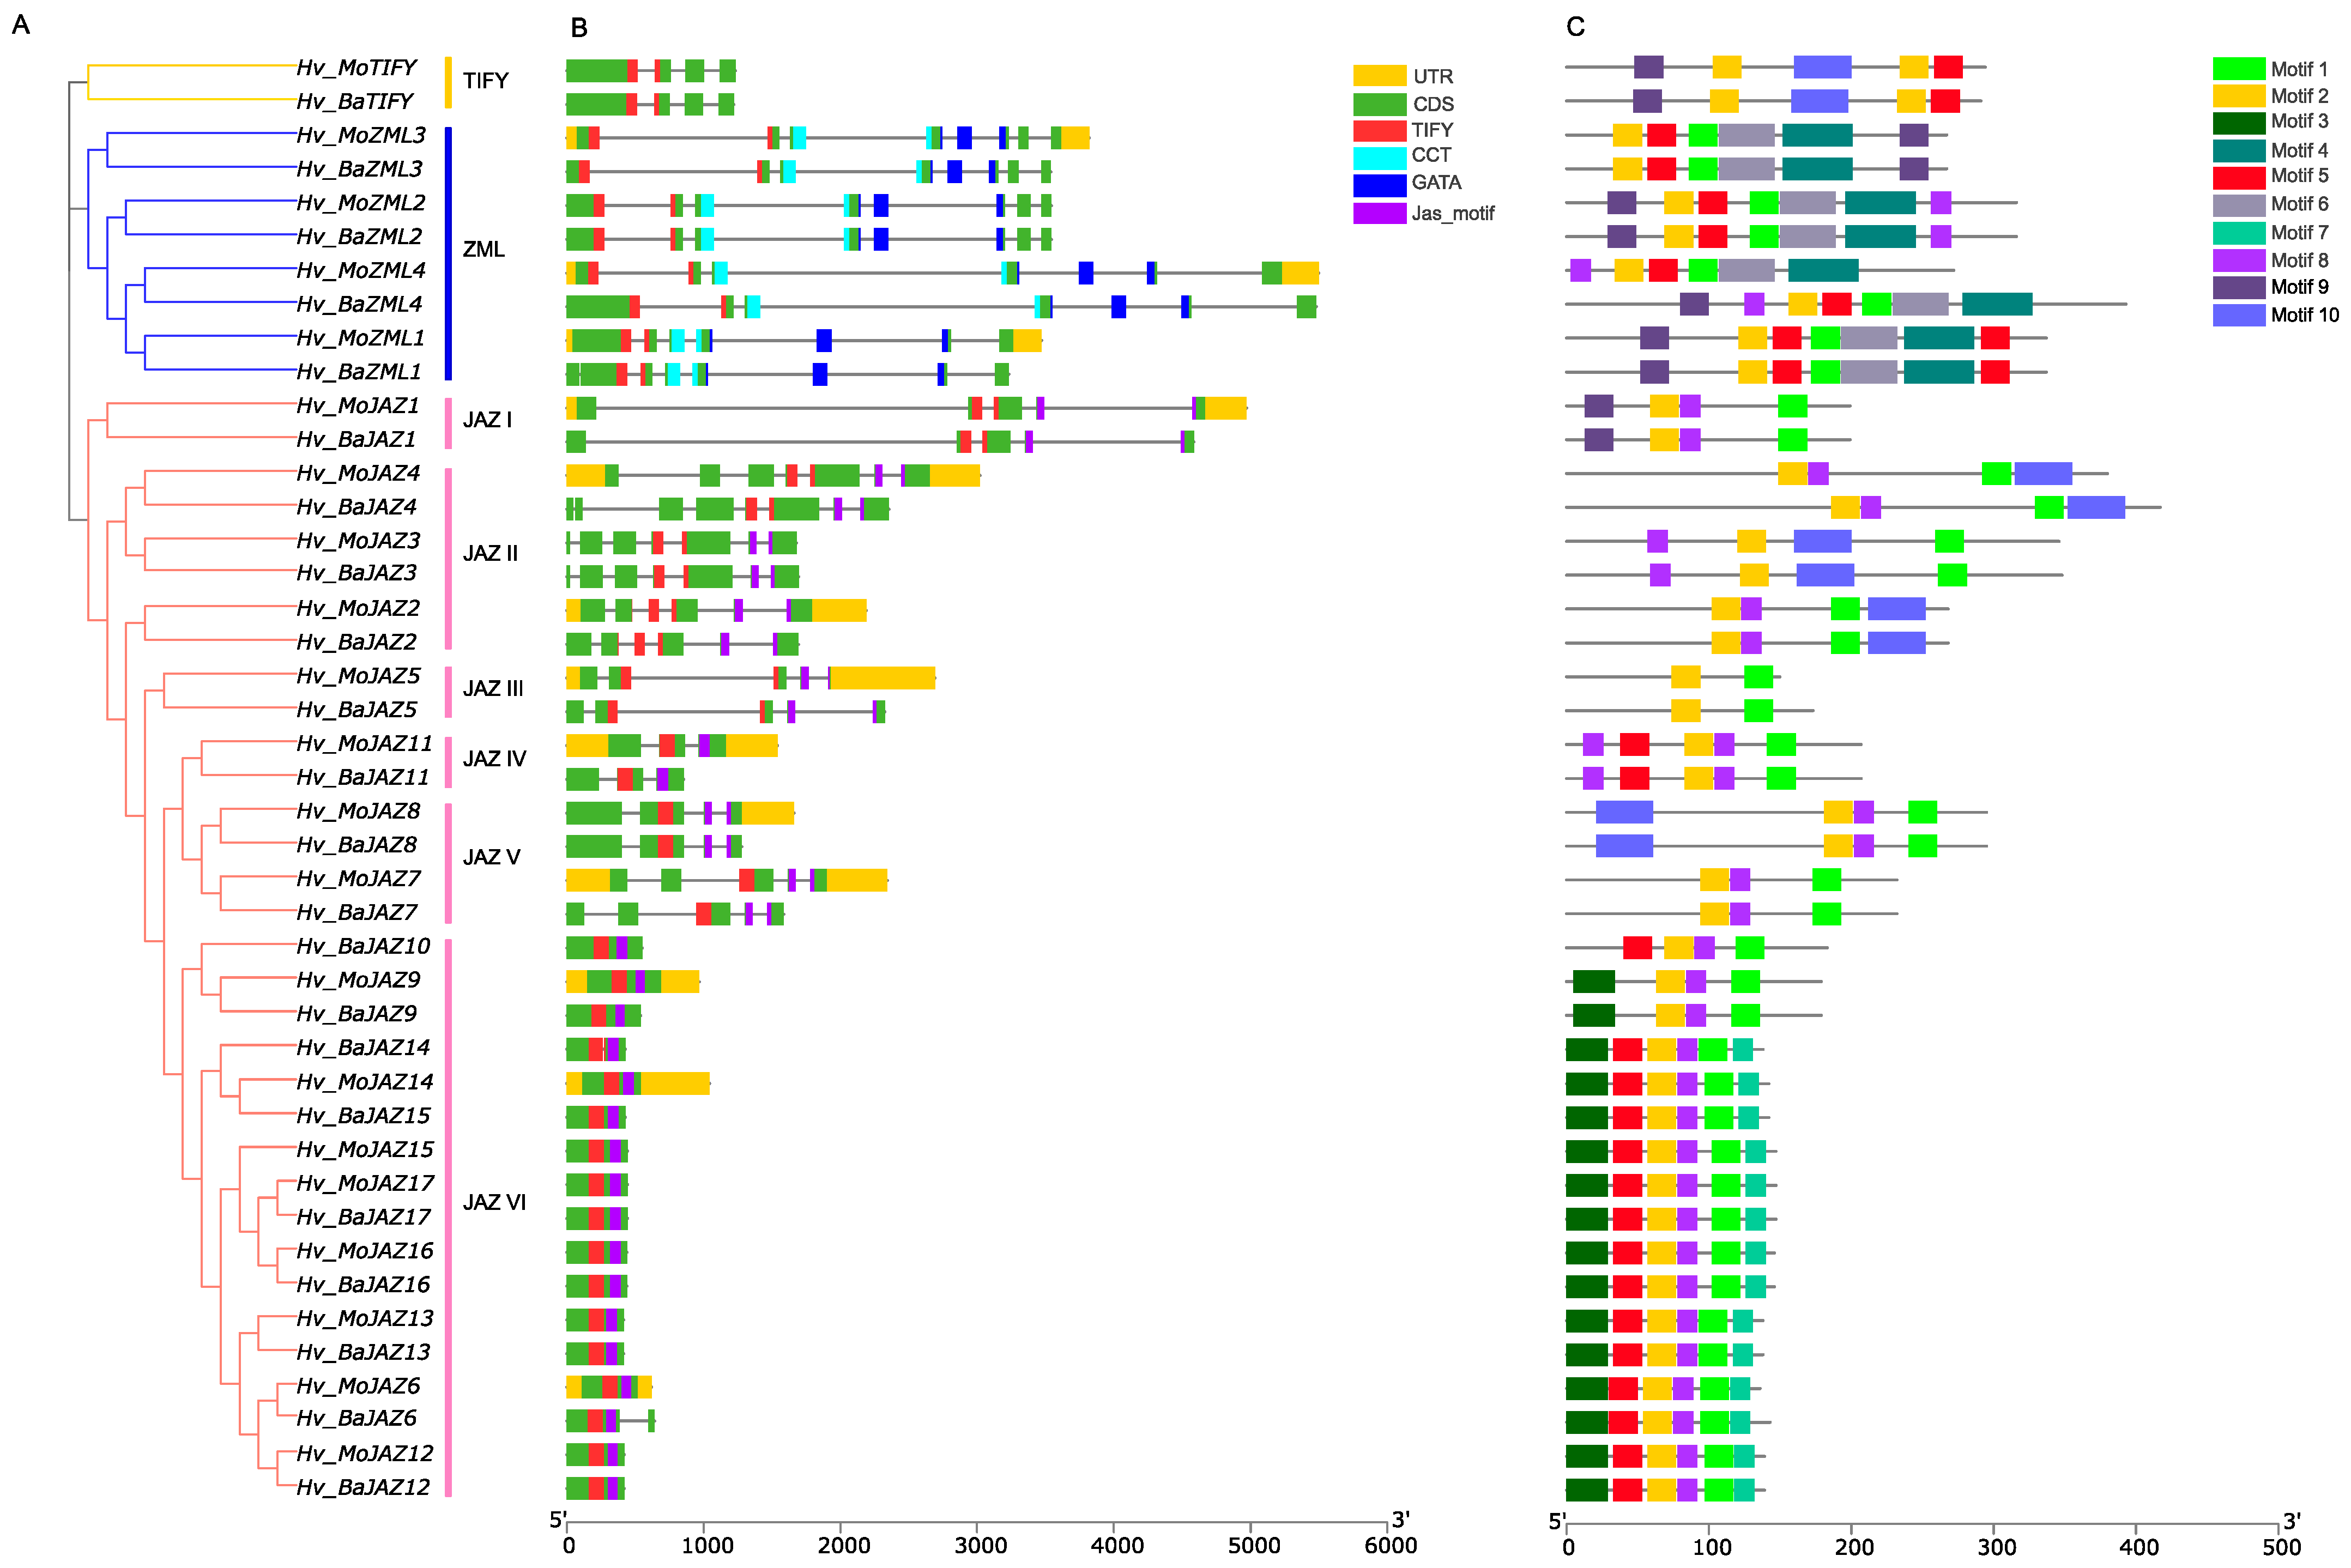
3.3. Gene Structure and Protein Motif Analyses of HvTIFY

Barley TIFY genes from different groups and subgroups showed great differences in the number and distribution of exons, with the number of exons ranging from one to eight unevenly (Figure 2B and Supplementary Table S1). The genes in the ZIM/ZML group held the largest number of exons, with an average number greater than seven, of which all genes contained eight exons except for Hv_MoZML1, Hv_MoZML4 and Hv_BaZML4. The group TIFY contained four exons for both Hv_MoTIFY and Hv_BaTIFY, while the genes in the group JAZ exhibited a large difference in their exon number—with only one exon for most members of the subgroup JAZ VI but three to eight exons for the members of the other JAZ subgroups.
MEME motif analysis was performed for the conserved structural motifs in barley TIFY family members. We detected a total of 10 conserved motifs, and named them Motif 1 to Motif 10 (Figure 2C and Supplementary Table S2). No member of the barley TIFY family has been found to hold a complete set of 10 conserved motifs, and the motif number of the barley TIFYs ranged from 2 to 7. In addition, except for Motif 2 that was widely distributed in every member of the barley TIFY family, unique motifs were identified in the TIFY proteins of some groups or subgroups. Motif 4 and Motif 6 were unique to the group ZIM/ZML; Motif 3 and Motif 7 were unique to the subgroup JAZ VI except for the members of JAZ 9 (Motif 7 missing) and JAZ 10 (both motifs missing). Moreover, the TIFY genes from the same group or subgroup had the similar number and type of motifs, and the similar distribution pattern of motifs as well. For example, the two members of the TIFY group possessed four conserved motifs with the same structural distribution, the members of the ZIM/ZML group mainly included five motifs and most members of the subgroup JAZ VI had six similarly distributed motifs (Figure 2C).
To further understand the structural conservation of the barley TIFY and Jas domains in the different groups and subgroups, we conducted sequence alignment analysis for both domains in all barley TIFY family members and obtained the corresponding logos (Figure 3). The domain logos revealed that not all the TIFY domains of barley TIFY members were completely conserved, but most of the TIFY domain sequences shared common motifs, such as TIFYXG, TXFYNG and TLX2QG. For these conserved motifs, the motif TIFYXG was the most dominant motif, and 14 out of 21 Hv_Morex and 15 out of 22 Hv_Barke TIFYs contained this motif; the motif TIFYXG was shared by the members of the subgroups JAZ I and JAZ IV to VI and the two members of JAZ II; the motif TXFYNG was co-owned by one JAZ II member and one JAZ III member; while the motif TLX2QG was co-possessed by the ZIM/ZML members (Supplementary Table S1). Owing to its existence only in the Jas group, the Jas domain was more conservative among all members of the subgroups I to VI and the shared residue motif of PX2RX2SLX2FX2KRX2R (Figure 3A).

3.4. Cis-Acting Element Analysis of TIFY Gene Family Members in Barley

In order to explore the underlying expression patterns of the barley TIFY genes, we detected the cis-elements in the promoter regions of these HvTIFY genes. The results revealed that the promoter regions of the HvTIFY family members contained abundant putative cis-elements, falling into three main categories: stress response elements, phytohormone elements and plant growth and development elements (Supplementary Table S3). We detected 12 types of stress response-related cis-elements in the promoter regions of the HvTIFY gene family, mainly including light-responsive elements (G-box, Sp1 and GT1-motif), anaerobic induction elements (AREs), low-temperature-responsive elements (LTRs), the MYB binding site involved in drought-inducibility (MBS) and defense and responsive elements (TC-rich repeats), etc. Among them, except that the promoters of all barley TIFY genes carried the G-box element, the second most distributed cis-element was the ARE in the Hv_Morex TIFY family members, while the MBS was in the Hv_Barke TIFYs. Ten types of phytohormone-related cis-acting elements were found in the promoters of HvTIFY family members, primarily involving abscisic acid responsiveness (ABRE), MeJA-responsiveness (TGACG-motif, CGTCA-motif), auxin responsiveness (AuxRR-core, TGA-element), salicylic acid responsiveness (TCA-element) and gibberellin-responsiveness (P-box, GARE-motif, TATC-box). Of these, the cis-elements of ABRE and MeJA-responsiveness were detected in the promoter regions of most HvTIFY family genes. There were 21, 20 and 19 members in the Hv_Morex TIFY family, and 22, 20 and 21 members in the Hv_Barke TIFY family containing the three elements, respectively. In addition, some HvTIFY gene promoters were found to contain cis-acting elements related to plant growth and development, such as zein metabolism regulation (O2-site), meristem expression (CAT-box), circadian control (circadian), endosperm expression (GCN4-motif) and seed-specific regulation (RY-element). In general, the type and the average number of the cis-elements relating to plant growth and development were less than those relating to stress response or phytohormone. For the most identified elements on plant growth and development, an O2-site and CAT-box were identified in the promoters of 10 and 12 Hv_Morex TIFY genes, respectively, and each of the two elements was detected in 12 Hv_Barke TIFY members. In brief, our cis-elements analysis implies that a high proportion of barley TIFY genes are likely to respond to various environmental stresses.

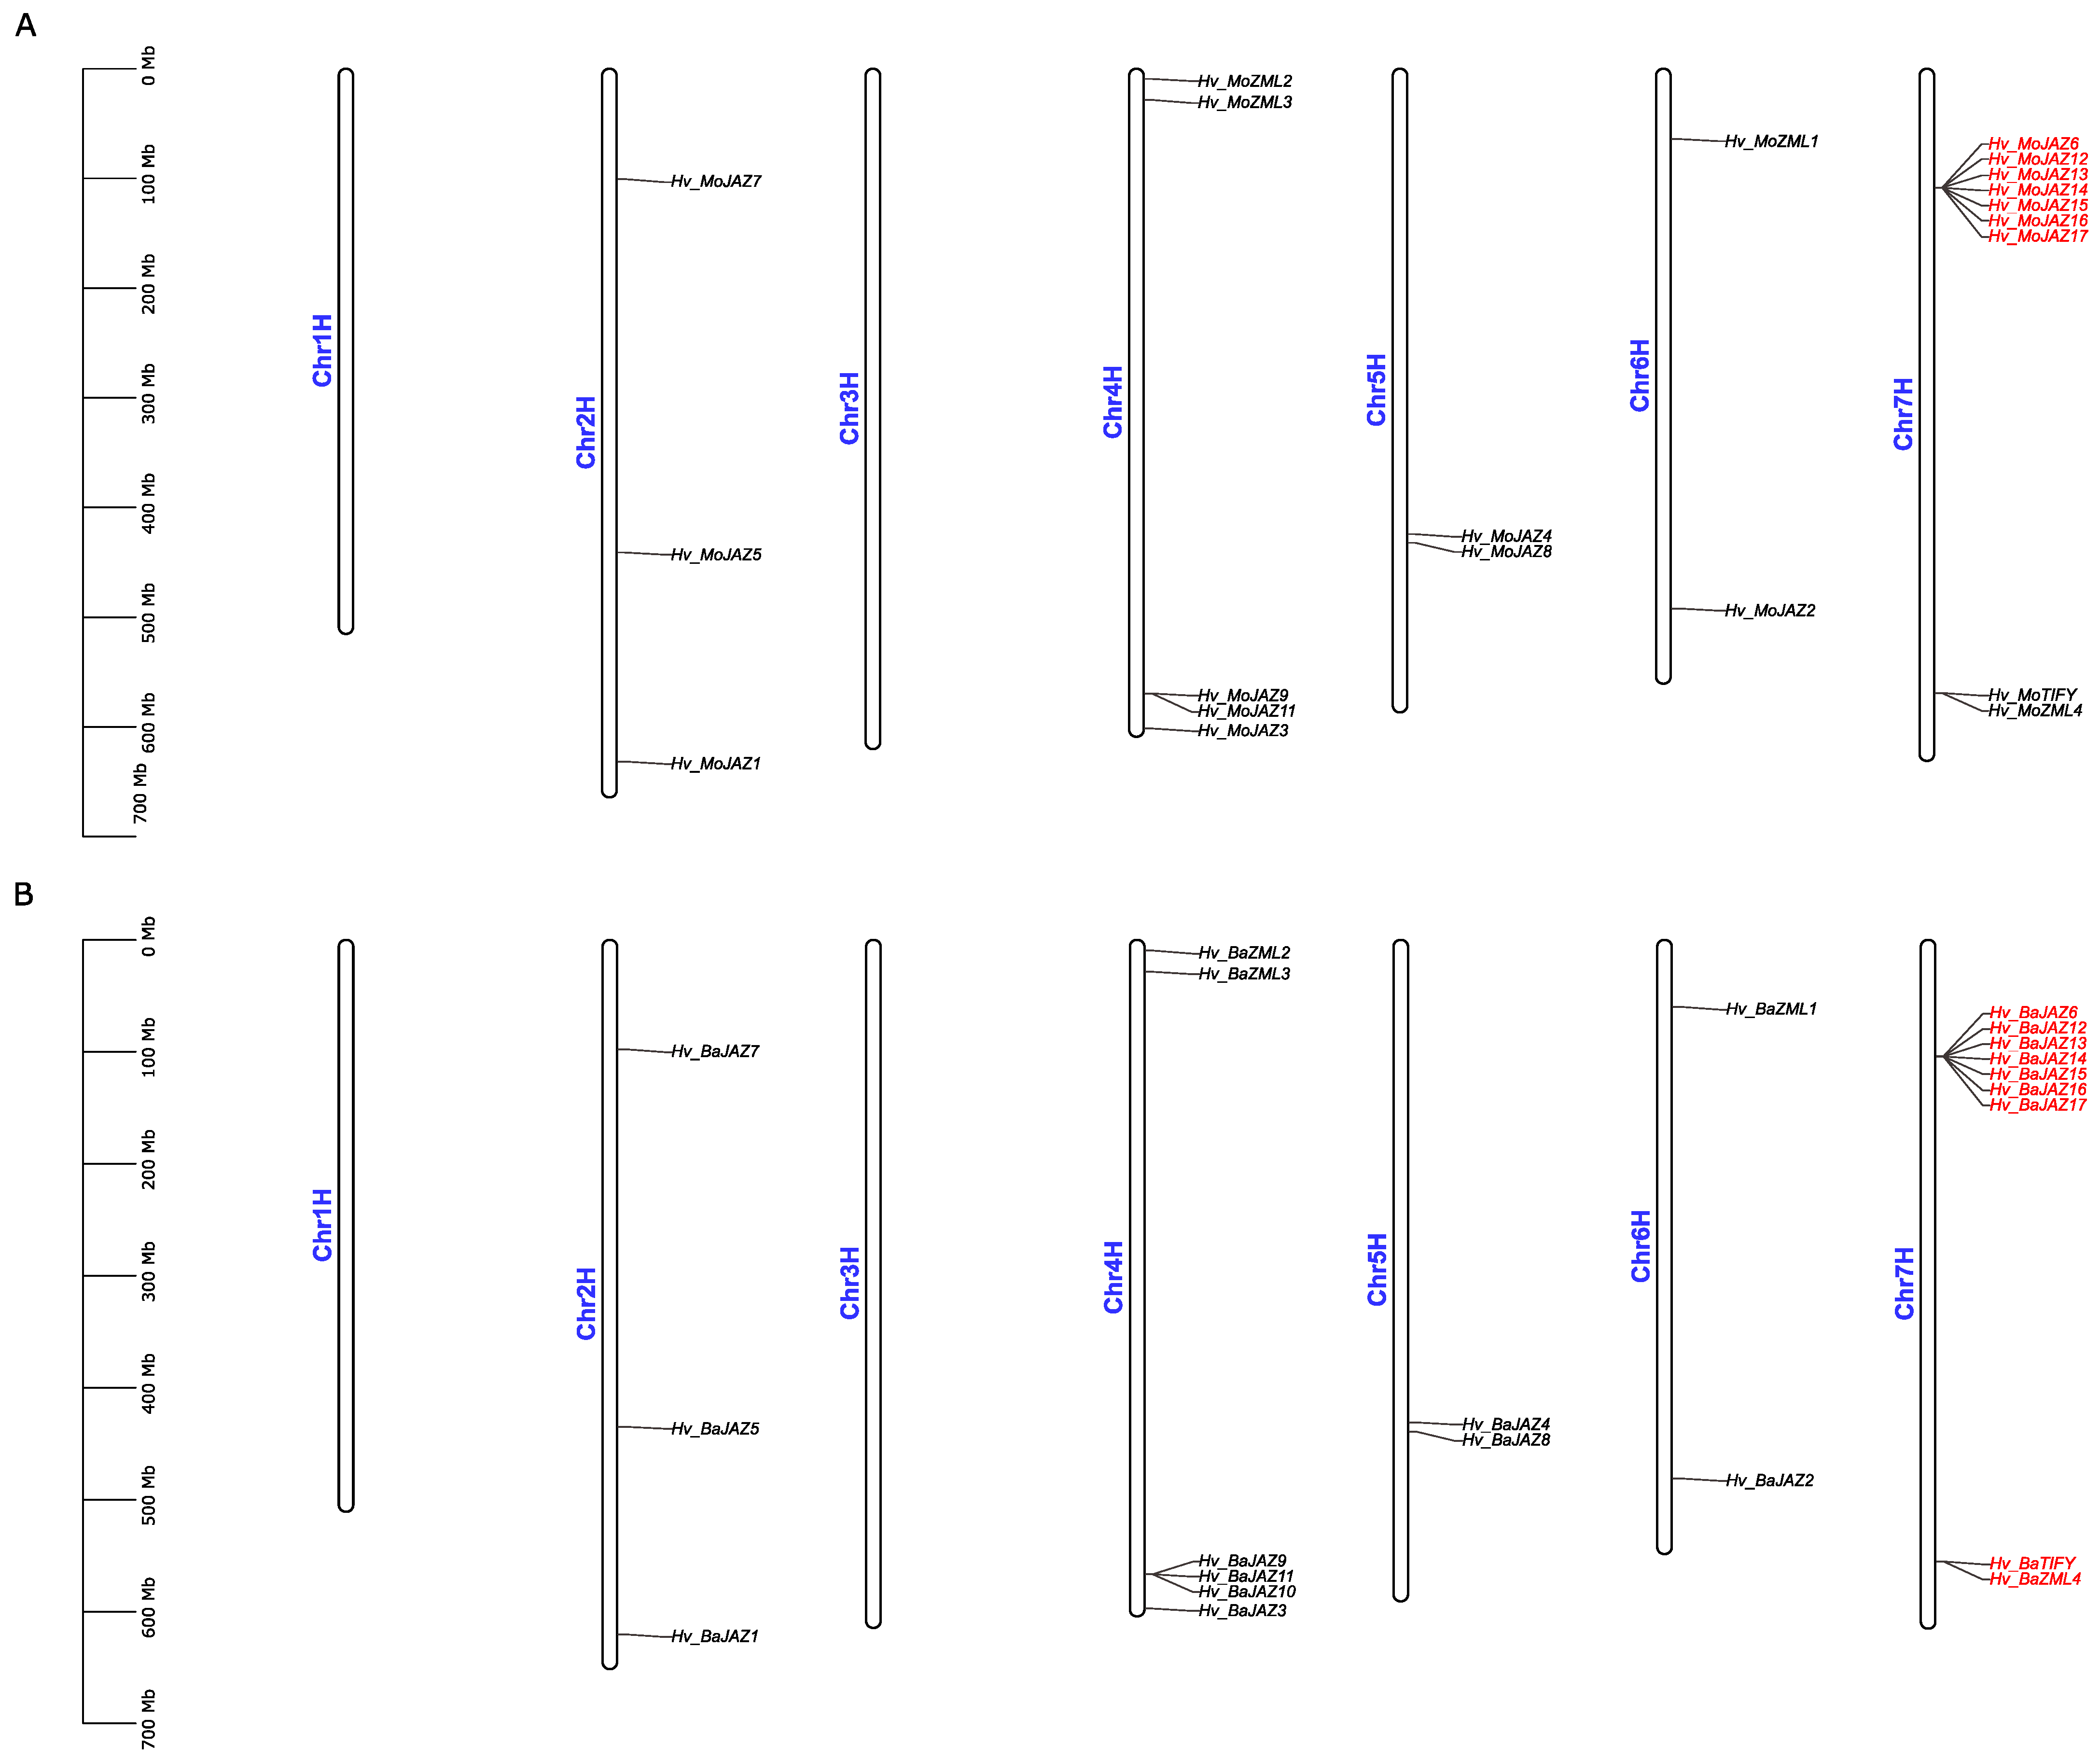
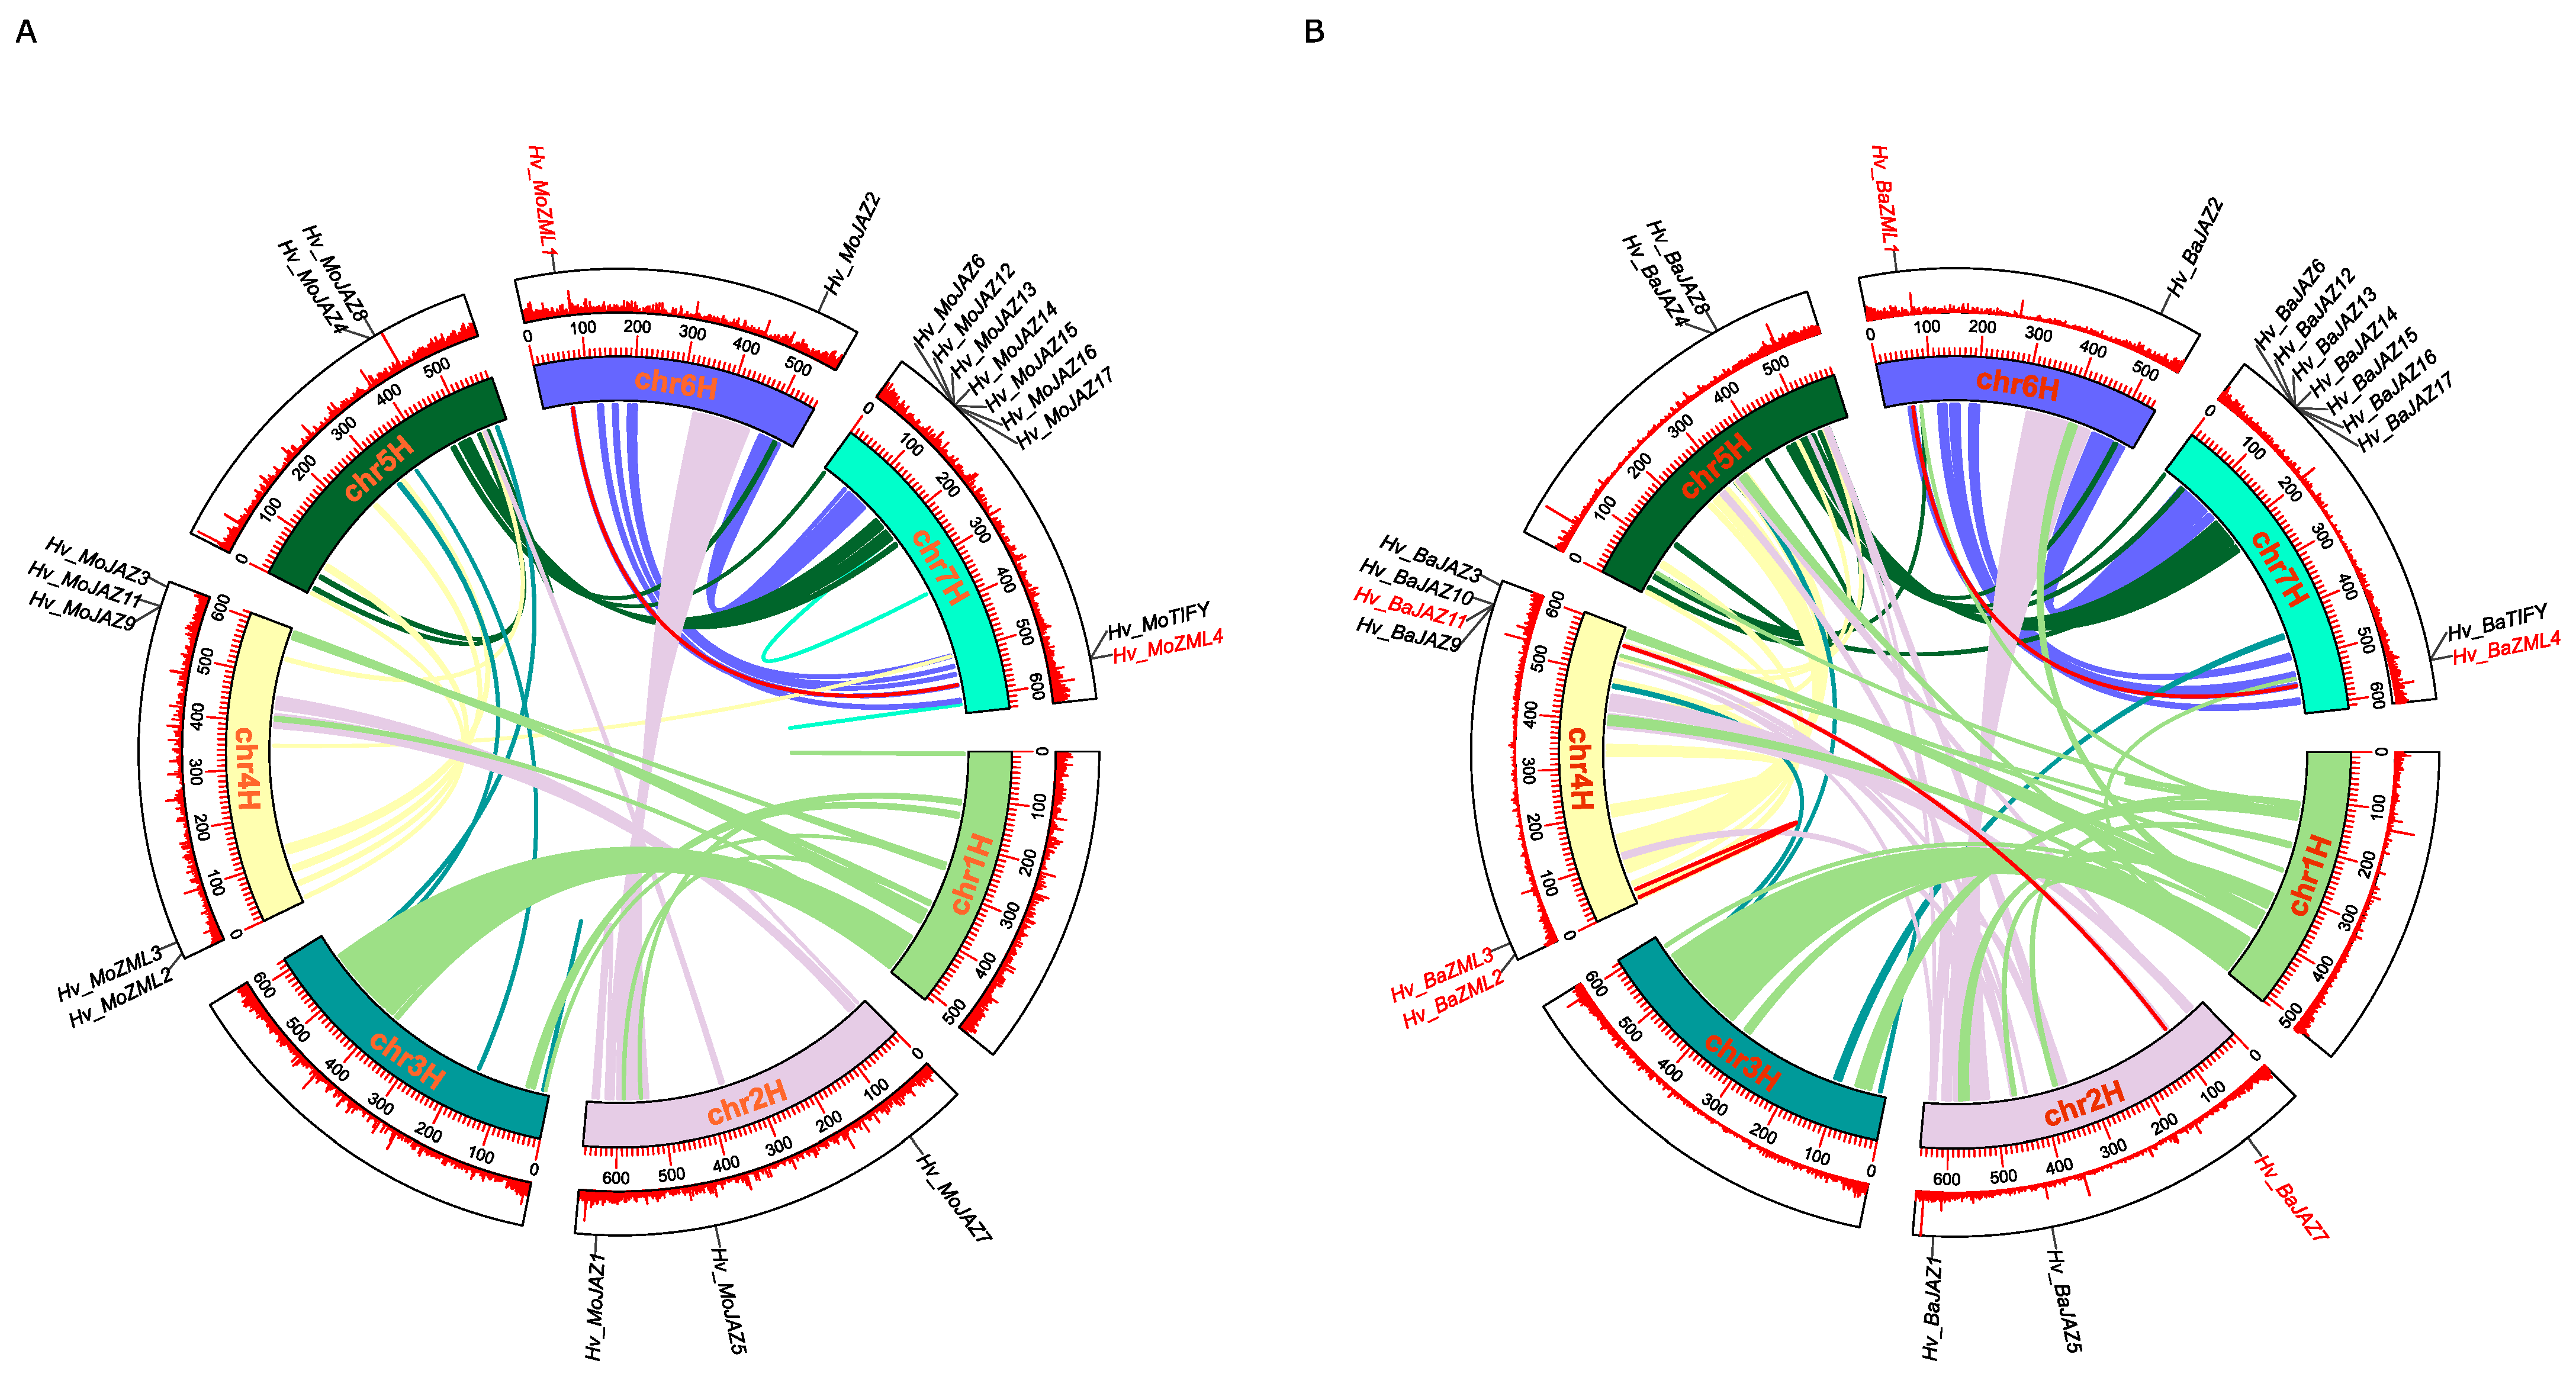
3.5. Chromosomal Location and Duplication Analyses of TIFY Gene Family Members in Barley

The analysis results demonstrated that the HvTIFY genes were distributed irregularly on the barley chromosomes. Both genotypes of Hv_Morex and Hv_Barke had a similar chromosomal distribution for TIFY genes, except for Hv_BaJAZ10 mapping to Chr4H in Hv_Barke but the corresponding gene being missing in Hv_Morex (Figure 4A,B). All HvTIFY family members were unevenly mapped to the same five of the seven chromosomes of Hv_Morex or Hv_Barke (Figure 4A). Among them, Chr7H anchored the greatest number of genes with nine HvTIFY genes in both Hv_Morex and Hv_Barke, followed by Chr4H with five HvTIFY members in Hv_Morex and six members in Hv_Barke, Chr2H with three HvTIFY members in both Hv_Morex and Hv_Barke and Chr5H and Chr6H each with two HvTIFY members in either Hv_Morex or Hv_Barke.
MCScanX analysis revealed a couple of gene duplication events occurred throughout the barley TIFY family’s history. Although five gene pairs in the HvTIFY family were identified as tandem duplications in both Hv_Morex and Hv_Barke, some gene pairs displayed differences between the two genotypes. For example, except for four pairs of similar duplication genes in two genotypes, one tandem duplication gene pair was Hv_MoJAZ14/Hv_MoJAZ15 in Hv_Morex, but that was Hv_BaTIFY/Hv_BaZML4 in Hv_Barke. In addition to tandem duplications, one and three segmental duplication events were also detected in the Hv_Morex and Hv_BarkeTIFY families, respectively (Figure 5 and Supplementary Table S4). Hence, tandem duplication was the main form of gene duplication in the barley TIFY family.

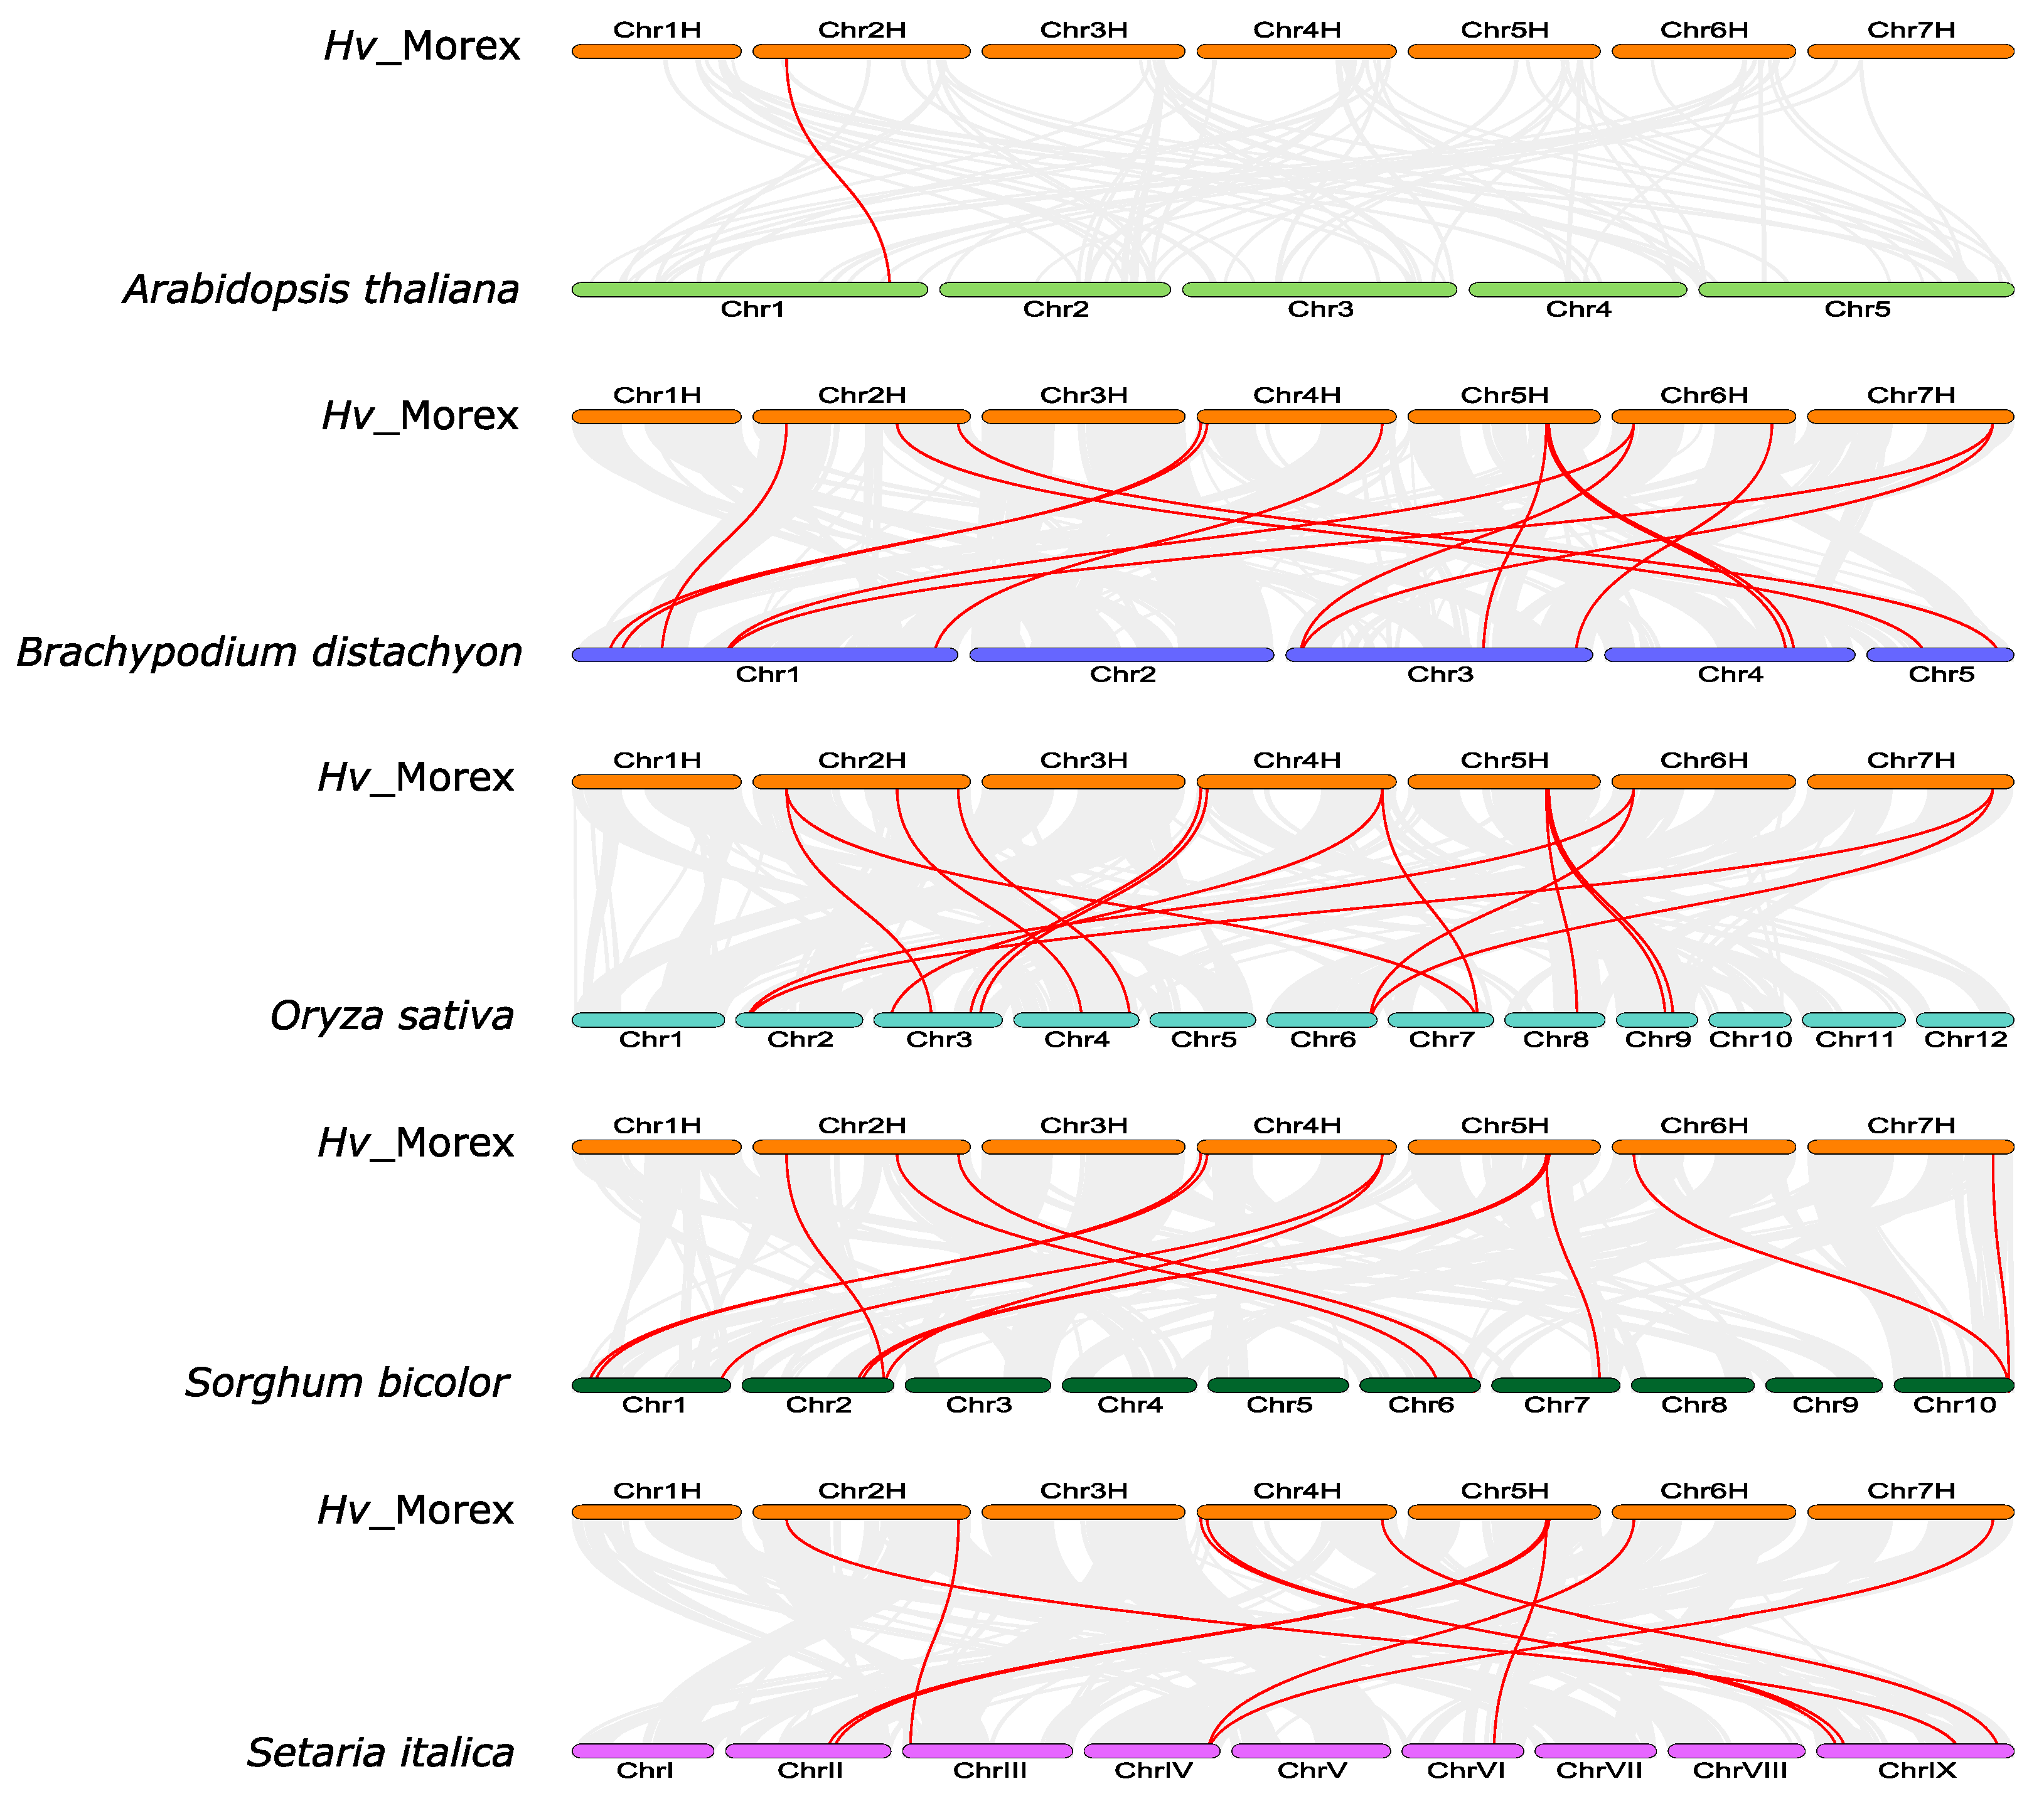
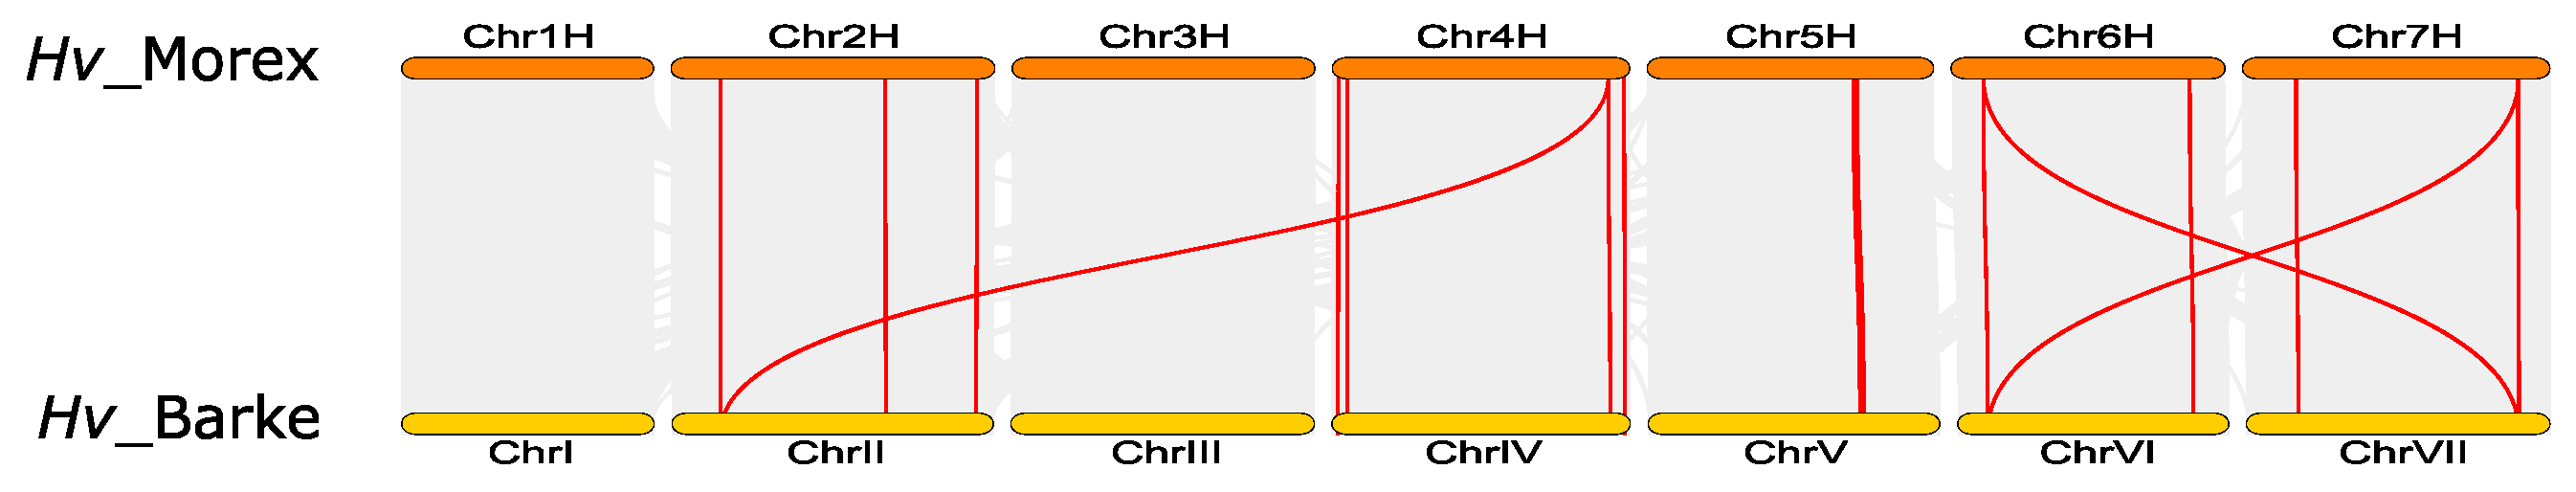
3.6. Synteny and Evolutionary Analyses of Barley TIFY Genes and Other Plant TIFYs

To analyze barley TIFY family evolution, we constructed a series of collinear maps of barley associated with other five plant species, i.e., A. thaliana, O. sativa, B. distachyon, S. biocolor and S. italica (Figure 6). The comparative maps revealed that a total of 11 Hv_Morex TIFY genes showed syntenic relationships with those in each species of B. distachyon, S. biocolor and O. sativa, followed by 9 and 1 Hv_Morex TIFY genes syntenic with those in S. italica and A. thaliana, respectively. The number of Hv_Morex TIFY orthologous genes in B. distachyon, O. sativa, S. biocolor, S. italica and A. thaliana was 12, 12, 10, 9 and 1, respectively (Figure 6 and Supplementary Table S5). Among the orthologous gene pairs, the Hv_Morex TIFY genes of Hv_MoJAZ4, Hv_MoZML1 and Hv_MoZML4 in the syntenic analysis of Hv_Morex and B. distachyon, of Hv_MoJAZ7, Hv_MoJAZ4, Hv_MoZML1 and Hv_MoZML4 in the syntenic analysis of Hv_Morex and O. sativa, of Hv_MoJAZ4 in the syntenic analysis of Hv_Morex and S. biocolor and also in the syntenic analysis of Hv_Morex and S. italica were detected to be associated with two syntenic gene pairs. More homologous gene pairs were found between Hv_Morex and monocots than those between Hv_Morex and A. thaliana.
As shown in the homologous gene maps of Hv_Barke and the five representative plant species (Figure 7), a total of 11 TIFY family members of Hv_Barke were found to be homologous to the genes in each species of B. distachyon, O. sativa and S. biocolor, followed by 9 and 3 Hv_Barke TIFY genes showing syntenic relation to the genes of S. italica and A. thaliana, respectively. The number of Hv_Barke TIFY orthologous genes was 12, 13, 11, 10 and 1 in B. distachyon, O. sativa, S. biocolor, S. italica and A. thaliana, respectively (Figure 7 and Supplementary Table S6). In the identified homologous gene pairs, one Hv_Barke TIFY gene (Hv_BaJAZ7) showed association with three corresponding genes in O. sativa (Os03t0402800-01, Os03t0180900-01 and Os07t0615200-01) and three genes in S. biocolor (EER95398, EER92157 and EER97533). Two Hv_Barke TIFY genes (Hv_BaJAZ7 and Hv_BaJAZ8) were found to have syntenic genes in both monocot plants and Arabidopsis. However, the Hv_BaJAZ11 gene had its corresponding syntenic genes in Arabidopsis and the three monocot plants (O. sativa, S. biocolor, S. italica), but not in B. distachyon (Supplementary Table S6).
To further understand the syntenic relationships among the barley TIFY gene family, homologous analysis was performed for the TIFY genes between the two genomes of Hv_Morex and Hv_Barke (Figure 8). The results indicated that a total of 16 TIFY genes from each of the two genotypes displayed collinearity, and 19 collinear gene pairs were found between Hv_Morex and Hv_Barke (Figure 8 and Supplementary Table S7).
In addition, the Ka/Ks ratios were calculated to estimate the selective pressure on TIFY genes. The measurement showed that except for 11 collinear TIFY gene pairs between Hv_Morex and Hv_Barke (the Ks value being 0, or >1 for Ka/Ks), all other collinear gene pairs showed Ka/Ks < 1, implying that the HvTIFY family might have experienced changes in purifying selection during barley genome evolution (Supplementary Tables S5–S7).

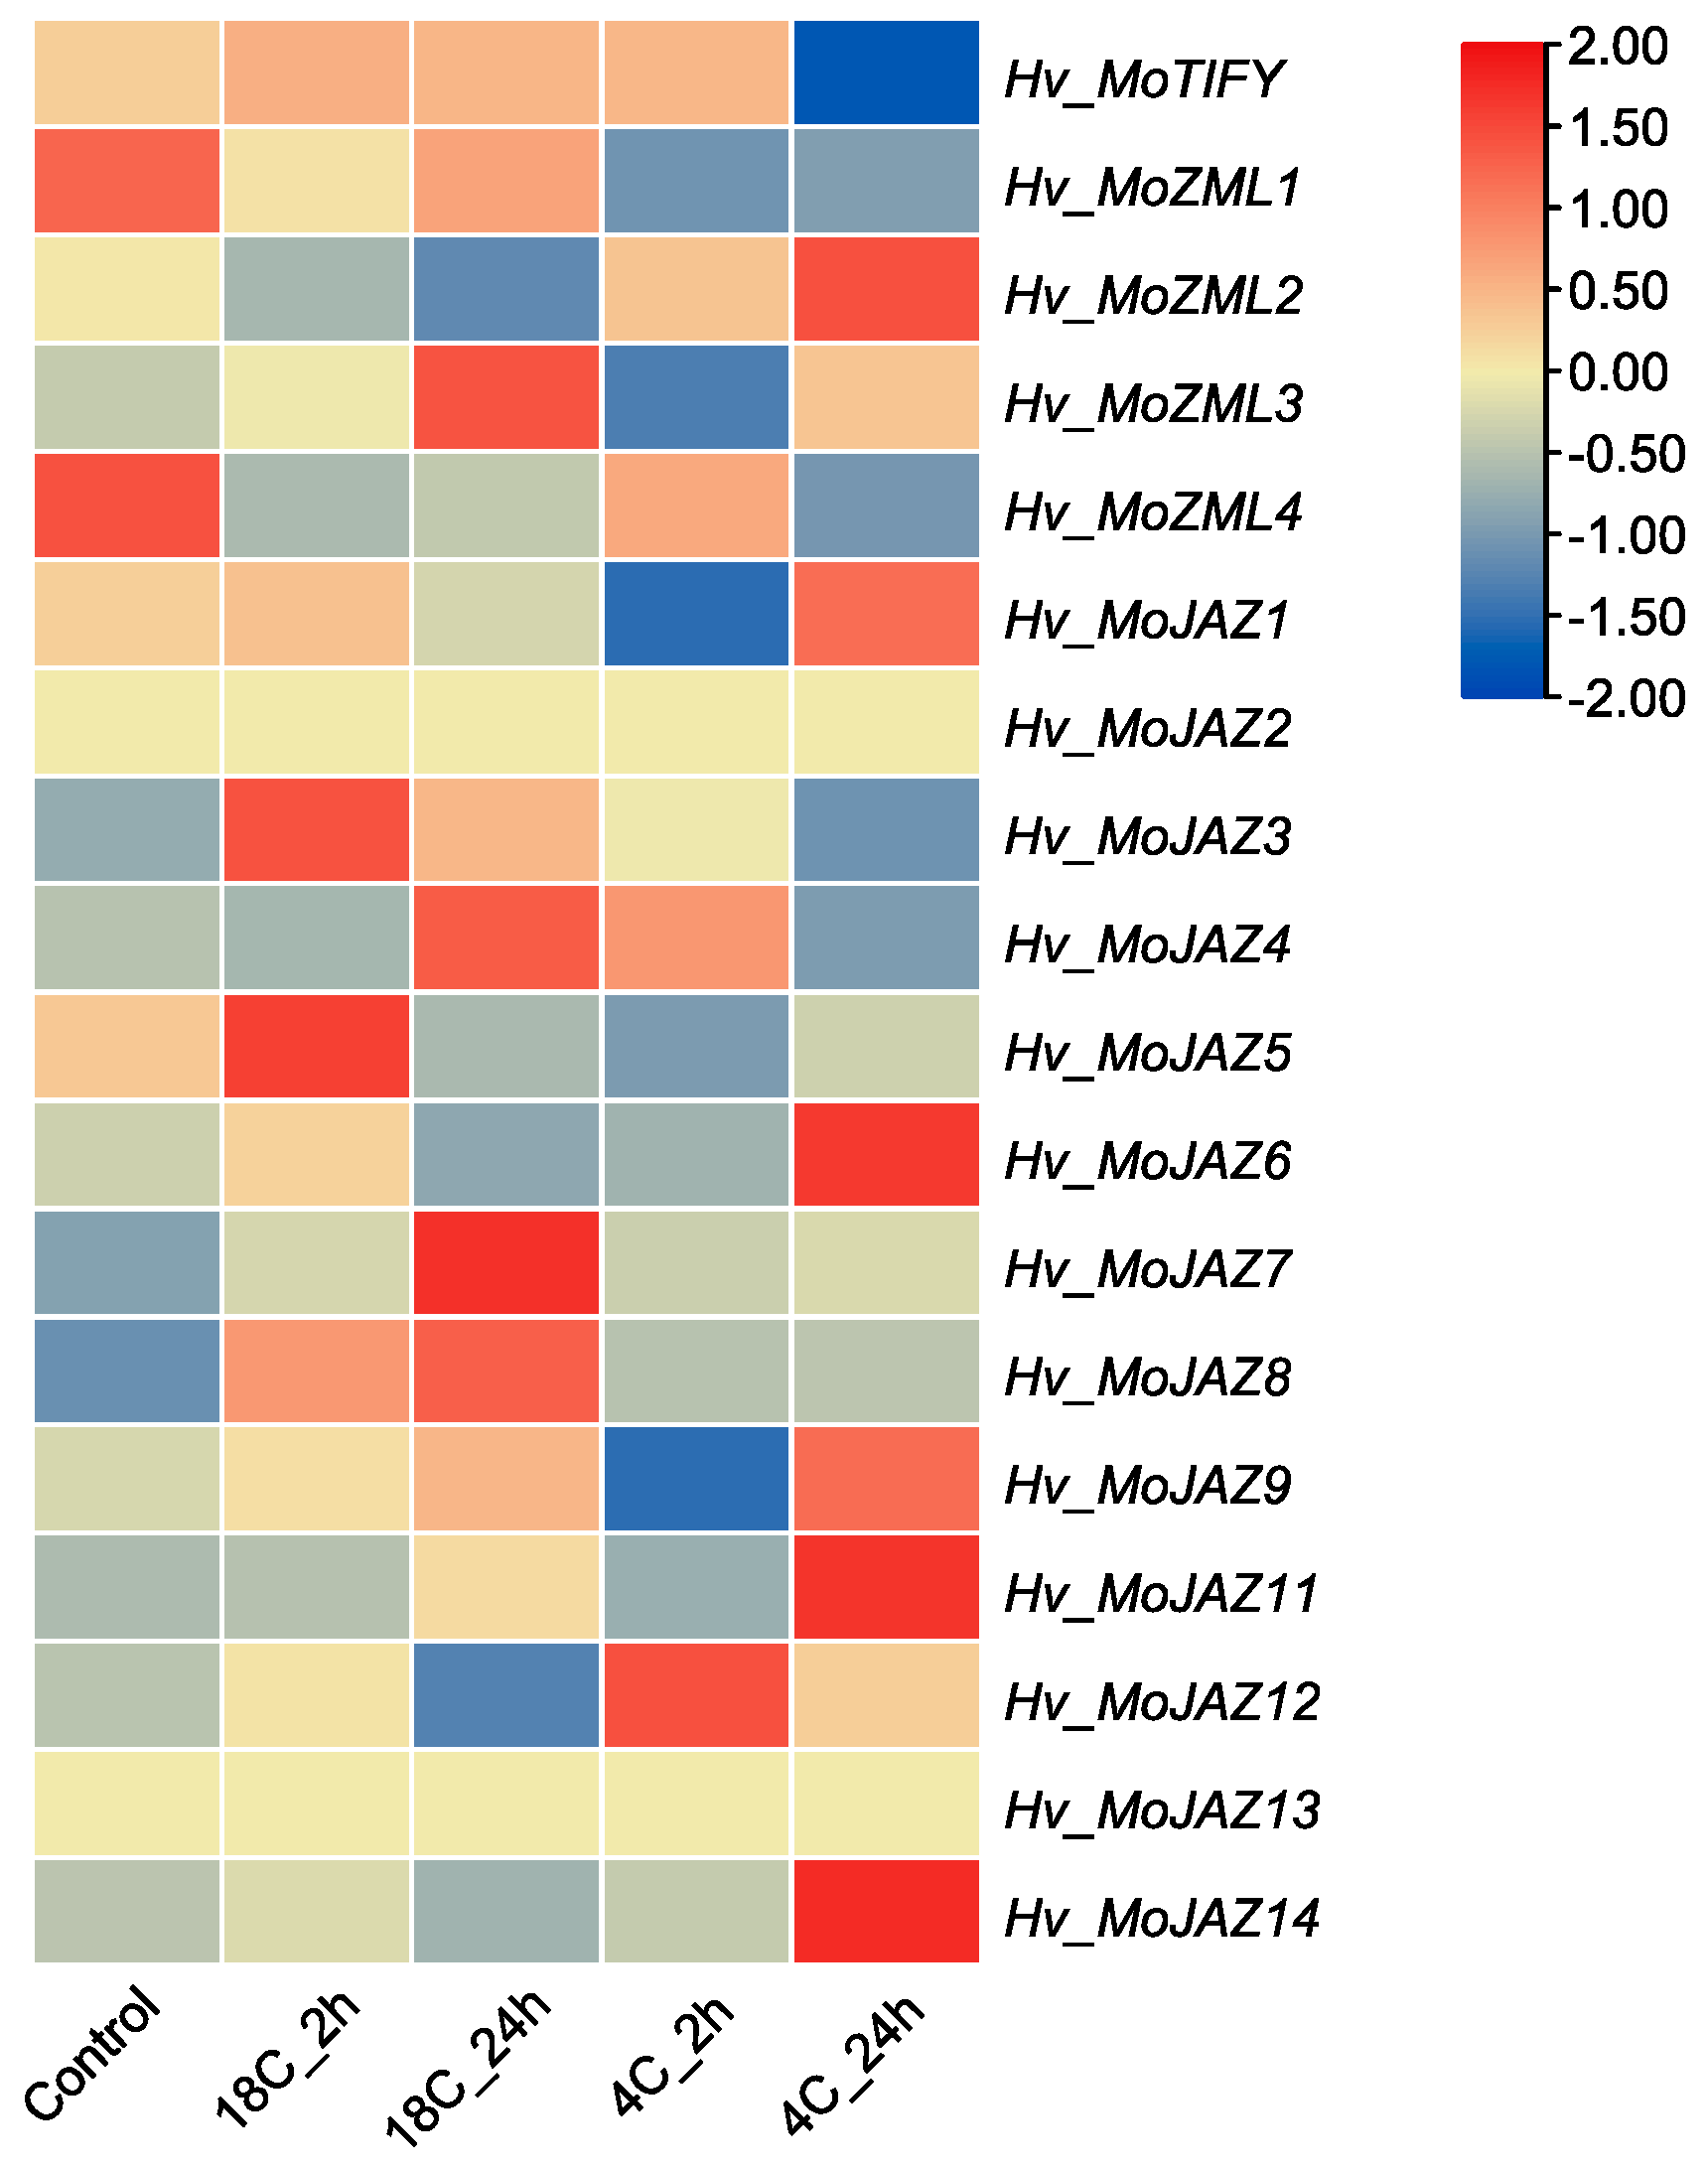
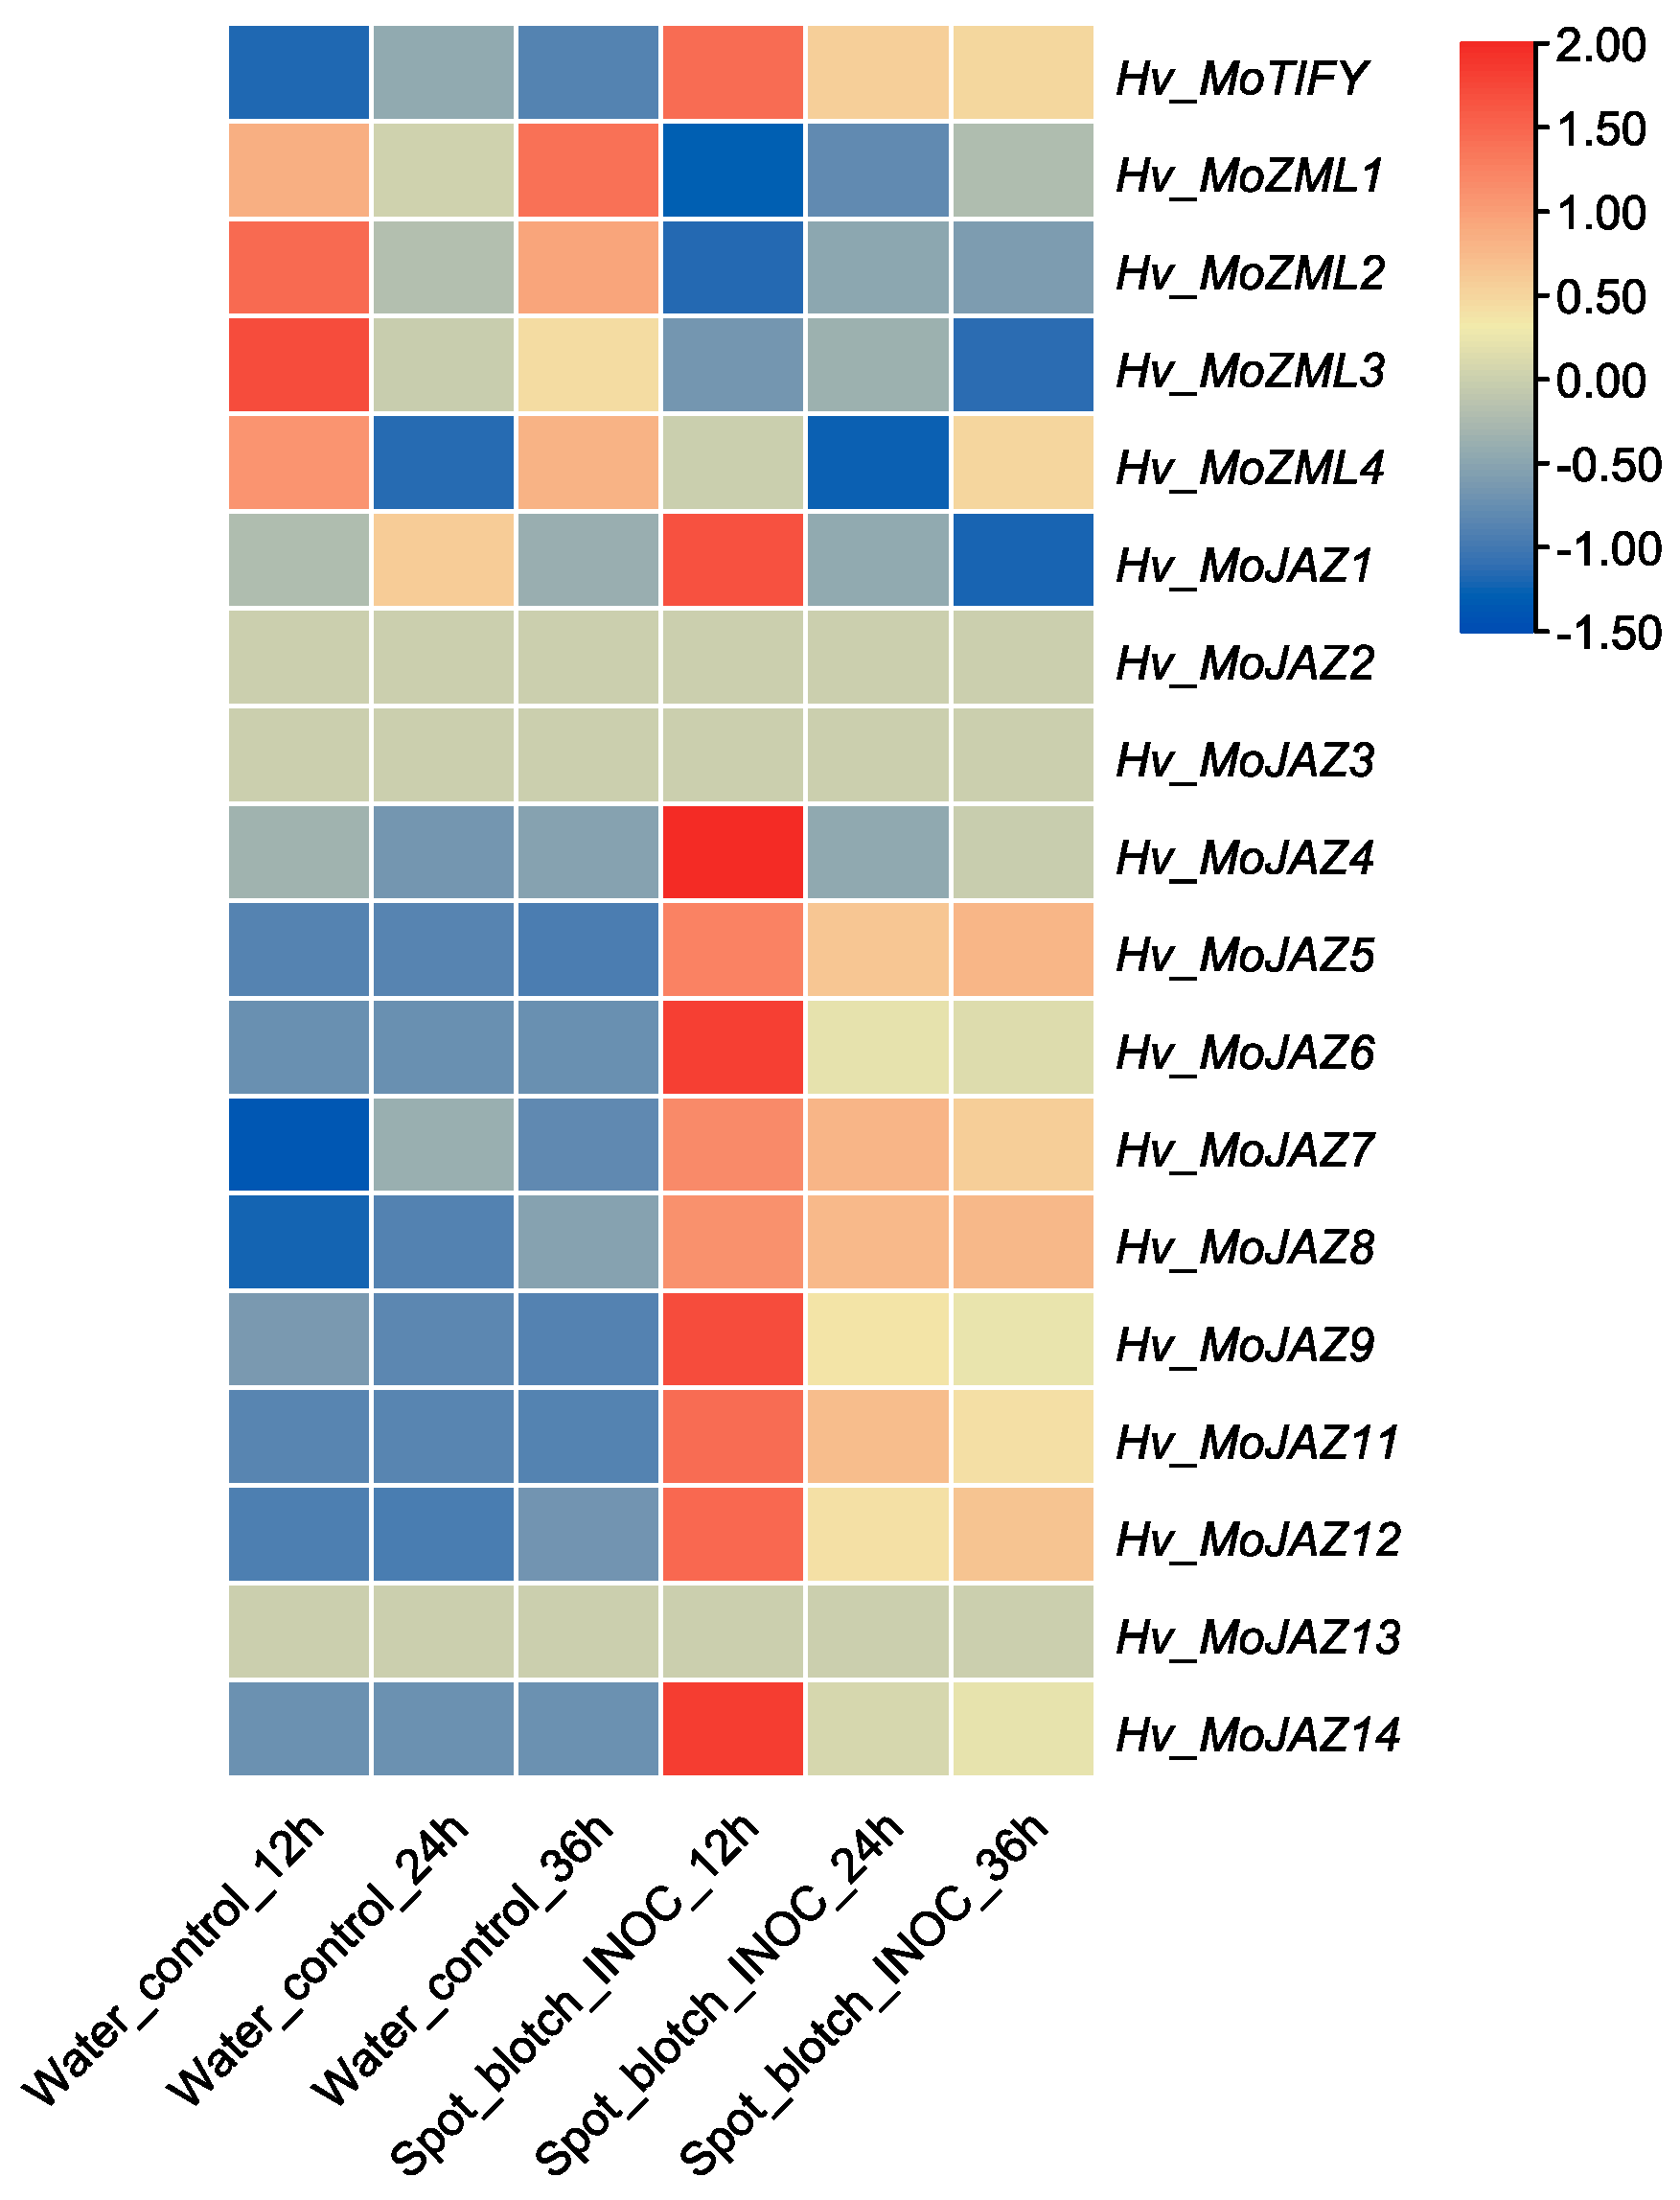
3.7. Expression Pattern Analysis of Barley TIFY Genes

In the present study, the expression patterns of the Hv_Morex TIFY genes in twelve tissues or tissue parts (grain, embryo, epidermis, inflorescence, shoot, lemma, lodicules, tiller, palea, rachis, root and leaf) were analyzed based on published transcriptome data (REF). As shown in Figure 9, the TIFY genes except for Hv_MoJAZ13 were expressed in at least one of these tissues, and quite a few TIFY genes were expressed in a tissue-specific manner. Compared with other TIFY family members, Hv_MoZML1, Hv_MoJAZ1, Hv_MoJAZ4, Hv_MoJAZ5, Hv_MoJAZ6, Hv_MoJAZ7, Hv_MoJAZ8, Hv_MoJAZ9, Hv_MoJAZ11, Hv_MoJAZ12 and Hv_MoJAZ14 had relatively higher expression levels in some tissues or tissue parts. Among them, Hv_MoJAZ1, Hv_MoJAZ4 and Hv_MoJAZ7 were highly expressed in all twelve tissues, and the expression levels of Hv_MoJAZ1 in inflorescence, lemma and palea, while the expression levels of Hv_MoJAZ4 and Hv_MoJAZ7 in epidermis, lemma, lodicules and palea were particularly prominent, implying that these genes may be important for the regulation of normal development of the tissues. Hv_MoJAZ5, Hv_MoJAZ6, Hv_MoJAZ8, Hv_MoJAZ9, Hv_MoJAZ11, Hv_MoJAZ12 and Hv_MoJAZ14 were highly expressed in inflorescence (lemma, lodicule, palea, rachis) or root tissues, suggesting they might be involved in inflorescence and root system adjustments in barley. Although Hv_MoZML1 was clearly expressed in all tissues except for grain, no obvious tissue-specific expression pattern was observed.
The expression patterns of Hv_Morex TIFY family members under cold stress (4 °C for 2 h and 24 h) as well as normal growth temperature (18 °C for 2 h and 24 h) were further analyzed on the basis of EoRNA data. As shown in the results in Figure 10, the expression levels of Hv_MoZML1, Hv_MoZML4 and Hv_MoJAZ5 decreased obviously under cold stress and normal temperature, with the exception of the increased expression of Hv_MoJAZ5 under normal growth temperature for 2 h. Conversely, the genes Hv_MoZML2, Hv_MoJAZ7, Hv_MoJAZ8 and Hv_MoJAZ12 showed an upregulation of the expression level during the cold stress, and the increase trend of Hv_MoZML2 and Hv_MoJAZ12 was more obvious. In addition, the genes of Hv_MoJAZ1, Hv_MoJAZ4, Hv_MoJAZ6, Hv_MoJAZ9, Hv_MoJAZ11 and Hv_MoJAZ14 exhibited a higher expression level only at a certain stage of the cold stress. For example, the expression of Hv_MoJAZ1 was lower under cold stress for 2 h, but higher under the stress for 24 h. Hv_MoJAZ4 was highly expressed under cold stress for 2 h, while Hv_MoJAZ6 showed increased expression under the stress for 24 h. The diversity of Hv_Morex TIFYs expression patterns implies that these TIFY genes might participate in the regulation of plant responses to cold stress in a complex manner.
The expression profiles of Hv_Morex TIFY family genes participating in spot blotch infection were also analyzed using EoRNA data. The gene expression results are shown in Figure 11. Most of the TIFY genes showed changes in expression level after spot blotch pathogen invasion. Hv_MoTIFY, Hv_MoJAZ1, Hv_MoJAZ4, Hv_MoJAZ5, Hv_MoJAZ6, Hv_MoJAZ7, Hv_MoJAZ8, Hv_MoJAZ9, Hv_MoJAZ11, Hv_MoJAZ12 and Hv_MoJAZ14 were expressed with similar patterns. Different from the control, these genes showed a higher expression level in the early stage of spot blotch infection and then displayed a gradual or rapid decrease trend with the extension of infection time. On the contrary, the expression of Hv_MoZML1, Hv_MoZML2, Hv_MoZML3 and Hv_MoZML4 after spot blotch infection was lower than that without spot blotch inoculation. The three genes Hv_MoJAZ2, Hv_MoJAZ3 and Hv_MoJAZ13 showed no changes in expression level for both control and spot blotch invasion. These results suggested that quite a few Hv_Morex TIFY family members might play certain roles in responding to spot blotch infection.

4. Discussion

The TIFY gene family is a transcription factor family unique to plants, and it has been proven to take pivotal roles in regulating plant development, physiological processes and biotic and abiotic stress responses. Thus far, the TIFY family has been reported in a large number of plant species. There are 18 TIFY family members in Arabidopsis [1], 20 in rice [20], 48 in maize [34,44], 63 in wheat [31,32,45], 19 in sorghum [35,36] and 21 in Brachypodium [33] according to genome-wide analyses. In the current study, there were at least 21 and 22 TIFY genes identified in the genomes of Hv_Morex and Hv_Barke, respectively, which could be classified into three groups showing clear differences in their gene structures. The difference in the TIFY gene number between the two barley genotypes was due to the different numbers of JAZ group members. The JAZ group in Hv_Morex embraced 13 members, while the group in Hv_Barke had 14 members. Since gene duplication and loss are the major forces of genome expansion or contraction, quite a few gene redundancies are believed to be a result of gene duplication [46,47]. In view of this, the difference in the number of TIFY family members between Hv_Morex and Hv_Barke might be due to gene duplication or loss in the two genotypes during the evolution of their genomes.
The TIFY genes display diverse characteristics in their structure. In many plant species, such as rice [20], wheat [32], kiwifruit [47], walnut [48], cucumber [49] and Brassica rapa [50], the TIFY family members displayed variations in the number of exons and introns, in their protein sequence length and in conserved domains and motifs. In this study, a high variation in protein sequence structure was identified among the barley TIFY family members. On the one hand, the variation range of the Hv_Morex TIFY protein length was 136 aa to 380 aa, while that of Hv_Barke TIFYs was 138 aa to 417 aa. On the other hand, the variation range of the number of HvTIFY gene exons was one to eight. The conserved motif numbers of HvTIFY genes ranged from two to seven, and the conserved domains in HvTIFY proteins were also different between different groups. In addition, some conserved motifs or domains were unique to a certain group or subgroup. These structural divergences of HvTIFY genes could cause differences in their function to a considerable extent.
Both segmental duplication and tandem duplication are important to functional differences of family genes during genome evolution in organisms. In the present study, five tandem duplication events were found in both the Hv_Morex and Hv_Barke TIFY gene families, while only one segmental duplication was found in the former and three in the latter. The higher frequency of tandem duplication in the HvTIFY family is consistent with the previous findings that tandem or local duplication was the key mechanism for gene family expansion [51]. Although many studies have revealed that tandem or duplicated genes usually have similar functions and expression patterns, a considerable portion of duplicated genes have displayed different expression patterns during the growth and development of organisms or when the organisms have been subjected to environmental stress [52]. In this study, the tandem duplicated gene pair of HvJAZ6 and HvJAZ12 had a basically consistent expression pattern in the same tissue; however, the duplicated gene pair of HvJAZ13 and HvJAZ14 showed completely different expression patterns in the tissues of the lemma, lodicule, tiller, palea, rachis and root, and the pair of HvZML1 and HvZML4 displayed distinct expression patterns in most of the 12 examined tissues. These duplicated gene members of TIFY family showing different expression patterns might play different functions in barley tissue development [53].
Generally, the function of transcription factors can be predicted according to the cis-elements identified from their promoter. Similar to the trait of TIFY gene expression in many species that the JAZ subfamily genes are usually expressed at a high level [9,20,33], here we also found that JAZ genes (except for Hv_MoJAZ2, Hv_MoJAZ3 and Hv_MoJAZ13) displayed a relatively high level of expression in most examined tissues. In particular, Hv_MoJAZ1, Hv_MoJAZ4 and Hv_MoJAZ7 were highly expressed in all examined tissues, and the promoter of these genes had stress-response elements: LTRs and G-box elements involved in temperature and light responsiveness, hormone-response elements of the GTCA-motif and the ABRE element involved in MeJA and abscisic acid responsiveness. Meanwhile, Hv_MoJAZ5, Hv_MoJAZ6, Hv_MoJAZ8, Hv_MoJAZ9, Hv_MoJAZ11, Hv_MoJAZ12 and Hv_MoJAZ14 exhibited high expression levels in the reproductive organs and root tissues, and multiple cis-elements, mainly related to the stress response, phytohormones and plant growth and development, were detected from the promoter regions of these genes. Based on these identified cis-regulatory elements, we could infer that these barley JAZ genes may be involved in the response to varieties of stresses, multiple hormones response processes and the growth and development of reproductive organs and root system in barley.
Barley inevitably encounters diverse stresses during its growth and development, especially the threats of spring cold stress and spot blotch disease during the growth process. Cold stress generally causes positive feedback which generates, together with gene expression, fluctuations in plants. In response to low temperatures, diverse plant species increase their freezing tolerance to a varying degree via a vast reprogramming of gene expression [54]. As transcription factors, TIFYs play crucial roles in the regulation of cold tolerance in plants. Studies have shown that JAZ proteins are generally negative regulators of freezing stress tolerance [55]. JAZ1 and JAZ4 physically interacted with ICE1/2, a core component of the cold-induced ICE-CBF-COR pathway, inhibiting the activation of ICE1/2 and its downstream genes, thereby negatively altering cold tolerance in Arabidopsis [22]. In rice, the interaction between OsMYB30 and OsJAZ9 could suppress the expression of BMY genes, thus negatively regulating cold tolerance [56]. In apples, both JAZ and MIEL1 proteins interacted with MdBBX37 to impair the activation of MdBBX37, thus destroying the BBX37–ICE1 complex and reducing the cold stress tolerance [57]. In addition, MdJAZ1 and MdJAZ2 negatively modulated JA-mediated cold tolerance in apples through the JAZ-ABI4-ICE1-CBF regulatory cascade [58]. In this study, we found that the expressions of Hv_MoZML2 and Hv_MoJAZ12 were upregulated and maintained at a higher level during the whole freezing treatment process compared with the normal growth temperature, and six JAZ subfamily genes (Hv_MoJAZ1, Hv_MoJAZ4, Hv_MoJAZ6, Hv_MoJAZ9, Hv_MoJAZ11 and Hv_MoJAZ14) showed upregulated expression induced by cold stress only at a specific stage. These genes are valuable candidate genes for genetic improvement of barley freezing tolerance. In view of the fact that the Jas domain is the essential factor in the degradation of JAZ subfamily proteins [15,16,18,59,60], further work is needed to verify the functions of Jas domain proteins in regulating freezing tolerance in barley.
Previous studies have shown that JAZ genes are involved in the process of plant responses to a variety of pathogen infections [9,15,16,61,62,63]. Spot blotch disease incited by Cochliobolus sativus is a serious foliar disease limiting grain yield and malting quality in barley [64,65]. To overcome the existing threat of spot blotch to barley production, exploring resistance genes to spot blotch and breeding resistant varieties should be an effective way to control the disease. In the current study, we analyzed the expression patterns of TIFY genes in barley after spot blotch infection. For 11 upregulated Hv_Morex genes (Hv_MoTIFY, Hv_MoJAZ1, Hv_MoJAZ4, Hv_MoJAZ5, Hv_MoJAZ6, Hv_MoJAZ7, Hv_MoJAZ8, Hv_MoJAZ9, Hv_MoJAZ11, Hv_MoJAZ12 and Hv_MoJAZ14), except for Hv_MoJAZ1 and Hv_MoJAZ4, all of the other nine genes could maintain a relatively higher expression level during the whole process of spot blotch infection compared to the control. It is worth noting that the expression levels of Hv_MoTIFY, Hv_MoJAZ1, Hv_MoJAZ4, Hv_MoJAZ6, Hv_MoJAZ9, Hv_MoJAZ11, Hv_MoJAZ12 and Hv_MoJAZ14 were clearly higher in the initial stage of infection (12 h after inoculation) than in other stages of infection, and the genes of Hv_MoJAZ5, Hv_MoJAZ7 and Hv_MoJAZ8 were expressed at stable levels across the whole infection. These results imply that these 11 Hv_Morex TIFY genes, especially the three stably expressed genes, may be candidate genes in response to spot blotch infection and play specific roles in the process of spot blotch invasion.

5. Conclusions

The barley TIFY family genes were comprehensively and systematically characterized in this study. A total of 21 and 22 nonredundant TIFY family members were genome-widely identified in Hv_Morex and Hv_Barke genomes, respectively. The identified barley TIFY genes could be sorted into three main groups, i.e., TIFY, ZML and JAZ, and the group JAZ could be further divided into six subgroups, with members of the same group or subgroup having a similar gene structure and motif composition. A relatively high frequency of tandem duplication events was detected in barley TIFY family. The molecular evolution analysis revealed that all of the duplicated barley TIFY gene pairs were dominated by intense purifying selection. Cis-elements analysis showed that stress response-related and phytohormone-related elements were present in the promoters of all or most HvTIFY family genes. In silico expression analysis revealed most members of Hv_MorexJAZ group were predominantly expressed in reproductive organs and root tissues, and they were also more involved in the responses to freezing treatment and spot blotch infection than other groups; quite a few HvJAZ genes (Hv_MoJAZ1, Hv_MoJAZ4, Hv_MoJAZ6, Hv_MoJAZ9, Hv_MoJAZ11, Hv_MoJAZ12 and Hv_MoJAZ14) might be associated with barley growth and development and the responses to cold and spot blotch invasion stresses. Therefore, the results of this study lay a foundation for future research related to the functional genomics of barley TIFY family genes.

Supplementary Materials

The following supporting information can be downloaded at https://www.mdpi.com/article/10.3390/agronomy14081663/s1, Table S1: List of the identified TIFY family genes in barley; Table S2: The information of conserved motifs in barley TIFY proteins; Table S3: Analysis of cis-elements in the promoter regions of barley TIFY genes; Table S4: Tandemly and segmentally duplicated barley TIFY gene pairs; Table S5: One-to-one orthologous relationships of TIFY genes between Hv_Morex and other five representative plant species; Table S6: One-to-one orthologous relationships of TIFY genes between Hv_Barke and other five representative plant species; Table S7: The homologous relationships between Hv_Morex and Hv_Barke TIFY gene pairs.

Author Contributions

Conceptualization, J.L.; methodology, J.L. and X.X.; software, J.L. and H.W.; formal analysis, J.L. and Y.Z.; investigation, J.L. and X.X.; resources, J.L.; data curation, J.L., Y.Z. and X.X.; writing—original draft preparation, J.L.; writing—review and editing, J.L. and H.W.; visualization, J.L. and H.W.; supervision, J.L.; funding acquisition, J.L. All authors have read and agreed to the published version of the manuscript.

Funding

This research was funded by the National Natural Science Foundation of China (Grant number 32072608), the Jiangsu Agricultural Science and Technology Independent Innovation Fund (Grant number CX (22) 3175) and the China Scholarship Council (CSC) with File No. 201908320053.

Data Availability Statement

The original contributions presented in the study are included in the article/Supplementary Material; further inquiries can be directed to the corresponding author.

Acknowledgments

The authors thank Nils Stein, M. Timothy Rabanus-Wallace and Awais Muhammad of the Leibniz Institute of Plant Genetics and Crop Plant Research (IPK) group of the Genomics of Genetic Resources (GGR), Germany, for their guidance in the process of data analysis.

Conflicts of Interest

The authors declare no conflicts of interest.

Abbreviations

TFTranscription factor
AAAmino acids
MWMolecular weight
pIIsoelectric point
CDSCoding sequences
MSAMultiple sequence alignments
AREAnaerobic induction element
LTRLow-temperature responsiveness element
MBSMYB binding site
ABREAbscisic acid responsiveness
chrChromosome
kDaKilodaltons
KaNonsynonymous
KsSynonymous
JAJasmonic acid
JAZJasmonate ZIM-Domain
ZIM/ZMLZinc-finger inflorescence meristem/ZIM-like
PPDPEAPOD
CCTCONSTANS, CO-like and TOC1
BLASTBasic local alignment search tool
HMMHidden Markov model

References

  1. Vanholme, B.; Grunewald, W.; Bateman, A.; Kohchi, T.; Gheysen, G. The TIFY family previously known as ZIM. Trends Plant Sci. 2007, 12, 239–244. [Google Scholar] [CrossRef] [PubMed]
  2. Bai, Y.H.; Meng, Y.J.; Huang, D.L.; Qi, Y.H.; Chen, M. Origin and evolutionary analysis of the plant-specific TIFY transcription factor family. Genomics 2011, 98, 128–136. [Google Scholar] [CrossRef]
  3. Nishii, A.; Takemura, M.; Fujita, H.; Shikata, M.; Yokota, A.; Kohchi, T. Characterization of a novel gene encoding a putative single zinc-finger protein, ZIM, expressed during the reproductive phase in Arabidopsis thaliana. Biosci. Biotechnol. Biochem. 2000, 64, 1402–1409. [Google Scholar] [CrossRef]
  4. Xia, W.; Yu, H.; Cao, P.; Luo, J.; Wang, N. Identification of TIFY family genes and analysis of their expression profiles in response to phytohormone treatments and Melampsora larici-populina infection in poplar. Front. Plant Sci. 2017, 8, 493. [Google Scholar] [CrossRef] [PubMed]
  5. Shikata, M.; Matsuda, Y.; Ando, K.; Nishii, A.; Takemura, M.; Yokota, A.; Kohchi, T. Characterization of Arabidopsis ZIM, a member of a novel plant-specific GATA factor gene family. J. Exp. Bot. 2004, 55, 631–639. [Google Scholar] [CrossRef]
  6. Staswick, P.E. JAZing up jasmonate signaling. Trends Plant Sci. 2008, 13, 66–71. [Google Scholar] [CrossRef]
  7. Chico, J.M.; Chini, A.; Fonseca, S.; Solano, R. JAZ repressors set the rhythm in jasmonate signaling. Curr. Opin. Plant Biol. 2008, 11, 486–494. [Google Scholar] [CrossRef] [PubMed]
  8. Chung, H.S.; Niu, Y.J.; Browse, J.; Howe, G.A. Top hits in contemporary JAZ: An update on jasmonate signaling. Phytochemistry 2009, 70, 1547–1559. [Google Scholar] [CrossRef]
  9. He, X.; Kang, Y.; Li, W.; Liu, W.; Xie, P.; Liao, L.; Huang, L.; Yao, M.; Qian, L.; Liu, Z.; et al. Genome-wide identification and functional analysis of the TIFY gene family in the response to multiple stresses in Brassica napus L. BMC Genom. 2020, 21, 1–13. [Google Scholar] [CrossRef]
  10. White, D.W. PEAPOD regulates lamina size and curvature in Arabidopsis. Proc. Natl. Acad. Sci. USA 2006, 103, 13238–13243. [Google Scholar] [CrossRef]
  11. Baekelandt, A.; Pauwels, L.; Wang, Z.; Li, N.; De Milde, L.; Natran, A.; Vermeersch, M.; Li, Y.; Goossens, A.; Inzé, D.; et al. Arabidopsis leaf flatness is regulated by PPD2 and NINJA through repression of CYCLIN D3 genes. Plant Physiol. 2018, 178, 217–232. [Google Scholar] [CrossRef] [PubMed]
  12. Zhu, Y.; Luo, X.; Liu, X.; Wu, W.; Cui, X.; He, Y.; Huang, J. Arabidopsis PEAPODs function with LIKE HETEROCHROMATIN PROTEIN1 to regulate lateral organ growth. J. Integr. Plant Biol. 2020, 62, 812–831. [Google Scholar] [CrossRef]
  13. Cai, Q.; Yuan, Z.; Chen, M.; Yin, C.; Luo, Z.; Zhao, X.; Liang, W.; Hu, J.; Zhang, D. Jasmonic acid regulates spikelet development in rice. Nat. Commun. 2014, 5, 3476. [Google Scholar] [CrossRef] [PubMed]
  14. Hakata, M.; Kuroda, M.; Ohsumi, A.; Hirose, T.; Nakamura, H.; Muramatsu, M.; Ichikawa, H.; Yamakawa, H. Overexpression of a rice TIFY gene increases grain size through enhanced accumulation of carbohydrates in the stem. Biosci. Biotechnol. Biochem. 2012, 76, 2129–2134. [Google Scholar] [CrossRef]
  15. Chini, A.; Fonseca, S.; Fernandez, G.; Adie, B.; Chico, J.M.; Lorenzo, O.; García-Casado, G.; López-Vidriero, I.; Lozano, F.M.; Ponce, M.R.; et al. The JAZ family of repressors is the missing link in jasmonate signalling. Nature 2007, 448, 666–671. [Google Scholar] [CrossRef]
  16. Thines, B.; Katsir, L.; Melotto, M.; Niu, Y.; Mandaokar, A.; Liu, G.; Nomura, K.; He, S.Y.; Howe, H.A.; Browse, J. JAZ repressor proteins are targets of the SCFCOI1 complex during jasmonate signalling. Nature 2007, 448, 661–665. [Google Scholar] [CrossRef]
  17. Yan, Y.; Stolz, S.; Chételat, A.; Reymond, P.; Pagni, M.; Dubugnon, L.; Farmer, E.E. A downstream mediator in the growth repression limb of the jasmonate pathway. Plant Cell 2007, 19, 2470–2483. [Google Scholar] [CrossRef]
  18. Chung, H.S.; Howe, G.A. A critical role for the TIFY motif in repression of jasmonate signaling by a stabilized splice variant of the JASMONATE ZIM-domain protein JAZ10 in Arabidopsis. Plant Cell 2009, 21, 131–145. [Google Scholar] [CrossRef] [PubMed]
  19. Meng, L.; Zhang, T.; Geng, S.; Scott, P.B.; Li, H.; Chen, S. Comparative proteomics and metabolomics of JAZ7-mediated drought tolerance in Arabidopsis. J. Proteom. 2019, 196, 81–91. [Google Scholar] [CrossRef]
  20. Ye, H.; Du, H.; Tang, N.; Li, X.; Xiong, L. Identification and expression profiling analysis of TIFY family genes involved in stress and phytohormone responses in rice. Plant Mol. Biol. 2009, 71, 291–305. [Google Scholar] [CrossRef]
  21. Seo, J.S.; Joo, J.; Kim, M.J.; Kim, Y.K.; Nahm, B.H.; Song, S.I.; Cheong, J.J.; Lee, J.S.; Kim, J.K.; Choi, Y.D. OsbHLH148, a basic helix-loop-helix protein, interacts with OsJAZ proteins in a jasmonate signaling pathway leading to drought tolerance in rice. Plant J. 2011, 65, 907–921. [Google Scholar] [CrossRef] [PubMed]
  22. Hu, Y.; Jiang, L.; Wang, F.; Yu, D. Jasmonate regulates the inducer of CBF expression-c-repeat binding factor/DRE binding factor1 cascade and freezing tolerance in Arabidopsis. Plant Cell 2013, 25, 2907–2924. [Google Scholar] [CrossRef] [PubMed]
  23. Sun, H.; Chen, L.; Li, J.; Hu, M.; Ullah, A.; He, X.; Yang, X.; Zhang, X. The JASMONATE ZIM-domain gene family mediates JA signaling and stress response in cotton. Plant Cell Physiol. 2017, 58, 2139–2154. [Google Scholar] [CrossRef] [PubMed]
  24. Zhu, D.; Li, R.; Liu, X.; Sun, M.; Wu, J.; Zhang, N.; Zhu, Y. The positive regulatory roles of the TIFY10 proteins in plant responses to alkaline stress. PLoS ONE 2014, 9, e111984. [Google Scholar] [CrossRef] [PubMed]
  25. Peethambaran, P.K.; Glenz, R.; Höninger, S.; Shahinul Islam, S.M.; Hummel, S.; Harter, K.; Kolukisaoglu, Ü.; Meynard, D.; Guiderdoni, E.; Nick, P.; et al. Salt-inducible expression of OsJAZ8 improves resilience against salt-stress. BMC Plant Biol. 2018, 18, 311. [Google Scholar] [CrossRef] [PubMed]
  26. Chung, H.S.; Koo, A.J.; Gao, X.; Jayanty, S.; Thines, B.; Jones, A.D.; Howe, G. Regulation and function of Arabidopsis JASMONATE ZIM-domain genes in response to wounding and herbivory. Plant Physiol. 2008, 146, 952–964. [Google Scholar] [CrossRef] [PubMed]
  27. Jing, Y.; Liu, J.; Liu, P.; Ming, D.; Sun, J. Overexpression of TaJAZ1 increases powdery mildew resistance through promoting reactive oxygen species accumulation in bread wheat. Sci. Rep. 2019, 9, 5691. [Google Scholar] [CrossRef] [PubMed]
  28. Demianski, A.J.; Chung, K.M.; Kunkel, B.N. Analysis of Arabidopsis JAZ gene expression during Pseudomonas syringae pathogenesis. Mol. Plant Pathol. 2012, 13, 46–57. [Google Scholar] [CrossRef] [PubMed]
  29. Taniguchi, S.; Hosokawa-Shinonaga, Y.; Tamaoki, D.; Yamada, S.; Akimitsu, K.; Gomi, K. Jasmonate induction of the monoterpene linalool confers resistance to rice bacterial blight and its biosynthesis is regulated by JAZ protein in rice. Plant Cell Environ. 2014, 37, 451–461. [Google Scholar] [CrossRef]
  30. Jayakodi, M.; Padmarasu, S.; Haberer, G.; Bonthala, V.S.; Gundlach, H.; Monat, C.; Lux, T.; Kamal, N.; Lang, D.; Himmelbach, A.; et al. The barley pan-genome reveals the hidden legacy of mutation breeding. Nature 2020, 588, 284–289. [Google Scholar] [CrossRef]
  31. Xie, S.; Cui, L.; Lei, X.; Yang, G.; Li, J.; Nie, X.; Ji, W. The TIFY gene family in wheat and its progenitors: Genome-wide identification, evolution and expression analysis. Curr. Genom. 2019, 20, 371–388. [Google Scholar] [CrossRef]
  32. Singh, P.; Mukhopadhyay, K. Comprehensive molecular dissection of TIFY transcription factors reveal their dynamic responses to biotic and abiotic stress in wheat (Triticum aestivum L.). Sci. Rep. 2021, 11, 9739. [Google Scholar] [CrossRef] [PubMed]
  33. Zhang, L.; You, J.; Chan, Z. Identification and characterization of TIFY family genes in Brachypodium distachyon. J. Plant Res. 2015, 128, 995–1005. [Google Scholar] [CrossRef]
  34. Heidari, P.; Faraji, S.; Ahmadizadeh, M.; Ahmar, S.; Mora-Poblete, F. New insights into structure and function of TIFY genes in Zea mays and Solanum lycopersicum: A genome-wide comprehensive analysis. Front. Genet. 2021, 12, 657970. [Google Scholar] [CrossRef]
  35. Du, Q.; Fang, Y.; Jiang, J.; Chen, M.; Li, X.; Xin, X. Genome-wide identification and characterization of the JAZ gene family and its expression patterns under various abiotic stresses in Sorghum bicolor. J. Integr. Agric. 2022, 21, 3540–3555. [Google Scholar] [CrossRef]
  36. Shrestha, K.; Huang, Y. Genome-wide characterization of the sorghum JAZ gene family and their responses to phytohormone treatments and aphid infestation. Sci. Rep. 2022, 12, 3238. [Google Scholar] [CrossRef]
  37. Katoh, K.; Standley, D.M. MAFFT multiple sequence alignment software version 7: Improvements in performance and usability. Mol. Biol. Evol. 2013, 30, 772–780. [Google Scholar] [CrossRef]
  38. Letunic, I.; Bork, P. Interactive tree of life (iTOL) v4: Recent updates and new developments. Nucleic Acids Res. 2019, 47, 256–259. [Google Scholar] [CrossRef] [PubMed]
  39. Bailey, T.L.; Boden, M.; Buske, F.A.; Frith, M.; Grant, C.E.; Clementi, L.; Ren, J.; Li, W.W.; Noble, W.S. MEME SUITE: Tools for motif discovery and searching. Nucleic Acids Res. 2009, 37, 202–208. [Google Scholar] [CrossRef]
  40. Chen, C.; Chen, H.; Zhang, Y.; Thomas, H.R.; Frank, M.H.; He, Y.; Xia, R. TBtools: An integrative toolkit developed for interactive analyses of big biological data. Mol. Plant 2020, 13, 1194–1202. [Google Scholar] [CrossRef]
  41. Lescot, M.; Dehais, P.; Thijs, G.; Marchal, K.; Moreau, Y.; Van de Peer, Y.; Rouzé, P.; Rombauts, S. Plant-CARE, a database of plant cis-acting regulatory elements and a portal to tools for in silico analysis of promoter sequences. Nucleic Acids Res. 2002, 30, 325–327. [Google Scholar] [CrossRef] [PubMed]
  42. Wang, D.; Zhang, Y.; Zhang, Z.; Zhu, J.; Yu, J. KaKs_Calculator 2.0: A toolkit incorporating gamma-series methods and sliding window strategies. Genom. Proteom. Bioinform. 2010, 8, 77–80. [Google Scholar] [CrossRef]
  43. Milne, L.; Bayer, M.; Rapazote-Flores, P.; Mayer, C.D.; Waugh, R.; Simpson, C.G. EORNA, a barley gene and transcript abundance database. Sci. Data 2020, 8, 90. [Google Scholar] [CrossRef] [PubMed]
  44. Zhang, Z.; Li, X.; Yu, R.; Han, M.; Wu, Z. Isolation, structural analysis, and expression characteristics of the maize TIFY gene family. Mol. Genet. Genom. 2015, 290, 1849–1858. [Google Scholar] [CrossRef] [PubMed]
  45. Ebel, C.; BenFeki, A.; Hanin, M.; Solano, R.; Chini, A. Characterization of wheat (Triticum aestivum) TIFY family and role of Triticum Durum TdTIFY11a in salt stress tolerance. PLoS ONE 2018, 13, e0200566. [Google Scholar] [CrossRef]
  46. Tang, C.; Zhu, X.; Qiao, X.; Gao, H.; Li, Q.; Wang, P.; Wu, J.; Zhang, S. Characterization of the pectin methyl-esterase gene family and its function in controlling pollen tube growth in pear (Pyrus bretschneideri). Genomics 2020, 112, 2467–2477. [Google Scholar] [CrossRef]
  47. Tao, J.; Jia, H.; Wu, M.; Zhong, W.; Jia, D.; Wang, Z.; Huang, C. Genome-wide identification and characterization of the TIFY gene family in kiwifruit. BMC Genom. 2022, 23, 1–18. [Google Scholar] [CrossRef]
  48. Liu, X.; Yu, F.; Yang, G.; Liu, X.; Peng, S. Identification of TIFY gene family in walnut and analysis of its expression under abiotic stresses. BMC Genom. 2022, 23, 190. [Google Scholar] [CrossRef] [PubMed]
  49. Dai, Z.; Dong, S.; Miao, H.; Liu, X.; Han, J.; Li, C.; Gu, X.; Zhang, S. Genome-wide identification of TIFY genes and their response to various pathogen infections in cucumber (Cucumis sativus L.). Sci. Hortic. 2022, 295, 110814. [Google Scholar] [CrossRef]
  50. Saha, G.; Park, J.I.; Kayum, M.A.; Nou, I.S. A genome-wide analysis reveals stress and hormone responsive patterns of TIFY family genes in Brassica rapa. Front. Plant Sci. 2016, 7, 936. [Google Scholar] [CrossRef]
  51. Cannon, S.B.; Mitra, A.; Baumgarten, A.; Young, N.D.; May, G. The roles of segmental and tandem gene duplication in the evolution of large gene families in Arabidopsis thaliana. BMC Plant Biol. 2004, 4, 10. [Google Scholar] [CrossRef] [PubMed]
  52. Liu, S.; Baute, G.J.; Adams, K.L. Organ and cell type-specific complementary expression patterns and regulatory neofunctionalization between duplicated genes in Arabidopsis thaliana. Genome Biol. Evol. 2011, 3, 1419–1436. [Google Scholar] [CrossRef] [PubMed]
  53. Flagel, L.E.; Wendel, J.F. Gene duplication and evolutionary novelty in plants. New Phytol. 2009, 183, 557–564. [Google Scholar] [CrossRef] [PubMed]
  54. Heidarvand, L.; Amiri, R.M. What happens in plant molecular responses to cold stress? Acta Physiol. Plant. 2010, 32, 419–431. [Google Scholar] [CrossRef]
  55. Hu, T.; Wang, Y.; Wang, Q.; Dang, N.; Wang, L.; Liu, C.; Zhu, J.; Zhan, X. The tomato 2-oxoglutarate-dependent dioxygenase gene SlF3HL is critical for chilling stress tolerance. Hortic. Res. 2019, 6, 45. [Google Scholar] [CrossRef] [PubMed]
  56. Lv, Y.; Yang, M.; Hu, D.; Yang, Z.; Ma, S.; Li, X.; Xiong, L. The OsMYB30 transcription factor suppresses cold tolerance by interacting with a JAZ protein and suppressing β -amylase expression. Plant Physiol. 2017, 173, 1475–1491. [Google Scholar] [CrossRef]
  57. An, J.; Wang, X.; Zhang, X.; You, C.; Hao, Y. Apple B-box protein BBX37 regulates jasmonic acid mediated cold tolerance through the JAZ-BBX37-ICE1-CBF pathway and undergoes MIEL1-mediated ubiquitination and degradation. New Phytol. 2021, 229, 2707–2729. [Google Scholar] [CrossRef] [PubMed]
  58. An, J.; Xu, R.; Liu, X.; Su, L.; Yang, K.; Wang, X.; You, C. Abscisic acid insensitive 4 interacts with ICE1 and JAZ proteins to regulate ABA signaling-mediated cold tolerance in apple. J. Exp. Bot. 2022, 73, 980–997. [Google Scholar] [CrossRef]
  59. Melotto, M.; Mecey, C.; Niu, Y.; Chung, H.S.; Katsir, L.; Yao, J.; Zeng, W.; Thines, B.; Staswick, P.; Browse, J.; et al. A critical role of two positively charged amino acids in the Jas motif of Arabidopsis JAZ proteins in mediating coronatineand jasmonoyl isoleucine-dependent interactions with the COI1F-box protein. Plant J. 2008, 55, 979–988. [Google Scholar] [CrossRef]
  60. Kazan, K.; Manners, J.M. JAZ repressors and the orchestration of phytohormone crosstalk. Trends Plant Sci. 2012, 17, 22–31. [Google Scholar] [CrossRef]
  61. Zhang, X.; Ran, W.; Zhang, J.; Ye, M.; Lin, S.; Li, X.; Sultana, R.; Sun, X. Genome-wide identification of the Tify gene family and their expression profiles in response to biotic and abiotic stresses in tea plants (Camellia sinensis). Int. J. Mol. Sci. 2020, 21, 8316. [Google Scholar] [CrossRef] [PubMed]
  62. Thatcher, L.F.; Cevik, V.; Grant, M.; Zhai, B.; Jones, J.D.; Manners, J.M.; Kazan, K. Characterization of a JAZ7 activation-tagged Arabidopsis mutant with increased susceptibility to the fungal pathogen Fusarium oxysporum. J. Exp. Bot. 2016, 67, 2367–2386. [Google Scholar] [CrossRef] [PubMed]
  63. Liu, X.; Zhao, C.; Yang, L.; Zhang, Y.; Wang, Y.; Fang, Z.; Lv, H. Genome-wide identification, expression profile of the TIFY gene family in Brassica oleracea var. capitata, and their divergent response to various pathogen infections and phytohormone treatments. Genes 2020, 11, 127. [Google Scholar] [CrossRef]
  64. Kumar, D.; Chand, R.; Prasad, L.C.; Joshi, A.K. A new technique for monoconidial culture of the most aggressive isolate in a given population of Bipolaris sorokiniana, cause of foliar spot blotch in wheat and barley. World J. Microbiol. Biotechnol. 2007, 23, 1647–1651. [Google Scholar] [CrossRef]
  65. Hoffman, E.; Viega, L.; Glison, N.; Castro, A.; Pereyra, S.; Perez, C. Differential effects of spot blotch on photosynthesis and grain yield in two barley cultivars. Eur. J. Plant Pathol. 2014, 139, 471–480. [Google Scholar] [CrossRef]
Figure 1. Maximum likelihood phylogenetic relationships of the TIFY proteins from barley, A. thaliana and O. sativa.
Agronomy 14 01663 g001
Figure 2. Phylogenetic relationships, gene structure and conserved protein motifs in barley TIFY family. (A) The phylogenetic tree of barley TIFY proteins. (B) Exon–intron structure and the characteristic domain distribution of barley TIFY genes. (C) The motif composition of barley TIFY proteins.
Agronomy 14 01663 g002
Figure 3. Sequence alignment of the barley TIFY and Jas domain and the conserved sequence logos of the barley TIFY family member. (A) Multiple sequence alignments of barley TIFY family members. (B) Consensus sequence logos of TIFY and Jas domain sequences. The red box indicates the conserved domain of HvTIFY family members, and the highlighted blocks in red show a 100% amino acid identity to each other for HvTIFY members.
Agronomy 14 01663 g003
Figure 4. Distribution of the HvTIFY genes on barley chromosomes. (A) The gene distribution on Hv_Morex chromosomes. (B) The gene distribution on Hv_Barke chromosomes. The tandem gene duplication is shown by the red font. The chromosome numbers are indicated at the left side of each chromosome image. The scale on the left is in million bases (Mb).
Agronomy 14 01663 g004
Figure 5. Collinear region of the barley TIFY genes. (A) The collinear result of the Hv_Morex TIFY genes. (B) The collinear result of the Hv_Barke TIFY genes. All collinear blocks are shown with colored lines in the Hv_Morex or Hv_Barke genome, and segmental duplications are represented with red lines. Chromosome numbers are indicated at the center of each chromosome.
Agronomy 14 01663 g005
Figure 6. Synteny relationships between Hv_Morex and A. thaliana, B. distachyon, O. sativa, S. bicolor and S. italica TIFY family genes. The collinear blocks within Hv_Morex and other plant genomes are shown in gray lines in the background, while the syntenic TIFY gene pairs are highlighted in red lines.
Agronomy 14 01663 g006
Figure 7. Synteny relationships between Hv_Barke and A. thaliana, B. distachyon, O. sativa, S. bicolor and S. italica TIFY family genes. The collinear blocks within Hv_Barke and other plant genomes are shown in gray lines in the background, while the syntenic TIFY gene pairs are highlighted in red lines.
Agronomy 14 01663 g007
Figure 8. Synteny relationships of TIFY genes between two different barley genotypes. The collinear blocks within Hv_Morex and Hv_Barke genomes are shown in gray lines in the background, while the syntenic TIFY gene pairs are highlighted in red lines.
Agronomy 14 01663 g008
Figure 9. Expression patterns of Hv_Morex TIFY genes in twelve different tissues.
Agronomy 14 01663 g009
Figure 10. Expression patterns of Hv_Morex TIFY genes under cold stress. Control represents samples before normal temperature or cold temperature treatment. The labels 18C_2h, 18C_24h and 4C_2h, 4C_24h represent hours after normal temperature (18 °C) or cold temperature (4 °C) treatment.
Agronomy 14 01663 g010
Figure 11. Expression patterns of Hv_Morex TIFY genes in the process of spot blotch invasion. Water_control_12h, Water_control_24h and Water_control_36h represent hours post spraying with water, and Spot_blotch_INOC_12h, Spot_blotch_INOC_24h and Spot_blotch_INOC_36h indicate hours post inoculation with spot blotch.
Agronomy 14 01663 g011
Disclaimer/Publisher’s Note: The statements, opinions and data contained in all publications are solely those of the individual author(s) and contributor(s) and not of MDPI and/or the editor(s). MDPI and/or the editor(s) disclaim responsibility for any injury to people or property resulting from any ideas, methods, instructions or products referred to in the content.

