Abstract
Crop straw returning to the field is an effective practice for straw utilization to improve soil fertility and sustain crop productivity. However, little information is available about the long-term effects of paddy straw return on soil properties and rice yield under a double-rice system. The objectives of this study were to test the hypothesis of the effects of different amounts of paddy straw returned to the field on soil physicochemical properties and rice yield, and to clarify the correlation between crop yield and soil physicochemical properties as well as quick-acting nutrients under different straw-returning modes. The experiment, initiated in the 2005 rice season, utilized “Xiang 45” and “Xiang 13” long-grained rice cultivars within a double-season rice cropping system. Three straw-returning treatments were implemented: rotary tillage with full rice straw incorporation (RTS), incorporation of one-third of the rice straw (1/3RTS), and incorporation of two-thirds of the rice straw (2/3RTS). This study found that among the three straw return rates, 2/3RTS had the most significant impact on soil physicochemical properties. Soil nitrogen content was identified as a crucial factor influencing soil organic carbon (SOC) accumulation, while pH levels significantly affected rice yield. Straw incorporation effectively increased the content and stocks of SOC.
1. Introduction
As the preeminent global producer of agricultural residue, China annually contributes nearly one-fifth of the world’s total crop residue output [1]. The prevalent practices of crop residue removal and open-field burning in China have led to a notable decline in soil organic matter, alongside widespread emissions of greenhouse gases and the squandering of valuable straw resources [2]. Furthermore, the pervasive burning of crop residues exacerbates air pollution, posing additional risks to human health [3]. Consequently, effectively managing these agricultural residues is a paramount challenge.
One of the pivotal strategies for the comprehensive utilization of crop residues is their incorporation into the soil, commonly known as straw incorporation. This approach plays a crucial role in mitigating greenhouse gas emissions, thereby representing an economically viable and sustainable solution [4,5].
Soil degradation is a global environmental predicament, imperiling food security and exacerbating climate change [6]. The magnitude of anthropogenic-induced soil degradation is estimated to encompass approximately 2 billion ha worldwide [7]. Soil organic carbon (SOC), a linchpin determinant of soil quality and functionality, experiences a decline, resulting in soil degradation, accentuating the urgency of strategies to encourage SOC stocks and assuage soil degradation [8]. Extensive empirical investigations underscored the beneficial effects of straw incorporation on crop yield enhancement, SOC enrichment, and soil nutrient replenishment [7]. Moreover, straw incorporation is a pivotal conduit for organic carbon input into the soil, harboring substantial potential for SOC sequestration and playing a crucial role in soil carbon dynamics [9,10].
Beyond its direct influence on carbon input into the soil, straw incorporation profoundly impacts soil physicochemical properties and crop productivity [11]. The burial of straw significantly increases SOC, total nitrogen, soil available phosphorus, and soil available potassium content [12]. Empirical evidence unequivocally underscores the pivotal role of straw incorporation in augmenting crop yields. Notably, in subtropical regions of China, substituting straw and analogous crop residues for a substantial proportion of inorganic fertilizers sustains or even augments rice yields [13]. Mechanistically, straw incorporation prompts noticeable alterations in soil physicochemical attributes, engendering elevated levels of surface SOC under no-tillage regimes with retained grain residues [14]. Moreover, residue-retaining no-tillage practices mitigate soil pH in surface and subsurface layers relative to conventional tillage practices, with crop residue incorporation exhibiting substantial potential for enhancing soil nitrogen retention [15]. Additionally, straw incorporation exerts distinct impacts on soil nitrogen, phosphorus, potassium availability, and other soil fertility indices [16]. Furthermore, crop residue incorporation engenders improvements in soil physical properties, such as augmented soil water content, reduced bulk density, and increased total porosity, thereby ameliorating soil structure and functionality [17,18].
Integrating different straw return rates with appropriate tillage methods is crucial for optimizing soil nutrient enhancement [19]. Improper straw application can harm the soil environment and reduce crop productivity [20]. Higher rates of straw return can extend the decomposition time, consuming more available nitrogen in the soil and ultimately impacting crop growth. Excessive straw accumulation may increase soil porosity, leading to more significant water and nutrient loss. Additionally, straw return provides an environment conducive to the growth, reproduction, and accumulation of pathogens, making it a primary cause of soil-borne diseases [21]. Furthermore, providing a favorable habitat with straw, especially under shallow tillage conditions, can exacerbate plant pest and disease infestations [22].
Rice constitutes the dietary staple for nearly half of the global populace, predominantly across Asian terrains [23]. As the global rice producer, China commands approximately one-fifth of the global rice cultivation expanse, spanning nearly one-quarter of China’s arable terrain [24]. The prevalence of double-season rice cultivation is noteworthy, commanding a majority share of China’s rice cultivation expanse annually.
Previous research suggested that judicious agronomic practices encompassing tillage management, straw management, nitrogen fertilization, and organic fertilization could significantly improve soil carbon sequestration in rice paddies [25,26]. Conservation tillage, featuring reduced tillage, no-tillage, and straw incorporation, curtails soil disturbances while augmenting surface cover, thereby influencing farmland soil physicochemical attributes [27]. Protective tillage methodologies have widespread endorsement globally, with increasing adoption in rice paddies. Most studies indicated that within an optimal range, SOC content increased with the amount of straw return [28,29]. Conversely, some research has observed that organic matter content initially increased and then decreased with increasing straw return rates [30]. Nevertheless, the straw return methods commonly employed in modern rice rotation systems engender numerous adverse effects on soil fertility, as well as crop yield levels and enhancements.
Relative to conventional tillage, the impacts of conservation tillage on soil physicochemical attributes and yield enhancements in double-season rice regions remain insufficiently elucidated, with limited pragmatic investigations in this domain. Against this backdrop, this present study endeavors to discern the effects of varied straw incorporation rates on soil physicochemical attributes; available nutrient reserves; final rice yields, particularly in double-season rice cultivation; and economic viability through protracted field trials. Such endeavors seek to delineate optimal straw incorporation rates and elucidate their underlying mechanisms, furnishing a theoretical framework for developing scientifically sound and sustainable straw incorporation practices.
2. Materials and Methods
2.1. Site and Soil Sampling
The present experiment constitutes a long-term conservation tillage positioning trial located at the demonstration base in Ningxiang City, Changsha, Hunan Province, China (112°18′ E, 28°07′ N). The region falls within the Yangtze River Basin’s typical double-season rice planting area, characterized by a subtropical monsoon climate. The experiment field, featuring soil types typical of paddy fields developed from Quaternary red soil, was established in 2005 [31]. Soil samples from the plow layer (0–20 cm) were collected before the experiment to determine the soil’s fundamental physicochemical properties (refer to Table 1 for details).

Table 1.
Basic physical and chemical characteristics of the experimental soil prior to the experiment (0–20 cm soil layers).
2.2. Experimental Design
This study utilizes a randomized complete block design with three distinct treatments: (1) RTS, where all straw is incorporated into the field and rototilled four times to a depth of approximately 10 cm after rice harvesting; (2) 1/3 RTS, where two-thirds of the straw is removed and the remaining straw is rototilled four times to a depth of approximately 10 cm; and (3) 2/3 RTS, where one-third of the straw is removed and the remaining straw is rototilled four times to a depth of approximately 10 cm.
Each treatment is replicated thrice, resulting in nine plots covering an area of 66.7 m2. The predominant cropping pattern within the experimental area is double-season rice cultivation. Early rice (cultivar “Xiangzao Xian 45”) was sown in April and harvested in July, with a seeding rate of 120 kg/ha. Late rice (cultivar “Xiangwan Xian 13”) was sown post-harvest of early rice in July and harvested in October, with a seeding rate of 90 kg/ha. Since 1990, rotary tillage has been the predominant tillage management approach within the research domain [32]. Apart from tillage management, all other agronomic practices adhere to local agricultural practices, with uniform practices maintained across varying treatments. Weed control is achieved by applying 1.5 kg/ha of herbicide. Irrigation of rice crops is tailored according to seasonal precipitation patterns, ensuring a field water depth of approximately 3 cm for twenty days during the seedling stage, around five days during the tillering and panicle initiation stages, and three days during the grain-filling stage, cumulatively totaling approximately thirty-three days. Pre-transplanting, early rice receives 600 kg/ha of rice-specific compound fertilizer (N:P2O5:K2O = 20:10:10) as basal fertilizer, supplemented by a top dressing of 75 kg/ha of urea. Similarly, late rice is fertilized with 600 kg/ha of rice-specific compound fertilizer (N:P2O5:K2O = 18:5:6) before transplanting, followed by a topdressing of 52.5 kg/ha of urea post-transplanting.
2.3. Soil Physicochemical Properties
- Soil bulk density
The soil bulk density was determined using the ring knife method, which utilized a ring volume of 100 cm3. Given the enhanced precision in assessing the impact of diverse cultivation practices on SOC sequestration through collecting deep soil samples [33], soil specimens were procured from various layers within the 0–50 cm depth range using the ring knife [34], facilitating the computation of soil bulk density using a prescribed formula.
where BD denotes the soil bulk density (g cm−3), and W1 represents the total mass of the soil after drying and the mass of the ring knife (g). Following the pouring out of the dried soil and the cleaning of any residual soil from the inner surface of the ring knife using a blade, the ring knife is weighed, with W2 indicating its mass (g). V signifies the volume of the ring knife (cm3).
- Soil organic carbon
Determining stratified SOC was adopted through the potassium dichromate (K2Cr2O7) titration (dilution heat method). In the presence of an excess of sulfuric acid, organic carbon in the soil is oxidized using the oxidizing agent potassium dichromate. The remaining oxidizing agent is titrated back with a standard ferrous sulfate solution to quantify the consumed organic carbon.
where SOC0–50 represents the SOC content in the 0–50 cm soil layer; SOCi refers to the SOC content (g kg−1) in the i-soil layer; Mi denotes the mass of the i-soil layer (Mg ha−1); i represents the soil layers at 0–5, 5–10, 10–20, 20–30, and 30–50 cm; and M0–50 signifies the soil mass in the 0–50 cm layer.
The SOC stock in different layers is the sum of the SOC stocks in each layer plus the SOC stored in the increased soil mass [35]. Using Equation (3), the soil mass in different layers can be calculated. The maximum soil mass under different treatments is taken as the reference soil mass, and the SOC stock was calculated using Equation (4).
In the equation, represents the mass of the i-soil layer (Mg ha−1); ρb,i denotes the bulk density of the soil (g cm−3), with unit conversion to Mg m−3; Ti is the thickness of the i-soil layer (m); and 10,000 is the conversion factor for the area unit from m2 to ha.
where Melement represents the equal-mass SOC storage (Mg ha−1), Msoil,i is as defined in Equation (3), and Mo,i denotes the reference soil mass of the i layer. In this study, the maximum soil mass across different treatments for each layer was selected as the reference value (Mg ha−1). The variable i takes the values 1, 2, 3, 4, and 5, representing the soil layers at depths of 0–5, 5–10, 10–20, 20–30, and 30–50 cm, respectively. The terms conci and conci+1 denote the SOC content (g kg−1) of the i and i + 1 layers, respectively. The value 0.001 is the conversion coefficient from kg to Mg.
- Available phosphorus
The soil available phosphorus was determined using the 0.5 mol L−1 NaHCO3 extraction method. Dry soil samples passing through a 20-mesh sieve were precisely weighed at 2.5 g (with an accuracy of 0.001 g) into 150 mL Erlenmeyer flasks. Subsequently, 50 mL of 0.5 mol·L−1 NaHCO3 solution was added to each flask, followed by a spoonful of phosphate-free activated carbon. The flasks were tightly sealed with stoppers and placed on a shaker for 30 min. After agitation, the mixtures were promptly filtered using phosphate-free filter paper, and the filtrate was collected in 100 mL Erlenmeyer flasks. A 10 mL aliquot of the filtrate was transferred to separate 150 mL Erlenmeyer flasks, followed by adding 35 mL of distilled water using a pipette. Subsequently, 5 mL of molybdenum antimony anti-reagent was added to each flask with a transfer pipette, and the contents were shaken thoroughly before being allowed to stand for 30 min. Following incubation, colorimetry was performed at a wavelength of 700 nm.
- Available potassium
The soil’s available potassium was determined using the NH4OAc extraction method followed by flame photometry. Initially, NH4OAc 7.09 g was precisely weighed and diluted with water to nearly 1 L. The solution was then adjusted to pH 7.0 using HOAc. Subsequently, KCl was accurately weighed at 0.1907 g and dissolved in 1 mol·L−1 NH4OAc solution. Simultaneously, aliquots of this 100 g mL−1 K standard solution were accurately pipetted into 100 mL volumetric flasks, respectively. Each flask was then filled with 1 mol·LNH4OAc solution to the mark, yielding standard series solutions.
Next, 5.00 g of air-dried soil passing through a 1 mm sieve was weighed into a 100 mL Erlenmeyer flask or a large test tube. Subsequently, 50 mL of neutral NH4OAc solution was added, and the flask was covered and shaken for 30 min. The resulting mixture was then filtered using dry ordinary qualitative filter paper, and the filtrate was collected in a small Erlenmeyer flask. The filtrate and the potassium standard series solutions were measured using a flame photometer. The readings on the photometer were recorded, and the concentrations were determined from the standard curve.
- Total nitrogen
Soil total nitrogen determination employs the semi-micro Kjeldahl method. In this procedure, samples are subjected to boiling with concentrated sulfuric acid in the presence of a catalyst. Nitrogen-containing organic compounds undergo intricate high-temperature decomposition reactions, transforming into ammonium sulfate. The liberated ammonia is distilled and absorbed using boric acid, followed by titration with a standard acid solution to ascertain the soil’s total nitrogen content [36].
- pH
Sampling and sieving procedures are conducted on collected soil specimens, followed by the preparation of soil extract. Before the commencement of measurements, the pH electrode is calibrated using pH 4.0 and pH 7.0 calibration buffer solutions to ensure precision and reliability. Subsequently, the pH electrode is immersed into the soil extract, allowing sufficient time to stabilize readings. The pH value is then recorded for analysis.
- Rice Yield
During harvesting early and late rice, three replicates were taken for each treatment from a 1 m2 area of double-season rice. The measured values obtained from these samples were then converted into actual yields.
2.4. Data Analysis
The experimental data were processed as follows: Microsoft Office 2021 was employed for data organization and requisite computations, while Origin 2022 software facilitated regression analysis and graphical representation. One-way ANOVA was executed using SPSS 27.0, with the year as a random factor, to discern disparities in soil physicochemical properties among various sampling seasons and straw return rates. Multiple comparisons were conducted employing Duncan’s new multiple-range test. Parallel Differential Analysis (PDA) was undertaken utilizing Canoco 5.
3. Results
3.1. The Impact of Straw Return Quantity on Soil Physicochemical Properties
In different straw incorporation rates, the total nitrogen content of early rice generally exhibited the order of 2/3RTS > 1/3RTS > RTS (Table 2). In the 5–10 cm and 10–20 cm soil layers of early rice, different straw incorporation rates significantly affected the concentration of total nitrogen (p < 0.001). Similarly, different straw incorporation rates significantly influenced the total nitrogen concentration in the 30–50 cm soil layer (p < 0.05). Furthermore, in both the 20–30 cm and 30–50 cm soil layers, the sampling season significantly impacted the total nitrogen concentration (p < 0.05). Additionally, there was a significant interaction between straw incorporation rates and sampling seasons, particularly affecting the total nitrogen content in the 30–50 cm soil layer (p < 0.05).
Table 2.
Soil physicochemical characteristics under varied levels of straw incorporation in early rice harvest seasons.
Regarding the available phosphorus content in the 0–20 cm soil layer of early rice, a trend of 2/3RTS > 1/3RTS > RTS was observed, contrasting with the trend in the 20–50 cm soil layer, which exhibited 1/3RTS > RTS > 2/3RTS (Table 2). Notably, in both the 10–20 cm and 20–30 cm soil layers, different straw incorporation rates significantly influenced the available phosphorus content (p < 0.001), while the interaction between straw incorporation rates and sampling seasons notably affected the available phosphorus content in the 5–10 cm soil layer (p < 0.001) (Table 2).
Concerning available potassium, no statistically significant differences were observed across all soil layers of early rice. However, in the 0–5 cm and 5–10 cm soil layers of late rice, a trend of 1/3 RTS > 2/3 RTS > RTS was evident, contrasting with the 20–30 cm and 30–50 cm soil layers, which showed a trend of 1/3 RTS > RTS > 2/3 RTS (Table 3). In the 0–5 cm soil layer, sampling seasons and straw incorporation rates significantly affected the available potassium content (p < 0.001), while in the 30–50 cm soil layer, significant impacts were observed for both sampling seasons and straw incorporation rates (p < 0.05). Furthermore, a notable interaction between straw incorporation rates and sampling seasons significantly influenced the potassium content (p < 0.05). Sampling seasons significantly affected available potassium content in the 5–10 cm and 20–50 cm soil layers (p < 0.05).
Table 3.
Soil physicochemical characteristics under varied levels of straw incorporation in late rice harvest seasons.
In all soil layers of early rice, the SOC content of 2/3 RTS was the highest, followed by 1/3 RTS, with RTS exhibiting the lowest SOC content. Different straw incorporation rates significantly influenced the SOC content in the 0–20 cm and 30–50 cm soil layers (p < 0.05). Similarly, sampling seasons significantly impacted the SOC content in the 0–10 cm and 20–50 cm soil layers (p < 0.05). Moreover, a noteworthy interaction effect between straw incorporation rates and sampling seasons significantly affected the SOC content in the 5–10 cm soil layer (p < 0.001) and significantly influenced the SOC content in the 0–5 cm soil layer (p < 0.05).
Regarding soil pH, the 0–5 cm and 5–10 cm soil layers of early rice exhibited a trend of 2/3 RTS > 1/3 RTS > RTS, while the 20–30 cm and 30–50 cm soil layers showed a trend of 1/3 RTS > 2/3 RTS > RTS. Notably, sampling seasons significantly affected the pH of the 5–50 cm soil layers (p < 0.05). Specifically, the 0–10 cm soil layer displayed a trend of 2/3 RTS > 1/3 RTS > RTS, while the 20–50 cm soil layer exhibited a trend of 1/3 RTS > 2/3 RTS > RTS.
Non statistically significant differences were observed in bulk density in the 0–20 cm and 30–50 cm soil layers of early rice. However, in the 20–30 cm soil layer, bulk density under each straw incorporation rate followed the order of 2/3 RTS > RTS > 1/3 RTS. Furthermore, sampling seasons significantly affected the bulk density in the 20–30 cm soil layer (p < 0.05).
3.2. The Impacts of Different Levels of Straw Return on Soil Organic Carbon Storage
Based on the findings presented in Figure 1, it is evident that within the experimental plots of early rice, the organic carbon reserves in the 0–20 cm soil layer under the condition of 2/3 straw incorporation exhibit a statistically significant increase compared to the organic carbon content under the other two straw incorporation conditions (p < 0.05). Conversely, no statistically significant disparity exists in the organic carbon reserves within the 0–20 cm soil layer between the 1/3 straw and full straw incorporation conditions (p > 0.05). In the experimental plots of late rice, no statistically significant differences are observed in the organic carbon content within the 0–20 cm soil layer across all three straw incorporation conditions (p > 0.05).
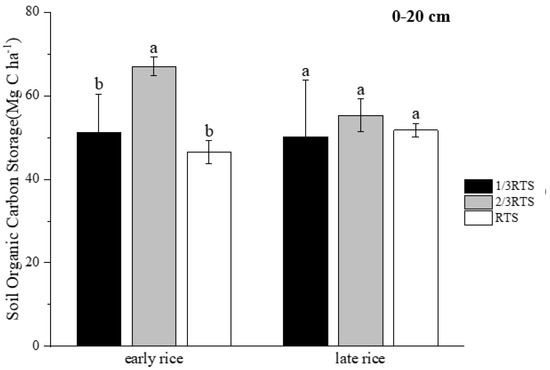
Figure 1.
SOC storage at varied levels of straw incorporation in the 0–20 cm soil layer: 1/3 RTS, 1/3 rice straw incorporated; 2/3 RTS, 2/3 rice straw incorporated; RTS, rice straw incorporated. Distinct lowercase letters indicate significant differences among various tillage and residue management treatments (p < 0.05). Error bars represent the standard error of the mean.
The various levels of straw incorporation exert a notable impact on the organic carbon storage in the 0–50 cm soil layer of early rice (p > 0.05), demonstrating a hierarchical trend of 2/3 RTS > 1/3 RTS > RTS (Figure 2). Similarly, consistent findings with the organic carbon storage in the 0–20 cm soil layer are observed for late rice.
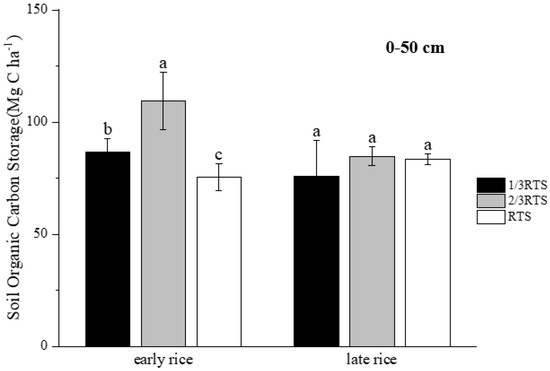
Figure 2.
SOC storage at varied levels of straw incorporation in the 0–50 cm soil layer: 1/3 RTS, 1/3 rice straw incorporated; 2/3 RTS, 2/3 rice straw incorporated; RTS, rice straw incorporated. Different small letters mean the significant differences among tillage and residue management practices (p < 0.05). Error bars, standard error of the mean.
3.3. The Correlation between Crop Yield and Soil Physicochemical Properties
Integrated Analysis of Soil Parameter Correlation with Soil Depth
Based on the correlation matrix, it is evident that in the 0–20 cm soil layer, a highly significant positive correlation exists between organic carbon and total nitrogen content, as well as available phosphorus content, alongside a positive correlation with bulk density. Moreover, a highly significant positive correlation exists between total nitrogen and available phosphorus, potassium, and bulk density (Table 4).
Table 4.
The interrelationship among soil properties in the 0–20 cm soil depth.
Conversely, yield demonstrates a significant positive correlation with pH value but a significant negative correlation with available phosphorus content. Other correlations with yield are relatively weak.
Based on the correlation matrix analysis, it is evident that in the 0–50 cm soil layer, a highly significant positive correlation exists between organic carbon content, total nitrogen content, and available phosphorus content (Table 5).
Table 5.
The interrelationship among soil properties in the 0–50 cm soil depth.
Conversely, organic carbon and available potassium content correlate significantly negatively, a highly significant positive correlation exists between organic carbon and total nitrogen content, as well as available phosphorus content. Additionally, the correlations with other factors are relatively weaker. Moreover, yield demonstrates a significant positive correlation with pH value and available potassium content while exhibiting significant negative correlations with total nitrogen and available phosphorus content.
Principal component analysis was conducted for soil indicators in the 0–20 cm layer, following criteria where the cumulative contribution rate reached 68.245%, and eigenvalues were ≥1 for component selection. Two principal components were derived, with the first component possessing an eigenvalue of 3.035, accounting for 43.361% of the total variance, thus reflecting the most comprehensive information. The second component exhibited an eigenvalue of 1.742, contributing 24.883% to the total variance (Table 6).
Table 6.
Explained variance of 0–20 cm soil layer.
Likewise, principal component analysis was performed for soil indicators in the 0–50 cm layer, adhering to the same stringent criteria of a cumulative contribution rate reaching 64.159% and eigenvalues being ≥1 for component selection. Two principal components were derived, with the first having an eigenvalue of 2.732, explaining 39.029% of the total variance and conveying the most comprehensive information. The second component exhibited an eigenvalue of 1.759, contributing 25.129% to the total variance (Table 7).
Table 7.
Explained variance of 0–50 cm soil layer.
Upon analyzing the loadings, it is discernible that within the 0–20 cm soil stratum, the principal component analysis reveals substantial characteristic vectors of organic carbon, total nitrogen, available potassium, available phosphorus, and bulk density (Table 8). Notably, these vectors exhibit considerable influence on the first principal component, signifying a marked contribution to the physicochemical profile of the soil. This suggests that in soils characterized by elevated organic carbon content, various physicochemical attributes beyond pH are inclined towards augmentation, albeit potentially resulting in a concomitant reduction in yield. Conversely, the vectors associated with yield, pH, and available potassium exhibit significantly greater magnitudes in the second principal component than other parameters. Concurrently, vectors represent available phosphorus, total nitrogen, and organic carbon manifest as negative, indicating that heightened yields correspond to escalated pH and available potassium levels within the 0–20 cm soil stratum. Meanwhile, available phosphorus, total nitrogen, and organic carbon exhibit a decrement.
Table 8.
The parameters of principal component analysis.
In the 0–50 cm soil profile context, the primary principal component underscores substantial characteristic vectors pertinent to organic carbon content, total nitrogen content, and available phosphorus content (Table 8). This underscores their pronounced contribution to the principal component, delineating a scenario where heightened organic carbon content correlates with an array of enhanced physicochemical properties in the soil alongside yield, pH, and available potassium content. Conversely, within the secondary principal component, vectors corresponding to pH, bulk density, and available potassium content are notably pronounced, juxtaposed against a positive vector representing yield. This indicates that within the 0–50 cm soil stratum, escalated levels of available potassium and pH may engender an upward trajectory in yield.
A holistic interpretation of the findings derived from the component matrices of both soil strata intimates that various physicochemical attributes wield paramount influence on yield. Notably, pH, bulk density, and available potassium content evince substantial positive effects, while the availability of shallow soil phosphorus exerts a conspicuous negative impact on yield. Furthermore, when juxtaposed against the broader spectrum of the 0–50 cm soil stratum, the sway of diverse physicochemical attributes on yield within the shallow 0–20 cm soil stratum is notably more pronounced.
3.4. The Primary Regulatory Factors of Crop Yield
Correlation Analysis of Soil Physicochemical Properties and Yield
As depicted in Figure 3, the first two constrained axes of the Redundancy Analysis (RDA) in the 0–20 cm soil layer accounted for a cumulative variance of 40.55% and 10.61%, respectively. Notably, the projection of nitrogen content exhibited the greatest magnitude along the first axis, followed by available potassium content and pH value. Their respective contributions to the overall variation were 48.8%, 21.5%, and 18.0%. Importantly, statistical analysis revealed that both nitrogen content (F = 11.3, p = 0.002), available potassium content (F = 6.7, p = 0.008), and pH value (F = 4.6, p = 0.014) significantly influenced SOC content and yield.
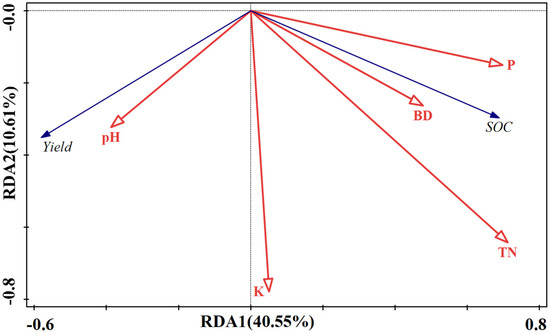
Figure 3.
The relationship between physicochemical properties of surface soil and crop yield demonstrated by redundancy analysis. P, available phosphorus; K, available potassium; BD, bulk density; TN, total nitrogen; SOC, soil organic carbon.
As depicted in Figure 4, the first two constrained axes of the Redundancy Analysis (RDA) in the 0–50 cm soil layer accounted for a cumulative variance of 47.94% and 2.15%, respectively. Notably, the projection of nitrogen content exhibited the greatest magnitude along the first axis, followed by pH value, with their respective contributions amounting to 73.7% and 17.8%. Importantly, statistical analysis revealed that nitrogen content (F = 19.9, p = 0.002) and pH value (F = 5.4, p = 0.01) significantly influenced SOC content and yield.
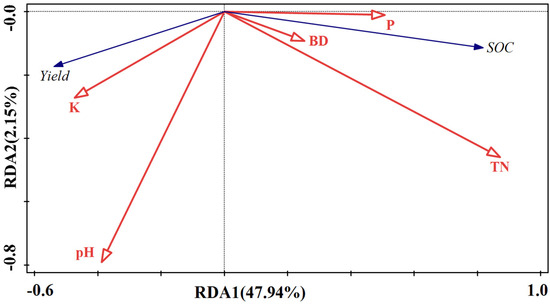
Figure 4.
The relationship between physicochemical properties of subsurface soil and crop yield demonstrated by redundancy analysis. BD, bulk density; P, available phosphorus; K, available potassium; TN, total nitrogen; SOC, soil organic carbon.
Nitrogen content is the predominant physicochemical attribute affecting SOC levels and ultimate yield, with pH value closely following. Furthermore, within the 0–20 cm soil stratum, available potassium emerges as another significant determinant of organic carbon accumulation and yield. Notably, nitrogen content exerts the most profound influence on organic carbon accumulation, while pH value predominantly dictates yield outcomes.
A linear regression analysis was conducted to investigate the relationship between factors identified as significant influencers on yield in the RDA analysis and the yield itself (Figure 5). Additionally, a linear regression analysis was performed to explore the correlation between the reserve of available potassium storage and yield. The reserve of available potassium storage was employed as the independent variable (X-axis), while yield was considered the dependent variable (Y-axis). The graphical representation revealed a positive correlation between the reserve of available potassium storage and yield within a specified range. This observation suggests that judiciously increasing the reserve of available potassium storage in the soil can contribute to yield enhancement. Consequently, adopting straw return methodologies aimed at improving potassium reserves in the soil may lead to an increase in yield.
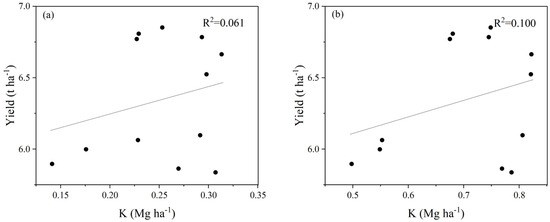
Figure 5.
Linear regression analysis of available potassium storage and Yield in the 0–20 cm (a) and 0–50 cm (b) soil layers. The black circle represented the yield (y) and the corresponding available potassium content (x).
4. Discussion
The accumulation and transformation of SOC play pivotal roles in regulating soil physicochemical properties and the dynamics of substance absorption and release [37]. Its concentration in soil is complexly linked with soil quality and agricultural productivity [38].
The findings indicate that under the double-rice system, rice straw return at two-thirds of the recommended rate increases SOC content and enhances soil quality, thereby fostering high yields. Similarly, within the rice–wheat rotation system, rice straw return at rates ranging from 100 to 300 kg/mu also manifests comparable effects [22]. Different levels of straw return significantly impact the SOC reserve in rice paddies, with the sequence being 2/3 RTS >1/3 RTS > RTS (Table 2). The organic carbon stock resulting from total straw return is relatively low, attributable to SOC mineralization under microbial activity, leading to the emission of CO2 and CH4 into the atmosphere [39]. The organic carbon stock in early rice soils using the RTS method exhibited relatively low levels. The incorporation of straw into the soil has significant effects on the soil’s physiochemical properties and the microbial community [40]. After the addition of fresh carbon sources, soil microorganisms rapidly increased. However, this increase in microbial biomass accelerates the decomposition of SOC [41]. The amount of added straw alters the composition of the microbial community. Research has found that the organic carbon content in paddy soils increased with the amount of straw returned, and the relative abundance of Proteobacteria significantly increased [42]. Another possible explanation could be that the treatment involving a large amount of straw return inhibited the gas exchange between the soil and the atmosphere. This inhibition slowed down the decomposition of crop straw, which in turn prevented the increase in soil microbial activity and biomass. Consequently, the release of nutrients from crop straw into the soil is reduced in the short term [43]. Straw return substantially escalated carbon dioxide and methane emissions, thereby accelerating the mineralization loss of SOC [44].
Comparisons with historical data on SOC content and SOC stocks in the region indicated that both parameters have increased because of continued straw incorporation. This suggested that straw incorporation significantly enhanced SOC stocks [45]. Due to regional variations in climate, soil characteristics, and farming practices, the optimal amount of straw returned to the field can differ greatly. Excessive straw return can hinder crop emergence, intensify the conflict between straw decomposition and nitrogen use, and negatively impact root growth and distribution within the soil, ultimately reducing crop yield. [46]. Hence, selecting an appropriate straw return rate, combined with a rational nitrogen application strategy, is crucial for maximizing the utilization of straw resources and enhancing grain yield.
There are several reasons why straw incorporation improves soil physicochemical properties. Firstly, as straw decomposes, it delivers substantial amounts of organic carbon and other substances to the soil, producing polysaccharides, proteins, lignin, and other organic matter. Soil organic matter is a crucial binding agent for the formation of aggregates, promoting the cohesion of soil minerals and clays into larger aggregates [47,48,49]. Secondly, straw incorporation increased soil organic matter content and enhanced soil aeration, soil microbial activity, and crop roots to secrete more organic compounds, further facilitating the formation of large soil aggregates [50]. Lastly, straw incorporation provides a rich food source and suitable living conditions for soil fauna such as earthworms, ants, and crickets. The increased population of these animals, through their feeding, burrowing, and excretion activities, loosens the soil, increases soil porosity, drives soil carbon and nitrogen cycles, and accelerates straw decomposition [51]. These factors collectively promote the formation of large soil aggregates.
An increased straw return decreased the pH level, corroborating findings from previous references. Compared with other studies, it revealed that under similar tillage practices but different climates and soil types, soil pH and phosphorus content may be altered [52]. Within certain thresholds, pH, bulk density, and available potassium content demonstrated positive correlations with crop yield while displaying negative correlations with total nitrogen and available phosphorus content. This observation underscores that a reasonable increase in soil pH, bulk density, and available potassium content could favor crop yield. However, contrasting findings from other studies revealed a positive correlation between grain yield and soil available phosphorus and available potassium but a negative correlation with bulk density and pH [4], possibly attributed to the saline-alkali nature of the rice field. Thus, an appropriate amount of straw return can mitigate the adverse fluctuations in soil pH that could serve as strategic measures to enhance yield levels. In this study, escalating straw return rates did not significantly increase the rice yield, possibly due to the following underlying mechanisms: rice straw return substantially ameliorates the physicochemical properties of rice soil, including bulk density, total phosphorus, potassium, pH, phosphorus, and SOC, thereby fostering increased rice yield, while nutrient deficiency and ion toxicity may constitute the primary factors contributing to diminished rice yield [53]. Under three distinct straw return rates, considerable alterations occurred in soil physiochemical properties, particularly evident at two-thirds of the recommended rate, where soil pH, total nitrogen content, available potassium content, organic carbon content, and organic carbon stock were more pronounced. Elevating available potassium content and pH levels in the soil allows for the enhancement of yield at a certain level. However, excessive accumulation of available phosphorus in the soil may lead to a reduction in grain yield.
Notably, SOC content exhibited positive correlations with total nitrogen content, available phosphorus content, bulk density, and available potassium content. The principal physicochemical factor affecting SOC levels and ultimately yield is nitrogen content. The sampling season significantly influenced the organic carbon content across most of the soil layers. Using computer software to simulate long-term scenarios in Cambodian rice fields and other cultivated lands, we found that conservation tillage practices led to an increase in SOC [54]. This study highlighted that appropriate increments in straw return rates facilitate SOC accumulation while regulating soil pH.
Straw incorporation is not only an effective way to address the issue of straw burning but also improves soil health, enhances soil fertility, promotes soil carbon sequestration, reduces agricultural greenhouse gas emissions, optimizes farmland ecosystems, and increases crop yields. Due to a lack of awareness and proper management, farmers often resort to burning straw in open fields, with rice straw accounting for 40% of the total crop straw burned [55]. High costs and energy requirements, along with the need for high-capacity moldboard plows for soil incorporation, somewhat limit resource-rich farmers from adopting in situ straw incorporation practices [56]. Crop straw possesses a certain economic value, and some farmers sell it for profit. However, farmers are more concerned with crop yield, soil fertilization, and their response to straw return practices. In general, while there are instances in China where straw is utilized for other profitable purposes, the high costs associated with straw collection, transportation, and processing make in situ straw incorporation a cost-effective and convenient option. Removing straws, of course, incurs costs. Thus, when deciding whether to adopt straw return optimization models, farmers also consider the costs, benefits, and local conditions associated with partial straw removal. We recommend the 2/3 RTS approach to maintain soil fertility while allowing farmers to sell the remaining straw for additional income. This is crucial for farmers (in terms of the economic viability of different straw return rates) and policymakers in making informed decisions about agricultural practices, optimizing resource allocation, and promoting sustainable agricultural practices that balance environmental benefits with economic considerations.
5. Conclusions
In comparing three distinct straw return rates, notable alterations in soil physiochemical properties were observed; however, no significant trend was observed for grain yield. SOC content is positively correlated with total nitrogen, available phosphorus content, and bulk density. Additionally, total nitrogen also shows a positive correlation with available phosphorus, potassium, and bulk density. In contrast, yield is positively correlated with pH value but negatively correlated with available phosphorus content, particularly under the 2/3 straw return rate, wherein pH, total nitrogen content, available phosphorus content, SOC content, and SOC stock reached their zenith. Notably, nitrogen content emerged as the paramount factor influencing SOC accumulation.
Furthermore, a positive correlation between straw return rates and crop yield was distinguished, whereby the method of returning two-thirds of the straw heightened levels of soil-available potassium, SOC, and total nitrogen. These findings furnish optimized straw utilization strategies within double-cropping rice regions and provide a comprehensive nexus between crop yield, soil carbon storage, and soil physicochemical properties. Future research could further investigate the impact of straw return on soil microbial community structure and its relationship with soil aggregation and validate the applicability and effectiveness of straw return technology in different geographical environments and agricultural production systems.
Author Contributions
Conceptualization, H.Z.; Validation, B.L.; Formal analysis, Y.C. and B.Z.; Investigation, B.Z. and J.W.; Data curation, Y.C.; Writing—original draft, Y.C.; Writing—review & editing, H.Z.; Visualization, B.L.; Supervision, Y.C.; Funding acquisition, H.Z. All authors have read and agreed to the published version of the manuscript.
Data Availability Statement
Dataset available on request from the authors. The raw data supporting the conclusions of this article will be made available by the authors on request.
Conflicts of Interest
The authors declare no conflict of interest.
References
- Chen, J.H.; Gong, Y.Z.; Wang, S.Q.; Guan, B.Z.; Balkovic, J.; Kraxner, F. To burn or retain crop residues on croplands? An integrated analysis of crop residue management in China. Sci. Total Environ. 2019, 662, 141–150. [Google Scholar] [CrossRef] [PubMed]
- Liu, W.M.; Liu, Y.E.; Liu, G.Z.; Xie, R.Z.; Ming, B.; Yang, Y.S.; Guo, X.X.; Wang, K.R.; Xue, J.; Wang, Y.H.; et al. Estimation of maize straw production and appropriate straw return rate in China. Agric. Ecosyst. Environ. 2022, 328, 107865. [Google Scholar] [CrossRef]
- Urban Cordeiro, E.; Arenas-Calle, L.; Woolf, D.; Sherpa, S.; Poonia, S.; Kritee, K.; Dubey, R.; Choudhary, A.; Kumar, V.; McDonald, A. The fate of rice crop residues and context-dependent greenhouse gas emissions: Model-based insights from Eastern India. J. Clean. Prod. 2024, 435, 140240. [Google Scholar] [CrossRef]
- Wang, X.-D.; He, C.; Cheng, H.-Y.; Liu, B.-Y.; Li, S.-S.; Wang, Q.; Liu, Y.; Zhao, X.; Zhang, H.-L. Responses of greenhouse gas emissions to residue returning in China’s croplands and influential factors: A meta-analysis. J. Environ. Manag. 2021, 289, 112486. [Google Scholar] [CrossRef]
- Guo, R.; Qian, R.; Naseer, M.A.; Han, F.; Zhang, P.; Jia, Z.; Chen, X.; Ren, X. Integrated straw-derived biochar utilization to increase net ecosystem carbon budget and economic benefit and reduce the environmental footprint. Field Crops Res. 2024, 307, 109247. [Google Scholar] [CrossRef]
- McBratney, A.; Field, D.J.; Koch, A. The dimensions of soil security. Geoderma 2014, 213, 203–213. [Google Scholar] [CrossRef]
- Zhao, Z.; Yang, Y.; Xie, H.; Zhang, Y.; He, H.; Zhang, X.; Sun, S. Enhancing sustainable agriculture in china: A meta-analysis of the impact of straw and manure on crop yield and soil fertility. Agriculture 2024, 14, 480. [Google Scholar] [CrossRef]
- Song, F.; Liu, M.; Zhang, Z.; Qi, Z.; Li, T.; Du, S.; Li, A.; Liu, J. No-tillage with straw mulching increased maize yield and nitrogen fertilizer recovery rate in northeast China. Agric. Water Manag. 2024, 292, 108687. [Google Scholar] [CrossRef]
- Lenka, S.; Choudhary, R.; Lenka, N.K.; Saha, J.K.; Amat, D.; Patra, A.K.; Gami, V.; Singh, D. Nutrient management drives the direction and magnitude of nitrous oxide flux in crop residue-returned soil under different soil moisture. Front. Environ. Sci. 2022, 10, 857233. [Google Scholar] [CrossRef]
- Liu, C.; Lu, M.; Cui, J.; Li, B.; Fang, C.M. Effects of straw carbon input on carbon dynamics in agricultural soils: A meta-analysis. Glob. Chang. Biol. 2014, 20, 1366–1381. [Google Scholar] [CrossRef]
- Bi, L.; Zhang, B.; Liu, G.; Li, Z.; Liu, Y.; Ye, C.; Yu, X.; Lai, T.; Zhang, J.; Yin, J.; et al. Long-term effects of organic amendments on the rice yields for double rice cropping systems in subtropical China. Agric. Ecosyst. Environ. 2009, 129, 534–541. [Google Scholar] [CrossRef]
- Huang, T.T.; Yang, N.; Lu, C.; Qin, X.L.; Siddique, K.H.M. Soil organic carbon, total nitrogen, available nutrients, and yield under different straw returning methods. Soil Tillage Res. 2021, 214, 105171. [Google Scholar] [CrossRef]
- Mondal, S.; Mishra, J.S.; Poonia, S.P.; Kumar, R.; Dubey, R.; Kumar, S.; Verma, M.; Rao, K.K.; Ahmed, A.; Dwivedi, S.; et al. Can yield, soil C and aggregation be improved under long-term conservation agriculture in the eastern Indo-Gangetic plain of India? Eur. J. Soil Sci. 2021, 72, 1742–1761. [Google Scholar] [CrossRef] [PubMed]
- Li, Y.; Li, Z.; Cui, S.; Zhang, Q. Trade-off between soil pH, bulk density and other soil physical properties under global no-tillage agriculture. Geoderma 2020, 361, 114099. [Google Scholar] [CrossRef]
- Wang, J.Y.; Jia, J.X.; Xiong, Z.Q.; Khalil, M.A.K.; Xing, G.X. Water regime–nitrogen fertilizer–straw incorporation interaction: Field study on nitrous oxide emissions from a rice agroecosystem in Nanjing, China. Agric. Ecosyst. Environ. 2011, 141, 437–446. [Google Scholar] [CrossRef]
- Coulibaly, S.S.; Toure, M.; Kouame, A.E.; Kambou, I.C.; Soro, S.Y.; Yeo, K.I.; Kone, S. Incorporation of crop residues into soil: A practice to improve soil chemical properties. Agric. Sci. 2020, 11, 1186–1198. [Google Scholar] [CrossRef]
- Fu, B.; Chen, L.; Huang, H.; Qu, P.; Wei, Z. Impacts of crop residues on soil health: A review. Environ. Pollut. Bioavailab. 2021, 33, 164–173. [Google Scholar] [CrossRef]
- Xue, B.; Huang, L.; Li, X.; Lu, J.; Gao, R.; Kamran, M. Straw residue incorporation and potassium fertilization enhances soil aggregate stability by altering soil content of iron oxide and organic carbon in a rice–rape cropping system. Land Degrad. Dev. 2022, 33, 2567–2584. [Google Scholar] [CrossRef]
- He, J.N.; Shi, Y.; Yu, Z.W. Subsoiling improves soil physical and microbial properties, and increases yield of winter wheat in the Huang-Huai-Hai Plain of China. Soil Tillage Res. 2019, 187, 182–193. [Google Scholar] [CrossRef]
- Wang, X.J.; Jia, Z.K.; Liang, L.Y.; Zhao, Y.F.; Yang, B.P.; Ding, R.X.; Wang, J.P.; Nie, J.F. Changes in soil characteristics and maize yield under straw returning system in dryland farming. Field Crops Res. 2018, 218, 11–17. [Google Scholar] [CrossRef]
- Hamada, M.S.; Yin, Y.N.; Chen, H.G.; Ma, Z.H. The escalating threat of Rhizoctonia cerealis, the causal agent of sharp eyespot in wheat. Pest Manag. Sci. 2011, 67, 1411–1419. [Google Scholar] [CrossRef] [PubMed]
- Song, P.; Mao, P.; Li, H.; Wang, Z.; Luo, M. Effects of straw returning on the occurrence degree of summer maize pests. J. Henan Agric. Univ. 2014, 48, 334–338, 347. [Google Scholar]
- Mohidem, N.A.; Hashim, N.; Shamsudin, R.; Man, H.C. Rice for Food Security: Revisiting Its Production, Diversity, Rice Milling Process and Nutrient Content. Agriculture 2022, 12, 741. [Google Scholar] [CrossRef]
- Shang, Q.Y.; Yang, X.X.; Gao, C.M.; Wu, P.P.; Liu, J.J.; Xu, Y.C.; Shen, Q.R.; Zou, J.W.; Guo, S.W. Net annual global warming potential and greenhouse gas intensity in Chinese double rice-cropping systems: A 3-year field measurement in long-term fertilizer experiments. Glob. Chang. Biol. 2011, 17, 2196–2210. [Google Scholar] [CrossRef]
- Kassam, A.; Friedrich, T.; Derpsch, R. Global spread of Conservation Agriculture. Int. J. Environ. Stud. 2019, 76, 29–51. [Google Scholar] [CrossRef]
- Ye, L.; Van Ranst, E. Production scenarios and the effect of soil degradation on long-term food security in China. Glob. Environ. Chang. 2009, 19, 464–481. [Google Scholar] [CrossRef]
- Horne, G.; Barrow, C.; Brandt, M.; Frouz, J.; Kuzyakov, Y.; Nyssen, J.; Ojeda, G.; Wong, V. Land Degradation & Development: A new and bright future. Land Degrad. Dev. 2018, 29, 2775–2777. [Google Scholar] [CrossRef]
- Guo, X.; Li, H.Y.; Yu, H.M.; Li, W.F.; Ye, Y.C.; Biswas, A. Drivers of spatio-temporal changes in paddy soil pH in Jiangxi Province, China from 1980 to 2010. Sci. Rep. 2018, 8, 2702. [Google Scholar] [CrossRef]
- Kubar, K.A.; Huang, L.; Lu, J.W.; Li, X.K.; Xue, B.; Yin, Z.Y. Integrative effects of no-tillage and straw returning on soil organic carbon and water stable aggregation under rice-rape rotation. Chil. J. Agric. Res. 2018, 78, 205–215. [Google Scholar] [CrossRef]
- Bierke, A.; Kaiser, K.; Guggenberger, G. Crop residue management effects on organic matter in paddy soils—The lignin component. Geoderma 2008, 146, 48–57. [Google Scholar] [CrossRef]
- Zhang, W.; Xu, A.; Zhang, R.; Ji, H. Review of Soil Classification and Revision of China Soil Classification System. Sci. Agric. Sin. 2014, 47, 3214–3230. [Google Scholar]
- Xue, J.F.; Pu, C.; Liu, S.L.; Chen, Z.D.; Chen, F.; Xiao, X.P.; Lal, R.; Zhang, H.L. Effects of tillage systems on soil organic carbon and total nitrogen in a double paddy cropping system in Southern China. Soil Tillage Res. 2015, 153, 161–168. [Google Scholar] [CrossRef]
- Gao, Q.; Zhang, W.; Ma, L.; Ren, T.; Zhang, A.; Li, G.; Hu, Z.; Du, Z. Estimation of soil organic carbon and total nitrogen storages under conservation tillage as influenced by sampling depths and calculation methods. Chin. J. Agrometeorol. 2021, 42, 1–12. [Google Scholar]
- Wolf, A.M.; Miller, R.O. Development of a North American proficiency testing program for soil and plant analysis. Commun. Soil Sci. Plant Anal. 1998, 29, 1685–1690. [Google Scholar] [CrossRef]
- Ellert, B.H.; Bettany, J.R. Calculation of organic matter and nutrients stored in soils under contrasting management regimes. Can. J. Soil Sci. 1995, 75, 529–538. [Google Scholar] [CrossRef]
- Dong, Q.G.; Yang, Y.C.; Yu, K.; Feng, H. Effects of straw mulching and plastic film mulching on improving soil organic carbon and nitrogen fractions, crop yield and water use efficiency in the Loess Plateau, China. Agric. Water Manag. 2018, 201, 133–143. [Google Scholar] [CrossRef]
- Stursová, M.; Baldrian, P. Effects of soil properties and management on the activity of soil organic matter transforming enzymes and the quantification of soil-bound and free activity. Plant Soil 2011, 338, 99–110. [Google Scholar] [CrossRef]
- Sun, W.; Shi, X.; Yu, D.; Wang, K.; Wang, H. Estimation of Soil organic carbon storage based on 1:1m soil database of China—A case in Northeast China. Sci. Geogr. Sin. 2004, 24, 568–572. [Google Scholar]
- Luo, L.; Li, Y.; Jiang, T. Research progress on soil carbon pool and recycle mechanism. Guizhou Agric. Sci. 2012, 40, 81–85. [Google Scholar]
- Wu, L.P.; Ma, H.; Zhao, Q.L.; Zhang, S.R.; Wei, W.L.; Ding, X.D. Changes in soil bacterial community and enzyme activity under five years straw returning in paddy soil. Eur. J. Soil Biol. 2020, 100, 103215. [Google Scholar] [CrossRef]
- Fontaine, S.; Bardoux, G.; Abbadie, L.; Mariotti, A. Carbon input to soil may decrease soil carbon content. Ecol. Lett. 2004, 7, 314–320. [Google Scholar] [CrossRef]
- Wang, E.Z.; Lin, X.L.; Tian, L.; Wang, X.G.; Ji, L.; Jin, F.; Tian, C.J. Effects of short-term rice straw return on the soil microbial community. Agriculture 2021, 11, 561. [Google Scholar] [CrossRef]
- Xu, M.G.; Yu, R.; Sun, X.F.; Liu, H.; Boren, W.; Li, J.M. Effects of long-term fertilization on labile organic matter and carbon management index (CMI) of the typical soils of China. Plant Nutr. Fertitizer Sci. 2006, 12, 459–465. [Google Scholar]
- Hu, N.J.; Wang, B.J.; Gu, Z.H.; Tao, B.R.; Zhang, Z.W.; Hu, S.J.; Zhu, L.Q.; Meng, Y.L. Effects of different straw returning modes on greenhouse gas emissions and crop yields in a rice-wheat rotation system. Agric. Ecosyst. Environ. 2016, 223, 115–122. [Google Scholar] [CrossRef]
- Wang, X.; Qi, J.Y.; Zhang, X.Z.; Li, S.S.; Virk, A.L.; Zhao, X.; Xiao, X.P.; Zhang, H.L. Effects of tillage and residue management on soil aggregates and associated carbon storage in a double paddy cropping system. Soil Tillage Res. 2019, 194, 104339. [Google Scholar] [CrossRef]
- Tao, Z.Q.; Li, C.F.; Li, J.J.; Ding, Z.S.; Xu, J.; Sun, X.F.; Zhou, P.L.; Zhao, M. Tillage and straw mulching impacts on grain yield and water use efficiency of spring maize in Northern Huang-Huai-Hai Valley. Crop J. 2015, 3, 445–450. [Google Scholar] [CrossRef]
- Tian, S.; Wang, Y.; Li, N.; Ning, T.; Wang, B.; Zhao, H.; Li, Z. Effects of different tillage and straw systems on soil water-stable aggregate distribution and stability in the North China Plain. Acta Ecol. Sin. 2013, 33, 7116–7124. [Google Scholar] [CrossRef]
- Xu, X.R.; Schaeffer, S.; Sun, Z.H.; Zhang, J.M.; An, T.T.; Wang, J.K. Carbon stabilization in aggregate fractions responds to straw input levels under varied soil fertility levels. Soil Tillage Res. 2020, 199, 104593. [Google Scholar] [CrossRef]
- Zhang, H.-J.; Wang, S.-J.; Tian, C.-J.; Luo, S.-S. Effects of maize straw and its biochar on the dissolved organic matter characteristics of black soil in northeastern China. J. Soil Water Conserv. 2021, 35, 243–250. [Google Scholar] [CrossRef]
- Qiu, Q.Y.; Wu, L.F.; Ouyang, Z.; Li, B.B.; Xu, Y.Y.; Wu, S.S.; Gregorich, E.G. Priming effect of maize residue and urea N on soil organic matter changes with time. Appl. Soil Ecol. 2016, 100, 65–74. [Google Scholar] [CrossRef]
- Ferlian, O.; Thakur, M.P.; González, A.C.; San Emeterio, L.M.; Marr, S.; Rocha, B.D.; Eisenhauer, N. Soil chemistry turned upside down: A meta-analysis of invasive earthworm effects on soil chemical properties. Ecology 2020, 101, e02936. [Google Scholar] [CrossRef] [PubMed]
- Ahmed, W.; Qaswar, M.; Jing, H.; Wenjun, D.; Geng, S.; Kailou, L.; Ying, M.; Ao, T.; Mei, S.; Chao, L.; et al. Tillage practices improve rice yield and soil phosphorus fractions in two typical paddy soils. J. Soils Sediments 2020, 20, 850–861. [Google Scholar] [CrossRef]
- Qadir, M.; Schubert, S. Degradation processes and nutrient constraints in sodic soils. Land Degrad. Dev. 2002, 13, 275–294. [Google Scholar] [CrossRef]
- Le, K.N.; Jha, M.K.; Jeong, J.; Gassman, P.W.; Reyes, M.R.; Doro, L.; Tran, D.Q.; Hok, L. Evaluation of long-term soc and crop productivity within conservation systems using GFDL CM2.1 and EPIC. Sustainability 2018, 10, 2665. [Google Scholar] [CrossRef]
- Kumar, A.; Nayak, A.K.; Sharma, S.; Senapati, A.; Mitra, D.; Mohanty, B.; Prabhukarthikeyan, S.R.; Sabarinathan, K.G.; Mani, I.; Garhwal, R.S.; et al. Rice straw recycling: A sustainable approach for ensuring environmental quality and economic security. Pedosphere 2023, 33, 34–48. [Google Scholar] [CrossRef]
- Singh, B.; Shan, Y.H.; Johnson-Beebout, S.E.; Singh, Y.; Buresh, R.J. Crop residue management for lowland rice-based cropping systems in Asia. Adv. Agron. 2008, 98, 117–199. [Google Scholar]
Disclaimer/Publisher’s Note: The statements, opinions and data contained in all publications are solely those of the individual author(s) and contributor(s) and not of MDPI and/or the editor(s). MDPI and/or the editor(s) disclaim responsibility for any injury to people or property resulting from any ideas, methods, instructions or products referred to in the content. |
© 2024 by the authors. Licensee MDPI, Basel, Switzerland. This article is an open access article distributed under the terms and conditions of the Creative Commons Attribution (CC BY) license (https://creativecommons.org/licenses/by/4.0/).