Article

A Multimodal and Temporal Network-Based Yield Assessment Method for Different Heat-Tolerant Genotypes of Wheat

1
College of Engineering, Anhui Agricultural University, Hefei 230036, China
2
College of Agronomy, Xinyang Agricultural and Forestry University, Xinyang 464000, China
3
College of Agronomy, Anhui Agricultural University, Hefei 230036, China
4
College of Engineering, Northeast Agricultural University, Harbin 150030, China
5
Weichai Lovol Intelligent Agricultural Technology Co., Ltd., Weifang 261000, China
*
Author to whom correspondence should be addressed.
Agronomy 2024, 14(8), 1694; https://doi.org/10.3390/agronomy14081694
Submission received: 23 June 2024 / Revised: 24 July 2024 / Accepted: 26 July 2024 / Published: 1 August 2024
(This article belongs to the Section Precision and Digital Agriculture)

Abstract

:
Large-scale yield estimation in the field or plot during wheat grain filling can contribute to high-throughput plant phenotyping and precision agriculture. To overcome the challenges of poor yield estimation at a large scale and for multiple species, this study employed a combination of multispectral and RGB drones to capture images and generation of time-series data on vegetation indices and canopy structure information during the wheat grubbing period. Five machine learning methods, partial least squares, random forest, support vector regression machine, BP neural networks, and long and short-term memory networks were used. The yield estimation of wheat grain filling period data was executed using a long and short-term memory network based on the preferred machine learning model, with a particular focus on distinguishing different heat-tolerant genotypes of wheat. The results unveiled a declining trend in the spectral reflectance characteristics of vegetation indices as the filling period progressed. Among the time-series data of the wheat filling period, the long and short-term memory network exhibited the highest estimation effectiveness, surpassing the BP neural network, which displayed the weakest estimation performance, by an impressive improvement in R2 of 0.21. The three genotypes of wheat were categorized into heat-tolerant genotype, moderate heat-tolerant genotype, and heat-sensitive genotype. Subsequently, the long and short-term memory network, which exhibited the most accurate yield estimation effect, was selected for regression prediction. The results indicate that the yield estimation effect was notably better than that achieved without distinguishing genotypes. Among the wheat genotypes, the heat-sensitive genotype demonstrated the most accurate prediction with an R2 of 0.91 and RMSE% of 3.25%. Moreover, by fusing the vegetation index with canopy structure information, the yield prediction accuracy (R2) witnessed an overall enhancement of about 0.07 compared to using the vegetation index alone. This approach also displayed enhanced adaptability to spatial variation. In conclusion, this study successfully utilized a cost-effective UAV for data fusion, enabling the extraction of canopy parameters and the application of a long and short-term memory network for yield estimation in wheat with different heat-tolerant genotypes. These findings have significant implications for informed crop management decisions, including harvesting and contingency forecasting, particularly for vast wheat areas.

1. Introduction

A crucial crop in agricultural production systems is wheat (Triticum aestivum L.), with the highest commercial rate and widespread distribution among cereals [1]. As it is the source of staple food for a large part of the world’s population [2], ensuring wheat yield research remains timely and of high quality is imperative. To address the challenge of predicting yields for a large number of wheat varieties, genomic selection has emerged as a promising prediction method. Agriculture stands as one of the most weather-sensitive and dependent industries. Climate change has been observed to primarily exert negative effects on crop productivity and quality across diverse regions. The proper temperature plays a pivotal role in all critical growth phases of crops, including wheat. Empirical evidence points to heat stress as the predominant causal factor for yield loss in winter wheat [3]. For filling wheat grains, an ideal temperature range lies between 20 °C to 22 °C. Any exposure to temperatures beyond 24 °C during the plant’s reproductive stage results in a considerable reduction in wheat yield. Furthermore, the duration of exposure to high temperatures directly correlates with the magnitude of yield decline [4]. In addition to reducing yield, increased temperatures also lead to the shortening of the wheat filling time, thereby impeding the accumulation of dry matter in the grains [4]. Subsequently, wheat yields may ultimately experience a reduction of 6 to 51% under conditions where the average daytime temperature exceeds 30 °C or when the highest recorded temperature rises above 34 °C during the critical filling phase [3]. Timeous, reliable, spatial, and temporally specific, large-scale winter wheat yield estimates during wheat grain filling are required during the wheat filling period. This is essential for effective agricultural management, food security monitoring, and optimal resource allocation [5,6].
In recent times, Unmanned Aerial Vehicles (UAVs) have shown great potential due to their significantly higher temporal and spatial resolution compared to airborne and satellite platforms [7,8,9]. Thanks to advancements in sensor technology, unmanned aerial vehicles platforms have become cost-effective and versatile tools, particularly in high-throughput plant phenotyping. Field phenotyping systems should be more simple to use and as high-quality as possible to save people labor costs [10,11,12,13]. The simplicity of use and cost effectiveness of unmanned aerial vehicles have proven instrumental in predicting crop yields accurately over vast areas without causing damage [14]. In space and time, high accuracy was obtained for the detection of biomass [15], total yield [16], crop growth monitoring [17], quality detection [18], and crop disease detection [19] by unmanned aerial vehicle technology, making it invaluable for large-scale spatial and high temporal resolution data collection. Such capabilities are crucial for assessing the phenological stages of specific crops and selecting high-performing varieties [20,21].
Quantitative remote sensing techniques have shown promising results in predicting yields during the filling stage by analyzing canopy spectral characteristics [22,23]. Integrating canopy spectral and structural data from multi-unmanned aerial vehicles sensor systems have significantly enhanced crop trait estimation, including grain yield, across various agricultural applications [24,25]. Among the remote sensing technologies used for predicting crop production, spectral data stand out due to their stable and superior performance. Vegetation indices, with their inherent memory capabilities, not only enhance the vegetation data signal but also mitigate the influence of confounding factors such as soil background, canopy structure, solar irradiance, and environmental stressors [26]. Sustained high temperatures can have detrimental effects on plants, including scorching of plant branches and leaves, sunburn, leaf and stem senescence, growth inhibition, fruit and leaf discoloration, and alterations in spectral reflectance characteristics [27]. The generation and estimation of VIs play a crucial role in effective crop management, especially in the face of unpredictable climatic conditions like drought and heat stress, which increase production uncertainty [17]. Based on the spectral reflectance at different wavelengths, several VI were derived by various mathematical combinations, offering a valuable proxy for plant physiological traits and enabling accurate wheat yield predictions [17,28,29]. Numerous studies have highlighted the superior accuracy of VI in predicting wheat production during the filling stage compared to other growth stages [17,29].
Technologies for high-throughput phenotyping play a crucial role in rapidly and precisely characterizing the phenotypic traits of thousands of plants, without causing additional damage or invasiveness [30,31,32,33]. To enhance experimental capacity, it is vital to monitor the same plot throughout a specific life cycle [34]. Unmanned aerial vehicles offer several advantages in this context, with their wider field of view and ability to avoid physical contact with crops, minimizing environmental impact and mechanical disturbance to the growing crop. Unmanned aerial vehicles enable high-frequency measurements during wheat filling, allowing for multiple measurements to capture the dynamic changes in plant phenology [35,36]. At different developmental stages, plants respond uniquely to various spectral properties, resulting in corresponding changes in spectral information relevant to yield estimation [37]. Hence, many measurements enable the computation of some characteristics that are less dependent on phenology. In yield prediction studies, models utilizing time series data outperform those using only single-period data, resulting in improved prediction accuracy and precision [35,36]. However, in the context of precision agriculture management and sustainable agricultural production, the canopy spectrum and structure information generated from multispectral and RTK drones are combined, there is limited knowledge regarding the contribution of time-series yield prediction for multiple wheat varieties during the filling period.
Many regression techniques use deep learning (DL) techniques such as artificial neural networks (ANN) [38], deep convolutional neural networks (CNN) [39], and deep neural networks (DNN) [40]; these models have all been used in various plots to forecast yield and detect crops. DL’s multi-layer framework allows for the discovery of sophisticated nonlinear functions and automatic analysis and expression of applications through data [41]. The accuracy of DL may be further enhanced with a big amount of data, and data optimization, collection advantages, and technical means are all becoming more and more feasible. However, the time component also plays a crucial role in determining the link between predictor variables and response, in addition to the spatial impact on yield prediction [42,43]. In this study, five time series models will be selected for time-series yield assessment in wheat during the filling period.
The motivation behind this study lies in the need for accurate yield estimation of numerous wheat varieties across a wide cultivation area. The combined system and time series model, utilizing multispectral and RTK drones, aims to enhance the yield prediction capability for multi-species wheat. The specific objectives include: (I) Quantifying yield differences due to temperature and varietal genotype variations in a typical breeding field trial setup. (II) Assessing the dynamic changes in image features collected from wheat at different filling periods. (III) Generating high-resolution yield prediction maps for a multi-variety wheat collection.

2. Materials and Methods

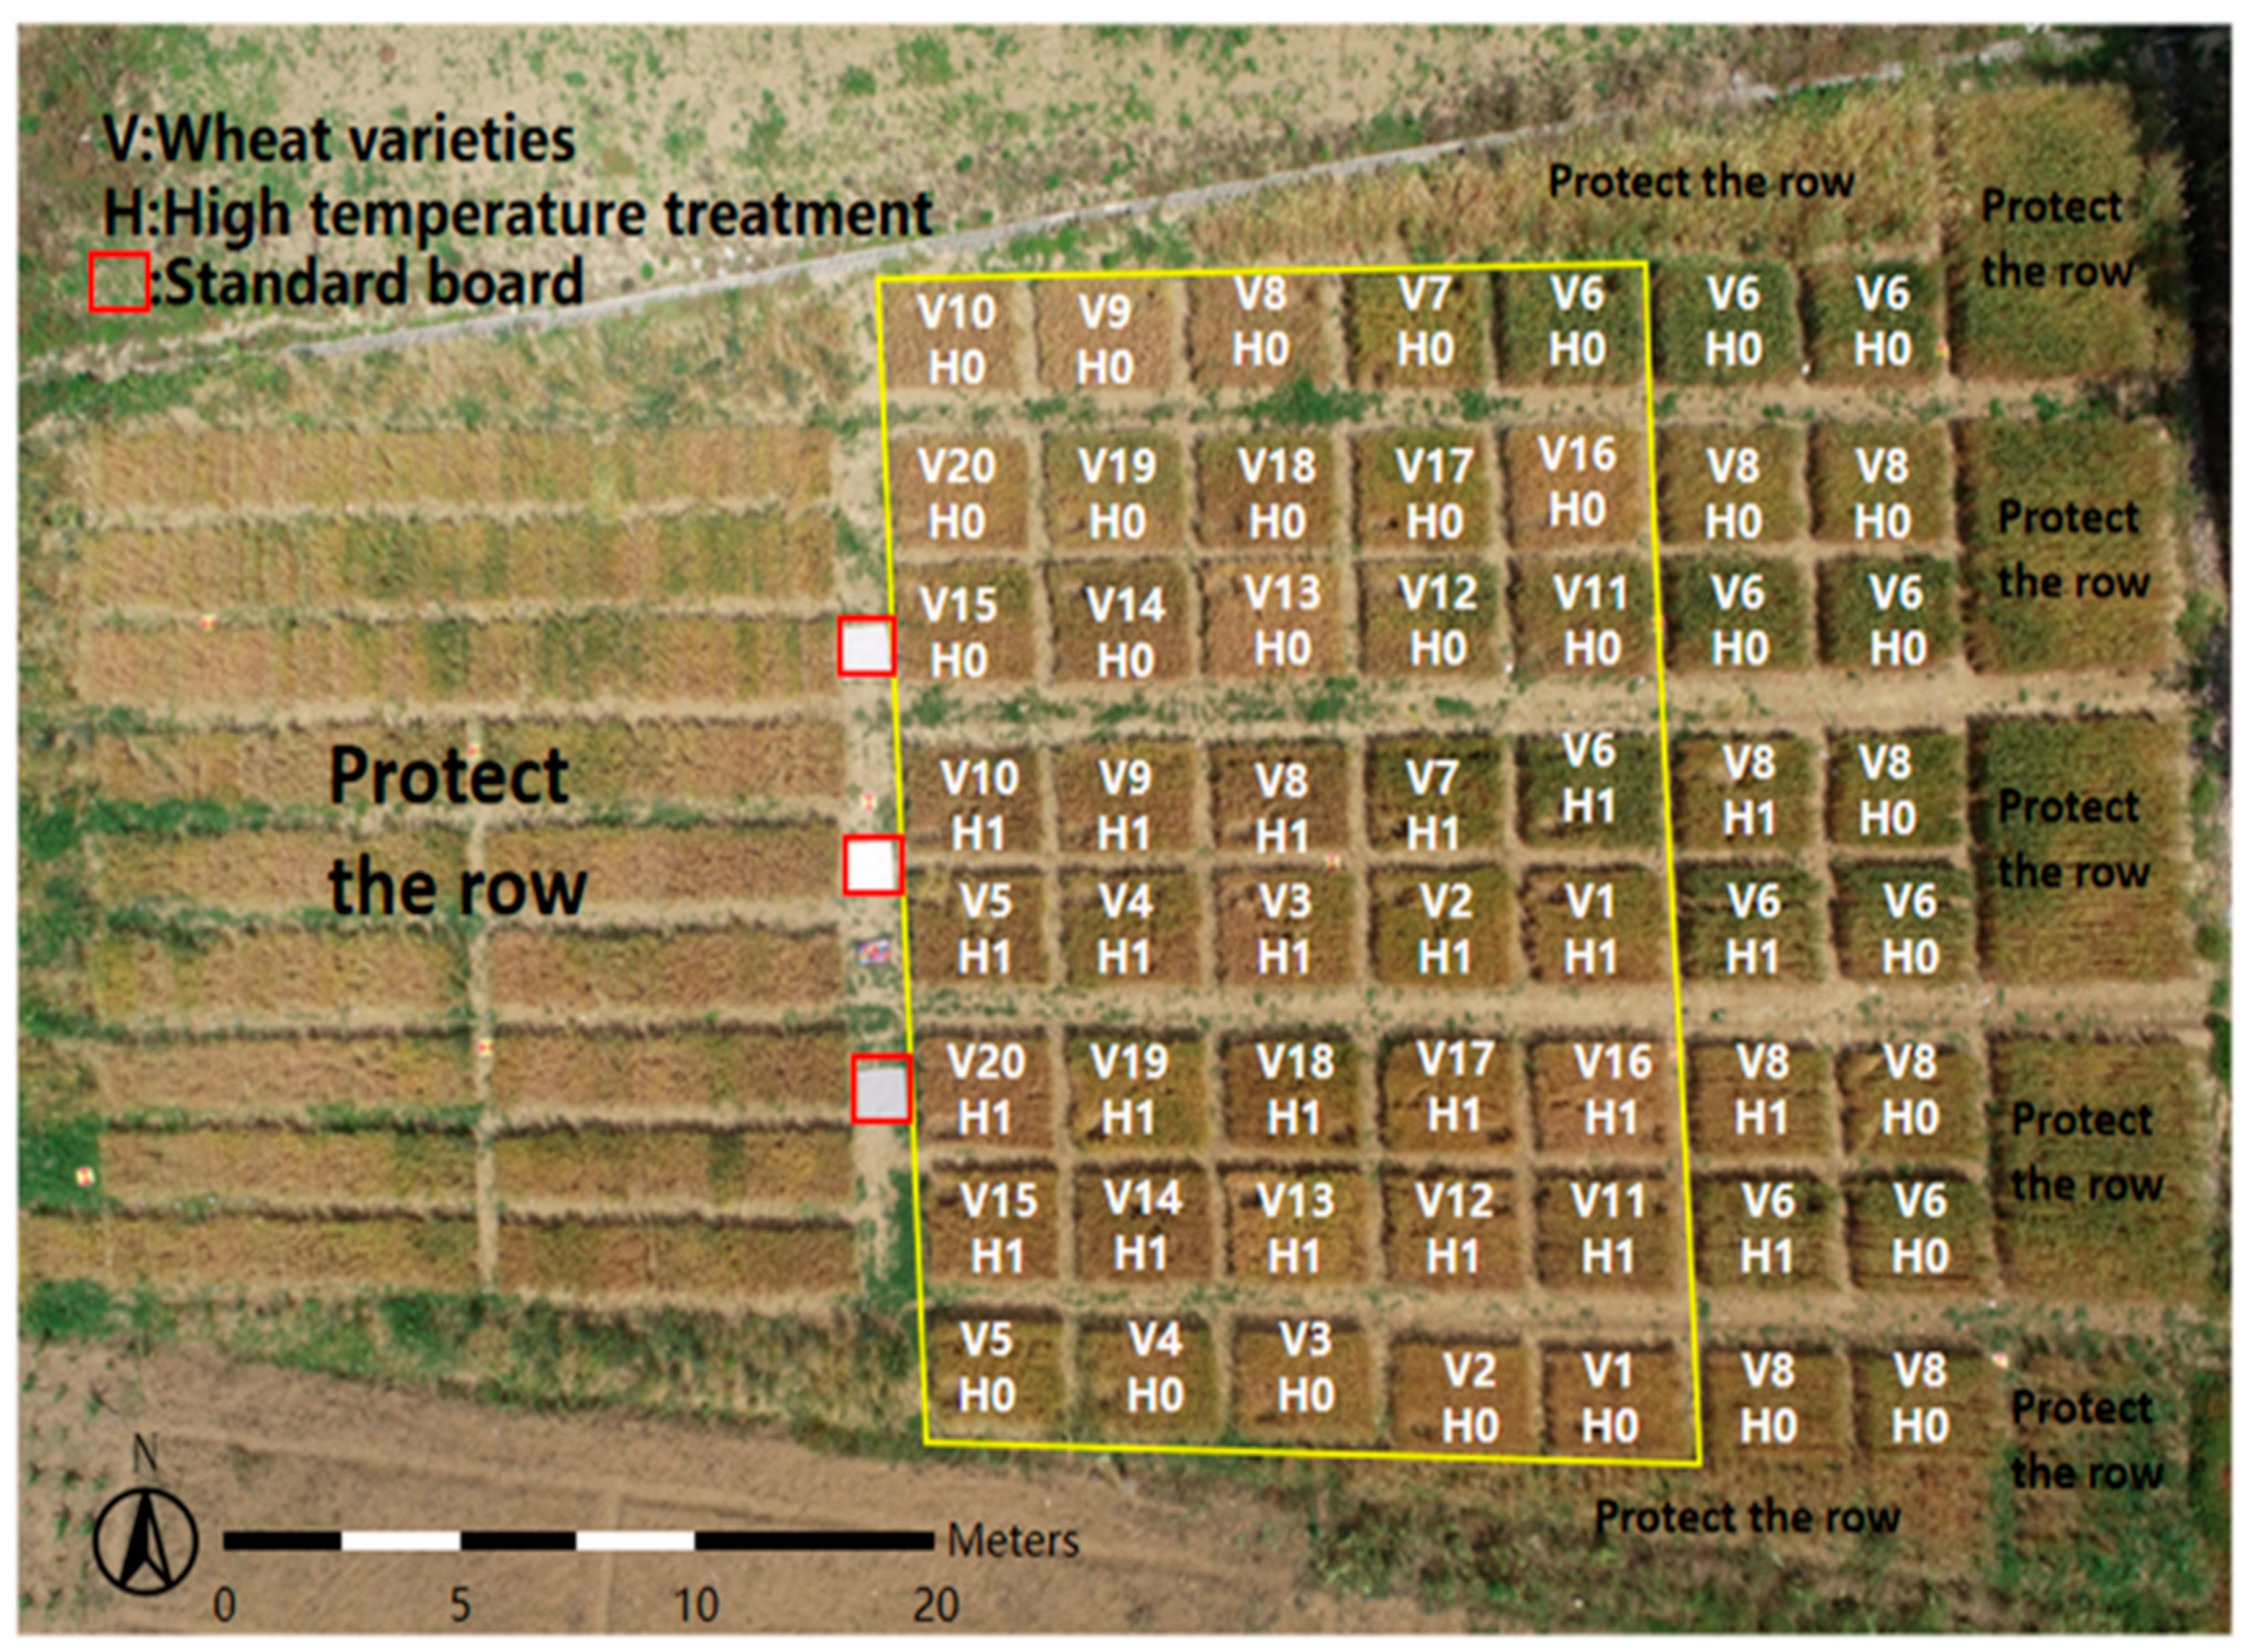
2.1. Experimental Materials and Design

The test location is situated at 117°19′ E, 31°85′ N, 37 m above sea level in Hefei High-tech Agricultural Park, Anhui Province, China, as shown in Figure 1. The experimental area belongs to a subtropical humid monsoon climate. The annual sunshine duration is 2100 h, and the rainfall and temperature conditions are ideal for the growth and development of winter wheat. Winter wheat is grown and harvested only once a year; winter wheat is sown on 10 November 2021, and harvested on 25 May 2022.
A total population of 20 wheat varieties was selected for the experiment including representative varieties grown from the HuangHuaiHai region (Table 1). The winter wheat was grown with different temperature treatments, temperature processing sections, and placement of specially designed field heat tents on established plots [44]. The maximum temperature in the shed was guaranteed to be no higher than 40 °C, and 20 winter wheat varieties were randomly arranged and with multiple replicates. The plot area is 6 m2 (2 m × 3 m), with row spacing of 0.2 m. Edge-setting protection lines, fertilizer, and irrigation were applied in the same way in all sample plots and were consistent with the local routine.

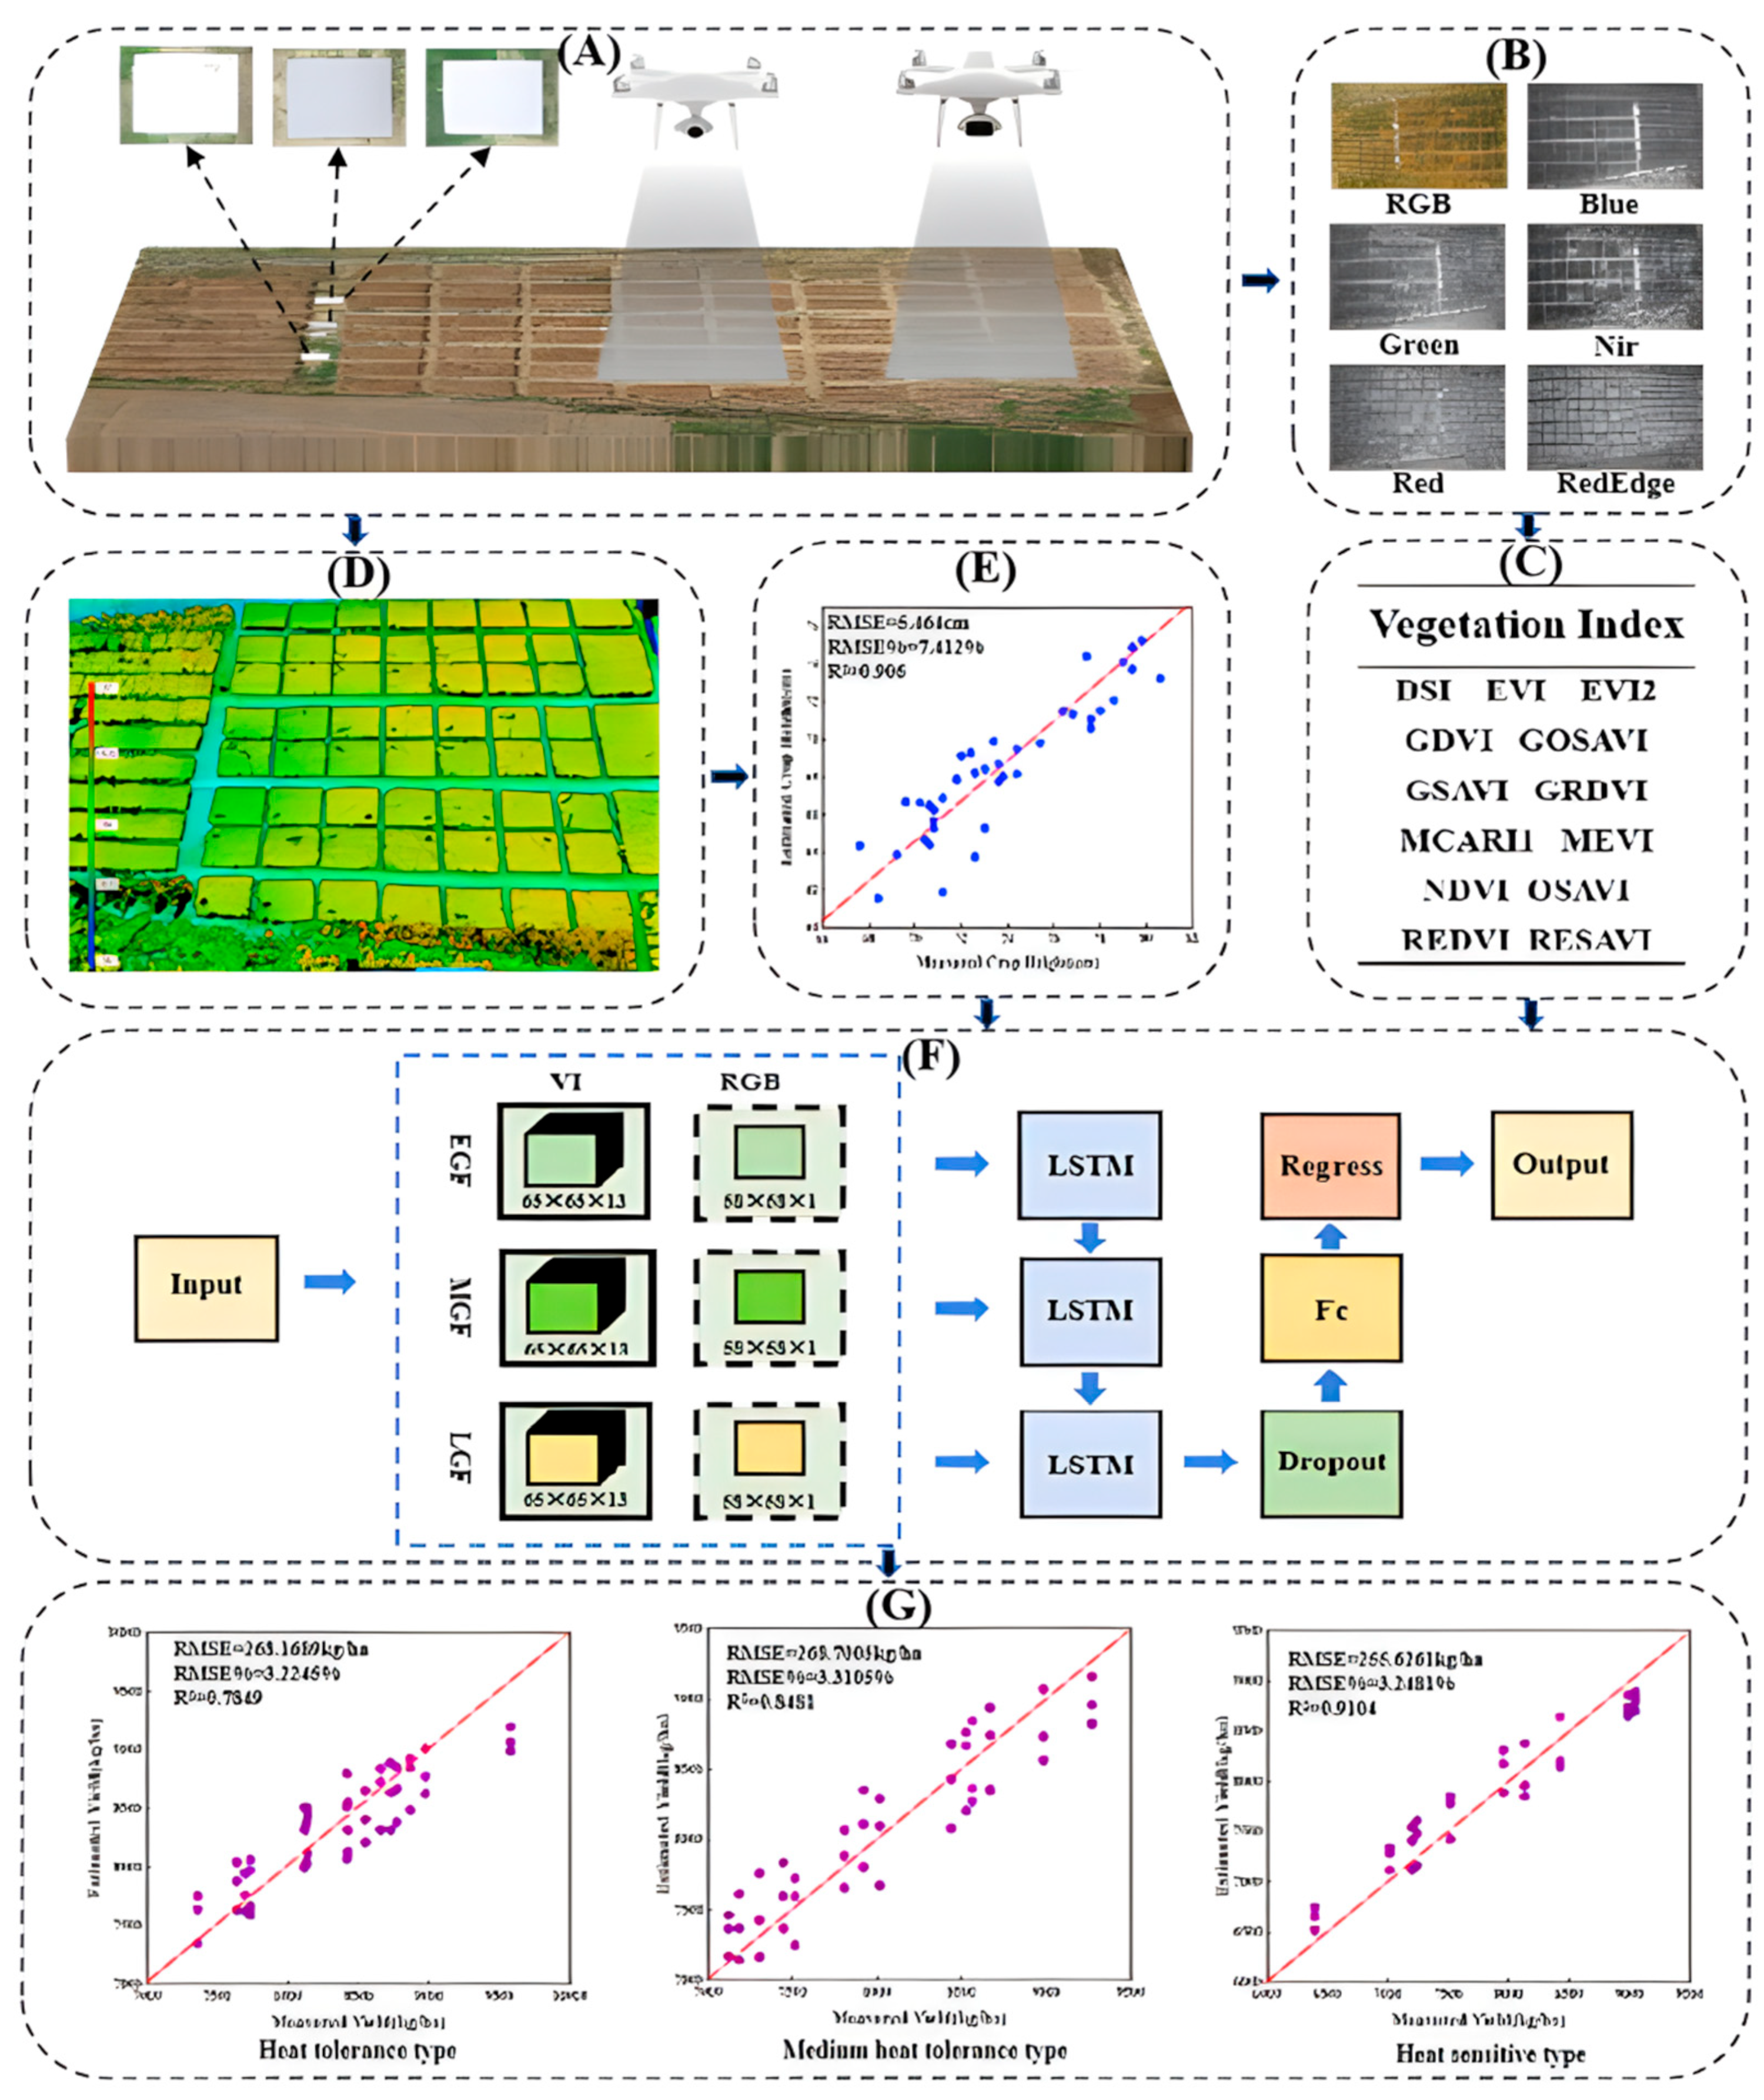
2.2. Data Collection

To gain a comprehensive understanding of the temperature dynamics during the wheat filling period, Figure 2 presents the highest and lowest temperatures recorded throughout the entire grouting period. Notably, the maximum temperature during the filling phase frequently surpasses the optimal temperature range required for wheat grain filling [3]. As such, accurate and representative yield prediction for the wheat filling period necessitates a focus on this specific time point.

2.2.1. Field Data Collection

The experiments were conducted in early grain fill (EGF) (22 April 2022), mid grain fill (MGF) (9 May 2022), and late grain fill (LGF) (21 May 2022). In-ground data included plant height and yield. When 50% of the plots reached a specific period, we used a ruler to measure the height of the plant [45]. To increase the unmanned aerial vehicle ability to accurately measure crop height, during the same day as the unmanned aerial vehicle flight, a manual field height measurement was used to establish the ground live data. In each plot, each point was sampled repeatedly according to the 5-point sampling method; a total of 25 representative plants were randomly taken. We avoided uneven mounds and soil fractures when measuring the length of wheat in its natural condition from the surface of the ground to the apex of the spike, omitting the awn [46]. As the real ground measurement of plant height in each plot, the average of 25 representative plants’ values was used. Winter wheat yields were collected from each plot, grain wheat was gathered from a randomly chosen 1 m2 area in each plot (excluding border plants), and manual threshing was used for seed yield determination. The moisture content of seed yield in this study was 13%. In each sample, 1000 seeds were randomly selected in three replications, threshed, dried, weighed, and evaluated for quality as the final yield [47].

2.2.2. UAV Image Acquisition

According to Figure 3A, DJI Phantom 4 Multispectral and DJI Phantom 4 RTK unmanned aerial vehicles (SZ DJI Technology Co., Ltd., Shenzhen, China) were used to capture multispectral and RGB photographs in the pre-filling, mid-filling, and late filling of wheat. Centimeter-level navigation and positioning systems were present aboard the unmanned aerial vehicles. The multispectral unmanned aerial vehicles recorded images in five spectral bands at wavelengths of blue (450 nm ± 16 nm), green (560 nm ± 16 nm), red (650 nm ± 16 nm), red edge (730 nm ± 16 nm), and near-infrared (840 nm ± 26 nm) at a 1600 × 1300 pixel resolution. The photos had an 80% average forward overlap and an 80% average side lap. The FC6310R lens on the DJI Phantom 4 RTK camera has an aperture of 8.8 mm and a resolution of 4864 × 3648 pixels. The mean forward overlap was 80%, and the mean side-lap was 90%. The drone combination flew at a height of 15 m without causing any disruption to the wheat with a speed of 2 m/s and photo interval of 2 s. The drone images were taken during the day in clear, cloudless weather.

2.3. Image Preprocessing

Raw data stitching, localization point correction, reflection correction, and radiation correction are all part of the unmanned aerial vehicle image processing workflow. Both RGB and multispectral photos were analyzed in the same way. The unmanned aerial vehicles’ multispectral and RGB data were combined using the DJI Terra software 4.1.0 (SZ DJI Technology Co., Ltd., Shenzhen, China). We used a standard diffuse reflector with a fixed reflectance for radiation correction in the DJI Terra software. The digital number (DN) value of the photograph was then changed into a reflectance value using the empirical line approach (Figure 3A). Orthorectified mosaic images and unmanned aerial vehicle canopy data were created using RTK unmanned aerial vehicle images and geographic coordinates.

2.4. Canopy Information Extraction

2.4.1. Canopy Spectral Information

Unmanned aerial vehicle remote sensing technology plays a significant role in agricultural applications as it enables the detection of various spectral properties related to plant absorption, reflection, and radiation. Among the methods used to obtain crop data through remote sensing, the estimation of vegetation indices (VIs) stands out as the most frequently employed approach. These indices are crucial for inferring agronomic traits, and their correlation values were found to be comparable to, if not stronger than, those obtained through ground assessments [48]. A collection of vegetation indices that had previously been frequently employed for predicting grain yield were calculated in this study. These indices were calculated and generated in five bands (Figure 3B), namely blue, red, Nir, red-edge, and green, widely utilized for plant vegetation detection and crop productivity monitoring, with specific vegetation indices shown in Figure 3C; the formula is in Table 2. In addition, to eliminate boundary effects and sample areas, the region of interest (ROI) for each plot in the orthophotography was determined using the ENVI. To depict the values of each plot, the averaged VI of each ROI was retrieved.

2.4.2. Canopy Structure Information

By watching the environment in which the plants reside, it is possible to assess the distinctive features of plant height, which enables the estimation of plant height estimates for various crop growth stages [58]. In the realm of data acquisition for plant canopy information, manual field ground measurements have been utilized. However, this method is limited in its applicability, as it is only practical for a small number of plants in small plots. Moreover, the data obtained through manual measurements may suffer from inconsistencies due to the lack of uniformity. Unmanned aerial vehicles offer a more efficient and standardized approach for acquiring plant canopy data, mitigating potential errors and discrepancies [59].
In this experiment, a digital surface model (DSM) was created by identifying the canopy height from point clouds obtained from RTK unmanned aerial vehicle photos and incorporating it as a canopy characteristic for yield structure, as shown in Figure 3D, and pictures captured in the air on 10 November 2021, following planting, were used to calculate the Digital Elevation Model (DEM) over the whole filling period. The crop surface model (CSM) is determined by the difference here between DSM and the DEM for each unmanned aerial vehicle flight, excluding outliers that occur by chance. ERIS ArcMap produced the CSM minus the DEM from the DSM [25,60].

2.5. Building the Dataset

In order to prepare the dataset required for training the network model, image blocks need to be extracted from the pre-processed vegetation index images and canopy images for each training area. Therefore, multiple ROI is created and each plot is segmented into 0.5 m × 0.5 m rectangles using MATLAB R2016a [61], and the size of the multispectral image and RGB image cut image blocks are 65 × 65 pixels and 58 × 58 pixels, respectively. The dataset for each training map consists of individual pixel image blocks and yield values. To annotate each image block, the corresponding yield data are employed as labels for ground truth. The dataset was further curated by removing blocks representing weed and sampled areas, and the 640 labeled picture blocks were split into training, validation, and test sets at random in the ratios of 7:1:2.
The test results were taken as a whole, and the different treatments (high-temperature treatment) did not affect them. By incorporating various treatments in the dataset, the model was exposed to a diverse range of scenarios, covering most possible outcomes. As a result, the model can provide reliable and trustworthy yield estimates under different conditions.

2.6. LSTM Network Model

LSTM, as a type of recurrent neural network (RNN), holds distinct advantages in modeling serial data, particularly in the context of remote sensing [62,63]. Unlike traditional RNNs that employ repeated hidden nodes, LSTM utilizes memory cells to capture both short- and long-term connections between neurons. A crucial feature of LSTM lies in the inclusion of a cell, which acts as an arbiter to evaluate the relevance and usefulness of incoming information. As data enter the LSTM network, they undergo an assessment based on predefined rules. Only information deemed valuable according to these rules is retained, while irrelevant data are discarded through a forgetting mechanism. This underlying structure of LSTM efficiently manages data transmission statuses, ensuring retention of pertinent information for an extended period while discarding unnecessary data [64]. This dynamic process enables LSTM to maintain system state and dynamics over time. Compared to other neural network architectures, LSTM’s recurrent state space effectively leverages spectral and spatial features, resulting in higher prediction accuracy.
The LSTM model employs four layers to perform the regression task: a time series input layer, an LSTM layer, a fully-connected layer, and a regression layer. The quantitative information for the input and output variables is represented by the input layer and the fully linked layer, respectively. The input layer is in charge of supplying the network with the time series information from the filling period, as shown in Figure 3F. The coefficient of determination (R2), root mean square error (RMSE), and relative RMSE (RMSE%) were computed to assess the efficacy of the yield prediction model.
R 2 = i = 1 n ( x i x ~ ) 2 × ( y i y ¯ ) 2 i = 1 n ( x i x ~ ) 2 × i = 1 n ( y i y ¯ ) 2
R M S E = 1 n i = 1 n ( y i y i ^ ) 2 ,   [ 0 , + )
R M S E % = R M S E x ¯

3. Results

3.1. Obtaining Yield Information

After obtaining the weighted average of wheat yields, the final results are shown in Table 3.

3.2. Canopy Information Acquisition

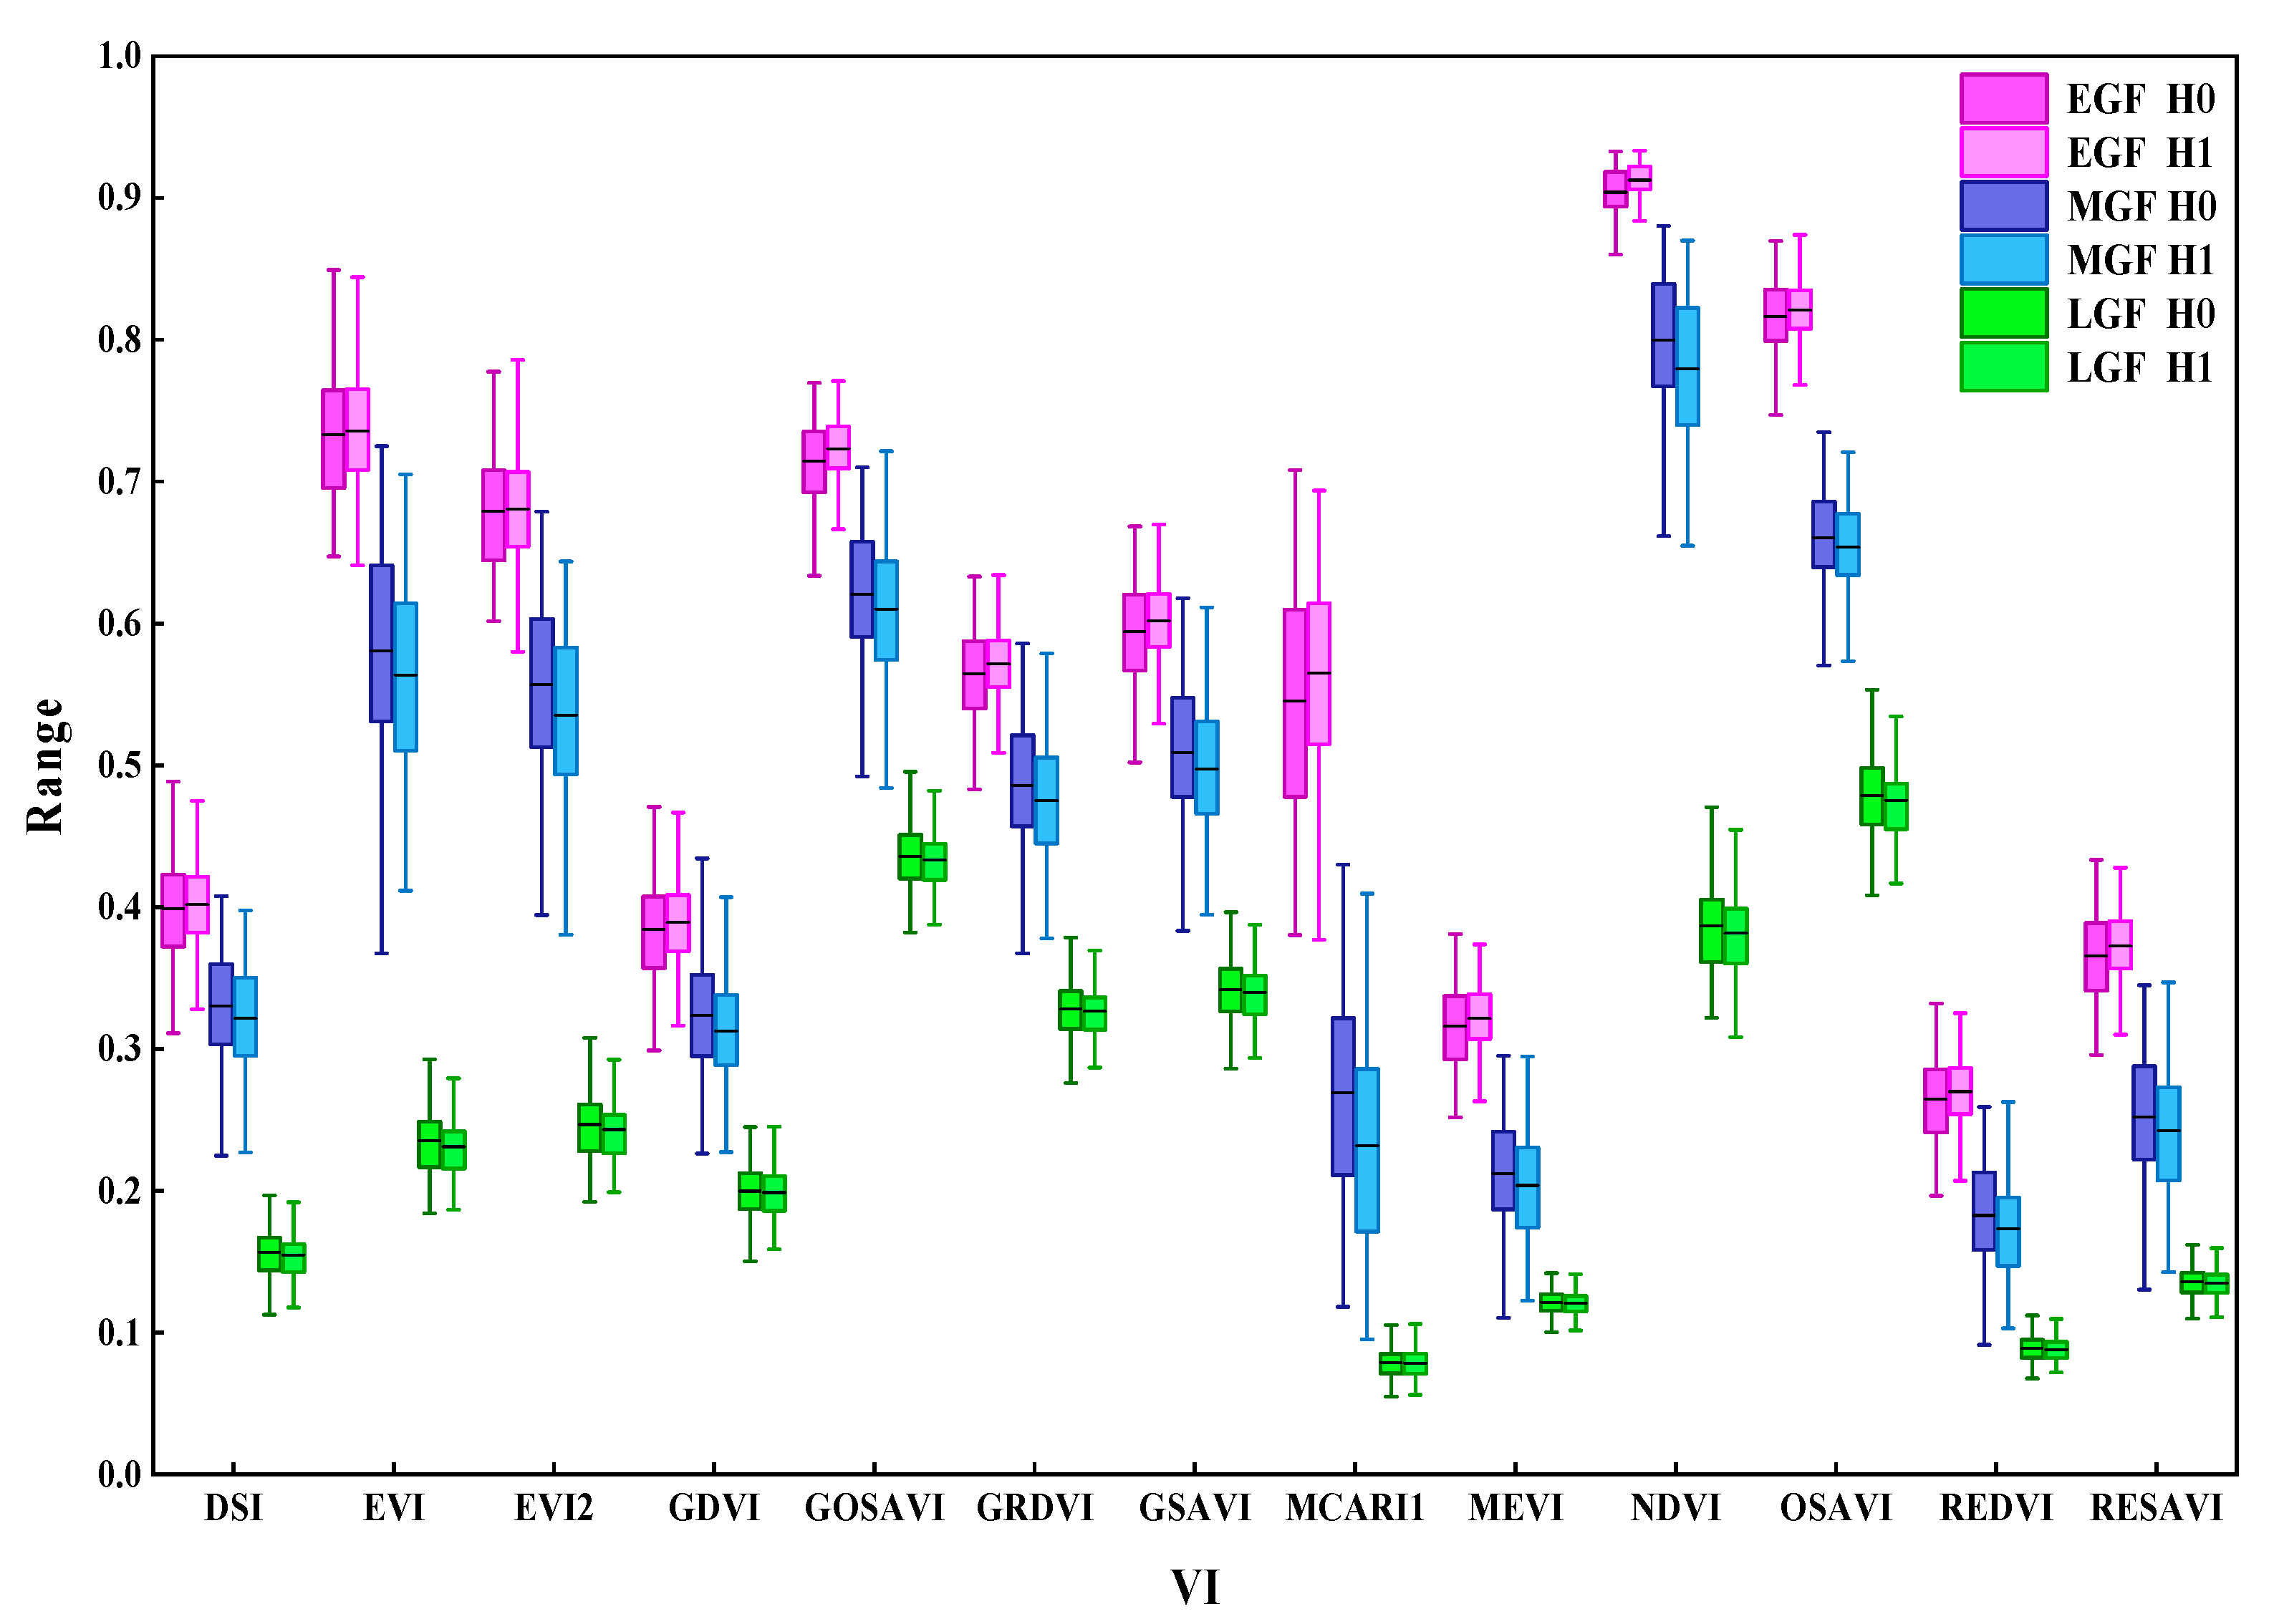
3.2.1. Spectral Index

Advancements in drone imaging technology have revolutionized crop monitoring by enabling large-scale image capture and more accurate extraction of various phenotypic traits. The three developmental stages selected in this study, early grain fill (EGF), mid grain fill (MGF), and late grain fill (LGF), are the critical grouting stages before full maturity. Combining unmanned aerial vehicle remote sensing data from multiple developmental stages yields superior accuracy compared to single-stage crop production prediction [65]. During these stages, wheat exhibits less bare soil and high leaf cover, with crop nutrient growth nearing completion, making these periods highly correlated with yield traits [17,29]. Numerous studies have supported the notion that the filling stage is the optimal time for crop production forecasting using unmanned aerial vehicle remote sensing techniques.
During the three stages of wheat filling, vegetation indices (VIs) were measured for both the normal treatment (H0) and heat stress treatment (H1) components, with the results depicted in Figure 4. VI values exhibited a continuous decline during wheat filling, with a notable gap observed during seed filling. The trend of VI changes over time at different temperature treatments showed that: in early grain fill, the difference between heat stress treatment (H1) and the normal treatment (H0) was not significant and basically coincided; mid grain fill, the two produced differences, but heat stress treatment (H1) vegetation index values were generally lower than those of the normal treatment (H0); and late grain fill tended to level off, but generally speaking, heat stress treatment (H1) vegetation index values were still lower than those of the normal treatment (H0). The occurrence of high-temperature stress during the heat treatment led to specific physiological changes in wheat, including a reduction in flag leaf chlorophyll [66], source content, and hindered assimilate transport and distribution processes, ultimately resulting in limited grain filling and grain weight loss [3]. These physiological alterations are the primary reasons behind the weaker VI observed in the heat stress treatment compared to the normal treatment in this experiment. This is the reason why the VI in the heat stress treatment part of this experiment was weaker than the VI in the normal treatment part. The distinct changes in spectra observed among different wheat varieties, wheat filling stages, and temperature treatments corroborate the feasibility of using spectral indices as input variables for predicting wheat yield.

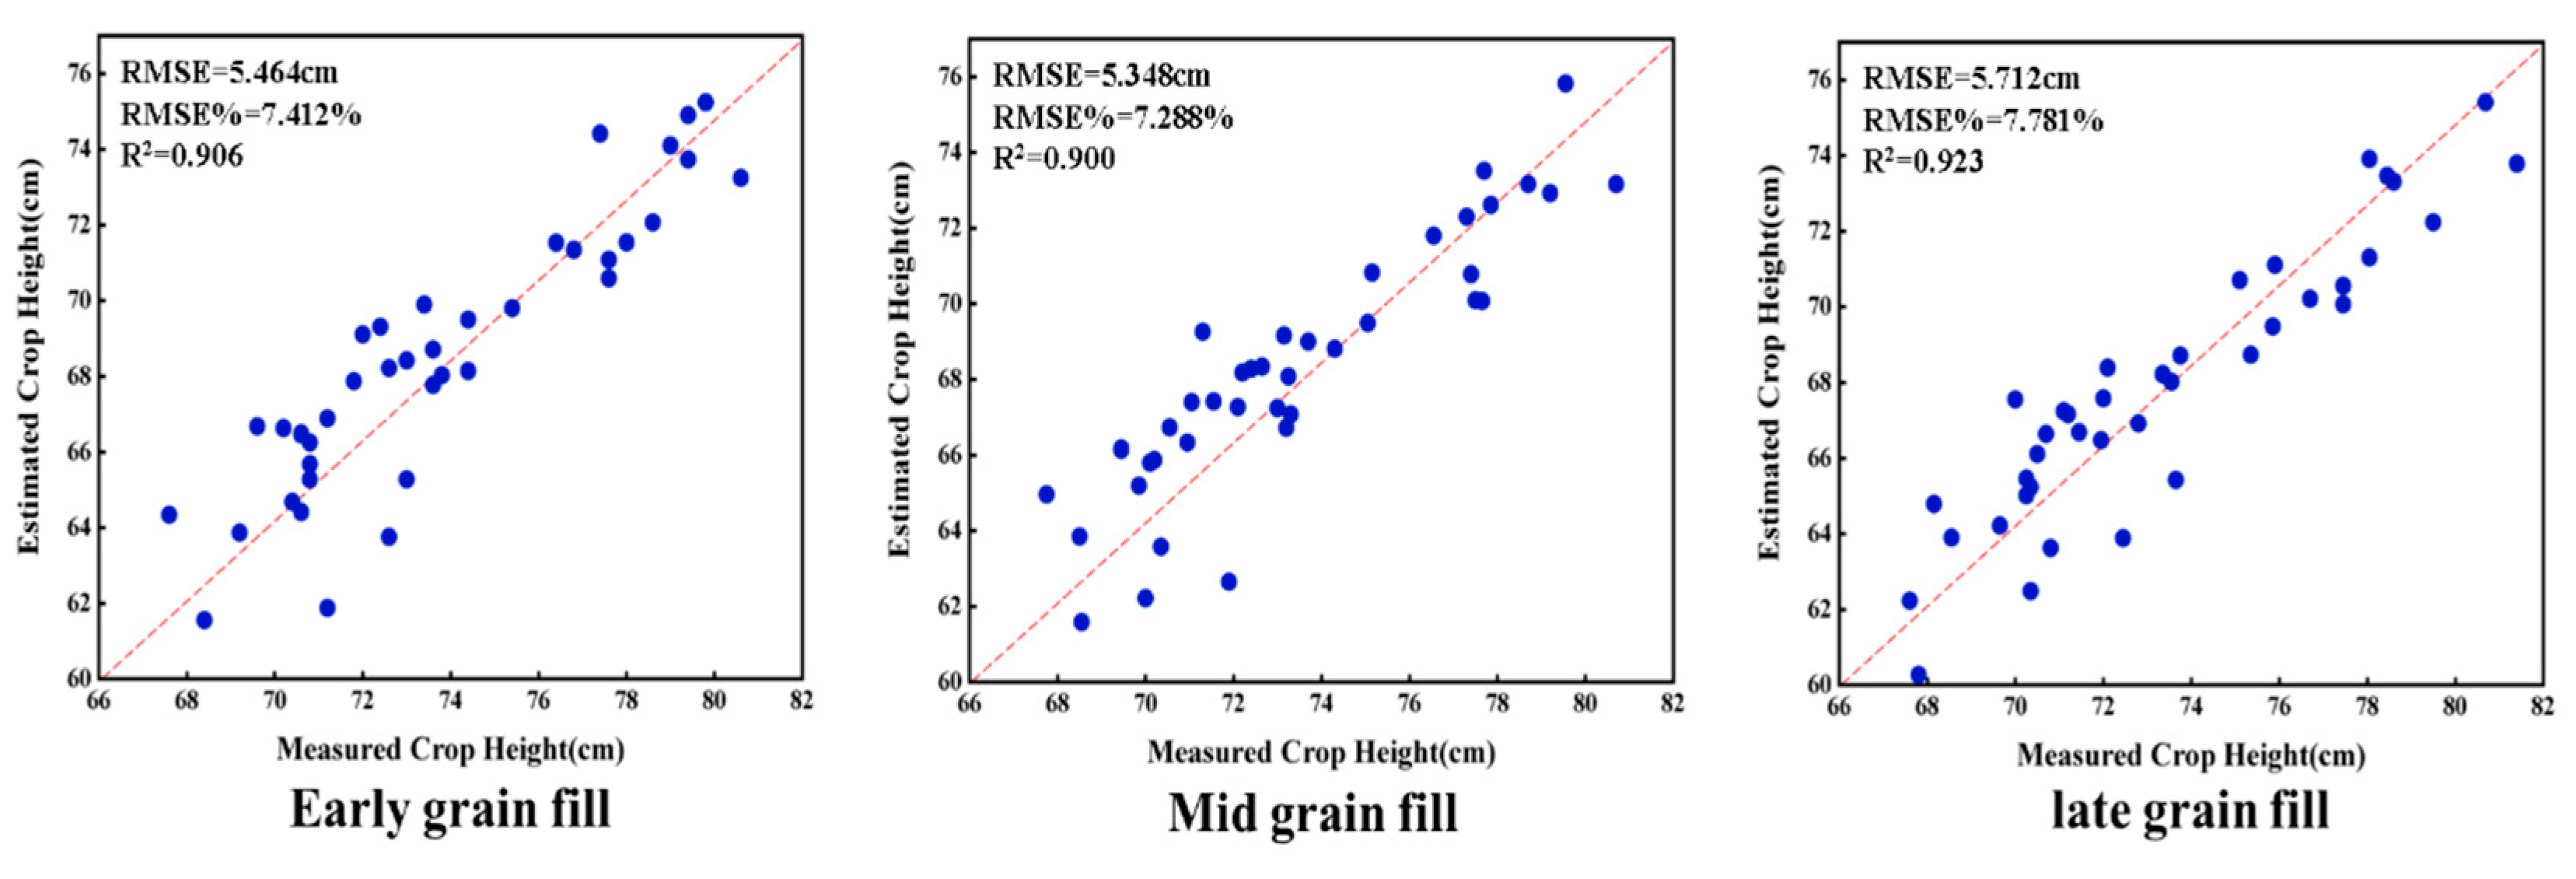
3.2.2. Canopy Height Observation

The distribution of canopy height serves as a critical indicator, reflecting the heterogeneity and genotypes of wheat communities. It plays a pivotal role in characterizing the vertical structure of wheat development and growth. Throughout various developmental phases, the spectral features of the wheat canopy undergo significant changes, which in turn affect the spectral data related to yield estimation. Notably, data on plant height become more important during the late growth stage compared to the early growth stage, and the contribution of canopy data to yield estimation varies significantly across different stages of wheat growth [67]. Thus, extracting canopy information specifically for the wheat filling stage holds greater significance for accurate yield assessment.
Based on different varieties, different filling stages, and different temperature treatments of wheat, the obtained crop surface model (CSM) was compared with the true canopy height, and the observed correlation R2 between Measured Crop Height and Estimated Crop Height were 0.91, 0.90, and 0.92, respectively, as shown in Figure 5. This demonstrates the effectiveness and accuracy of our approach in extracting canopy information based on Real-Time Kinematic (RTK) drones. The RTK drones consistently predicted canopy height well, and the regression prediction results aligned closely with the actual canopy height data.
Analyzing the actual plant height data in Figure 5 reveals that during the filling phase, there is little discernible change in the height of wheat plants, with only a slight decrease in plant height observed during the late filling period. This slight decrease can be attributed to factors such as the proximity of plants to maturity, the influence of wind, seed weight, and a slight drooping of the wheat awns, leading to a slightly lower measured plant height. According to the data, CSM-derived plant heights are marginally less than those determined by field measurements, and a similar underestimation was reported by [25]. There are two possible reasons for this underestimation. Firstly, the positions of the same ears may shift in overlapping photos due to various factors, including random winds in the field that may displace the wheat awns and alter the positions of the wheat ears. Secondly, during the filling stage, wheat is nearly mature, and the tops of wheat plants become sharp and affected by the wheat awning, making it challenging to capture precise canopy top information at high resolution in unmanned aerial vehicle images.

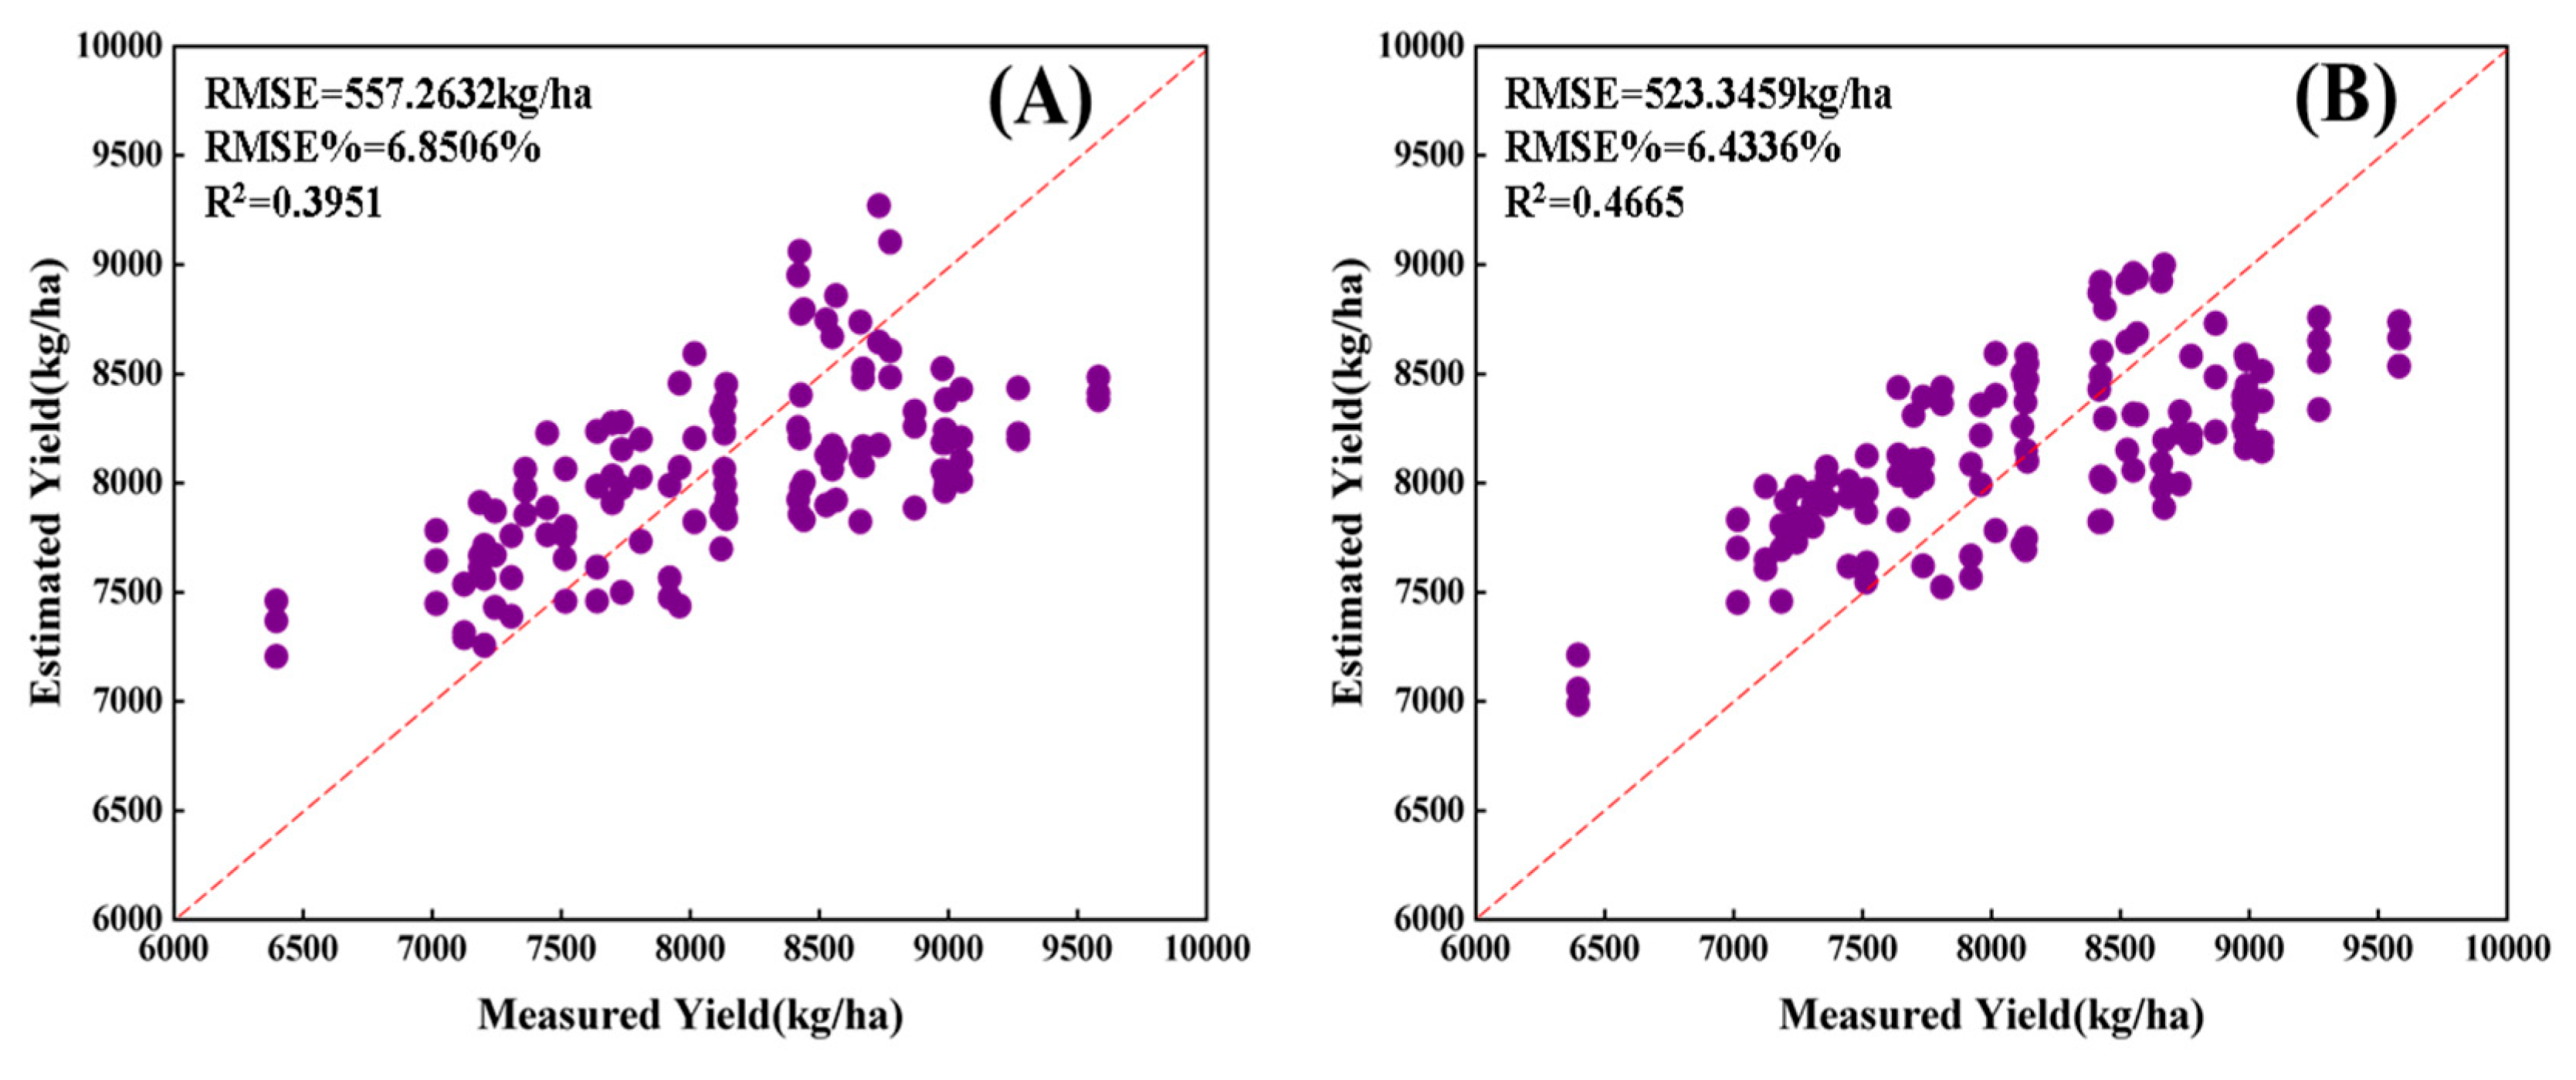
3.3. Multi-Species Yield Estimates

Partial least squares regression (PLSR) [68], random forest (RF) [69], support vector machine (SVM) [40,70], BP neural network (BP NN) [71], and LSTM [62] were used to predict wheat seed yield manner using canopy spectral information extracted from unmanned aerial vehicle multispectral. As seen in Table 4, the yield prediction models constructed by the five machine learning algorithms had validation accuracies R2 ranging from 0.19–0.40 and RMSE and RMSE% ranging from 557.26–645.56 and 6.85–7.94%, respectively.
The experimental long and short-term memory networks outperformed machine learning networks such as partial least squares, random forests, support vector regression machines, and BP neural networks in the modeling task, with an R2 improvement of 0.21 over BP neural networks, which were the least effective in estimation, probably because traditional machine learning algorithms such as partial least squares, random forests, support vector regression machines, and BP neural networks are usually used for non-sequential data modeling tasks and cannot effectively capture the temporal dependencies in sequential data. For the wheat-filling period data, the LSTM model’s capacity to retain temporal memory enabled it to effectively process time series data, preserving relevant information while disregarding irrelevant elements [72]. To evaluate the yield estimation accuracy, a scatter plot was employed to compare the obtained grain yield estimates with corresponding observations, as depicted in Figure 6. By integrating the vegetation index with the canopy information as input for yield regression, the LSTM model achieved an R2 value of 0.47. This integration of data from multiple sensors resulted in improved forecast accuracy compared to using a single sensor. However, in this regression, it was not able to estimate the yield of wheat close to harvest, probably because of the influence of multiple varieties and treatments, and the farmland information was too complicated for uniform regression processing, so this study explored categorizing wheat for separate yield regression predictions.

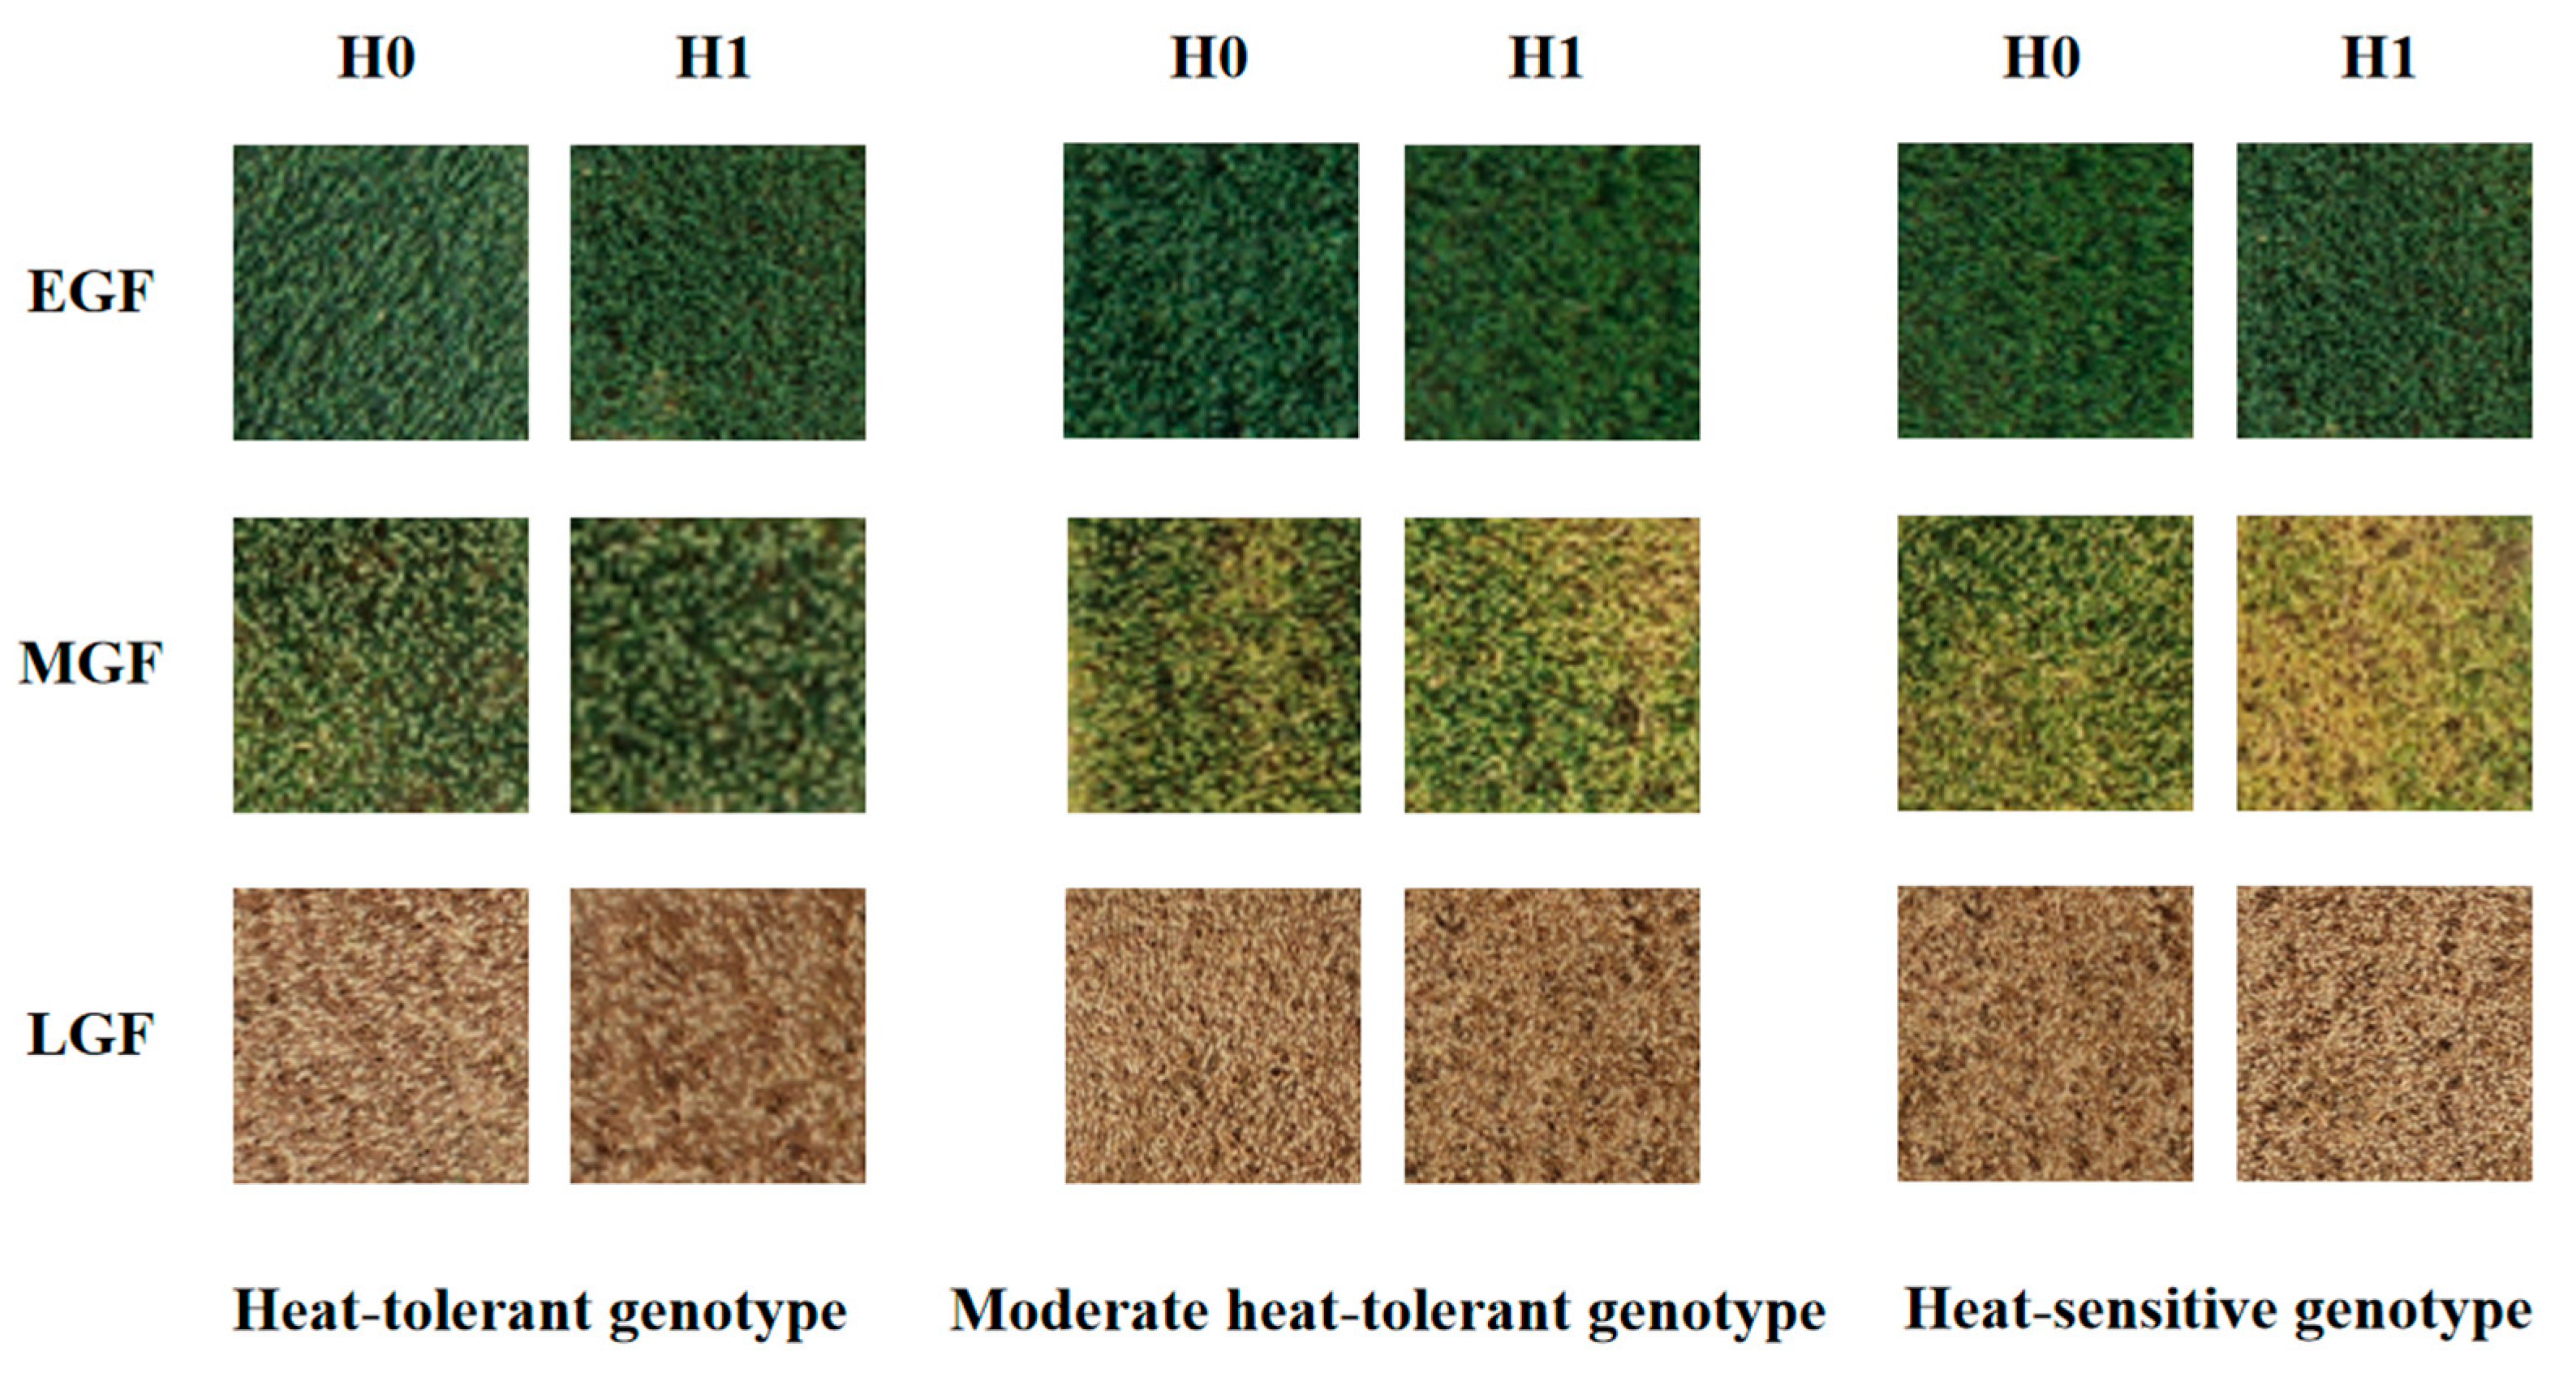
3.4. Species Classification Validation

High temperatures during the filling period of wheat significantly impact grain quality, particularly the accumulation and synthesis of starch and protein. This effect is primarily attributed to the functioning of related synthetic enzymes. Studies have demonstrated that under drought conditions, the activity of these enzymes decreases, directly affecting wheat yield [73]. Similarly, under high-temperature stress, proteins may suffer damage, leading to the disruption of their synthesis, inactivation of major enzymes, and destruction of cell membranes. Cell division is significantly affected by heat stress, ultimately influencing wheat yield [74].
Heat stress also affects thylakoid membranes, leading to chlorophyll degradation and crop senescence. Reduced plant photosynthetic capacity occurs due to metabolic restriction and oxidative damage to chloroplasts, resulting in decreased grain yield and dry matter accumulation [75]. High-temperature stress severely damages photosynthetic organs, causing a slowdown in leaves’ photosynthetic activity and accelerated leaf senescence. These factors collectively contribute to a slower buildup of dry mass and a reduction in the time taken for grain filling, ultimately leading to a decrease in grain weight and yield [76].
Heat resistance in wheat cultivars can be assessed by their ability to synthesize assimilates under heat stress [77]. Developing heat-tolerant is essential for cereal plants, like wheat, to improve grain quality and yield under high-temperature conditions [78]. Based on the above, a two-year physiological experiment was carried out [79]. Based on SOD activity, grain weight per spike, CAT activity, 1000-grain weight, canopy temperature, MDA content, and yield, 20 wheat varieties were divided into different heat-tolerant genotypes [79], which were the heat-tolerant genotype (HTG), moderate heat-tolerant genotype (MHTG) and heat-sensitive genotype (HSG) in Table 5.
With the extension of the filling stage, the phenotypic changes of three heat-tolerant genotypes of wheat were extracted (Figure 7). It can be obtained that there are great differences in the traits and image characteristics of different genotypes in time. This disparity can be attributed to the heat-tolerant genotype’s inability to maintain high carbohydrate assimilation during heat stress [80], the heat stress treatment employed in the experiment further accentuated the divergences between the different wheat varieties. To facilitate efficient and large-scale assessment, unmanned aerial vehicles platforms were utilized. These unmanned aerial vehicle platforms demonstrated their capability to rapidly segregate genotypes and differentiate between various wheat varieties [81]. For the same genotype, there is a strong association between spectral indices assessed within a single environment and those measured across multiple environments [35,82]. It means that the spectral indices and canopy information generated by the unmanned aerial vehicles can be employed to forecast how much a genotype will produce in various circumstances, so in this paper, three genotypes of wheat, HTG, MHTG, and HSG, were distinguished and all treatments of the same genotypes were integrated and yield regressions were estimated separately.

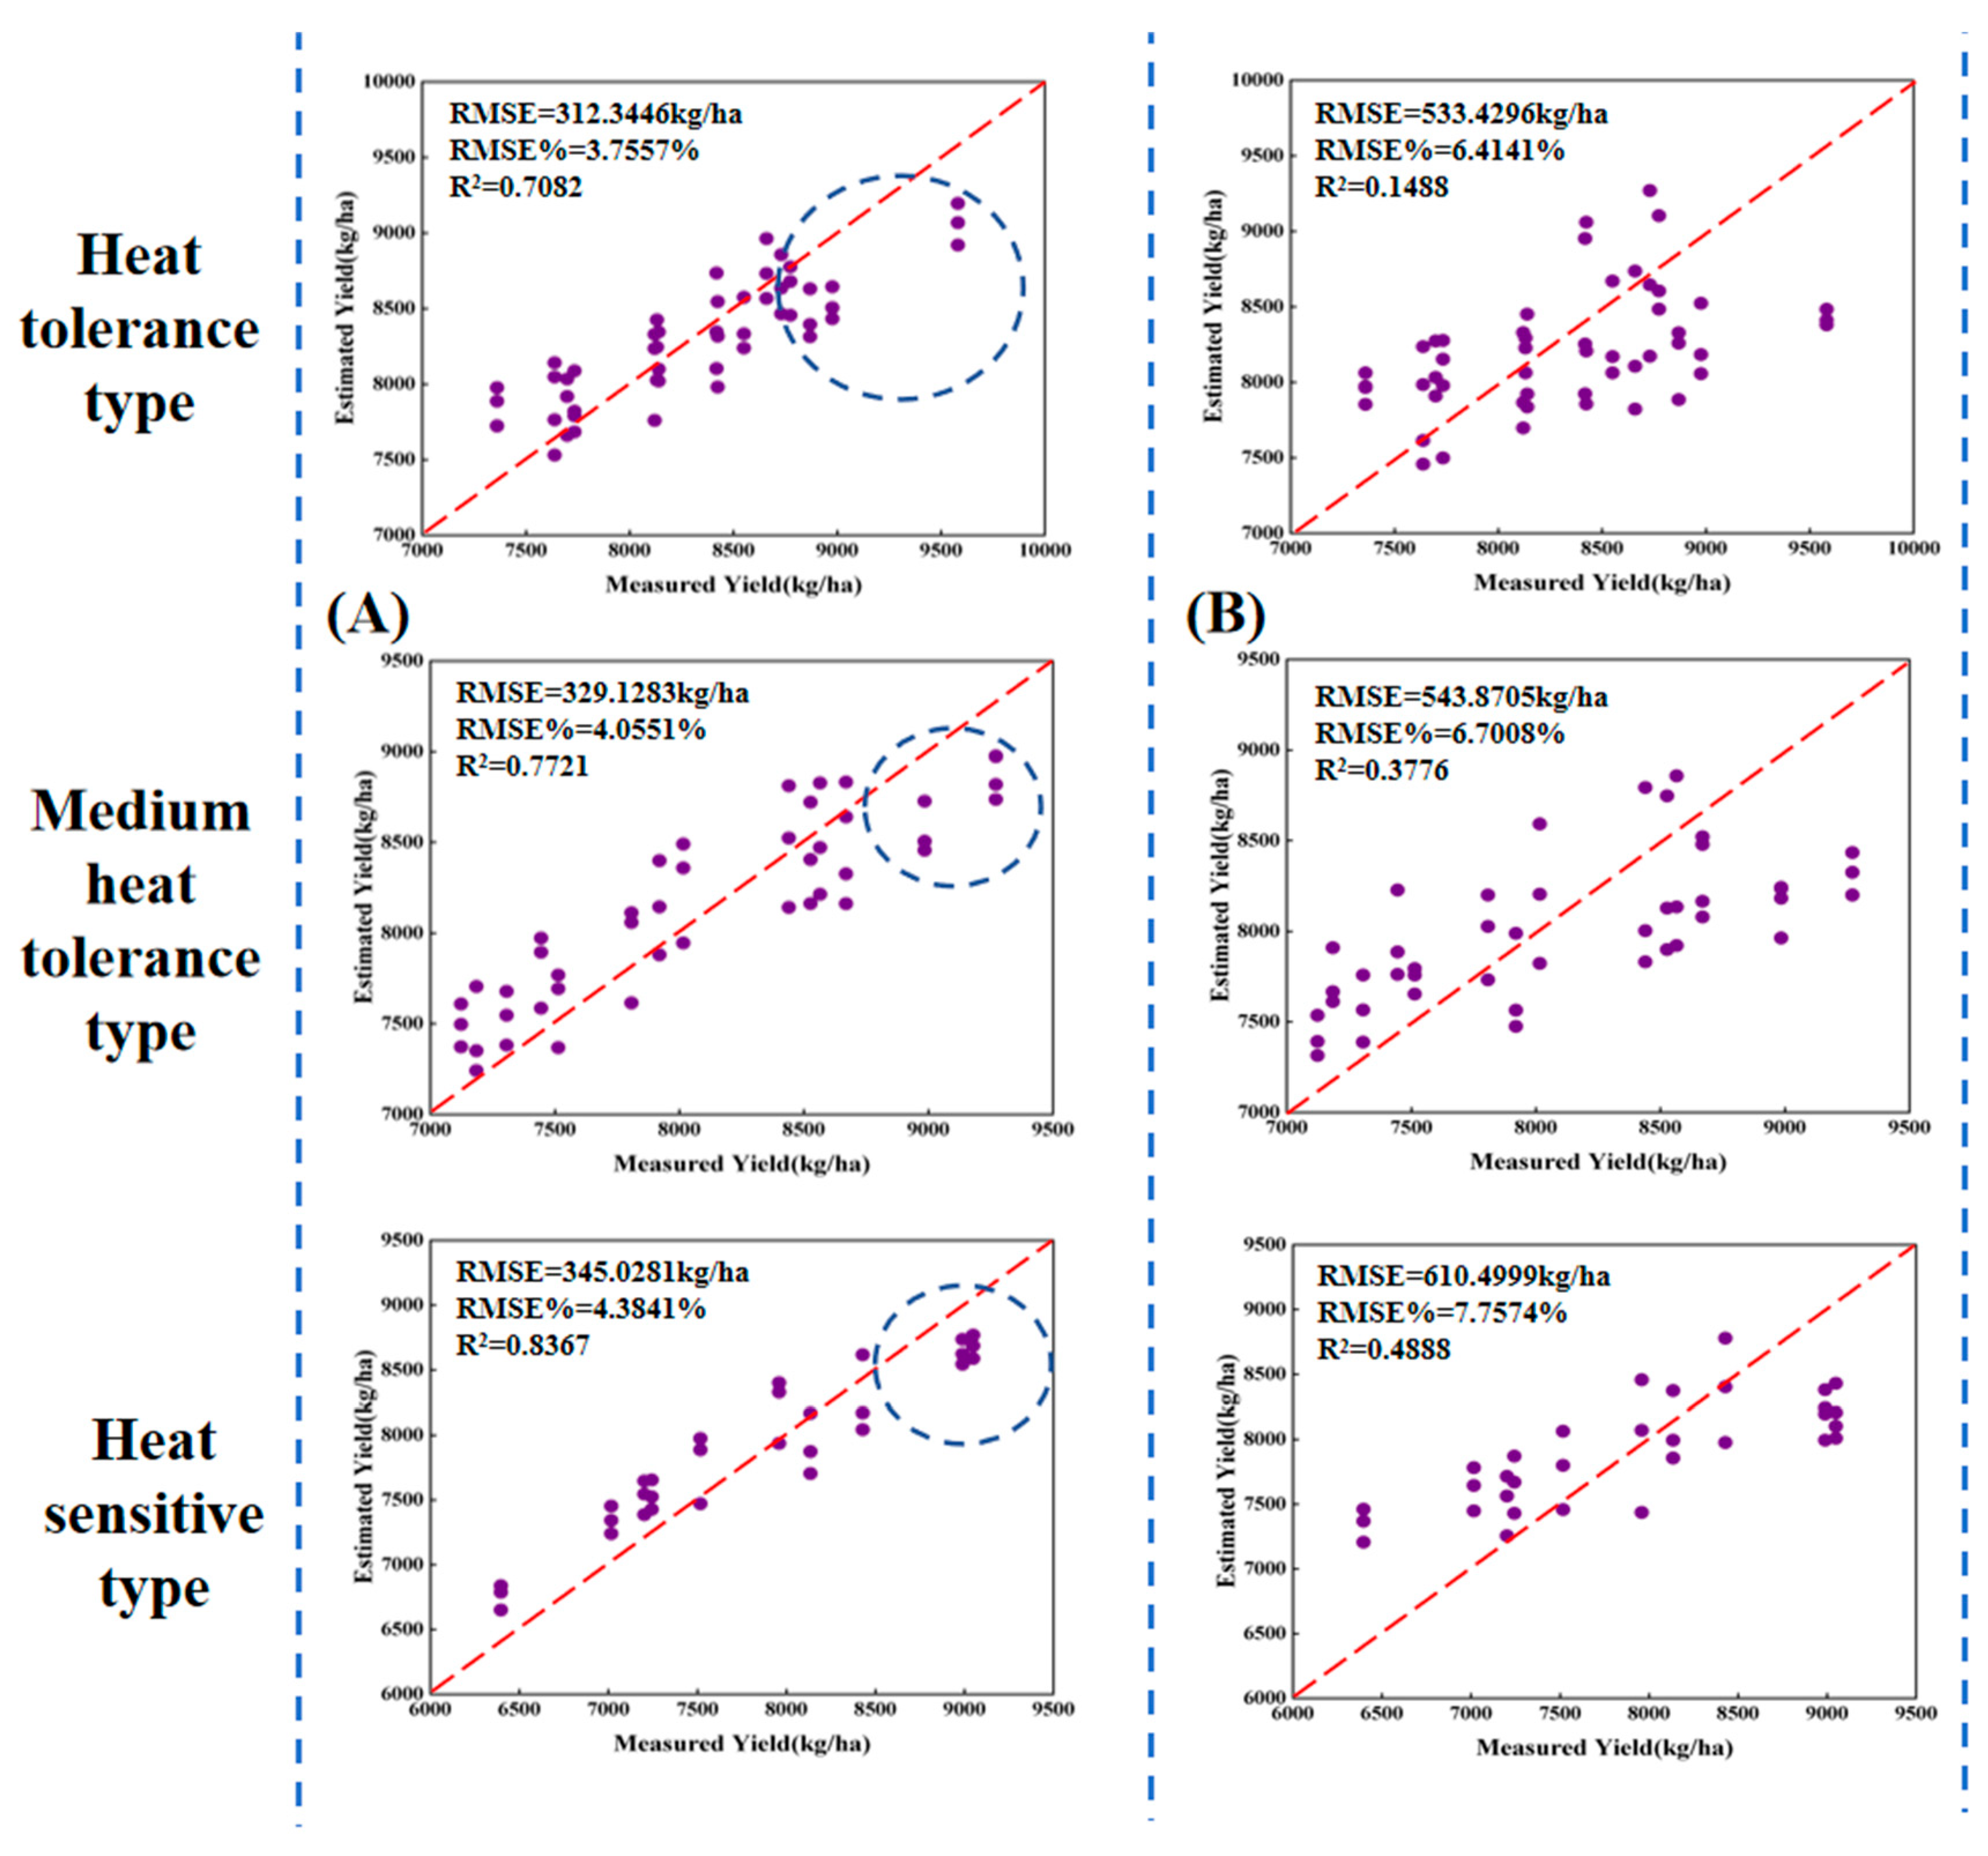
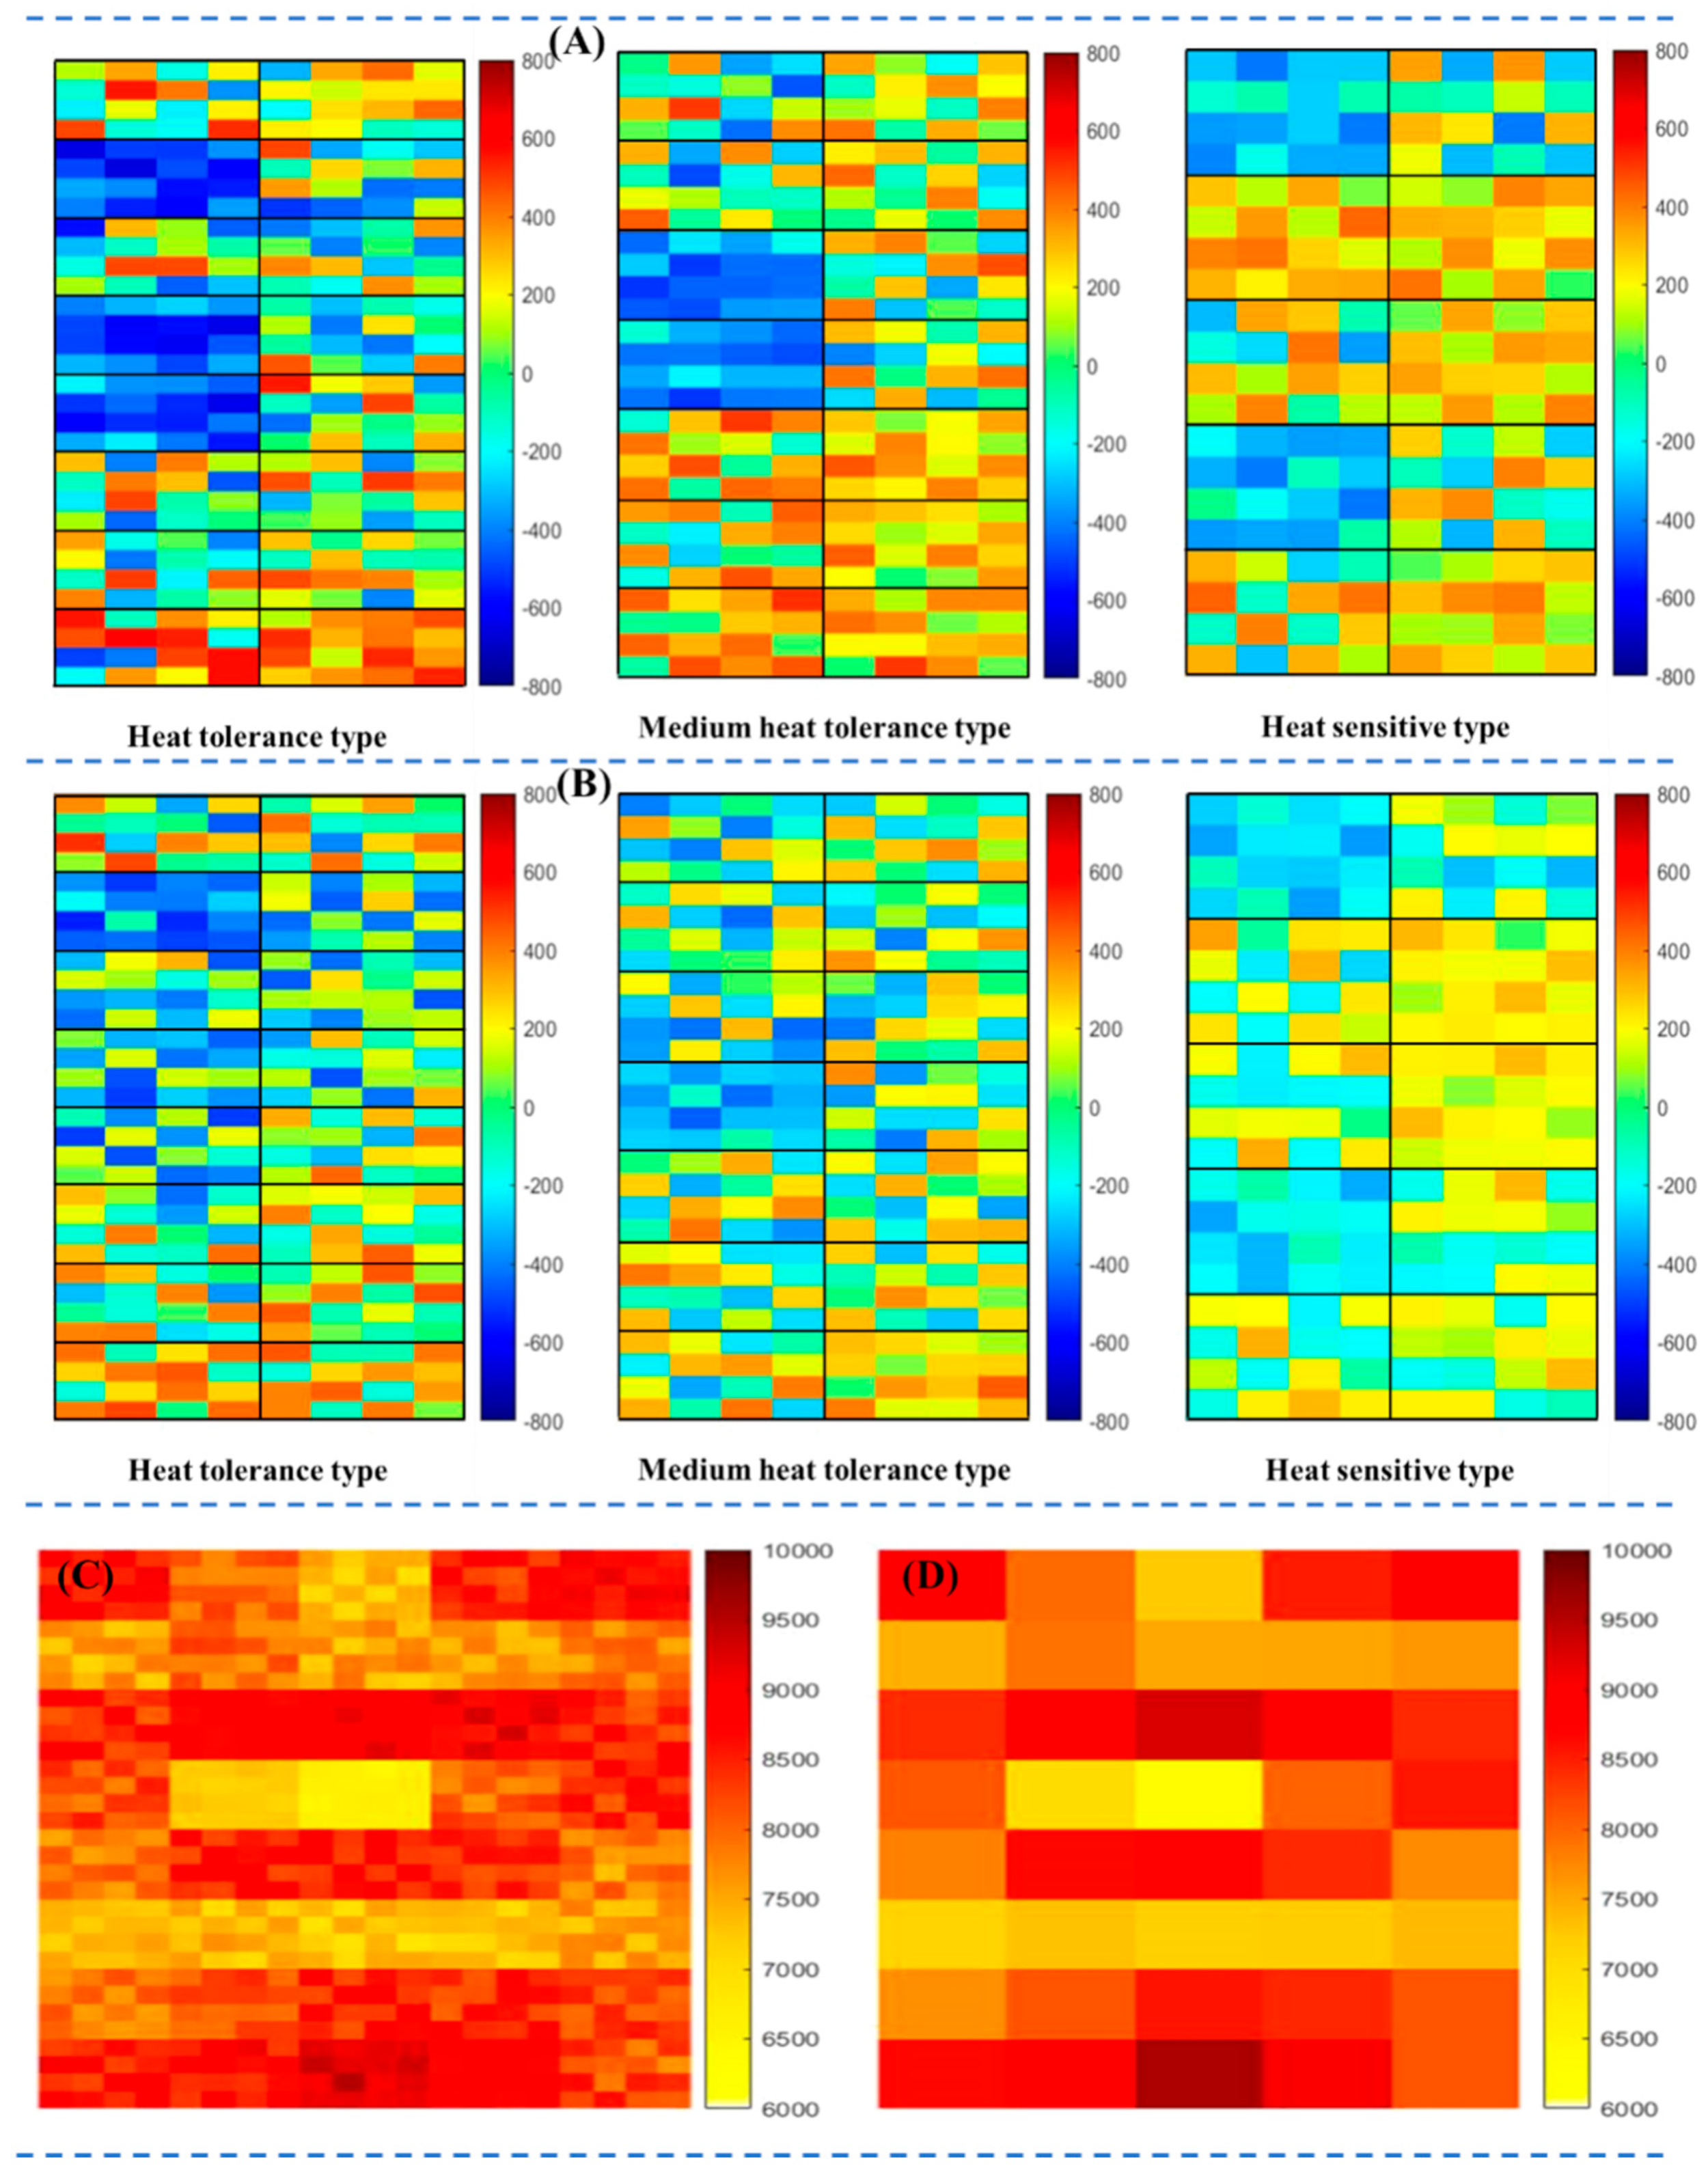
3.5. Multi-Genotype-Based Yield Estimation

3.5.1. Spectral-Index-Based Yield Regression

The long and short-term memory network with the best prediction performance was chosen to predict grain yield for three different heat-tolerant genotypes of wheat. The vegetation index served as an input variable, and the obtained yield estimates were compared with corresponding observations using scatter plots (Figure 8A). The results indicated significant variations in yield prediction for different heat-tolerant wheat types. Where the heat-tolerant wheat predicted poorly: R2 = 0.71 and RMSE = 312.35 kg/ha; The moderate heat-tolerant genotype predicted better than the heat-tolerant genotype: R2 = 0.77 and RMSE = 329.13 kg/ha; The heat-sensitive genotype predicted best: R2 = 0.84, RMSE = 345.03 kg/ha.
Figure 6A were split according to three wheat genotypes, obtaining a scatter plot (Figure 8B). Figure 8B was compared with the regression prediction results (Figure 8A) for the three genotypes. The R2 of heat-tolerant wheat increased by 0.56, the R2 of moderate heat-tolerant wheat increased by 0.40, and the R2 of heat-sensitive genotype increased by 0.35. Distinguishing different heat-tolerant genotypes of wheat significantly influenced the yield estimation effect, resulting in a notable increase in the regression effect. The yield estimation results for all genotypes were excellent, with overall R2 exceeding 0.7, demonstrating the strong predictive performance of the LSTM model for different genotypes of wheat.
The differences in the regression effect of different genotypes of wheat can be attributed to the spectral information’s ability to better reflect the physiological characteristics of wheat and express the spatial characteristics of the varieties [83] and better express the spatial characteristics of the varieties. Among them, heat-sensitive genotype yield prediction was better, probably because the phenotype of heat-sensitive genotype differed too much in different filling stages and the spectral index of response differed too much, resulting in better yield prediction of heat-sensitive genotype. Physiological characteristics may better capture the differences between heat-tolerant genotypes compared to appearance-based features. From the spectral expression of the three heat-tolerant genotypes (Figure 9), it can be seen that with the time change of the filling period, there is a great difference in the spectral information of different heat-tolerant genotypes of wheat, where the coefficient of variation (CV) of heat-tolerant wheat CV = 31.25%, moderate heat-tolerant CV = 34.32%, and sensitive CV = 36.52%. The increasing CV values indicate that the differences between different heat-tolerant genotypes of wheat grew as the filling period extended, significantly affecting the yield estimation results with notable variations among genotypes, all of which were superior to the yield regression estimation of multi-species wheat.
Notably, for instances with grain yields exceeding 8800 kg/ha, the regression results for all genotypes underestimated grain yields, as evidenced by the data points encircled in blue circles in Figure 8A. This phenomenon could be linked to the optical remote sensing asymptotic saturation issue, particularly at moderate to high yields [84].

3.5.2. Yield Regression Based on Spectral Index Combined with Canopy

The grain yield estimates obtained were compared with the corresponding observations using scatter plots to assess the performance of adding canopy information in improving estimation accuracy. The yield prediction results varied significantly for wheat with different heat-tolerant genotypes. It was observed that the combination of vegetation index (VI) and canopy structure information outperformed the use of VI data alone in wheat yield estimation, as shown in Figure 10. The best performance was found for the heat-sensitive genotype, R2 = 0.91, RMSE = 255.63 kg/ha; the heat-tolerant genotype for wheat was predicted less well, R2 = 0.79, RMSE = 268.17 kg/ha; and the moderate heat-tolerant genotype was predicted better than the heat-tolerant genotype R2 = 0.85, RMSE = 268.70 kg/ha.
Figure 6B is split according to three wheat genotypes in a scatter plot (Figure 10B). Figure 10B compares the regression prediction results (Figure 10A) for the three genotypes. The R2 of heat-tolerant wheat improved more, by 0.56; the R2 of moderate heat-tolerant wheat by 0.38; and the R2 of the heat-sensitive genotype by 0.35.
The integration of multispectral and RGB structure information resulted in a significant enhancement in prediction accuracy compared to utilizing a single sensor. Moreover, the combination of spectral indices and canopy information further improved the estimation of heat-tolerant genotype, achieving an overall improvement of approximately 0.07. This improvement can be attributed to the complementary aspects of canopy structure obtained from RGB. The independent information about canopy development and structure derived from RGB, such as CH, contributes valuable insights that are not attainable from spectral features alone [85]. Due to the differences in different genotypes of wheat varieties, the farm plots form different canopy structures and the spectra show different characteristic reflection curves. Therefore, the inclusion of canopy information is more expressive of spatial features and will improve the regression effect.
The canopy structures formed by different genotypes of wheat varieties exhibit distinct characteristics in their reflection curves. This variability in spectra and canopy structures necessitates the inclusion of canopy information to better capture spatial features and enhance the regression performance. Addressing the issue of under-prediction in the high-yield region, the utilization of the blue circle section has shown promising results. This integration of spectral and structural data helps overcome the asymptotic saturation problem that may arise in spectral characteristics [50]. The complementary nature of structural and spectral information is a key factor contributing to this improvement [86]. Numerous prior investigations have also validated the potential of combining spectral and structural data for accurate grain yield estimation [24,25].

3.6. Comparison and Application of Yield Forecasting

It is obvious from the VI regression analysis plot (Figure 11A) that the spatial prediction error of heat-sensitive wheat is large, RMSE% = 4.38%; the spatial prediction error of moderate heat-tolerant wheat is average, RMSE% = 4.06%; and the spatial prediction error of high-tolerant wheat is better, RMSE% = 3.76%; From the random distribution of the spatial prediction error of the model in Figure 9, it is evident that the model has indeed been modified to forecast the yield among many genotypes that are heat-tolerant, and the prediction error of different genotypes is different.
The VI combined with the canopy regression analysis plot (Figure 11B) clearly shows that the spatial prediction error of heat-tolerant wheat is large, RMSE% = 3.22%; the spatial prediction error of moderate heat-tolerant wheat is average, RMSE% = 3.31%; the spatial prediction error of heat-sensitive wheat is better, RMSE% = 3.25%. As can be seen from the stochastic distribution of errors (Figure 10), the errors in the combined canopy yield predictions are also reduced to some extent, and the regression predictions for all three wheat genotypes are reduced and more homogeneous than the predictions using a single sensor, demonstrating that combining spectral and structural data to predict grain yields is excellent.
The error analysis plot presented in Figure 11A,B indicates a noticeable reduction in prediction errors of heat stress treatment (H1) in comparison to the normal treatment (H0). This decrease can be attributed to the distinct developmental gaps observed in wheat with various heat-tolerant genotypes. These differences influence crop reflectance, consequently leading to varying prediction errors for wheat subjected to different temperature treatments. Notably, in wheat, seed weight correlates with assimilates derived from photosynthesis or reactivated from nutritive tissue to the growing reproductive tissue (seeds) [87]. Under high temperatures, grain yield reduction per plant during the filling stage can be attributed to increased growth and/or leaf senescence caused by a slowed photosynthetic rate [88]. Due to the significant variability in the sensitivity of wheat to high temperatures, this phenomenon may explain the model’s accurate prediction and low error rate.
In addition to the error analysis, a spatial distribution map of yields was generated based on the predictions of the above model, as shown in Figure 11C. This map demonstrates good agreement with the real yield distribution map (Figure 11D). The use of multispectral and RGB sensor data for calculating vegetation indices and plant canopy information has proven sufficient for accurately predicting wheat yields.

4. Discussion

In this paper, a temperature stress experiment in a field environment was utilized to conduct a unmanned aerial vehicle remote-sensing-based yield estimation study, and a representative natural population of wheat varieties in the Huanghuaihai wheat region was selected as the research object. Spectral indices and canopy structure were generated based on unmanned aerial vehicle multispectral image data of wheat canopies under high temperature stress, unmanned aerial vehicle RGB image data, wheat height data collected on the ground, and wheat yield data. Taking the three key periods of the irrigation period, pre-irrigation, mid-irrigation, and late-irrigation data as input features, five representative machine learning data analysis modeling methods, namely, partial least squares regression (PLSR) [68], random forest (RF) [69], support vector machine (SVM) [70], BP neural network model (BP NN) [71], and long-short-term memory network (LSTM) [72], were used to explore the yield prediction models of the five machine learning algorithms in different irrigation periods of wheat, and the accuracy and fusion of multi-source data were investigated. The potential of the five machine learning algorithm yield prediction models in different wheat sizing periods was explored in terms of prediction accuracy and multi-source data fusion for yield prediction. In order to explore higher prediction accuracy, a new method for wheat yield prediction is proposed, in which wheat is differentiated according to different heat-tolerant genotypes, and the LSTM algorithm with the optimal prediction effect is selected to establish single-sensor and multi-sensor remote sensing data fusion yield estimation models for different genotypes of wheat, and compare the accuracy of the estimation and assess the prediction accuracy of different heat-tolerant types of wheat in the large-field environment based on the spectral remote sensing imagery of unmanned aircraft. environment with prediction accuracy. The main conclusions are as follows:
The changes in spectral reflectance of wheat canopy were different for different varieties of wheat under different temperature treatments and at different critical grouting periods. For the image bands acquired by the multispectral drone, ratio or difference operations were performed to generate 13 vegetation indices, and it was found that the wheat canopy vegetation index showed a decreasing trend with the increase of the extension of the time of the grouting period, and this trend became more obvious as the wheat grew. For the wheat canopy vegetation indices under different temperature treatments, they were lower than the standardized wheat canopy vegetation indices of the experimental control in both the middle and late stages of the wheat grouting period. It is precisely because the spectra reflect different changes in different varieties, wheat grouting periods, and temperature treatments that the feasibility of the spectral indices as an input variable for predicting the yield of wheat is demonstrated [17,28].
For the canopy height observation of wheat, based on different varieties of wheat, different irrigating periods, different temperature treatments, the obtained CHM was compared with the real wheat canopy height, and the correlation R2 values between the observed crop surface model and the real canopy height were 0.906, 0.90, 0.923, respectively. It can be concluded that the applicability of extracting canopy information based on the RGB unmanned aerial vehicle is real and effective, the RGB unmanned aerial vehicles are able to predict the canopy height well, and the regression prediction results compared with the real canopy information are basically consistent.
For the time-series data of wheat during the filling period, the vegetation indices generated by the multispectral sensor were used as input parameters to the five machine learning models. The wheat yield estimation models were built to predict the wheat yield. The validation accuracies of the yield prediction models constructed by the five machine learning algorithms ranged from 0.1882 to 0.3951 for R2 and from 645.5558 to 557.2632 kg-hm2 and 7.9360 to 6.8506% for RMSE and RMSE%, respectively. Among them, the multi-species wheat yield prediction model established by LSTM algorithm during the filling period showed better prediction accuracy. The LSTM model with the optimal prediction effect was selected, and the unmanned aerial vehicle sensor system was established by combining the RGB unmanned aerial vehicle with the vegetation index combined with the wheat canopy information to establish a multimodal wheat prediction model, in which the R2 was improved by 0.07 compared with the single sensor, and the RMSE and RMSE% were decreased by 33.92 and 0.42 compared with the multispectral sensor, respectively. However, this may be due to the effects of multi-species and multi-treatment, and the farmland information is too complicated, with the result that the wheat yield prediction effect is not close to the harvested wheat yield. Therefore, a new method for wheat yield prediction is proposed in the subsequent study, using LSTM model to regressively predict different categories of wheat.
Twenty wheat varieties were categorized according to different heat-tolerant genotypes into heat-tolerant genotypes, moderate heat-tolerant genotypes, and high-sensitive genotypes. The LSTM model, which has the best prediction effect among the above machine learning models, was selected, and the vegetation index extracted based on multispectral unmanned aerial vehicle was used as the input variable to predict the yield regression of the three genotypes of wheat, in which the R2 of heat-tolerant genotypes, moderate heat-tolerant genotypes, and high-sensitive genotypes ranged from 0.71 to 0.84 and the RMSE ranged from 312.35 to 345.03. Comparing with the multi-species wheat yield prediction, the estimation accuracies of the model predictions were all improved, ranging from 0.35 to 0.56. It can be proved that the LSTM model performs well in predicting the yield of different genotypes of wheat. This indicates that the LSTM model can handle the genotypic differences of wheat well with good accuracy and stability. By comparing the coefficients of variation between the spectra of different heat-tolerant wheat, it is found that the difference is gradually increasing with the extension of time, which is also the reason for the good effect of regression for distinguishing the yield of different genotypes of wheat.
Multi-sensor data fusion by combining spectral indices with wheat canopy information to build a multimodal wheat prediction model significantly improved the prediction accuracy compared to using only a single sensor, with an overall improvement of about 7% and an R2 of up to 0.91. Multi-sensor data fusion shows great potential for unmanned aerial vehicle yield estimation, and the added wheat canopy structural information helped to increase the model’s spatial adaptability and better representation of spatial features, which will ultimately improve the regression effect of wheat yield, confirming the potential of combining spectral and structural information in cereal yield prediction.
Yield regression prediction error maps were established to compare the differences in prediction errors among the three genotypes, obtaining a large spatial prediction error for heat-tolerant wheat with RMSE% = 4.40%, an average spatial prediction error for medium heat-tolerant wheat with RMSE% = 3.63%, and a better spatial prediction error for heat-tolerant wheat with RMSE% = 3.76%. The final generation of randomly distributed spatial distribution maps of yield provides more possibilities to help farmers and agricultural scientists to make crop management and marketing decisions based on the predicted yield potential.
In agricultural production, numerous plots are involved, and in the future, as the scale of prediction expands to encompass thousands of acres of wheat, differentiating these plots based on their heat-tolerant genotypes and selecting an appropriate yield prediction model can significantly enhance prediction accuracy. This approach offers benefits to breeders, who can utilize more precise predictive models without the necessity of harvesting every single plot to calculate yield. Consequently, it becomes possible to reduce trial costs and data collection time, while obtaining yield distributions rapidly. The efficiency of the unmanned aerial vehicle phenotypic analysis makes it possible to monitor dynamics with high temporal resolution. Farmers and agricultural scientists stand to gain from accurate yield forecasts, providing them with additional options for crop management and sales, based on the projected yield potential. These advancements present new ideas and solutions to the agricultural sector.
The main problems and prospects of the study are as follows: (I) This study’s prediction analysis focused on 20 representative wheat varieties in the Yellow and Huaihai regions. However, to further improve the yield estimation models and broaden their applicability, future research should encompass a more diverse set of plots and incorporate a greater variety of wheat genotypes for prediction analysis. By expanding the scope of study to include more plots and varieties, researchers can refine and develop a more comprehensive understanding of yield prediction, build more variety of yield estimation models. (II) This paper employs remote sensing time-series data during the irrigation period to develop a yield prediction model. Additionally, it explores the potential of machine learning algorithms to enhance the precision of crop yield prediction through multimodal data fusion. While machine learning models show promise in leveraging remotely sensed data for crop yield estimation, further investigation is required to integrate this data with other pertinent perturbation factors, such as soil conditions, weather patterns, and management information. The combination of remote sensing data with these factors is crucial to achieve more accurate crop yield estimation. (III) The current unmanned aerial vehicle remote sensing platform solely relies on RGB and multispectral drones, lacking the capture of hyperspectral reflectance and thermal information provided by hyperspectral and thermal infrared sensors for fusion analysis. Further exploration can be based on different high-throughput phenotyping platforms, field phenotyping vehicles, etc., equipped with LIDAR, hyperspectral sensors, thermal infrared cameras, and other sensors to obtain more multi-modal, multi-temporal phenotyping data. Collecting such multi-modal, multi-temporal phenotyping data will enable the establishment of more comprehensive yield estimation models, resulting in prediction models of superior accuracy.

5. Conclusions

This study explores the potential of predicting wheat crop yields for different heat-tolerant genotypes during the wheat filling period, utilizing a low-cost multispectral and RTK unmanned aerial vehicle combination in conjunction with the LSTM model. The main findings indicate that the LSTM model can effectively regress crop yield for wheat data during the filling period, yielding an impressive R2 value of up to 0.91. Furthermore, differentiating between various heat-tolerant genotypes of wheat for yield assessment outperforms the combined assessment approach, particularly excelling in the regression of high temperature-sensitive wheat. The integration of spectral information with canopy data proves to be a valuable enhancement, contributing to a notable improvement in prediction accuracy, approximately by 0.07. This fusion of data aids in establishing a spatially adaptive model, reducing spatial dependence and variability. As a result, the generated field yield forecast maps exhibit outstanding spatial resolution, enabling the provision of yield distributions for multi-strain wheat collections. In summary, this study successfully demonstrates a robust strategy for yield prediction, achieved through the differentiation of various wheat heat-tolerant genotypes to facilitate accurate yield estimation. The precise prediction of wheat yield holds substantial potential in supporting informed agricultural management decisions, especially concerning emergency forecasting for different wheat genotypes within vast agricultural landscapes comprising thousands of plots with diverse varieties.

Author Contributions

T.C.: conceptualization, methodology, software, investigation, writing—original draft, writing—review and editing, formal analysis, data curation. M.L.: data curation, investigation, resources. L.Q.: project administration, funding acquisition, resources. Y.S.: project administration, supervision, resources. Z.L.: software, supervision, validation, visualization. H.L.: supervision, validation, visualization. X.D.: data curation, validation, visualization. All authors have read and agreed to the published version of the manuscript.

Funding

This work was supported by the National Natural Science Foundation of China under the project (Nos. 32271998, 52075092) and 2023 Anhui University Natural Science Major Project (2023AH040138): Key Technology of Precision Application and Creation of Intelligent Plant Protection Equipment.

Data Availability Statement

Data will be made available on request.

Conflicts of Interest

Author Hailong Li was employed by the company Weichai Lovol Intelligent Agricultural Technology Co., Ltd. The remaining authors declare that the research was conducted in the absence of any commercial or financial relationships that could be construed as a potential conflict of interest.

References

  1. Zhu, Y.H.; Wei, C.C.; Chi, Y.B.; Yang, P.L. The Influencing Mechanisms of Reclaimed Water on N2O Production in a Multiyear Maize-Wheat Rotation. Agronomy 2023, 13, 2393. [Google Scholar] [CrossRef]
  2. Hickey, L.T.; Hafeez, A.N.; Robinson, H.; Jackson, S.A.; Leal-Bertioli, S.C.M.; Tester, M.; Gao, C.; Godwin, I.D.; Hayes, B.J.; Wulff, B.B.H. Breeding crops to feed 10 billion. Nat. Biotechnol. 2019, 37, 744–754. [Google Scholar] [CrossRef]
  3. Bergkamp, B.; Somayanda, I.; Asebedo, A.R.; Fritz, A.K.; Jagadish, K. Prominent winter wheat varieties response to post-flowering heat stress under controlled chambers and field based heat tents. Field Crops Res. 2018, 222, 143–152. [Google Scholar] [CrossRef]
  4. Prasad, P.V.V.; Maduraimuthu, D. Response of floret fertility and individual grain weight of wheat to high temperature stress: Sensitive stages and thresholds for temperature and duration. Funct. Plant Biol. 2014, 41, 1261. [Google Scholar] [CrossRef]
  5. Darguza, M.; Gaile, Z. The Productivity of Crop Rotation Depending on the Included Plants and Soil Tillage. Agriculture 2023, 13, 1751. [Google Scholar] [CrossRef]
  6. Xu, X.X.; Liu, S.; Meng, F.A.; Zhang, X.; Zhao, J.K.; Qu, W.K.; Shi, Y.; Zhao, C.X. Grain Yield Formation and Nitrogen Utilization Efficiency of Different Winter Wheat Varieties under Rainfed Conditions in the Huang-Huai-Hai Plain. Agronomy 2023, 13, 915. [Google Scholar] [CrossRef]
  7. Yang, F.Q.; Liu, Y.; Yan, J.Y.; Guo, L.X.; Tan, J.X.; Meng, X.F.; Xiao, Y.B.; Feng, H.K. Winter Wheat Yield Estimation with Color Index Fusion Texture Feature. Agriculture 2024, 14, 581. [Google Scholar] [CrossRef]
  8. Zhu, J.K.; Li, Y.M.; Wang, C.Y.; Liu, P.; Lan, Y.B. Method for Monitoring Wheat Growth Status and Estimating Yield Based on UAV Multispectral Remote Sensing. Agronomy 2024, 14, 991. [Google Scholar] [CrossRef]
  9. Liu, T.; Wu, F.; Mou, N.N.; Zhu, S.L.; Yang, T.L.; Zhang, W.J.; Wang, H.; Wu, W.; Zhao, Y.Y.; Sun, C.M.; et al. The estimation of wheat yield combined with UAV canopy spectral and volumetric data. Food Energy Secur. 2024, 13, e527. [Google Scholar] [CrossRef]
  10. Maimaitijiang, M.; Ghulam, A.; Sidike, P.; Hartling, S.; Maimaitiyiming, M.; Peterson, K.; Shavers, E.; Fishman, J.; Peterson, J.; Kadam, S. Unmanned Aerial System (UAS)-based phenotyping of soybean using multi-sensor data fusion and extreme learning machine. ISPRS J. Photogramm. Remote Sens. 2017, 134, 43–58. [Google Scholar] [CrossRef]
  11. Sagan, V.; Maimaitijiang, M.; Sidike, P.; Maimaitiyiming, M.; Fritschi, F.B. UAV/Satellite Multiscale Data Fusion for Crop Monitoring and Early Stress Detection. In Proceedings of the 4th ISPRS Geospatial Week 2019, Enschede, The Netherlands, 10–14 June 2019. [Google Scholar]
  12. Liu, S.C.; Huang, Z.; Xu, Z.H.; Zhao, F.J.; Xiong, D.L.; Peng, S.B.; Huang, J.L. High-throughput measurement method for rice seedling based on improved UNet model. Comput. Electron. Agric. 2024, 219, 108770. [Google Scholar] [CrossRef]
  13. Ma, F.M.; Wang, M.Y.; Yan, N.; Adnan, M.; Jiang, F.H.; Hu, Q.; He, G.Y.; Shen, Y.J.; Wan, Y.; Yang, Y.X.; et al. A fast and efficient phenotyping method to estimate sugarcane stalk bending properties using near-infrared spectroscopy. Eur. J. Agron. 2024, 154, 127107. [Google Scholar] [CrossRef]
  14. Zhu, H.L.; Huang, Y.W.; An, Z.K.; Zhang, H.; Han, Y.Y.; Zhao, Z.H.; Li, F.F.; Zhang, C.; Hou, C.C. Assessing radiometric calibration methods for multispectral UAV imagery and the influence of illumination, flight altitude and flight time on reflectance, vegetation index and inversion of winter wheat AGB and LAI. Comput. Electron. Agric. 2024, 219, 108821. [Google Scholar] [CrossRef]
  15. Meiyan, S.; Mengyuan, S.; Qizhou, D.; Xiaohong, Y.; Baoguo, L.; Yuntao, M. Estimating the maize above-ground biomass by constructing the tridimensional concept model based on UAV-based digital and multi-spectral images. Field Crops Res. 2022, 282, 108491. [Google Scholar] [CrossRef]
  16. Fei, S.; Hassan, M.A.; He, Z.; Chen, Z.; Shu, M.; Wang, J.; Li, C.; Xiao, Y. Assessment of Ensemble Learning to Predict Wheat Grain Yield Based on UAV-Multispectral Reflectance. Remote Sens. 2021, 13, 2338. [Google Scholar] [CrossRef]
  17. Hassan, M.A.; Yang, M.; Rasheed, A.; Yang, G.; Reynolds, M.; Xia, X.; Xiao, Y.; He, Z. A rapid monitoring of NDVI across the wheat growth cycle for grain yield prediction using a multi-spectral UAV platform. Plant Sci. 2019, 282, 95–103. [Google Scholar] [CrossRef]
  18. Yang, B.; Zhu, Y.; Wang, M.; Ning, J. A Model for Yellow Tea Polyphenols Content Estimation Based on Multi-Feature Fusion. IEEE Access 2019, 7, 180054–180063. [Google Scholar] [CrossRef]
  19. Xia, L.; Zhang, R.; Chen, L.; Li, L.; Yi, T.; Wen, Y.; Ding, C.; Xie, C. Evaluation of Deep Learning Segmentation Models for Detection of Pine Wilt Disease in Unmanned Aerial Vehicle Images. Remote Sens. 2021, 13, 3594. [Google Scholar] [CrossRef]
  20. Elsayed, S.; Elhoweity, M.; Ibrahim, H.H.; Dewir, Y.H.; Migdadi, H.M.; Schmidhalter, U. Thermal imaging and passive reflectance sensing to estimate the water status and grain yield of wheat under different irrigation regimes. Agric. Water Manag. 2017, 189, 98–110. [Google Scholar] [CrossRef]
  21. Yu, N.; Li, L.; Schmitz, N.; Tian, L.F.; Greenberg, J.A.; Diers, B.W. Development of methods to improve soybean yield estimation and predict plant maturity with an unmanned aerial vehicle based platform. Remote Sens. Environ. 2016, 187, 91–101. [Google Scholar] [CrossRef]
  22. Zhang, W.L.; Niu, S.D.; Yao, J.X.; Zhang, Y.P.; Li, X.; Dong, H.X.; Si, S.; Li, H.; Li, X.L.; Ren, J.H.; et al. Responses of Physiological Traits and Grain Yield to Short Heat Stress during Different Grain-Filling Stages in Summer Maize. Agronomy 2023, 13, 2126. [Google Scholar] [CrossRef]
  23. Liu, Q.X.; Wang, J.S.; Wu, A.L.; Sun, A.Q.; Dong, E.R.; Wang, Y.; Huang, X.L.; Hu, H.W.; Jiao, X.Y. Plant-associated microorganisms during the reproductive period best predict sorghum yield and quality. Field Crops Res. 2023, 304, 109167. [Google Scholar] [CrossRef]
  24. Geipel, J.; Link, J.; Claupein, W. Combined Spectral and Spatial Modeling of Corn Yield Based on Aerial Images and Crop Surface Models Acquired with an Unmanned Aircraft System. Remote Sens. 2014, 6, 10335–10355. [Google Scholar] [CrossRef]
  25. Bendig, J.; Yu, K.; Aasen, H.; Bolten, A.; Bennertz, S.; Broscheit, J.; Gnyp, M.L.; Bareth, G. Combining UAV-based plant height from crop surface models, visible, and near infrared vegetation indices for biomass monitoring in barley. Int. J. Appl. Earth Obs. Geoinf. 2015, 39, 79–87. [Google Scholar] [CrossRef]
  26. Galvão, L.; Breunig, F.; Santos, J.; Moura, Y. View-illumination effects on hyperspectral vegetation indices in the Amazonian tropical forest. Int. J. Appl. Earth Obs. Geoinf. 2013, 21, 291–300. [Google Scholar] [CrossRef]
  27. Vollenweider, P.; Günthardt-Goerg, M. Diagnosis of abiotic and biotic stress factors using the visible symptoms in foliage. Environ. Pollut. 2006, 140, 562–571. [Google Scholar] [CrossRef]
  28. Araus, J.L.; Kefauver, S.C.; Zaman-Allah, M.; Olsen, M.S.; Cairns, J.E. Translating High-Throughput Phenotyping into Genetic Gain. Trends Plant Sci. 2018, 23, 451–466. [Google Scholar] [CrossRef]
  29. Hernandez, J.; Lobos, G.A.; Matus, I.; Del Pozo, A.; Silva, P.; Galleguillos, M. Using Ridge Regression Models to Estimate Grain Yield from Field Spectral Data in Bread Wheat (Triticum aestivum L.) Grown under Three Water Regimes. Remote Sens. 2015, 7, 2109–2126. [Google Scholar] [CrossRef]
  30. Furbank, R.; Tester, M. Phenomics—Technologies to relieve the phenotyping bottleneck. Trends Plant Sci. 2011, 16, 635–644. [Google Scholar] [CrossRef]
  31. Großkinsky, D.; Svensgaard, J.; Christensen, S.; Roitsch, T. Plant phenomics and the need for physiological phenotyping across scales to narrow the genotype-to-phenotype knowledge gap. J. Exp. Bot. 2015, 66, 5429–5440. [Google Scholar] [CrossRef]
  32. He, S.Y.; Li, X.N.; Chen, M.G.; Xu, X.Y.; Tang, F.D.; Gong, T.; Xu, M.; Yang, W.Y.; Liu, W.G. Crop HTP Technologies: Applications and Prospects. Agriculture 2024, 14, 723. [Google Scholar] [CrossRef]
  33. Akhtar, M.S.; Zafar, Z.; Nawaz, R.; Fraz, M.M. Unlocking plant secrets: A systematic review of 3D imaging in plant phenotyping techniques. Comput. Electron. Agric. 2024, 222, 109033. [Google Scholar] [CrossRef]
  34. Fahlgren, N.; Gehan, M.; Baxter, I. Lights, camera, action: High-throughput plant phenotyping is ready for a close-up. Curr. Opin. Plant Biol. 2015, 24, 93–99. [Google Scholar] [CrossRef]
  35. Bort, J.; Casadesús, J.; Nachit, M.; Araus, J. Factors affecting the grain yield predicting attributes of spectral reflectance indices in durum wheat: Growing conditions, genotype variability and date of measurement. Int. J. Remote Sens. 2005, 26, 2337–2358. [Google Scholar] [CrossRef]
  36. Bowman, B.C.; Chen, J.; Zhang, J.; Wheeler, J.; Wang, Y.; Zhao, W.; Nayak, S.; Heslot, N.; Bockelman, H.; Bonman, J. Evaluating Grain Yield in Spring Wheat with Canopy Spectral Reflectance. Crop Sci. 2015, 55, 1881–1890. [Google Scholar] [CrossRef]
  37. Fei, S.; Hassan, M.A.; Xiao, Y.; Rasheed, A.; Xia, X.; Ma, Y.; Fu, L.; Chen, Z.; He, Z. Application of multi-layer neural network and hyperspectral reflectance in genome-wide association study for grain yield in bread wheat. Field Crops Res. 2022, 289, 108730. [Google Scholar] [CrossRef]
  38. Kong, J.Y.; Luo, Z.H.; Zhang, C.; Tang, M.; Liu, R.; Xie, Z.; Feng, S.Y. Identification of Robust Hybrid Inversion Models on the Crop Fraction of Absorbed Photosynthetically Active Radiation Using PROSAIL Model Simulated and Field Multispectral Data. Agronomy 2023, 13, 2147. [Google Scholar] [CrossRef]
  39. Kim, N.; Ha, K.-J.; Park, N.-W.; Cho, J.; Hong, S.; Lee, Y. A Comparison Between Major Artificial Intelligence Models for Crop Yield Prediction: Case Study of the Midwestern United States, 2006–2015. ISPRS Int. J. Geo-Inf. 2019, 8, 240. [Google Scholar] [CrossRef]
  40. Maimaitijiang, M.; Sagan, V.; Sidike, P.; Hartling, S.; Esposito, F.; Fritschi, F.B. Soybean yield prediction from UAV using multimodal data fusion and deep learning. Remote Sens. Environ. 2020, 237, 111599. [Google Scholar] [CrossRef]
  41. Hu, G.; Yang, Y.; Dong, Y.; Kittler, J.; Hospedales, T. When Face Recognition Meets with Deep Learning: An Evaluation of Convolutional Neural Networks for Face Recognition. In Proceedings of the IEEE international conference on computer vision workshops 2015, Santiago, Chile, 7–13 December 2015. [Google Scholar]
  42. Fotheringham, A.S.; Crespo, R.; Yao, J. Geographical and Temporal Weighted Regression (GTWR). Geogr. Anal. 2015, 47, 431–452. [Google Scholar] [CrossRef]
  43. Cao, L.; San, X.; Zhao, Y.; Chen, G. The application of the spatio-temporal data mining algorithm in maize yield prediction. Math. Comput. Model. 2013, 58, 507–513. [Google Scholar] [CrossRef]
  44. Liu, Y.; Liang, H.; Lv, X.; Liu, D.; Wen, X.; Liao, Y. Effect of polyamines on the grain filling of wheat under drought stress. Plant Physiol. Biochem. 2016, 100, 113–129. [Google Scholar] [CrossRef] [PubMed]
  45. Han, X.; Thomasson, J.; Bagnall, G.; Pugh, N.; Horne, D.; Rooney, W.; Jung, J.; Chang, A.; Malambo, L.; Popescu, S.; et al. Measurement and Calibration of Plant-Height from Fixed-Wing UAV Images. Sensors 2018, 18, 4092. [Google Scholar] [CrossRef] [PubMed]
  46. Volpato, L.; Pinto, F.; González-Pérez, L.; Thompson, I.; Borém, A.; Reynolds, M.; Gerard, B.; Molero, G.; Rodrigues, F. High Throughput Field Phenotyping for Plant Height Using UAV-Based RGB Imagery in Wheat Breeding Lines: Feasibility and Validation. Front. Plant Sci. 2021, 12, 591587. [Google Scholar] [CrossRef]
  47. Guojie, R.; Li, X.; Yuan, F.; Cammarano, D.; Ata-Ul-Karim, S.; Liu, X.-J.; Tian, Y.; Zhu, Y.; Cao, W.; Cao, Q. Improving wheat yield prediction integrating proximal sensing and weather data with machine learning. Comput. Electron. Agric. 2022, 195, 106852. [Google Scholar] [CrossRef]
  48. Duan, B.; Liu, Y.; Gong, Y.; Peng, Y.; Wu, X.; Zhu, R.; Fang, S. Remote estimation of rice LAI based on Fourier spectrum texture from UAV image. Plant Methods 2019, 15, 124. [Google Scholar] [CrossRef] [PubMed]
  49. Tucker, C. Red and Photographic Infrared Linear Combinations for Monitoring Vegetation. Remote Sens. Environ. 1979, 8, 127–150. [Google Scholar] [CrossRef]
  50. Huete, A.; Didan, K.; Miura, T.; Rodriguez, E.; Gao, X.; Ferreira, L.G. Overview of the Radiometric and Biophysical Performance of the MODIS Vegetation Indices. Remote Sens. Environ. 2002, 83, 195–213. [Google Scholar] [CrossRef]
  51. Jiang, Z.; Huete, A.; Didan, K.; Miura, T. Development of a two-band enhanced vegetation index without a blue band. Remote Sens. Environ. 2008, 112, 3833–3845. [Google Scholar] [CrossRef]
  52. Rondeaux, G.; Steven, M.; Frederic, B. Optimization of Soil-Adjusted Vegetation Indices. Remote Sens. Environ. 1996, 55, 95–107. [Google Scholar] [CrossRef]
  53. Roujean, J.-L.; Breon, F.-M. Estimating PAR absorbed by vegetation from bidirectional reflectance measurements. Remote Sens. Environ. 1995, 51, 375–384. [Google Scholar] [CrossRef]
  54. Sripada, R.; Heiniger, R.; White, J.; Meijer, A. Aerial Color Infrared Photography for Determining Early In-Season Nitrogen Requirements in Corn. Agron. J. 2006, 98, 968–977. [Google Scholar] [CrossRef]
  55. Daughtry, C.; Walthall, C.; Kim, M.; Colstoun, E.B.; McMurtrey, J.E. Estimating Corn Leaf Chlorophyll Concentration from Leaf and Canopy Reflectance. Remote Sens. Environ. 2000, 74, 229–239. [Google Scholar] [CrossRef]
  56. Justice, C.; Vermote, E.; Townshend, J.; Defries, R.; Roy, D.; Hall, D.; Salomonson, V.; Privette, J.; Riggs, G.; Strahler, A. The Moderate Resolution Imaging Spectroradiometer (MODIS): Land Remote Sensing for Global Change Research. IEEE Trans. Geosci. Remote Sens. 1998, 36, 1228–1249. [Google Scholar] [CrossRef]
  57. Rouse, J.; Haas, R.; Schell, J.; Deering, D. Monitoring Vegetation Systems in the Great Plains with ERTS. NASA Spec. Publ. 1974, 351, 309. [Google Scholar]
  58. Zohaib, K.; Joshua, C.; Jinhai, C.; Vahid-Rahimi, E.; Stephan, H.; Stanley, M. Quantitative Estimation of Wheat Phenotyping Traits Using Ground and Aerial Imagery. Remote Sens. 2018, 10, 950. [Google Scholar]
  59. Chang, A.; Eo, Y.D.; Kim, S.; Kim, Y.; Kim, Y. Canopy-cover thematic-map generation for Military Map products using remote sensing data in inaccessible areas. Landsc. Ecol. Eng. 2010, 7, 263–274. [Google Scholar] [CrossRef]
  60. Zarco-Tejada, P.; Díaz Varela, R.; Angileri, V.; Loudjani, P. Tree height quantification using very high resolution imagery acquired from an unmanned aerial vehicle (UAV) and automatic 3D photo-reconstruction methods. Eur. J. Agron. 2014, 55, 89–99. [Google Scholar] [CrossRef]
  61. Wei, L.G.; Wang, Q.; Niu, K.; Bai, S.H.; Wei, L.; Qiu, C.H.; Han, N.N. Design and Test of Seed-Fertilizer Replenishment Device for Wheat Seeder. Agriculture 2024, 14, 374. [Google Scholar] [CrossRef]
  62. Su, H.; Tianyi, Z.; Lin, M.; Lu, W.; Yan, X.-H. Predicting subsurface thermohaline structure from remote sensing data based on long short-term memory neural networks. Remote Sens. Environ. 2021, 260, 112465. [Google Scholar] [CrossRef]
  63. Pullanagari, R.R.; Dehghan-Shoar, M.; Yule, I.J.; Bhatia, N. Field spectroscopy of canopy nitrogen concentration in temperate grasslands using a convolutional neural network. Remote Sens. Environ. Interdiscip. J. 2021, 257, 112353. [Google Scholar] [CrossRef]
  64. Wang, S.; Guan, K.; Zhang, C.; Lee, D.; Margenot, A.J.; Ge, Y.; Peng, J.; Zhou, W.; Zhou, Q.; Huang, Y. Using soil library hyperspectral reflectance and machine learning to predict soil organic carbon: Assessing potential of airborne and spaceborne optical soil sensing. Remote Sens. Environ. 2022, 271, 112914. [Google Scholar] [CrossRef]
  65. Wang, L.; Tian, Y.; Yao, X.; Zhu, Y.; Cao, W. Predicting grain yield and protein content in wheat by fusing multi-sensor and multi-temporal remote-sensing images. Field Crops Res. 2014, 164, 178–188. [Google Scholar] [CrossRef]
  66. Maduraimuthu, D.; Boyle, D.; Welti, R.; Jagadish, K.; Prasad, P.V.V. Decreased photosynthetic rate under high temperature in wheat is due to lipid desaturation, oxidation, acylation, and damage of organelles. BMC Plant Biol. 2018, 18, 55. [Google Scholar] [CrossRef]
  67. Yu, D.; Zha, Y.; Shi, L.; Jin, X.; Hu, S.; Yang, Q.; Huang, K.; Zeng, W. Improvement of sugarcane yield estimation by assimilating UAV-derived plant height observations. Eur. J. Agron. 2020, 121, 126159. [Google Scholar] [CrossRef]
  68. Han, S.; Zhang, Y.; Cao, J.; Yun, L.; Li, Y.-S. Prediction of Winter Wheat Yield Based on Multi-Source Data and Machine Learning in China. Remote Sens. 2020, 12, 236. [Google Scholar] [CrossRef]
  69. Sakamoto, T. Incorporating environmental variables into a MODIS-based crop yield estimation method for United States corn and soybeans through the use of a random forest regression algorithm. ISPRS J. Photogramm. Remote Sens. 2020, 160, 208–228. [Google Scholar] [CrossRef]
  70. Kamir, E.; Waldner, F.; Hochman, Z. Estimating wheat yields in Australia using climate records, satellite image time series and machine learning methods. ISPRS J. Photogramm. Remote Sens. 2020, 160, 124–135. [Google Scholar] [CrossRef]
  71. Nevavuori, P.; Narra, N.; Lipping, T. Crop yield prediction with deep convolutional neural networks. Comput. Electron. Agric. 2019, 163, 104859. [Google Scholar] [CrossRef]
  72. Qiao, M.; He, X.; Cheng, X.; Li, P.; Luo, H.; Zhang, L.; Tian, Z. Crop yield prediction from multi-spectral, multi-temporal remotely sensed imagery using recurrent 3D convolutional neural networks. Int. J. Appl. Earth Obs. Geoinf. 2021, 102, 102436. [Google Scholar] [CrossRef]
  73. Ahmadi, A.; Baker, D.A. The effect of water stress on the activities of key regulatory enzymes of the sucrose to starch pathway in wheat. Plant Growth Regul. 2001, 35, 81–91. [Google Scholar] [CrossRef]
  74. Smertenko, A.; Draber, P.; ViklickÝ, V.; Opatrný, Z. Heat stress affects the organisation of microtubules and cell division in Nicotiana tabacum. Plant Cell Environ. 2008, 20, 1534–1542. [Google Scholar] [CrossRef]
  75. Farooq, M.; Bramley, H.; Palta, J.; Siddique, K. Heat Stress in Wheat during Reproductive and Grain-Filling Phases. Crit. Rev. Plant Sci. 2011, 30, 491–507. [Google Scholar] [CrossRef]
  76. Zhao, K.; Tao, Y.; Liu, M.; Yang, D.; Zhu, M.; Ding, J.; Zhu, X.; Guo, W.; Zhou, G.; Li, C. Does temporary heat stress or low temperature stress similarly affect yield, starch, and protein of winter wheat grain during grain filling? J. Cereal Sci. 2022, 103, 103408. [Google Scholar] [CrossRef]
  77. Lesk, C.; Rowhani, P.; Ramankutty, N. Influence of extreme weather disasters on global crop production. Nature 2016, 529, 84–87. [Google Scholar] [CrossRef]
  78. Natu, P.; Kv, S.; Ghildiyal, M. Heat Shock Protein in Developing Grains in Relation to Thermotolerance for Grain Growth in Wheat. J. Agron. Crop Sci. 2009, 196, 76–80. [Google Scholar] [CrossRef]
  79. Min, L.; Hui, S.; Yangyang, L.; Jinpeng, L.; Jincai, L.; Yulei, Z.; Youhong, S. Analysis of Heat Tolerance of Wheat with Different Genotypes and Screening of ldentification lndexes in Huang-Huai-Hai Region. Sci. Agric. Sin. 2021, 54, 3381–3393. (In Chinese) [Google Scholar]
  80. Zhou, R.; Kjaer, K.; Rosenqvist, E.; Yu, X.; Wu, Z.; Ottosen, C.-O. Physiological Response to Heat Stress During Seedling and Anthesis Stage in Tomato Genotypes Differing in Heat Tolerance. J. Agron. Crop Sci. 2016, 203, 68–80. [Google Scholar] [CrossRef]
  81. Kefauver, S.; Vicente, R.; Vergara Diaz, O.; Fernandez-Gallego, J.; Kerfal, S.; López, A.; Melichar, J.; Serret, M.; Araus, J. Comparative UAV and Field Phenotyping to Assess Yield and Nitrogen Use Efficiency in Hybrid and Conventional Barley. Front. Plant Sci. 2017, 8, 1733. [Google Scholar] [CrossRef] [PubMed]
  82. Gutierrez, M.; Reynolds, M.; Raun, W.; Stone, M.; Klatt, A. Spectral Water Indices for Assessing Yield in Elite Bread Wheat Genotypes under Well-Irrigated, Water-Stressed, and High-Temperature Conditions. Crop Sci. 2010, 50, 197–214. [Google Scholar] [CrossRef]
  83. Rajcan, I.; Swanton, C. Understanding maize-weed competition: Resource competition, light quality and the whole plant. Field Crops Res. 2001, 71, 139–150. [Google Scholar] [CrossRef]
  84. Vergara Diaz, O.; Zaman-Allah, M.; Masuka, B.; Hornero, A.; Zarco-Tejada, P.; Prasanna, B.; Cairns, J.; Araus, J. A Novel Remote Sensing Approach for Prediction of Maize Yield Under Different Conditions of Nitrogen Fertilization. Front. Plant Sci. 2016, 7, 666. [Google Scholar] [CrossRef] [PubMed]
  85. Rischbeck, P.; Elsayed, S.; Mistele, B.; Barmeier, G.; Heil, K.; Schmidhalter, U. Data fusion of spectral, thermal and canopy height parameters for improved yield prediction of drought stressed spring barley. Eur. J. Agron. 2016, 78, 44–59. [Google Scholar] [CrossRef]
  86. Michael, S.; Giebel, A.; Gleiniger, F.; Pflanz, M.; Lentschke, J.; Dammer, K.-H. Monitoring Agronomic Parameters of Winter Wheat Crops with Low-Cost UAV Imagery. Remote Sens. 2016, 8, 706. [Google Scholar] [CrossRef]
  87. Plaut, Z.; Butow, B.J.; Blumenthal, C.; Wrigley, C. Transport of dry matter into developing wheat kernels and its contribution to grain yield under post-anthesis water deficit and elevated temperature. Field Crops Res. 2004, 86, 185–198. [Google Scholar] [CrossRef]
  88. Maduraimuthu, D.; Narayanan, S.; Erdayani, E.; Prasad, P.V.V. Effects of high temperature stress during anthesis and grain filling periods on photosynthesis, lipids and grain yield in wheat. BMC Plant Biol. 2020, 20, 268. [Google Scholar] [CrossRef]
Figure 1. Experimental study area.
Agronomy 14 01694 g001
Figure 2. Test zone temperature.
Agronomy 14 01694 g002
Figure 3. Image processing workflow. (A) Spectrum acquisition equipment. (B) Multi-spectral band generation. (C) Vegetation Index. (D) Digital surface model. (E) Regression plot of plant height. (F) Deep learning network model. (G) Yield regression.
Agronomy 14 01694 g003
Figure 4. Spectral index variable plot.
Agronomy 14 01694 g004
Figure 5. Regression plot of plant height.
Agronomy 14 01694 g005
Figure 6. Validation scatters plot of actual and predicted grain yield. (A) Use the vegetation index as an input variable. (B) Using vegetation index combined with canopy information as input variables.
Agronomy 14 01694 g006
Figure 7. Phenotypic changes of different heat-tolerant genotypes at different filling stages.
Agronomy 14 01694 g007
Figure 8. Use the vegetation index as an input variable, actually measured grain yield against anticipated grain yield depicted in a scatter plot. (A) The yield of different heat-tolerant wheat was predicted respectively. (B) Figure 6A is divided into different heat-tolerant wheat types.
Agronomy 14 01694 g008
Figure 9. Spectral expression of three heat-tolerant genotypes.
Agronomy 14 01694 g009
Figure 10. Using vegetation index combined with canopy information as input variables, the measured grain yield against anticipated grain yield is depicted in a scatter plot. (A) The yield of different heat-tolerant wheats were predicted, respectively. (B) Figure 6B is divided into different heat-tolerant wheat types.
Agronomy 14 01694 g010
Figure 11. (A) Prediction errors using vegetation indices as input variables. (B) Prediction errors using vegetation indices with canopy information as input variables. (C) Predicted spatial distribution of production. (D) Spatial distribution of real production.
Agronomy 14 01694 g011
Table 1. Wheat variety.
Wheat Variety
V1Zhongmai 895V11Luohan 19
V2Xinkemai 169V12Bainong 207
V3Zhongmai 175V13Luomai 26
V4Zhengmai 136V14Xinmai 36
V5Liangxing 99V15Fengdecunmai 5
V6Huaimai 33V16Fengdecunmai 21
V7Annong 0711V17Fengdecunmai 1
V8Huacheng 3366V18Zhengmai 369
V9Zhoumai 27V19Zhoumai 36
V10Luohan 22V20Zhengmai 366
Table 2. Selected optical indices in this study.
FeaturesFormulationReference
Difference spectral indexDSI = NIR − R[49]
Enhanced vegetation indexEVI = 2.5 × (NIR − R)/(1 + NIR − 6 × R − 7.5 × B)[50]
Two-band enhanced vegetation indexEVI2 = 2.5 × (NIR − R)/(NIR + 2.4 × R + 1)[51]
Green difference vegetation indexGDVI = NIR − G[49]
Green optimal soil adjusted vegetation indexGOSAVI = (1 + 0.16)(NIR − G)/(NIR + G + 0.16)[52]
Green re-normalized different vegetation indexGRDVI = (NIR − G)/SQRT(NIR + G)[53]
Green soil adjusted vegetation indexGSAVI = 1.5(NIR − G)/(NIR + G + 0.5)[54]
Modified chlorophyll absorption in reflectance index 1MCARI1 = [(NIR − RE) − 0.2 × (NIR − G)](NIR/RE)[55]
Modified enhanced vegetation indexMEVI = 2.5 × (NIR − RE)/(NIR + 6 × RE − 7.5 × G + 1)[56]
Normalized difference vegetation indexNDVI = (NIR − R)/(NIR + R)[57]
Optimized soil-adjusted vegetation indexOSAVI = 1.16 (NIR − R)/(NIR + R + 0.16)[52]
Red edge difference vegetation indexREDVI = NIR − RE[49]
Red edge soil adjusted vegetation indexRESAVI = 1.5 × [(NIR − RE)/(NIR + RE + 0.5)][54]
Table 3. Yield of wheat varieties under different treatments.
No.CultivarControl Yield (kg/ha)High Temperature Yield (kg/ha)
V1Zhongmai 89581397734
V2Xinkemai 16990498428
V3Zhongmai 17595818730
V4Zhengmai 13687748659
V5Liangxing 9986697808
V6Huaimai 3389768550
V7Annong 071185278016
V8Huacheng 336672436396
V9Zhoumai 2779597016
V10Luohan 2288698120
V11Luohan 1984248131
V12Bainong 20789858440
V13Luomai 2692708565
V14Xinmai 3689898134
V15Fengdecunmai 584187698
V16Fengdecunmai 2176397361
V17Fengdecunmai 175177202
V18Zhengmai 36975147185
V19Zhoumai 3679207307
V20Zhengmai 36674457123
Table 4. Machine learning model regression effect.
Machine Learning ModelsR2RMSERMSE%
PLSR0.2109636.45637.8241
RF0.2884604.39077.4299
SVR0.2685612.79717.5333
BP NN0.1882645.55587.9360
LSTM0.3951557.26326.8506
Table 5. Wheat heat-tolerant genotype classification table.
No.CultivarDrought ToleranceNo.CultivarDrought Tolerance
V1Zhongmai 895HTGV11Luohan 19HTG
V2Xinkemai 169HSGV12Bainong 207MHTG
V3Zhongmai 175HTGV13Luomai 26MHTG
V4Zhengmai 136HTGV14Xinmai 36HSG
V5Liangxing 99MHTGV15Fengdecunmai 5HTG
V6Huaimai 33HTGV16Fengdecunmai 21HTG
V7Annong 0711MHTGV17Fengdecunmai 1HSG
V8Huacheng 3366HSGV18Zhengmai 369MHTG
V9Zhoumai 27HSGV19Zhoumai 36MHTG
V10Luohan 22HTGV20Zhengmai 366MHTG
Disclaimer/Publisher’s Note: The statements, opinions and data contained in all publications are solely those of the individual author(s) and contributor(s) and not of MDPI and/or the editor(s). MDPI and/or the editor(s) disclaim responsibility for any injury to people or property resulting from any ideas, methods, instructions or products referred to in the content.

