
Evaluation of the Long-Term Water Balance in Selected Crop Rotations with Alfalfa in a Soil-Heterogeneous Lowland Region of the Czech Republic

 , ,
, , 
Abstract
1. Introduction
2. Materials and Methods
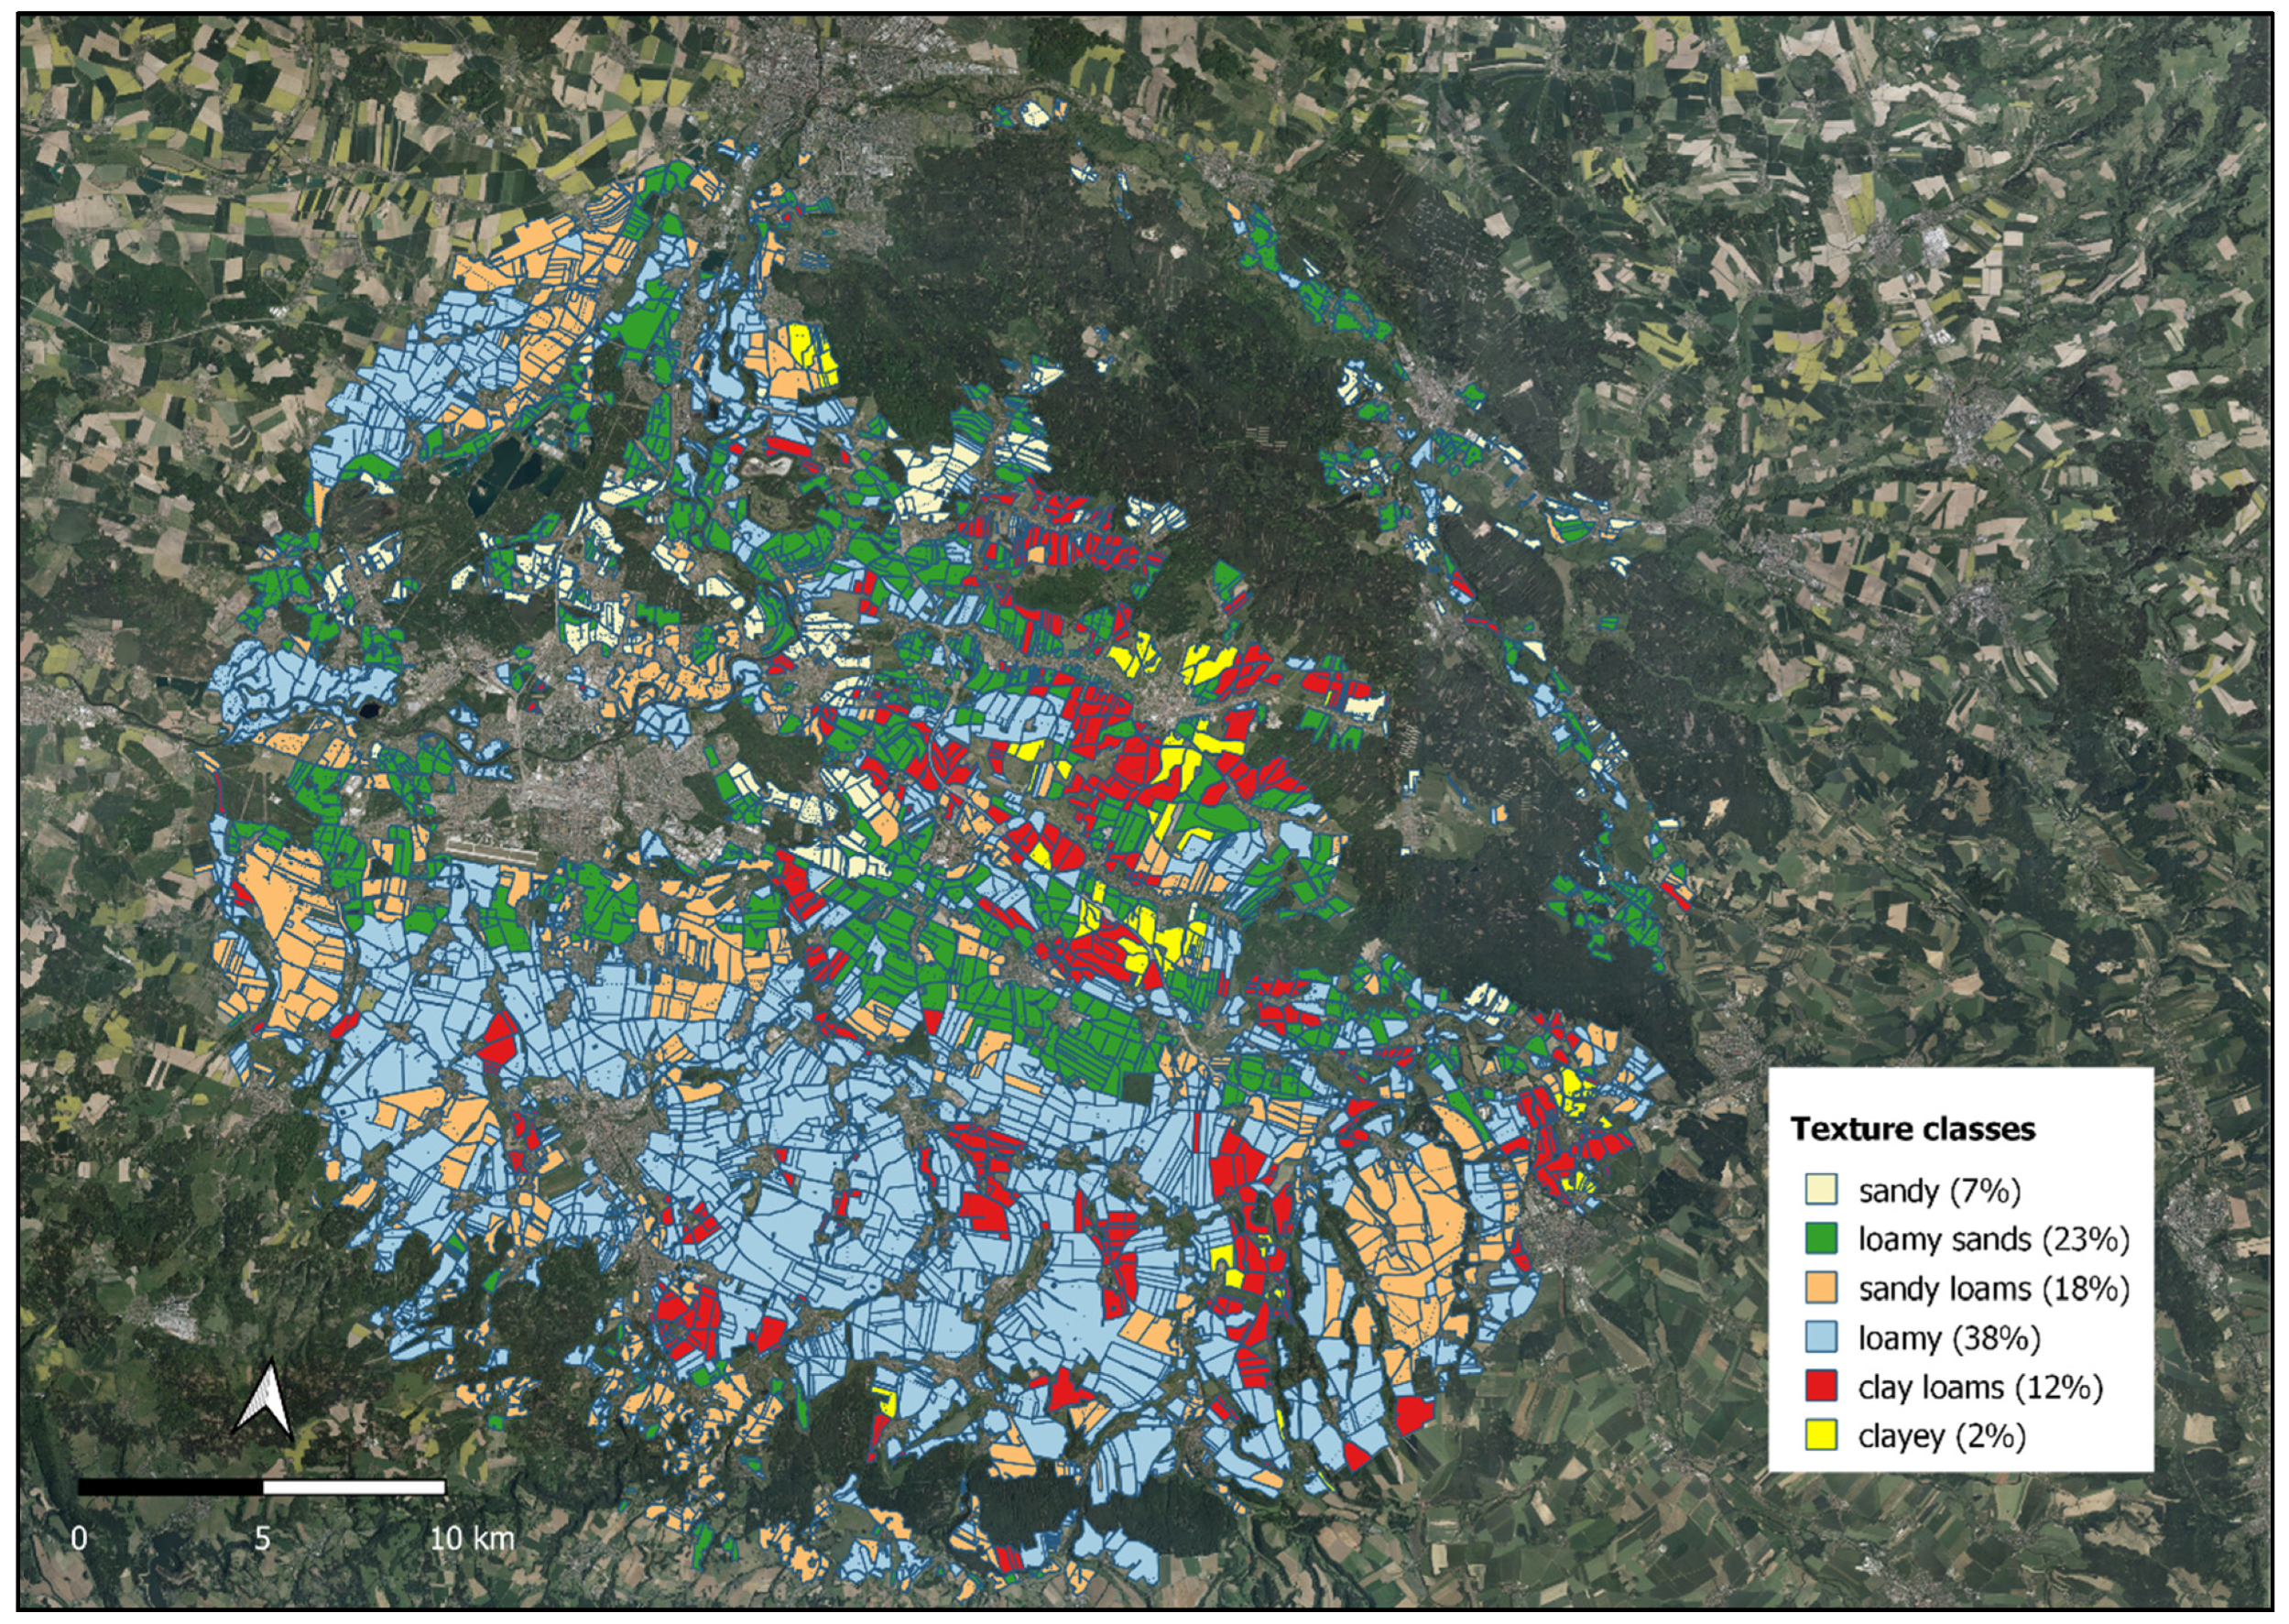
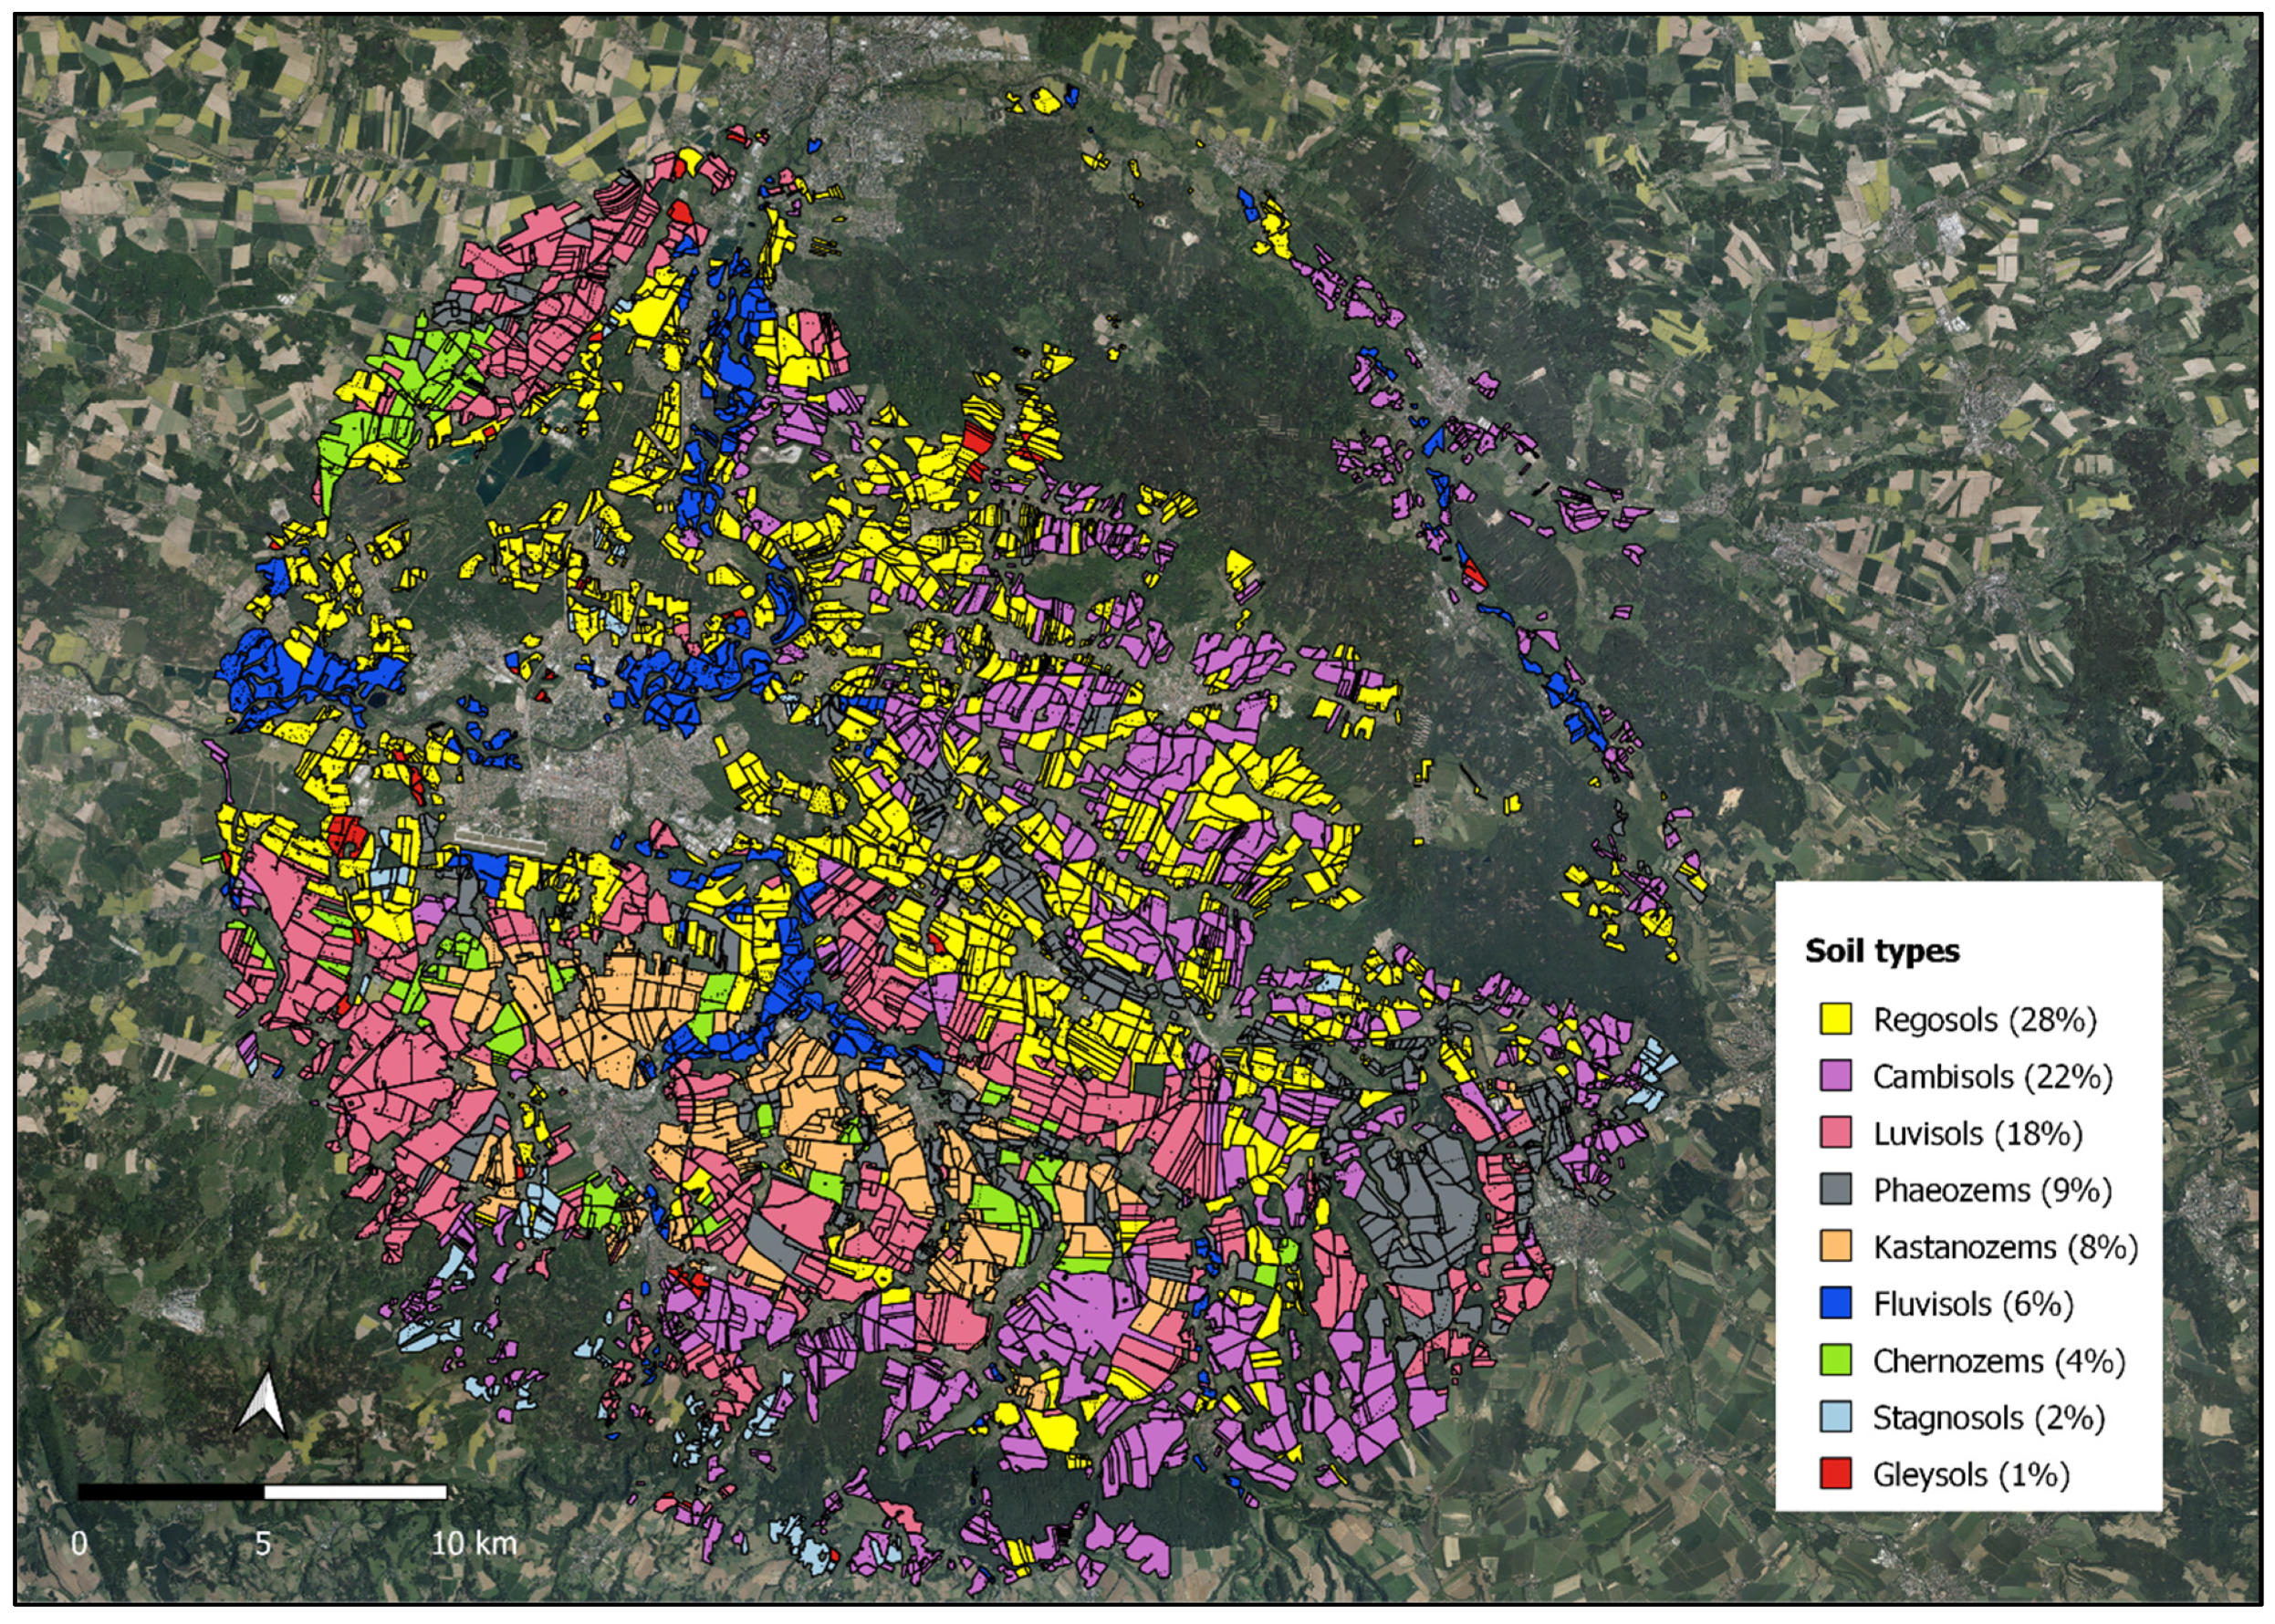
2.1. Characteristics of the Study Area
2.2. Water Balance Calculation
- WB: water balance [mm];
- r1: reduction coefficient for adjusting α for the terrain slope >10%;
- α: coefficient of precipitation availability depending on the soil type;
- P: precipitation [mm];
- r2: reduction coefficient for adjusting ASWS depending on the soil type andterrain slope;
- ASWS: available soil water supply at the beginning of the growing season [mm];
- AARG: available amount of rising groundwater [mm];
- CWR: crop water requirement [mm].
- AWC: available water capacity [vol. %];
- SAWC: saturation of AWC with water [%];
- RD: the maximum effective rooting depth of the crop [dm].
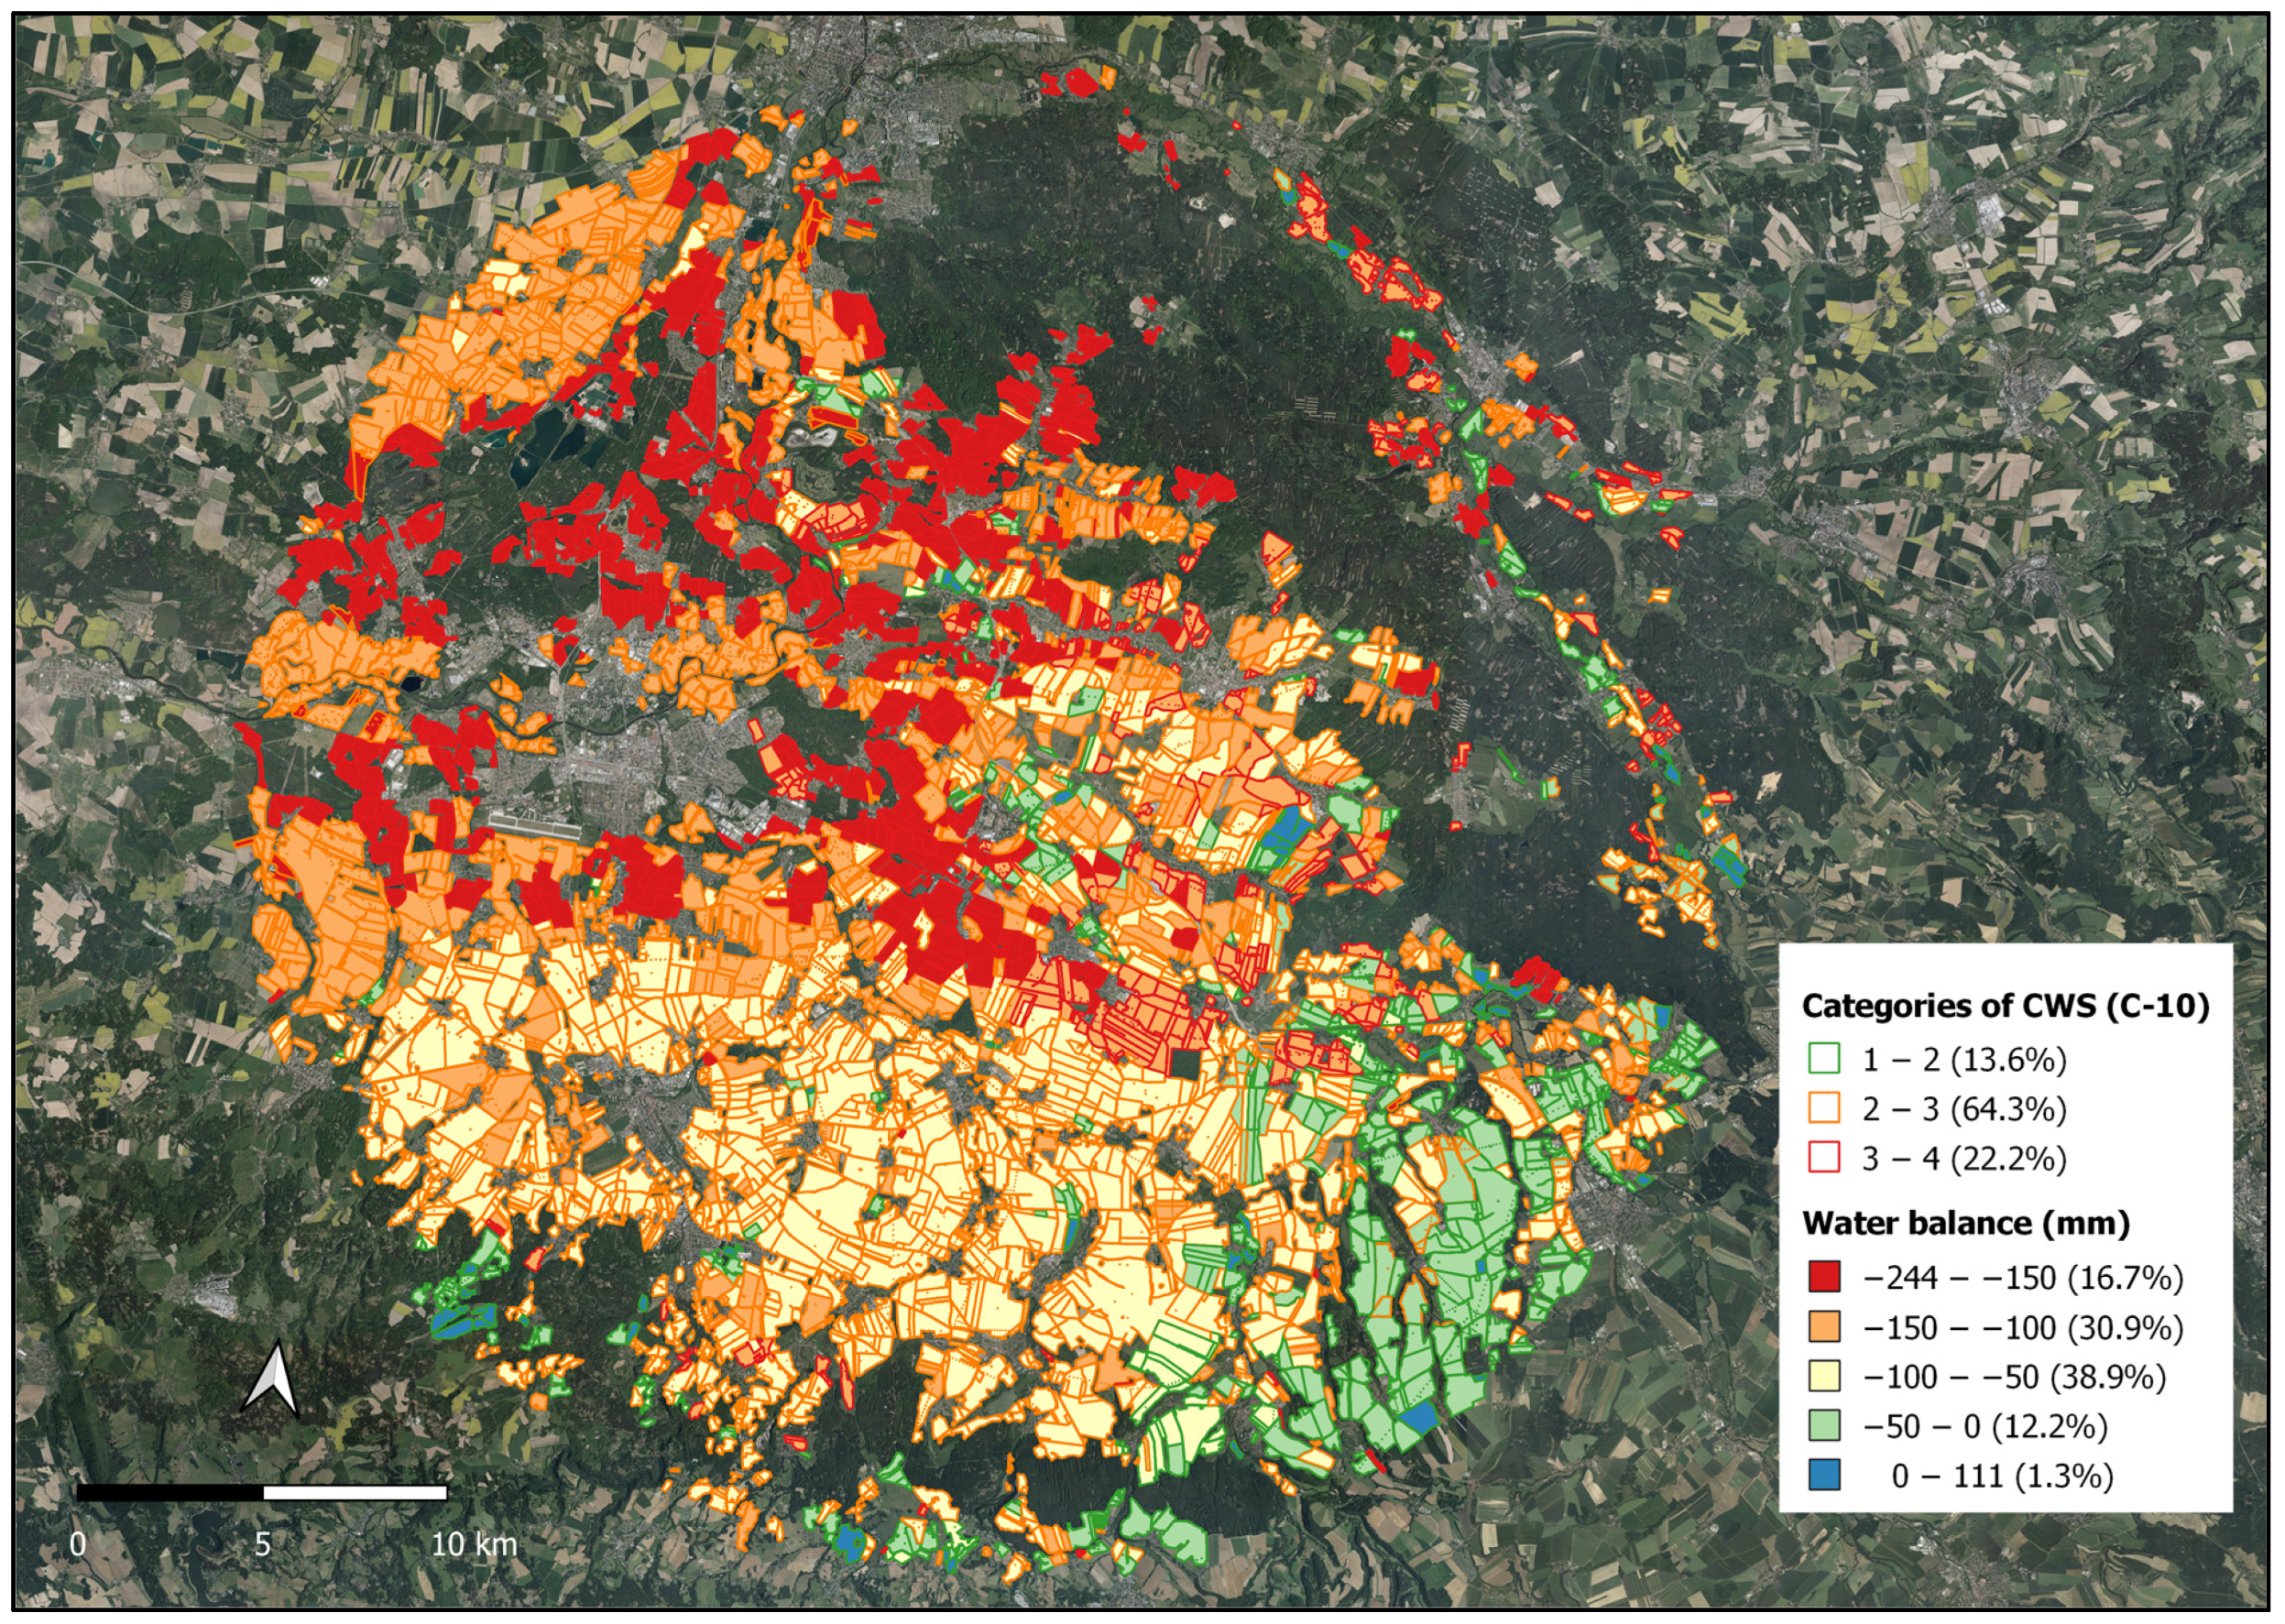
2.3. Categories of CWS
- PDA: point of decreased availability [vol. %];
- PWP: permanent wilting point [vol. %];
- SAWCmin: minimum saturation of AWC after depletion of readily available soil water [%].

| Crops | WB (mm) | r1.α.P (mm) | r2.ASWS (mm) | AARG (mm) | CWR (mm) | SAWCmin (%) | Categories of CWS | ||||
|---|---|---|---|---|---|---|---|---|---|---|---|
| M. ± s.d. | 1 (%) | 2 (%) | 3 (%) | 4 (%) | |||||||
| SB/A | −52 ± 74.0 | 311 ± 30.2 | 52.6 ± 12.6 | 58.6 ± 36.7 | 474 ± 15.4 | 60 | 2.3 ± 1.0 | 26.9 | 42.1 | 19.6 | 11.3 |
| A (1st) | −121 ± 85.3 | 322 ± 29.9 | 84.1 ± 20.1 | 61.5 ± 38.5 | 589 ± 21.1 | 55 | 2.8 ± 0.9 | 5.8 | 39.7 | 32.5 | 21.9 |
| A (2nd) | −40 ± 64.7 | 221 ± 18.7 | 84.1 ± 20.1 | 52.6 ± 30.9 | 399 ± 14.5 | 45 | 2.0 ± 0.9 | 32.1 | 48.5 | 13.8 | 5.6 |
| WR | −88 ± 56.8 | 287 ± 26.9 | 50.1 ± 12.3 | 21.7 ± 17.5 | 446 ± 15.8 | 50 | 2.5 ± 0.8 | 5.4 | 54.3 | 28.0 | 12.2 |
| WW | −103 ± 53.8 | 256 ± 22.9 | 63.6 ± 15.1 | 22.1 ± 17.7 | 445 ± 35.0 | 45 | 2.6 ± 0.8 | 1.3 | 59.5 | 25.1 | 14.1 |
| Sorg | −116 ± 42.7 | 220 ± 23.6 | 26.7 ± 8.6 | 12.5 ± 13.3 | 374 ± 12.2 | 40 | 2.7 ± 0.8 | 0.5 | 54.6 | 30.7 | 14.2 |
| Sug | −141 ± 53.6 | 271 ± 28.3 | 26.7 ± 8.6 | 25.2 ± 21.9 | 464 ± 16.8 | 45 | 3.0 ± 0.8 | 0.9 | 30.4 | 43.7 | 25.0 |
| SM | −129 ± 42.1 | 208 ± 18.9 | 33.3 ± 10.7 | 36.0 ± 10.7 | 407 ± 13.6 | 60 | 3.1 ± 0.6 | 0.0 | 13.0 | 68.3 | 18.7 |
| SB | −139 ± 35.3 | 165 ± 15.4 | 42.1 ± 10.0 | 10.7 ± 16.1 | 357 ± 9.2 | 55 | 3.1 ± 0.5 | 0.1 | 7.8 | 73.0 | 19.1 |
| Sun | −158 ± 50.1 | 256 ± 26.2 | 47.7 ± 14.0 | 12.3 ± 13.3 | 475 ± 16.2 | 45 | 3.2 ± 0.7 | 0.0 | 22.1 | 46.5 | 31.4 |
| GM | −186 ± 49.4 | 256 ± 27.4 | 33.3 ± 10.7 | 12.4 ± 13.4 | 487 ± 14.2 | 55 | 3.4 ± 0.6 | 0.0 | 2.9 | 55.3 | 41.8 |
| Pea | −177 ± 38.7 | 183 ± 16.3 | 42.1 ± 10.0 | 11.2 ± 16.7 | 414 ± 12.9 | 55 | 3.4 ± 0.5 | 0.0 | 2.0 | 62.3 | 35.7 |
2.4. Statistical Analysis
3. Results and Discussion
4. Conclusions
Author Contributions
Funding
Data Availability Statement
Acknowledgments
Conflicts of Interest
References
- Birgani, R.; Kianirad, A.; Shab-Bidar, S.; Djazayeri, A.; Pouraram, H.; Takian, A. Climate Change and Food Price: A Systematic Review and Meta-Analysis of Observational Studies, 1990–2021. Am. J. Clim. Chang. 2021, 11, 103–132. [Google Scholar] [CrossRef]
- Gobin, A.; Kersebaum, K.C.; Eitzinger, J.; Trnka, M.; Hlavinka, P.; Takáč, J.; Kroes, J.; Ventrella, D.; Marta, A.D.; Deelstra, J.; et al. Variability in the Water Footprint of Arable Crop Production across European Regions. Water 2017, 9, 93. [Google Scholar] [CrossRef]
- Meitner, J.; Balek, J.; Bláhová, M.; Semerádová, D.; Hlavinka, P.; Lukas, V.; Jurečka, F.; Žalud, Z.; Klem, K.; Anderson, M.C.; et al. Estimating Drought-Induced Crop Yield Losses at the Cadastral Area Level in the Czech Republic. Agronomy 2023, 13, 1669. [Google Scholar] [CrossRef]
- Paeth, H.; Schönbein, D.; Keupp, L.; Abel, D.; Bangelesa, F.; Baumann, M.; Büdel, C.; Hartmann, C.; Kneisel, C.; Kobs, K.; et al. Climate change information tailored to the agricultural sector in Central Europe, exemplified on the region of Lower Franconia. Clim. Chang. 2023, 176, 136. [Google Scholar] [CrossRef]
- Zhao, J.; Bindi, M.; Eitzinger, J.; Ferrise, R.; Gaile, Z.; Gobin, A.; Holzkämper, A.; Kersebaum, K.-C.; Kozyra, J.; Kriaučiūnienė, Z.; et al. Priority for Climate Adaptation Measures in European Crop Production Systems. Eur. J. Agron. 2022, 138, 126516. [Google Scholar] [CrossRef]
- Pinke, Z.; Decsi, B.; Demeter, G.; Kalicz, P.; Kern, Z.; Acs, T. Continental lowlands face rising crop vulnerability: Structural change in regional climate sensitivity of crop yields, Hungary (Central and Eastern Europe), 1921–2010. Reg. Environ. Chang. 2024, 24, 33. [Google Scholar] [CrossRef]
- Blanchy, G.; Bragato, G.; Di Bene, C.; Jarvis, N.; Larsbo, M.; Meurer, K.; Garré, S. Soil and crop management practices and the water regulation functions of soils: A qualitative synthesis of meta-analyses relevant to European agriculture. Soil 2023, 9, 1–20. [Google Scholar] [CrossRef]
- Thaler, S.; Pohanková, E.; Eitzinger, J.; Hlavinka, P.; Orság, M.; Lukas, V.; Brtnický, M.; Růžek, P.; Šimečková, J.; Ghisi, T.; et al. Determining Factors Affecting the Soil Water Content and Yield of Selected Crops in a Field Experiment with a Rainout Shelter and a Control Plot in the Czech Republic. Agriculture 2023, 13, 1315. [Google Scholar] [CrossRef]
- Pohanková, E.; Hlavinka, P.; Kersebaum, K.C.; Rodríguez, A.; Balek, J.; Bednařík, M.; Dubrovský, M.; Gobin, A.; Hoogenboom, G.; Moriondo, M.; et al. Expected effects of climate change on the production and water use of crop rotation management reproduced by crop model ensemble for Czech Republic sites. Eur. J. Agron. 2022, 134, 126446. [Google Scholar] [CrossRef]
- Wang, S.; Xiong, J.; Yang, B.; Yang, X.; Du, T.; Steenhuis, T.S.; Siddique, K.; Kang, S. Diversified crop rotations reduce groundwater use and enhance system resilience. Agric. Water Manag. 2023, 276, 108067. [Google Scholar] [CrossRef]
- Yang, X.L.; Steenhuis, T.S.; Davis, K.F.; van der Werf, W.; Ritsema, C.J.; Pacenka, S.; Zhang, F.S.; Siddique, K.H.; Du, T.S. Diversified crop rotations enhance groundwater and economic sustainability of food production. Food Energy Secur. 2021, 10, e311. [Google Scholar] [CrossRef]
- Brauer, D.; Baumhardt, R.L. Future Prospects for Sorghum as a Water-Saving Crop. In Sorghum: A State of the Art and Future Perspectives, 1st ed.; Ciampitti, I.A., Vara Prasad, P.V., Eds.; American Society of Agronomy, Crop Science Society of America, Soil Science Society of America: Madison, WI, USA, 2019; Volume 58, pp. 375–397. [Google Scholar]
- Koropeckyj-Cox, L.; Christianson, R.D.; Yuan, Y. Effectiveness of Conservation Crop Rotation for Water Pollutant Reduction from Agricultural Areas. Trans. ASABE 2021, 64, 691–704. [Google Scholar] [CrossRef] [PubMed]
- Julier, B.; Gastal, F.; Louarn, G.; Badenhausser, I.; Annicchiarico, P.; Crocq, G.; le Chatelier, D.; Guillemot, E.; Emile, J.C. Lucerne (Alfalfa) in European Cropping Systems. In Legumes in Cropping Systems; Murphy-Bokern, D., Stoddard, F.L., Watson, C.A., Eds.; CABI: Wallingford, UK, 2017; pp. 168–192. [Google Scholar]
- Peng, H.H.; Xiong, J.R.; Zhang, J.Y.; Zhu, L.H.; Wang, G.Y.; Pacenka, S.; Yang, X.L. Water requirements and comprehensive benefit evaluation of diversified crop rotations in the Huang-Huai Plain. Sustainability 2023, 15, 10229. [Google Scholar] [CrossRef]
- Holman, J.D.; Obour, A.K.; Assefa, Y. Forage sorghum grown in a conventional wheat–grain sorghum–fallow rotation increased cropping system productivity and profitability. Can. J. Plant Sci. 2023, 103, 61–72. [Google Scholar] [CrossRef]
- Sainju, U.M.; Lenssen, A.W.; Allen, B.L.; Jabro, J.D.; Stevens, W.B. Crop water and nitrogen productivity in response to long-term diversified crop rotations and management systems. Agric. Water. Manag. 2021, 257, 107149. [Google Scholar] [CrossRef]
- Allen, R.G.; Pereira, L.S.; Raes, D.; Smith, M. Crop Evapotranspiration—Guidelines for Computing Crop Water Requirements, 1st ed.; FAO Irrigation and Drainage Paper 56; Food and Agriculture Organization: Rome, Italy, 1998. [Google Scholar]
- Lebon, E.; Dumas, V.; Pieri, P.; Schultz, H.R. Modeling the seasonal dynamics of the soil water balance of vineyards. Funct. Plant Biol. 2003, 30, 699–710. [Google Scholar] [CrossRef] [PubMed]
- IUSS Working Group WRB. World Reference Base for Soil Resources. In International Soil Classification System for Naming Soils and Creating Legends for Soil Map, 4th ed.; International Union of Soil Sciences (IUSS): Vienna, Austria, 2022. [Google Scholar]
- Růžek, P. Recommendation of Suitable Crops and Agrotechnical Practices for Arid Areas. Crop Research Institute, Prague, Czech Republic. 2016; Unpublished Work. (In Czech) [Google Scholar]
- Potopová, V.; Trnka, M.; Vizina, A.; Semerádová, D.; Balek, J.; Chawdhery, M.R.A.; Musiolková, M.; Pavlík, P.; Možný, M.; Štěpánek, P.; et al. Projection of 21st century irrigation water requirements for sensitive agricultural crop commodities across the Czech Republic. Agric. Water Manag. 2022, 262, 107337. [Google Scholar] [CrossRef]
- Ritchie, J.T. Soil water balance and plant water stress. In Understanding Options for Agricultural Production; Springer: Dordrecht, The Netherlands, 1998; pp. 41–54. [Google Scholar]
- ČSN 75 0434; Amelioration–Water Requirement for Supplemental Irrigation of Field Crops. Czech Technical Standards. Czech Office for Standards, Metrology and Testing: Prague, Czech Republic, 2017.
- Spitz, P.; Zavadil, J.; Duffková, R.; Korsuň, S.; Nechvátal, M.; Hemerka, I. Guidelines for Managing Crops Irrigation Regime through IT Program IRRIPROG, 1st ed.; Research Institute for Soil and Water Conservation: Prague, Czech Republic, 2011; p. 41. [Google Scholar]
- Novotný, M.; Kervališvili, D.M.; Šanta, M. Irrigation of Field and Special Crops, 1st ed.; Príroda: Bratislava, Slovak Republic, 2000. (In Slovak) [Google Scholar]
- Kohút, M.; Rožnovský, J.; Chuchma, F. The long-term supply of available soil water and its variability on the territory of the Czech Republic. In Water in the Landscape: Lednice, Czech Republic, 31.5.–1.6.2010; Rožnovský, J., Litschmann, T., Eds.; Ministry of Agriculture in Prague: Prague, Czech Republic, 2010; pp. 35–46. ISBN 978-80-86690-79-7. [Google Scholar]
- Thompson, N.; Barrie, I.A.; Ayles, M. The Meteorological Office Rainfall and Evaporation Calculation System: MORECS; Hydrological Memorandum; No. 45; Met Office: Bracknell, UK, 1981; 71p. [Google Scholar]
- Monteith, J.L. Principles of Environmental Physics; Edward Arnold: London, UK, 1973. [Google Scholar]
- Duffková, R.; Holub, J.; Fučík, P.; Rožnovský, J.; Novotný, I. Long-Term Water Balance of Selected Field Crops in Different Agricultural Regions of the Czech Republic Using Fao-56 and Soil Hydrological Approaches. Sustainability 2019, 11, 5243. [Google Scholar] [CrossRef]
- R Core Team. R: A Language and Environment for Statistical Computing; R Foundation for Statistical Computing: Vienna, Austria, 2023. [Google Scholar]
- Hu, Z.Q.; Tian, X.H.; Zhang, J.D.; Bao, X.G.; Ma, Z.M. High efficiency production and water-saving crop rotation systems in Shiyang River Area. Chin. J. Eco-Agric. 2011, 19, 561–567. [Google Scholar] [CrossRef]
- Li, F.-R.; Gao, C.-Y.; Zhao, H.-L.; Li, X.-Y. Soil conservation effectiveness and energy efficiency of alternative rotations and continuous wheat cropping in the Loess Plateau of northwest China. Agricult. Ecosys. Environ. 2002, 91, 101–111. [Google Scholar] [CrossRef]
- Asseng, S.; Hsiao, T.C. Canopy CO2 assimilation, energy balance, and water use efficiency of an alfalfa crop before and after cutting. Field Crops Res. 2000, 67, 191–206. [Google Scholar] [CrossRef]
- Zhao, C.; Feng, Z.; Chen, G. Soil water balance simulation of alfalfa (Medicago sativa L.) in the semiarid Chinese Loess Plateau. Agric. Water Manag. 2004, 69, 101–114. [Google Scholar] [CrossRef]
- Sitterson, J.M.; Andales, A.A.; Mooney, D.F.; Capurro, M.C.; Brummer, J.E. Developing a Crop Water Production Function for Alfalfa under Deficit Irrigation: A Case Study in Eastern Colorado. Agriculture 2023, 13, 831. [Google Scholar] [CrossRef]
- Schlegel, A.J.; Assefa, Y.; Haag, L.A.; Thompson, C.R.; Stone, L.R. Soil Water and Water Use in Long-Term Dryland Crop Rotations. Agron. J. 2019, 111, 2590–2599. [Google Scholar] [CrossRef]
- Jurkonienė, S.; Mockevičiūtė, R.; Gavelienė, V.; Šveikauskas, V.; Zareyan, M.; Jankovska-Bortkevič, E.; Jankauskienė, J.; Žalnierus, T.; Kozeko, L. Proline Enhances Resistance and Recovery of Oilseed Rape after a Simulated Prolonged Drought. Plants 2023, 12, 2718. [Google Scholar] [CrossRef] [PubMed]
- Šiška, B.; Takáč, J. Drought analyses of agricultural regions as influenced by climatic conditions in the Slovak Republic. Q. J. Hung. Meteorol. Serv. 2009, 113, 135–143. [Google Scholar]
- Graham, C.; Kumar, S.; Beck, D.; Sieverding, H. Water Management in Sunflower. In Best Management Practices for Sunflower Production, 1st ed.; Mathew, F., Beck, R., Wagner, P., Varenhorst, A., Eds.; South Dakota State University Extension: Brookings, SD, USA, 2021; Chapter 6; pp. 1–2. [Google Scholar]
- Lenssen, A.W.; Sainju, U.M.; Jabro, J.D.; Allen, B.L.; Stevens, W.B. Dryland Pea Production and Water Use Responses to Tillage, Crop Rotation, and Weed Management Practice. Agron. J. 2018, 110, 1843–1853. [Google Scholar] [CrossRef]
- Camargo, M.B.P.; Hubbard, K.G. Drought Sensitivity Indices for Sorghum. J. Prod. Agric. 1999, 12, 312–316. [Google Scholar] [CrossRef]
- Gokkus, M.K.; Degirmenci, H. Comparison of Water-Yield Relations, Water Deficit Index, and Crop Water Stress Index in SM (Zea mays L.) and Sorghum (Sorghum bicolor L.). J. Agric. Sci. Technol. 2023, 25, 1403–1415. [Google Scholar]
- Nath, T.N. Soil texture and total organic matter content and its influences on soil water holding capacity of some selected tea growing soils in Sivasagar district of Assam, India. Int. J. Chem. Sci. 2014, 12, 1419–1429. [Google Scholar]
- Pinheiro, E.A.R.; de Jong van Lier, Q.; Šimůnek, J. The role of soil hydraulic properties in crop water use efficiency: A process-based analysis for some Brazilian scenarios. Agric. Syst. 2019, 173, 364–377. [Google Scholar] [CrossRef]
- Duffková, R.; Zajíček, A.; Nováková, E. Actual evapotranspiration from partially tile-drained fields as influenced by soil properties, terrain and crop. Soil Water Res. 2011, 6, 131–146. [Google Scholar] [CrossRef]
- Tall, A.; Pavelková, D. Results of water balance measurements in a sandy and silty-loam soil profile using lysimeters. J. Water Land Dev. 2020, 45, 179–184. [Google Scholar] [CrossRef]
- Brown, S.; Wagner-Riddle, C.; Debruyn, Z.; Jordan, S.; Berg, A.; Ambadan, J.T.; Congreves, K.A.; Machado, P.V.F. Assessing variability of soil water balance components measured at a new lysimeter facility dedicated to the study of soil ecosystem services. J. Hydrol. 2021, 603, 127037. [Google Scholar] [CrossRef]
- Schlegel, A.J.; Assefa, Y.; Haag, L.A.; Thompson, C.R.; Holman, J.D.; Stone, L.R. Yield and soil water in three dryland wheat and grain sorghum rotations. Agron. J. 2017, 109, 227–238. [Google Scholar] [CrossRef]
- Yang, X.L.; Chen, Y.Q.; Steenhuis, T.S.; Pacenka, S.; Gao, W.S.; Ma, L.; Zhang, M.; Sui, P. Mitigating groundwater depletion in North China Plain with cropping system that alternate deep and shallow rooted crops. Front. Plant Sci. 2017, 8, 980. [Google Scholar] [CrossRef] [PubMed]
- Sun, J.; Niu, W.; Mu, F.; Li, R.; Du, Y.; Ma, L.; Zhang, Q.; Li, G.; Zhu, J.; Siddique, K.H.M. Optimized tillage can enhance crop tolerance to extreme weather events: Evidence from field experiments and meta-analysis. Soil Tillage Res. 2024, 238, 106003. [Google Scholar] [CrossRef]
- Baumhardt, R.L.; Schwartz, R.C.; Jones, O.R.; Scanlon, B.R.; Reedy, R.C.; Marek, G.W. Long-Term Conventional and No-Tillage Effects on Field Hydrology and Yields of a Dryland Crop Rotation. Soil Sci. Soc. Am. J. 2017, 81, 200–209. [Google Scholar] [CrossRef]

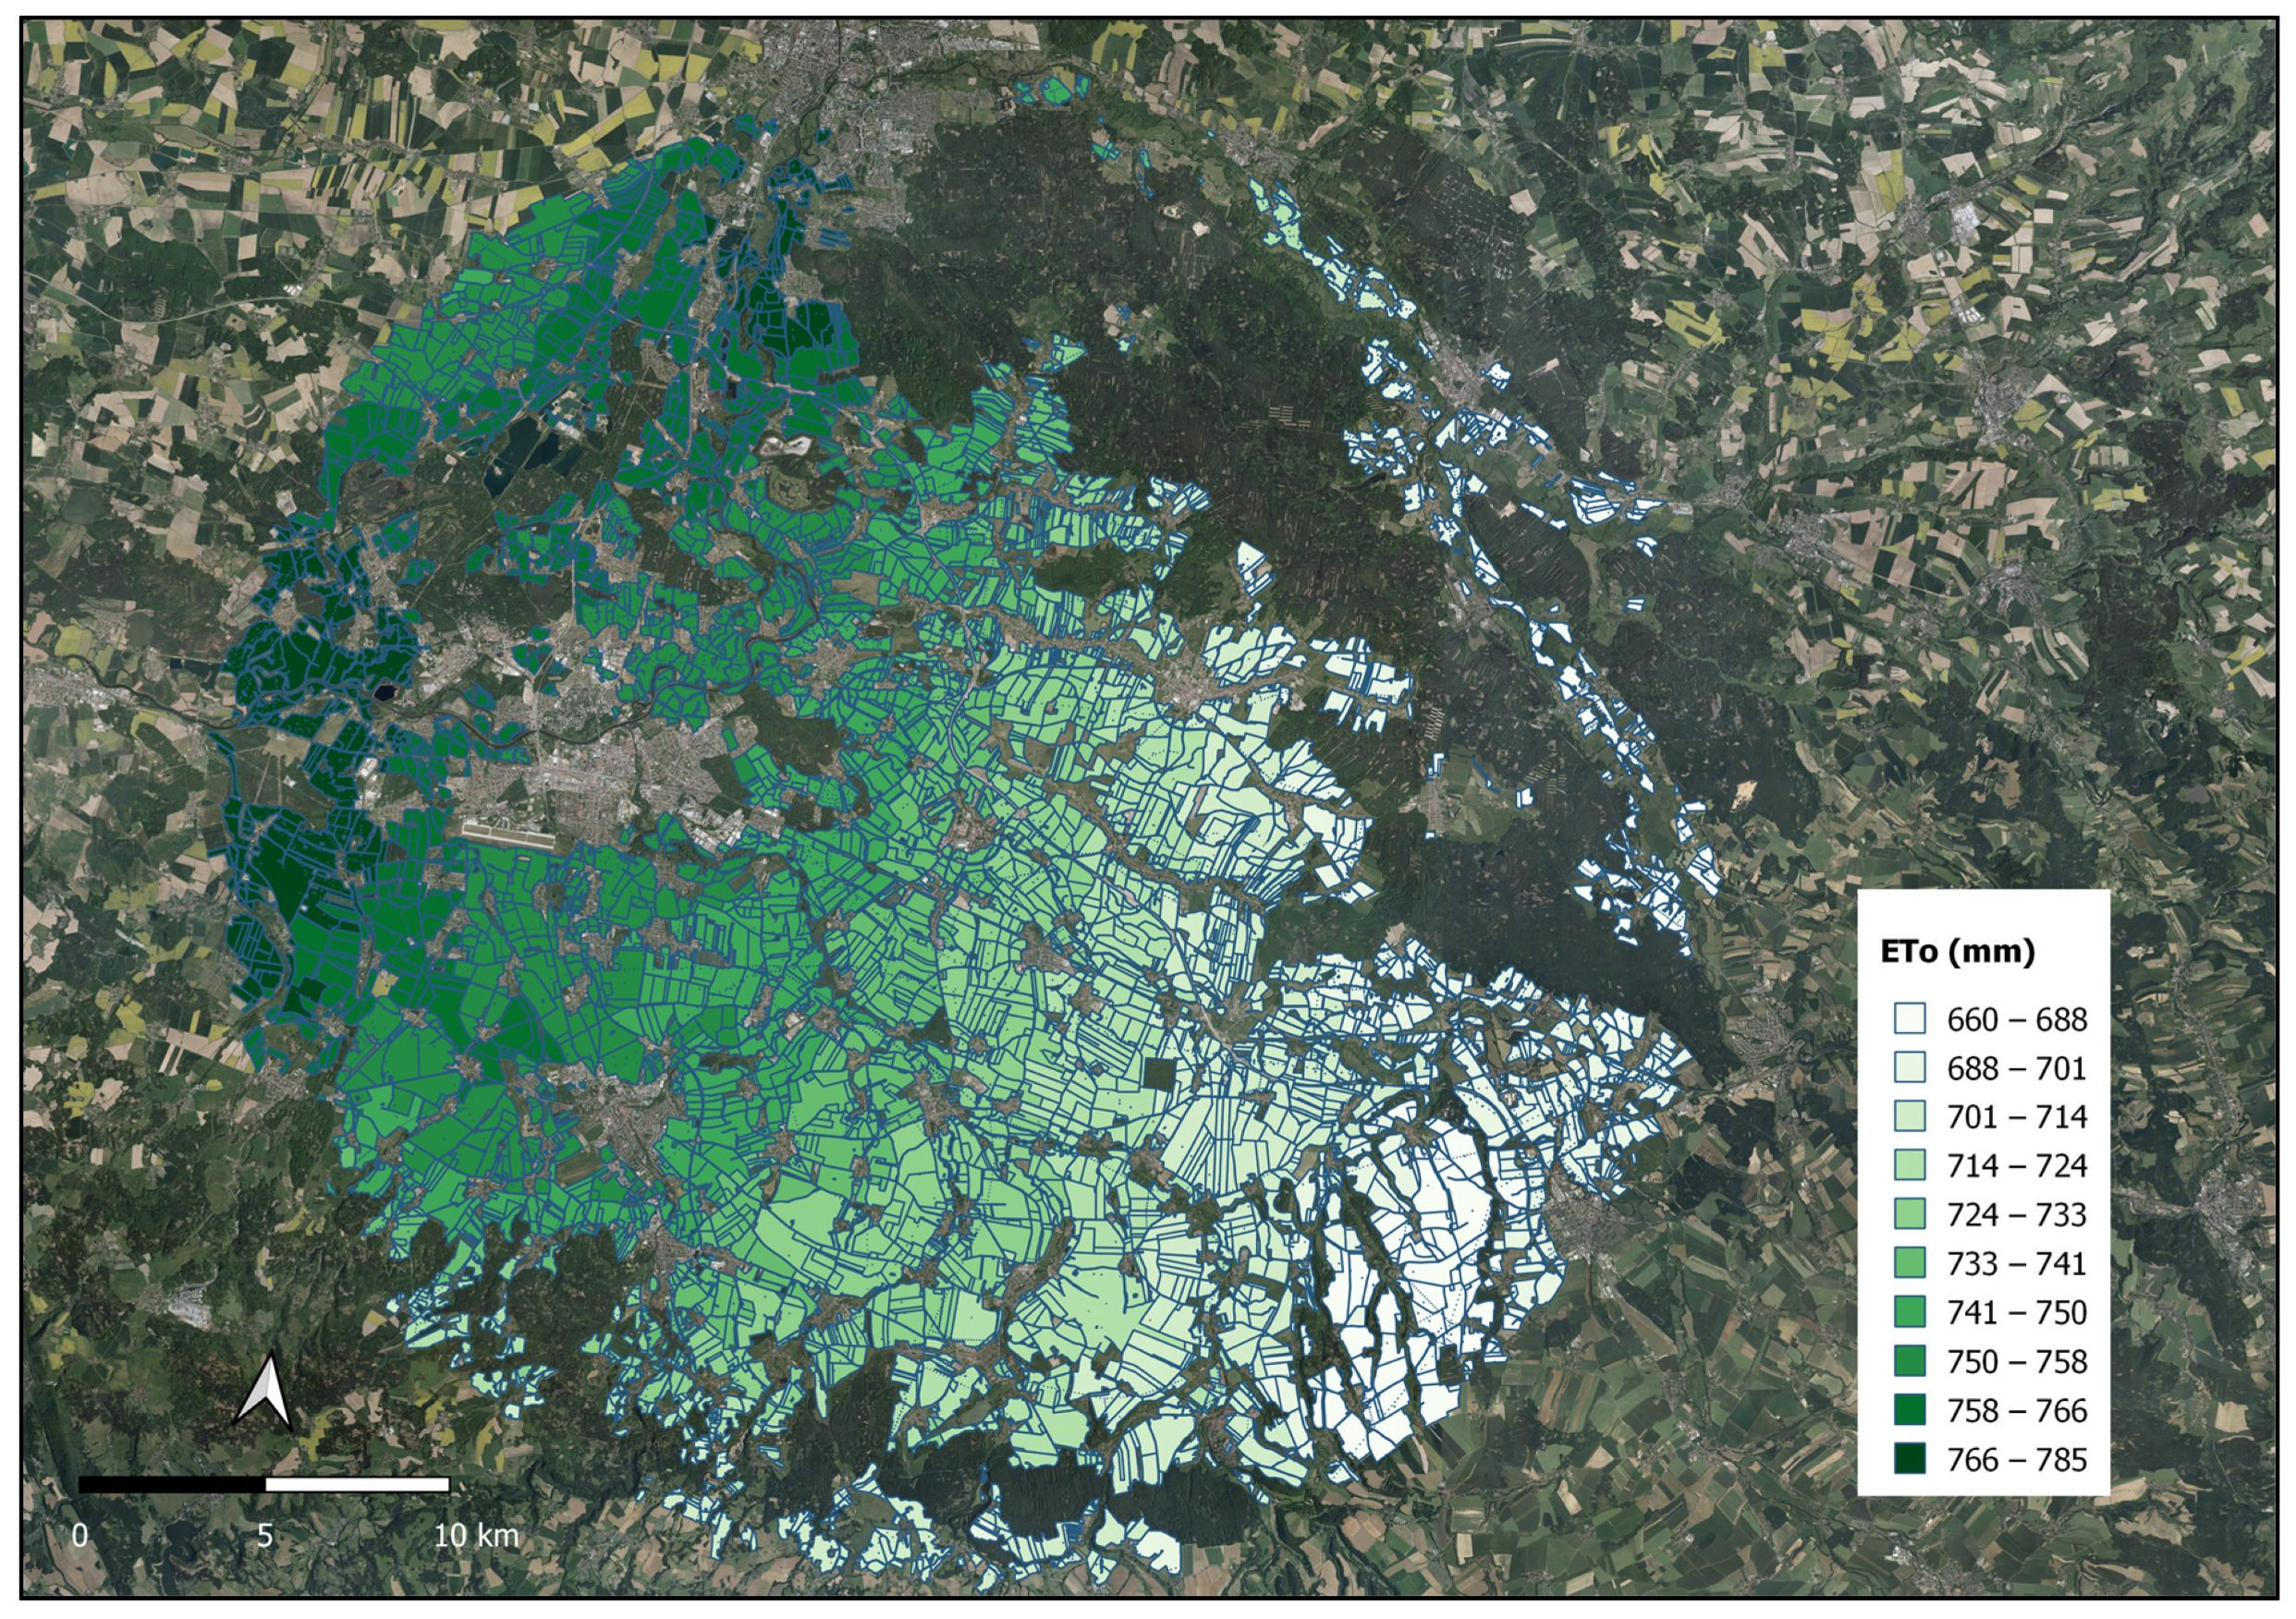


| Parameter | Altitude (m a.s.l.) | Slope (°) | Air Temperature (°C) | Precipitation (mm) | ETo (mm) |
|---|---|---|---|---|---|
| Mean | 261.7 | 1.54 | 10.7 | 580.8 | 730.7 |
| Median | 250.4 | 1.28 | 10.8 | 583.7 | 732.4 |
| s.d. | 47.8 | 1.01 | 0.28 | 37.4 | 25.0 |
| Min | 210.9 | 0.3 | 9.3 | 505.0 | 660.4 |
| Max | 464.7 | 8.1 | 11.1 | 684.8 | 785.4 |
| Texture Classes/Soil Hydrolimits | Sandy | Loamy Sands | Sandy Loams | Loamy | Clay Loams | Clayey |
|---|---|---|---|---|---|---|
| FC (cm3/cm3) | 0.162 | 0.241 | 0.304 | 0.368 | 0.397 | 0.389 |
| PWP (cm3/cm3) | 0.062 | 0.091 | 0.118 | 0.154 | 0.185 | 0.210 |
| AWC (cm3/cm3) | 0.100 | 0.150 | 0.186 | 0.214 | 0.212 | 0.179 |
| SAWCApr 1 (cm3/cm3) | 0.62 ± 0.12 | 0.61 ± 0.10 | 0.63 ± 0.10 | 0.63 ± 0.09 | 0.65 ± 0.08 | 0.67 ± 0.09 |
| SAWCApr 30 (cm3/cm3) | 0.38 ± 0.14 | 0.37 ± 0.13 | 0.40 ± 0.11 | 0.41 ± 0.09 | 0.42 ± 0.10 | 0.44 ± 0.11 |
| SAWCAug 31 (cm3/cm3) | 0.25 ± 0.08 | 0.24 ± 0.07 | 0.24 ± 0.07 | 0.24 ± 0.06 | 0.25 ± 0.07 | 0.28 ± 0.09 |
| SAWC Sept 30 (cm3/cm3) | 0.34 ± 0.07 | 0.34 ± 0.07 | 0.32 ± 0.08 | 0.33 ± 0.06 | 0.34 ± 0.06 | 0.36 ± 0.09 |
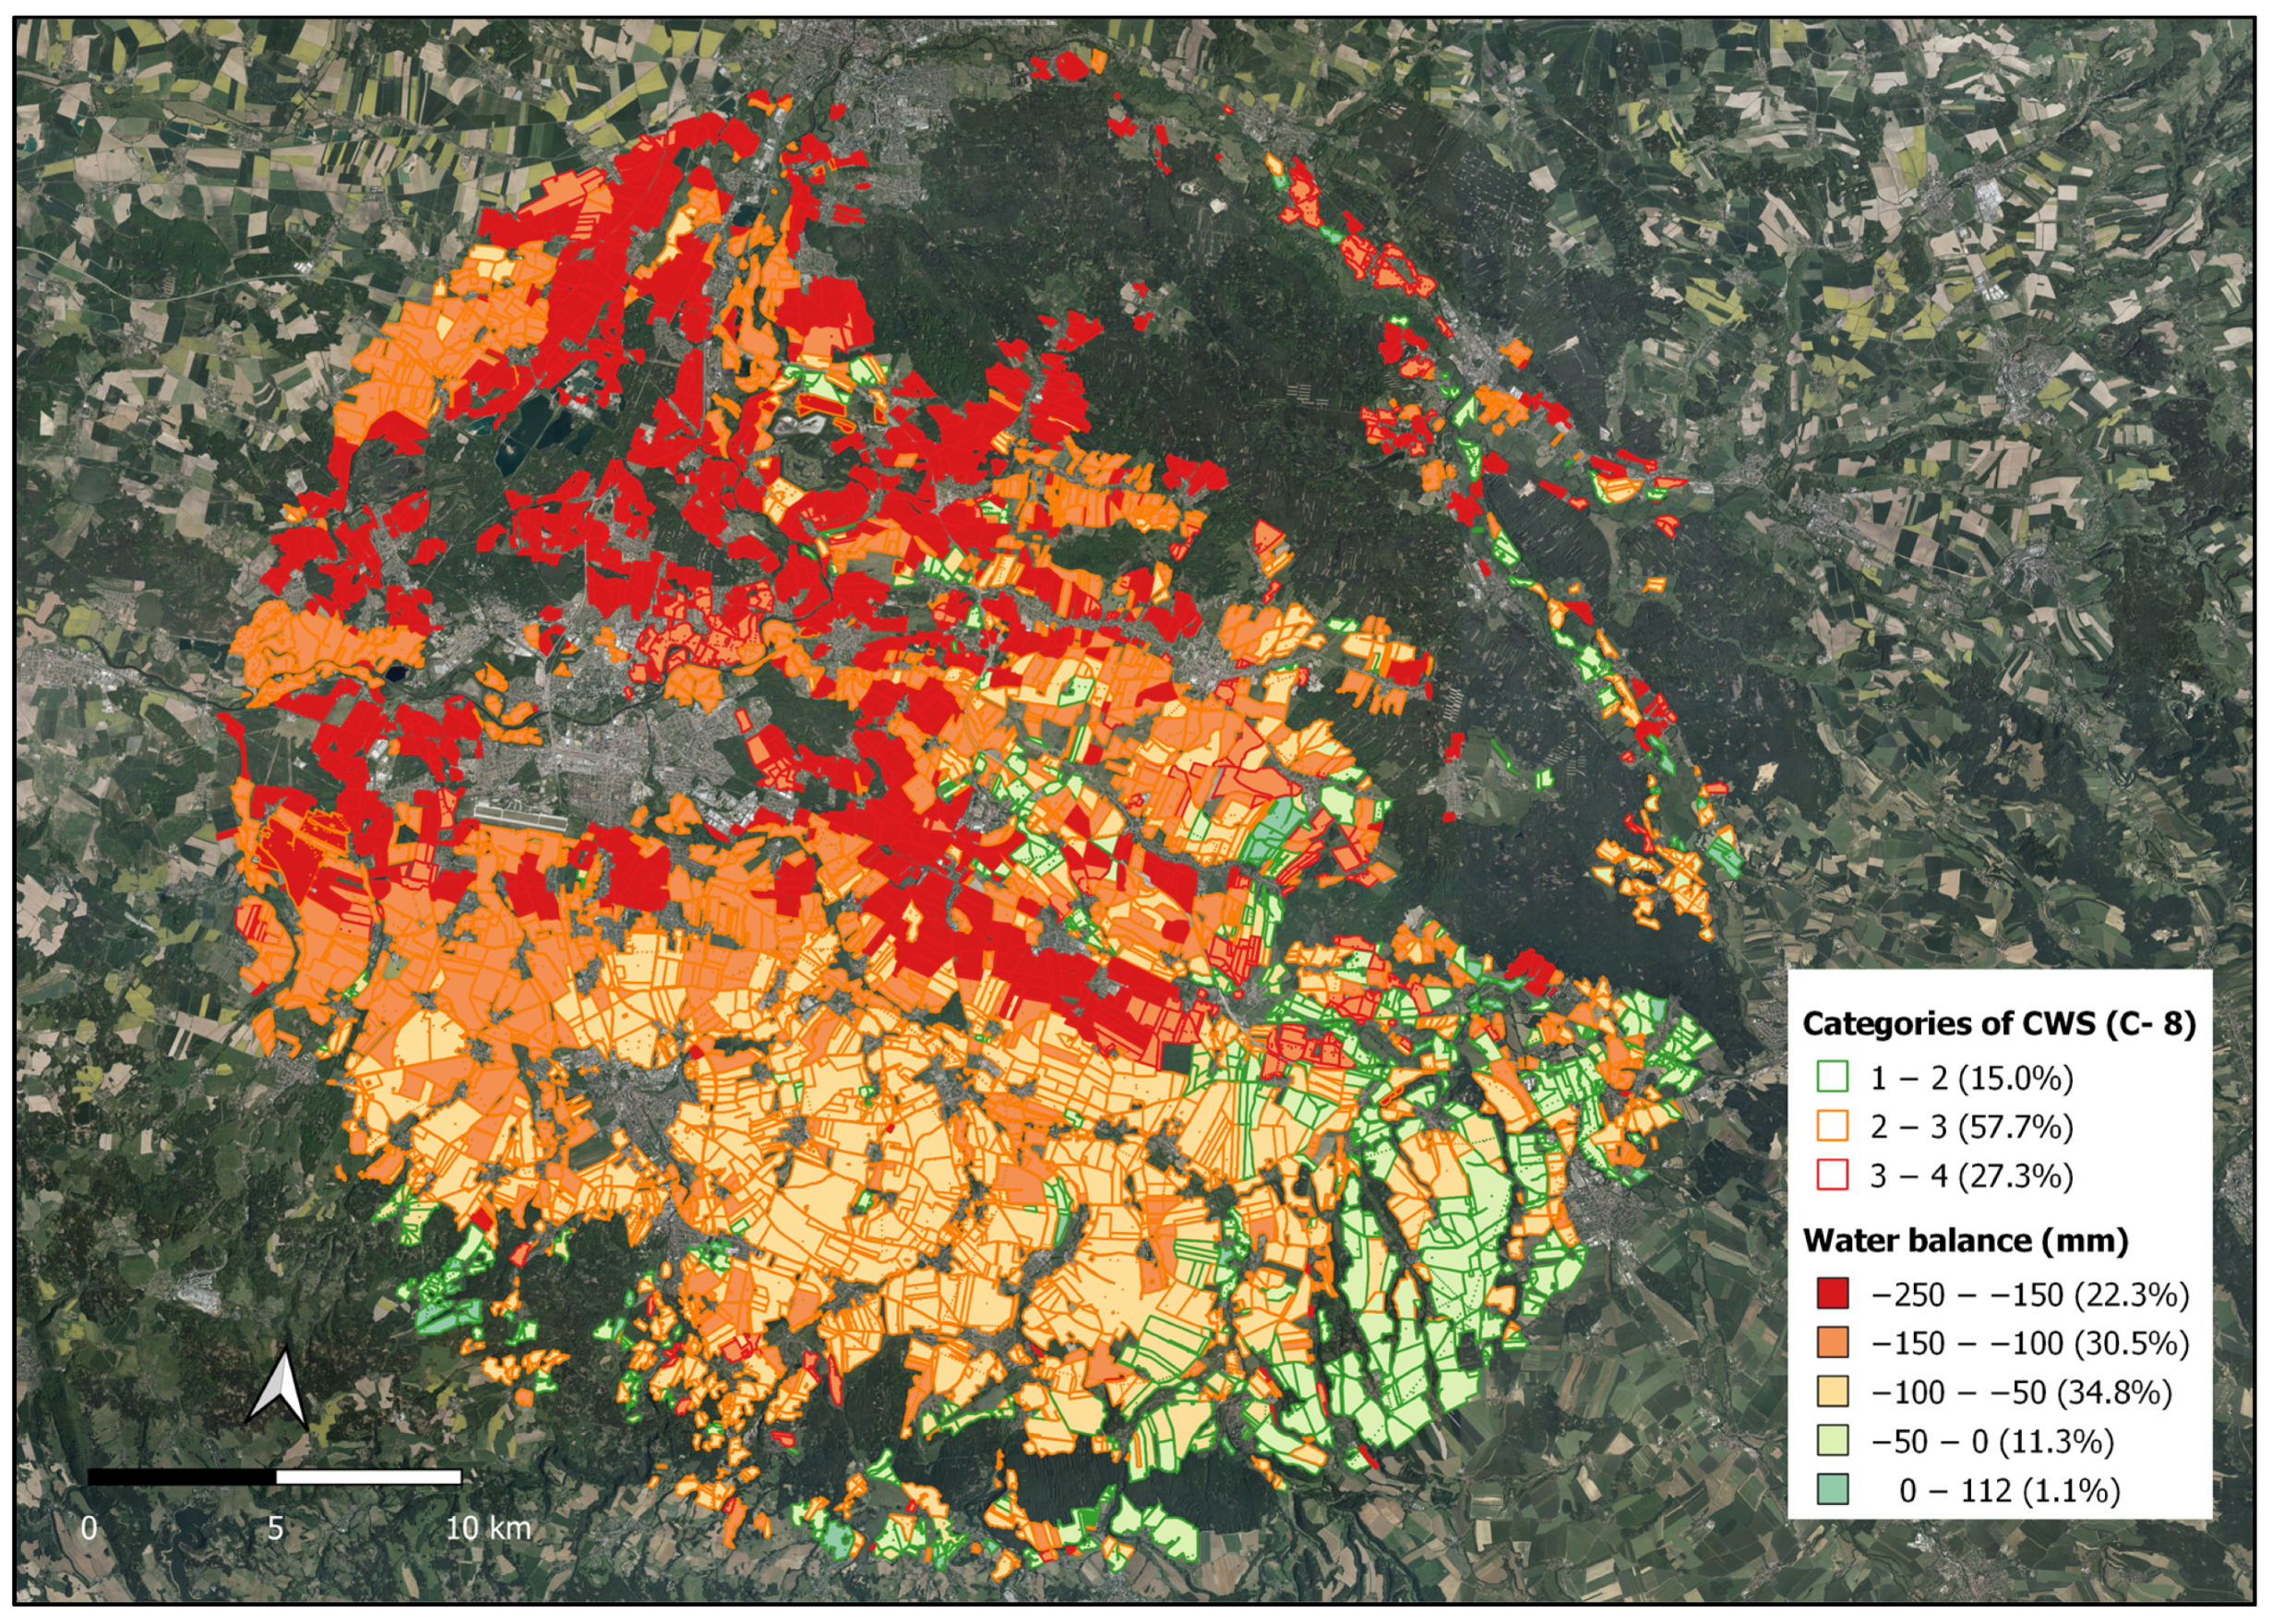
| Year/CRs | 1st | 2nd | 3rd | 4th | 5th | 6th | 7th | 8th | 9th | 10th |
|---|---|---|---|---|---|---|---|---|---|---|
| Conventional 8-year (C-8) | A | A | GM | SB | SM | WW | Sug | SB/A | ||
| Conventional 10-year (C-10) | A | A | WW | SB | Sun | SB | WR | WW | SM | SB/A |
| Water-saving (W-S) | A | A | WW | SB | WR | WW | Sorg | SB/A | ||
| Water-demanding (W-D) | A | A | GM | SB | Pea | WW | SM | SB/A |
| Crop Rotations | WB (mm) | r1.α.P (mm) | r2.ASWS (mm) | AARG (mm) | CWR (mm) | SAWCmin (%) | Categories of CWS | |||
|---|---|---|---|---|---|---|---|---|---|---|
| M. ± s.d. | 1–2 (%) | 2–3 (%) | 3–4 (%) | |||||||
| C-8 | −114 ± 55.9 | 252 ± 22.1 | 52.5 ± 13.3 | 34.9 ± 21.3 | 453 ± 16.0 | 53 | 2.79 ± 0.68 | 15.0 | 57.7 | 27.3 |
| C-10 | −107 ± 55.1 | 245 ± 30.3 | 56.3 ± 13.7 | 30.8 ± 19.9 | 439 ± 16.7 | 52 | 2.74 ± 0.75 | 13.6 | 64.3 | 22.2 |
| W-S | −95 ± 57.4 | 255 ± 20.9 | 58.4 ± 14.2 | 32.7 ± 22.5 | 441 ± 17.8 | 49 | 2.57 ± 0.75 | 32.9 | 47.2 | 19.9 |
| W-D | −118 ± 54.1 | 241 ± 20.7 | 54.4 ± 13.5 | 33.2 ± 20.7 | 446 ± 15.5 | 54 | 2.84 ± 0.72 | 7.1 | 62.2 | 30.7 |
| Texture Classes | Sandy | Loamy Sands | Sandy Loams | Loamy | Clay Loams | Clayey | ||||||
|---|---|---|---|---|---|---|---|---|---|---|---|---|
| Crop Rotations | WB (mm) | CWS | WB (mm) | CWS | WB (mm) | CWS | WB (mm) | CWS | WB (mm) | CWS | WB (mm) | CWS |
| C-8 | −209 a | 4.00 a | −157 a | 3.49 a | −105 a | 2.64 b | −75 b | 2.27 b | −104 b | 2.54 a | −148 a | 3.11 ab |
| C-10 | −202 b | 4.00 a | −150 b | 3.45 a | −98 b | 2.56 c | −68 c | 2.21 c | −98 c | 2.48 b | −142 a | 3.07 cb |
| W-S | −193 c | 4.00 a | −142 c | 3.33 b | −85 c | 2.38 d | −54 d | 2.01 d | −86 d | 2.28 c | −132 b | 2.96 c |
| W-D | −211 a | 4.00 a | −161 a | 3.52 a | −109 a | 2.70 a | −80 a | 2.33 a | −109 a | 2.58 a | −152 a | 3.18 a |
Disclaimer/Publisher’s Note: The statements, opinions and data contained in all publications are solely those of the individual author(s) and contributor(s) and not of MDPI and/or the editor(s). MDPI and/or the editor(s) disclaim responsibility for any injury to people or property resulting from any ideas, methods, instructions or products referred to in the content. |
© 2024 by the authors. Licensee MDPI, Basel, Switzerland. This article is an open access article distributed under the terms and conditions of the Creative Commons Attribution (CC BY) license (https://creativecommons.org/licenses/by/4.0/).
Share and Cite
Placatová, R.; Papaj, V.; Fučík, P.; Brázda, J.; Pacek, L.; Tlustoš, P. Evaluation of the Long-Term Water Balance in Selected Crop Rotations with Alfalfa in a Soil-Heterogeneous Lowland Region of the Czech Republic. Agronomy 2024, 14, 1692. https://doi.org/10.3390/agronomy14081692
Placatová R, Papaj V, Fučík P, Brázda J, Pacek L, Tlustoš P. Evaluation of the Long-Term Water Balance in Selected Crop Rotations with Alfalfa in a Soil-Heterogeneous Lowland Region of the Czech Republic. Agronomy. 2024; 14(8):1692. https://doi.org/10.3390/agronomy14081692
Chicago/Turabian StylePlacatová, Renata, Vladimír Papaj, Petr Fučík, Jiří Brázda, Lukáš Pacek, and Pavel Tlustoš. 2024. "Evaluation of the Long-Term Water Balance in Selected Crop Rotations with Alfalfa in a Soil-Heterogeneous Lowland Region of the Czech Republic" Agronomy 14, no. 8: 1692. https://doi.org/10.3390/agronomy14081692
APA StylePlacatová, R., Papaj, V., Fučík, P., Brázda, J., Pacek, L., & Tlustoš, P. (2024). Evaluation of the Long-Term Water Balance in Selected Crop Rotations with Alfalfa in a Soil-Heterogeneous Lowland Region of the Czech Republic. Agronomy, 14(8), 1692. https://doi.org/10.3390/agronomy14081692