Abstract
Low-temperature stress is one of the factors affecting the growth and development of peanuts. Currently, biochemical detection technologies for crop freeze damage are well established. In the context of rapid development in optical sensing technology and smart agriculture, non-destructive crop freeze damage detection based on such technologies has gained increasing attention. The accurate detection, early warning, and targeted control of crop cold damage are particularly important. In this study, 70 peanut germplasm resources were collected and used for the research objectives. Indoor low-temperature seedling identification was conducted at 25 °C (the control group) and 5 °C (low-temperature stress group) for 7 days. Photosynthetic fluorescence values in leaves, as well as 13 indicators (Fo, Fm, Fv, Fv/Fm, Fv’/Fm’, ΦPSII, NPQ, qP, Rfd, Pn, Gs, Ci, and Tr), were analyzed for their responses to low-temperature stress. The results showed that under low-temperature stress, the Pn and Ci of peanut seedlings exhibited an ascending trend, while Tr and other indicators showed a decreasing trend compared to the control group. Based on the relative coefficients of resistance to low temperature for each individual indicator, a comprehensive non-destructive evaluation of cold resistance was conducted using methods such as principal component analysis, cluster analysis, and stepwise regression. Through principal component analysis, the 13 individual physiological indicators were transformed into 3 comprehensive indicators. The 70 peanut varieties were divided into 4 categories based on their resistance to low temperature: sensitive materials, moderately sensitive materials, moderately cold-tolerant materials, and cold-tolerant materials. Additionally, a mathematical model for evaluating cold resistance in peanuts was established.
1. Introduction
Peanuts (Arachis hypogaea L.) serve as a primary source of high-quality plant protein and vegetable oil globally and are extensively cultivated in tropical and subtropical regions [1]. According to data from the Food and Agriculture Organization (FAO) of the United States Department of Agriculture, in 2020, the global peanut cultivation area was 27,171 thousand hectares, a 2.2% increase compared to the previous year [2]. In China, the peanut cultivation area was 4730.83 thousand hectares [3]. The protein content in peanut kernels ranges from 24% to 36%, with a protein digestibility coefficient of over 90%. Peanuts contain essential nutrients such as the eight essential amino acids, riboflavin, and vitamin E. Additionally, peanuts have an oil content ranging from 38% to 60%, higher than that of soybeans, rapeseed, and cottonseed [4,5,6]. However, against the backdrop of global climate change, extreme weather events such as low temperatures and droughts are becoming increasingly frequent. Peanuts are warm-weather crops and require relatively high temperatures throughout their growth stage.
Low temperature is an important factor affecting plant growth; peanut sowing seedlings often encounter low-temperature weather [7]. Peanut is native to the tropics and more sensitive to low temperature, especially peanut in the sprouting stage after the transition to the autotrophic growth stage. In this stage, if cold damage affects the growth of peanut seedling leaves, low temperature reduces the rate of cell division and elongation, resulting in the yellowing of peanut seedling leaves in the growth stage and wilting, and it will directly damage the plant’s photosynthetic mechanism, resulting in the weakening of photosynthesis in the leaves and affecting the accumulation of photosynthetic products in peanut seedlings [8,9,10]. Temperature is a key factor determining the distribution of peanuts in different regions. The optimum growth temperature for peanuts is between 25 °C and 30 °C, with plant growth inhibited when temperatures drop below 12 °C [11]. Low-temperature stress limits seed emergence, seedling growth, and the development of kernels and reduces the yield production and kernel quality [10].
Low temperature is a limiting factor for peanut cultivation and production. Under low-temperature stress, the dynamic balance of light quanta absorbed by the photosystem and those assimilated by CO2 is disrupted, resulting in a large accumulation of reactive oxygen species in the photosynthesis system, which disrupts the photosystem and thus reduces photosynthetic capacity [12]. With the reduced transport capacity of photosynthetic substrates and reduced CO2 uptake, the low temperature of spring sowing leads to a decrease in the accumulation of root, stem, and leaf matter in peanut seedlings. The seedling survival rate decreases, and growth is slow [13,14].
Therefore, developing peanut varieties with strong cold resistance is crucial for peanut cultivation and production as well as genetic improvement for cold resistance [15]. Currently, the evaluation and identification of crop cold resistance in China primarily rely on long-term field observations, which are labor-intensive and time-consuming. Non-destructive high-throughput phenotypic analysis based on phenomics is an emerging technology used to assess genetic diversity in various traits and facilitate selection in breeding programs [16,17,18,19].
Building on previous research, this study attempts to investigate the variations in parameters like photosynthetic rate and chlorophyll fluorescence in peanut seedlings under low-temperature stress during the seedling stage. The objective is to understand the mechanisms through which low temperatures affect peanut growth and photosynthesis and identify peanut varieties resistant to low temperatures through non-destructive, high-throughput experimental methods [20,21,22].
Low-temperature stress affects plant photosynthesis through electron transfer, photophosphorylation, and photoinhibition [10]. The study of chlorophyll fluorescence characteristics is one method to explore damage in plants [23,24,25]. Currently, chlorophyll fluorescence analysis technology has made certain progress in plant photosynthesis physiology, plant stress physiology, and crop yield potential prediction [26]. Fluorescence signal indicators contain rich information on changes in photosynthetic processes and are regarded as detection indicators for the relationship between plant photosynthesis and the environment [27]. Changes in chlorophyll fluorescence parameters are closely related to various processes of photosynthesis, influencing the formation of plant leaf internal structure, destroying the integrity and functionality of chloroplasts, significantly reducing parameters such as Fm, Fv, Fv’/Fm’, ΦPSII, qP, and Rfd, leading to fluctuations in plant photosynthetic rates. Therefore, chlorophyll fluorescence parameters can partly reflect the plant photosynthetic capacity and are important parameters for evaluating plant cold tolerance. These parameters have been applied for cold tolerance evaluation in various plants such as oats [28], wheat [29], chrysanthemums [30], and cassava [31].
Plant cold tolerance is a comprehensive reflection of a series of trait indicators. Selecting appropriate evaluation indicators and suitable evaluation methods is a prerequisite for assessing plant cold tolerance. The method of comprehensive evaluation with multiple indicators has been widely used in the study of plant cold resistance. Therefore, to avoid the one-sidedness and uncertainty of a single evaluation method, a comprehensive evaluation of low temperature resistance is more reliable.
In this study, 70 peanut varieties were subjected to treatments of low temperature (5 °C) and normal temperature (25 °C). A total of 13 indicators, including photosynthetic parameters and chlorophyll fluorescence parameters of peanut leaves under low-temperature treatment, were determined using non-destructive high-throughput methods. The photosynthetic characteristics of peanut seedlings under low-temperature stress were assessed, and the correlation analysis was conducted using the cold resistance coefficients of these indicators. Principal component analysis, subordinate function analysis, and cluster analysis were employed to comprehensively assess the cold resistance of peanut varieties. The objective was to select peanut varieties with strong cold resistance, identify the main indicators for cold resistance evaluation, and establish a mathematical model for evaluating peanut cold resistance. This study provides a reference for the non-destructive breeding of cold-resistant peanut varieties.
2. Materials and Methods
2.1. Experimental Materials
Seventy local main peanut varieties were used as experimental materials, provided by Fujian Academy of Agricultural Sciences and Quanzhou Institute of Agricultural Sciences. The specific material information is detailed in Table 1.

Table 1.
Information on the peanut variety for testing.
This experiment was carried out in a small thin-film greenhouse and a containerized plant factory at the Digital Institute of Fujian Academy of Agricultural Sciences. Thirty uniform and plump seeds were selected, soaked in 3% hypochlorite solution for 30 min, rinsed with deionized water, and then placed in soil for incubation at room temperature. Seedlings were grown to the four-leaf stage and transplanted into nutrient pots (30 cm high, 30 cm diameter at the mouth, and 25 cm diameter at the bottom). In this experiment, a randomized block design was employed. Peanut seedlings at the three-leaf-one-heart stage were divided into two groups. One group was transferred to a container-type plant factory where the temperature was set at 5 °C, with a light/dark cycle of 16 h/8 h, a red-to-blue light ratio of 7:3, a photosynthetic photon flux density of 250 μmol/(m2·s), and a relative humidity of 70–80%. The other group, with the same developmental progress, served as the control and was transferred to another container-type plant factory, where all environmental conditions were kept the same except for the temperature, which was set at 25 °C. To eliminate the influence of position factors on the experimental results, the arrangement order of seedling pots was randomly adjusted every 2 days. After 7 days of treatment, the photosynthetic and fluorescence parameters of the leaves were collected, with three replications for each treatment and three plants per replication.
2.2. Measurement of Photosynthetic Parameters
After 7 days of low-temperature treatment, five pots of peanut plants with similar size were selected. Using a portable photosynthesis analyzer LI-6400TX produced by LI-COR in the Lincoln, NE, USA, the net photosynthetic rate (Pn), transpiration rate (Tr), intercellular CO2 concentration (Ci), and stomatal conductance (Gs) of each peanut plant were measured on a clear morning between 9:00 and 11:30. The measurement was conducted on fully expanded trifoliate leaves, with the leaf chamber temperature set at 5 °C, light intensity at 1000 μmol/(m−2·s−1), and leaf chamber CO2 concentration at 350 μmol (mol−1).
2.3. Measurement of Chlorophyll Fluorescence Parameters
A chlorophyll fluorescence imager (FC800-D, Photon System Instruments (PSD), Brno, Czech Republic) was used for measurement. First, the test samples (whole live plants) were adapted to dark conditions in the greenhouse for 30 min. Subsequently, in the Fluorcam10 system, the Satu rating pulse value was set to 5250 μmol/(m2·s) and Actinic Light2 to 422 μmol/(m2·s). Then, the samples were put into the imager to measure the real-time initial fluorescence value (Fo), maximum photochemical efficiency of PSII (Fv/Fm), effective photochemical quantum yield of PSII (Fv’/Fm’), actual photochemical efficiency of PSII (ΦPSII), non-photochemical quenching coefficient (NPQ), and steady-state fluorescence decline rate (Rfd). The distance between the sample and the lens was set at 30 cm during the measurements.
2.4. Evaluation of Cold Tolerance and Data Analysis
The chlorophyll fluorescence imaging parameters were analyzed using Fluorcam7, and the original data were processed and related charts were created using Excel. Principal component analysis and correlation analysis were performed using SPSS 27.0, while cluster analysis was conducted using Origin 2021.
- (a)
- To eliminate differences between the basic traits of different varieties, the relative values of traits (cold resistance coefficient) were used to evaluate cold tolerance:
- (b)
- In principal component analysis, the orthogonal rotation method was used to rotate the data and establish a comprehensive index equation, as follows:
- (c)
- According to fuzzy mathematics principles, the membership function method was used to convert various indicators into membership function values (μ):
- (d)
- The comprehensive evaluation value of cold tolerance based on the membership function is as follows:
- (e)
- Utilizing the European distance and WPGMA method, cluster analysis was conducted based on the comprehensive D values of peanut germplasms to categorize cold tolerance levels.
- (f)
- With the D value as the dependent variable and evaluation indicators as the independent variables, stepwise regression analysis was performed to establish a regression model for evaluating cold tolerance during the seedling stage.
3. Results
3.1. Phenotypic Analysis of Traits Associated with Low-Temperature Peanuts
According to the phenotypic analysis of peanut multi-spectral fluorescence exchange parameters under low-temperature conditions in Table 2, the chlorophyll fluorescence dynamics method is an important non-destructive measurement method for plants, with commonly used indicators such as Fo, Fm, Fv, Fv/Fm, Fv’/Fm’, ΦPSII, NPQ, qP, and Rfd. After 7 days of low-temperature stress, peanut seedling leaf parameters including Fm, Fv/Fm, Fv’/Fm’, ΦPSII, NPQ, qP, and Rfd gradually decreased, while Fo increased (Table 3). Compared to the control (CK) treatment, after 7 days of low temperature, the peanut seedling leaf parameters Fm, Fv, Fv/Fm, Fv’/Fm’, ΦPSII, NPQ, qP, and Rfd decreased by 120%, 229%, 65%, 80%, 126%, 83%, 27%, and 116%, while Fo increased by 22%. Notably, Fv, Fm, Fv/Fm, and Rfd exhibited significant variations, with coefficients of variation of 39%, 27%, 17%, and 17%, respectively, whereas Fo, Fv’/Fm’, ΦPSII, and qP displayed smaller changes as well as lower coefficients of variation (12%, 7%, 8%, and 4%, respectively).
Table 2.
Variation analysis of physiological indices under low-temperature stress.
Table 3.
Principal component analysis of low-temperature resistance coefficient.
Photosynthetic gas exchange parameters are commonly used to reflect plant photosynthetic efficiency, including Pn, Gs, Ci, and Tr. After 7 days of “simulated low-temperature stress in late spring”, peanut seedling leaf parameters Pn, Gs, and Tr showed a decreasing trend, while Ci increased. The results indicated (Table 2) that compared to the CK treatment, after 7 days of low-temperature stress, leaf parameters Pn, Gs, and Tr decreased by 491%, 356%, and 323%, respectively, while Ci increased by 15%. Following 7 days of treatment at 5 °C, the photosynthetic fluorescence values of 70 peanut germplasms exhibited varying degrees of reduction, indicating significant differences in the trends of various physiological indices of different peanut varieties under long low-temperature growth.
3.2. Correlation Analysis of Individual Index Cold Resistance in Peanut Seedlings
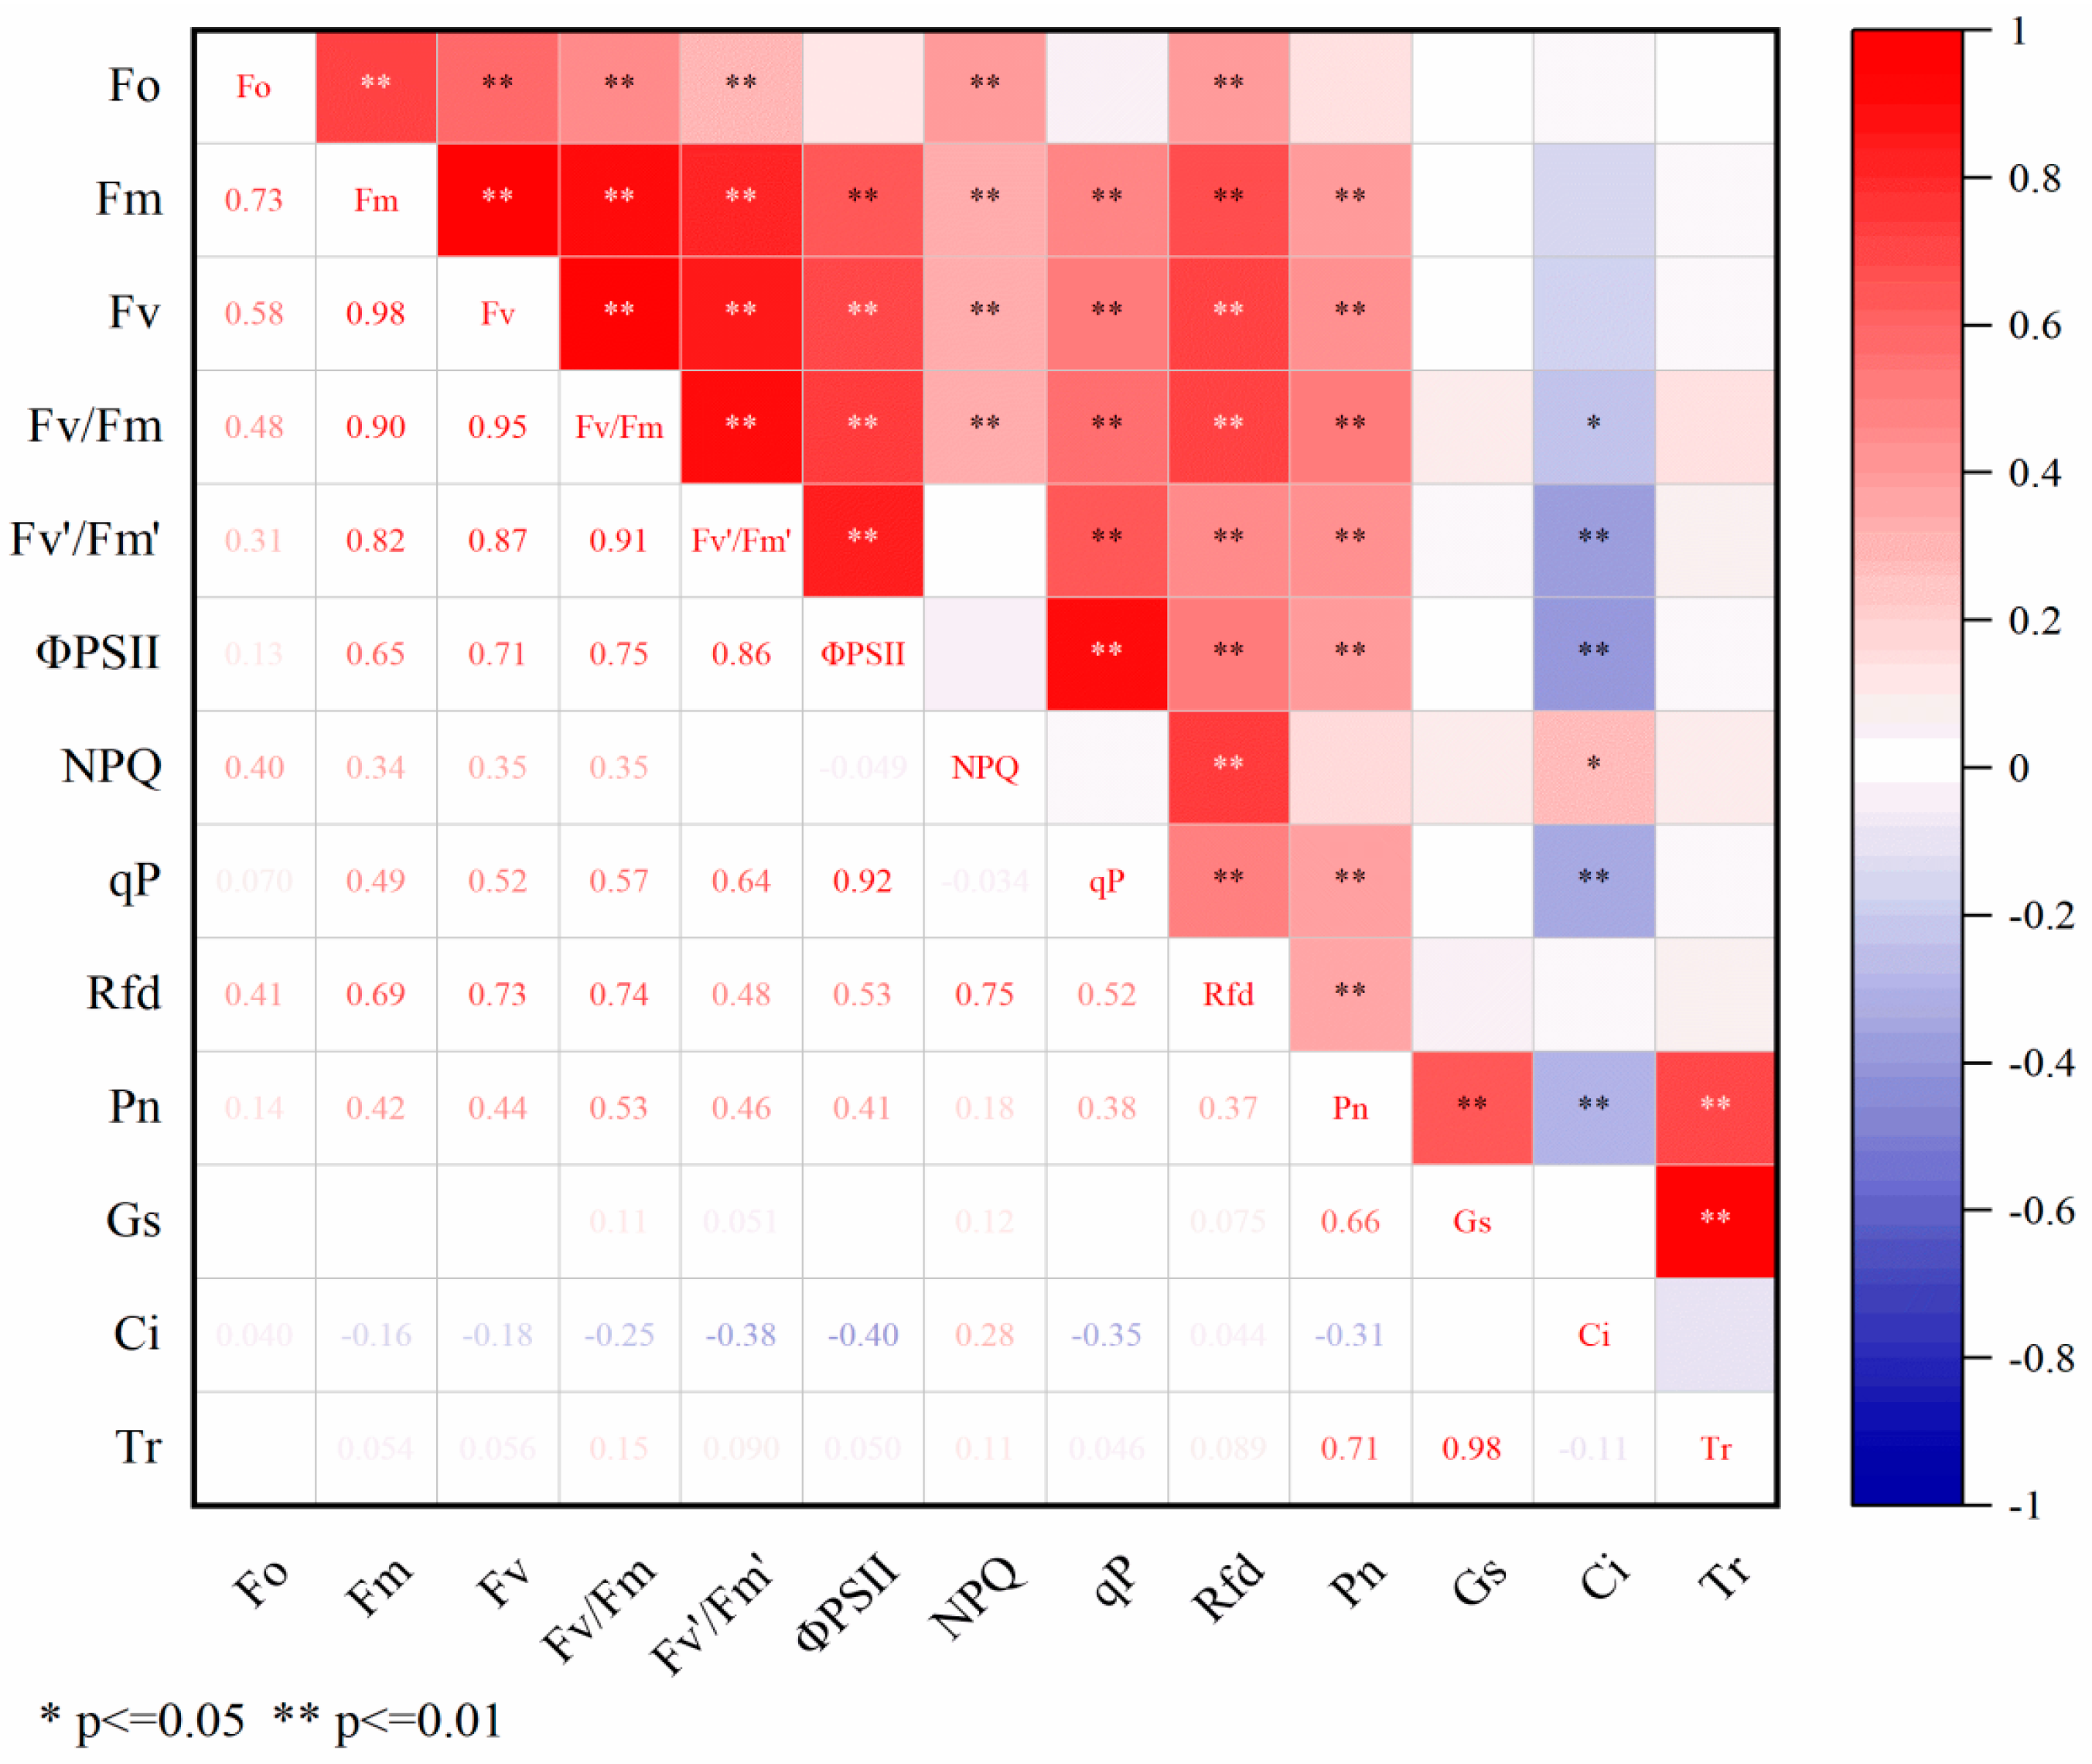
Correlation analysis was performed on the cold resistance coefficients of 70 peanut varieties across 13 indicators. The analysis illustrated in Figure 1 revealed that Fo exhibited highly significant positive correlations (p < 0.01) with Fm, Fv, Fv/Fm, Fv’/Fm’, NPQ, and Rfd. Similarly, Fm showed highly significant positive correlations with Fv, Fv/Fm, ΦPSII, NPQ, qP, Rfd, and Pn, while Fv displayed highly significant positive correlations with Fv/Fm, Fv’/Fm’, ΦPSII, NPQ, qP, Rfd, and Pn. Furthermore, Fv/Fm indicated highly significant positive correlations with Fv’/Fm’, ΦPSII, NPQ, qP, Rfd, and Pn yet a highly significant negative correlation with Ci. Additionally, Fv’/Fm’ exhibited highly significant negative correlations with ΦPSII, qP, Rfd, Pn, and Ci, as well as a highly significant negative correlation with Ci. Moreover, ΦPSII demonstrated highly significant positive correlations with qP, Rfd, and Pn but a highly significant negative correlation with Ci. NPQ showed highly significant positive correlations with qP, Rfd, and Pn yet a highly significant negative correlation with Ci. Additionally, qP exhibited a highly significant positive correlation with Rfd but a significant correlation with Ci. There were also highly significant positive correlations between Pn and Gs and Tr yet a highly significant negative correlation between Pn and Ci. A highly significant positive correlation was observed between Ci and Tr. Due to the existence of certain correlations among various indicators (Figure 1), the overlap of indicator information affects the results of cold resistance identification. Given the significant influence of multiple indicators on peanut cold resistance, further principal component analysis is necessary for a more accurate evaluation of peanut cold resistance.

Figure 1.
Correlation analysis of low-temperature resistance coefficient.
3.3. Principal Component Analysis of Individual Indicators
Principal component analysis was conducted on the cold resistance coefficients of 13 individual physiological indicators for peanuts (Table 3). The first three principal components had contribution rates of 47.23%, 18.63%, and 15.87%, respectively, with a cumulative contribution of 47.23%, 65.86%, and 81.72%. When the cumulative contribution rate of the principal components exceeds 80%, these three components can effectively represent the majority of information from the original 13 indicators, enabling a comprehensive evaluation of the cold resistance of peanuts. From the table, it is evident that for the first principal component, the indicator Ci has a negative impact with loadings ranging between −0.121 and 0.388; Fv/Fm and Fv’/Fm’ are high positive loading indicators with loadings of 0.388, 0.382, and 0.372, respectively. The indicators that negatively affect the second principal component include Fo, Fm, Fv, ΦPSII, Fv’/Fm’, qP, Rfd, and Ci, with loadings between −0.0453 and −0.1211. Gs and Tr are high positive loading indicators with loadings of 0.6098 and 0.6154, respectively. The third principal component displays negative impacts from indicators such as Pn, Fv’/Fm’, qP, and ΦPSII, with loadings ranging from −0.054 to −0.3168. Additionally, Ci activity and NPQ activity are high positive loading indicators, with loadings of 0.4469 and 0.5632, respectively. By multiplying the comprehensive score coefficients corresponding to the 13 fluorescence indicators with the variance contribution rates of each component and summing them, weights were calculated. A higher calculated result indicates a stronger positive impact on peanut cold resistance and thus a better indicator for evaluating peanut cold resistance. On this basis, the ranking of evaluation indicators for peanut cold resistance can be determined. The top ten optimal evaluation indicators for peanut cold resistance are Pn, Fv/Fm, Rfd, Fm, Fv, Tr, Gs, NPQ, Fo, and Fv’/Fm’.
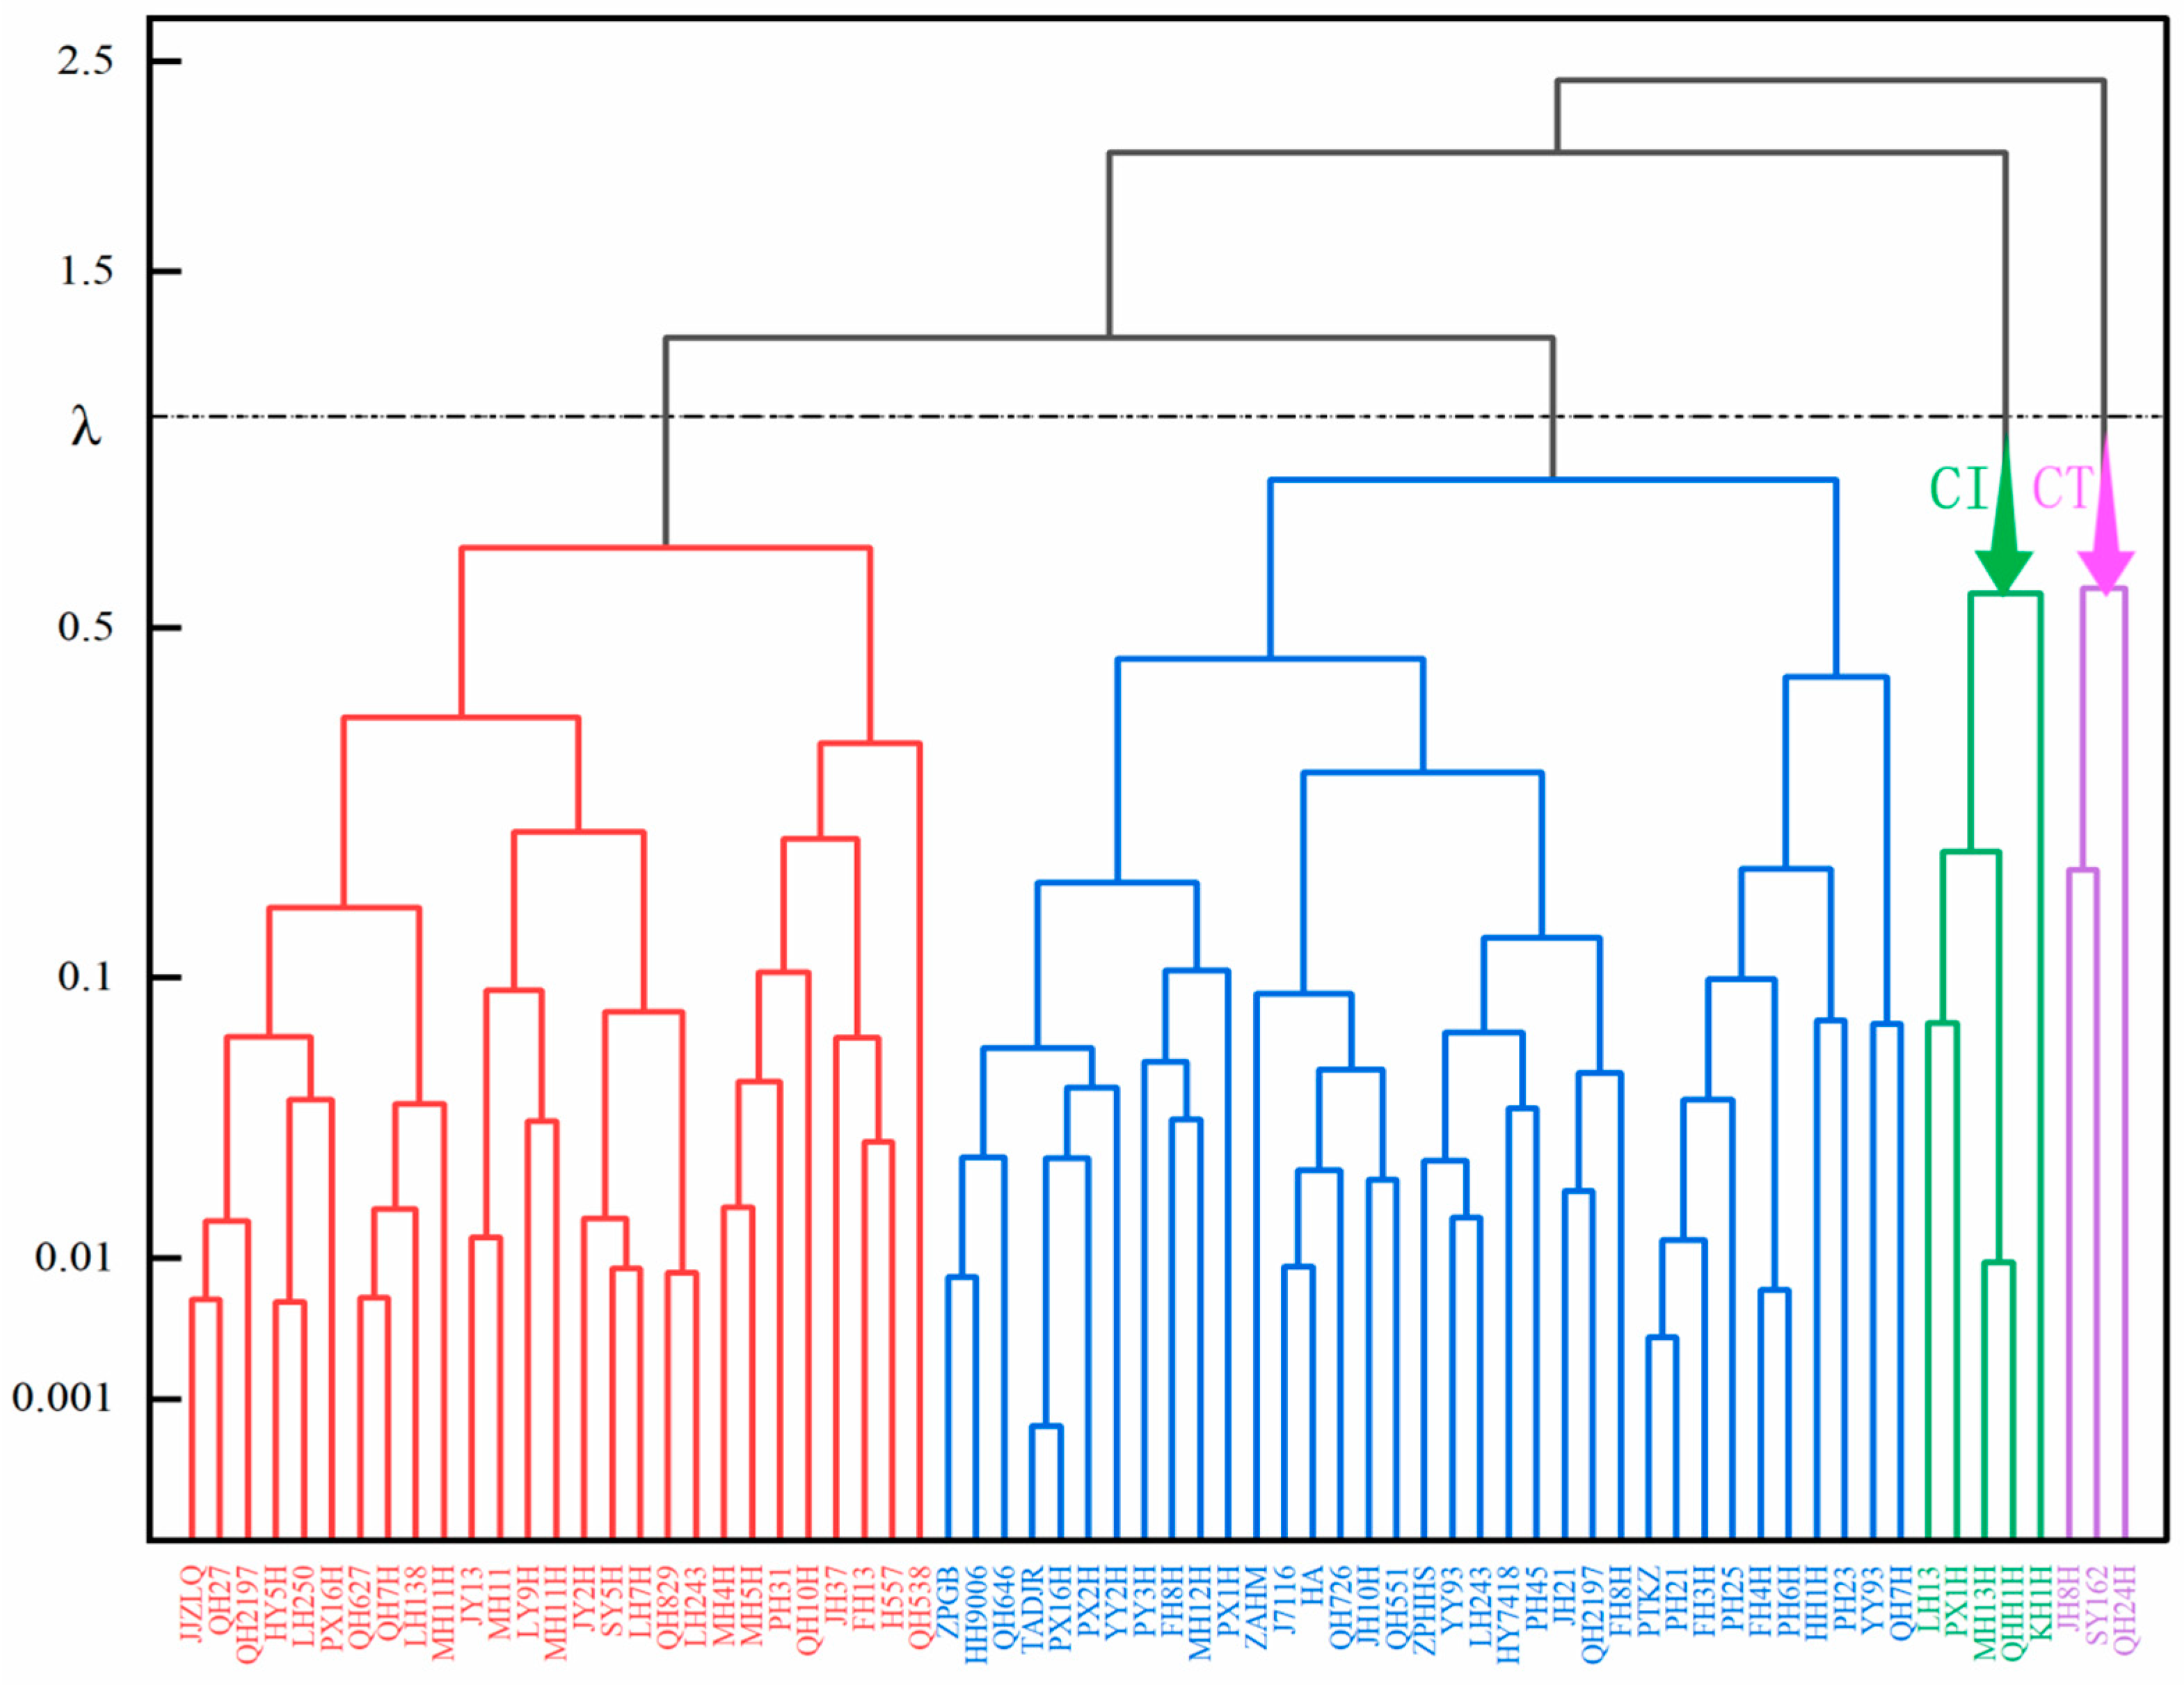
From Figure 2, it can be observed that the same comprehensive indicator falls into a function value range between 0 and 1. In terms of Principal Component 1 of the comprehensive indicator, the U(X1) value for variety 70 is maximal at 1, while variety 49 has a minimal U(X1) value of 0. This indicates that under Principal Component 1, variety 70 exhibits the strongest cold resistance, while variety 49 displays the weakest cold resistance. Similarly, varieties 70, 43, and 60 have the strongest cold resistance under Principal Components 2, 3, and 4, respectively, whereas varieties 39, 35, and 26 have the weakest cold resistance. Based on the membership function values of different comprehensive indicators for each variety, along with the weights of these indicators, the overall evaluation value of cold resistance for each variety, denoted as D, is calculated. The magnitude of D represents the strength of each variety’s cold resistance. Variety 70 (QH24H) has the highest D value of 0.773, while variety 49 (KH1H) has the lowest D value of 0.115. It can be therefore inferred that variety 70 exhibits the strongest cold resistance, while variety 49 displays the weakest cold resistance.
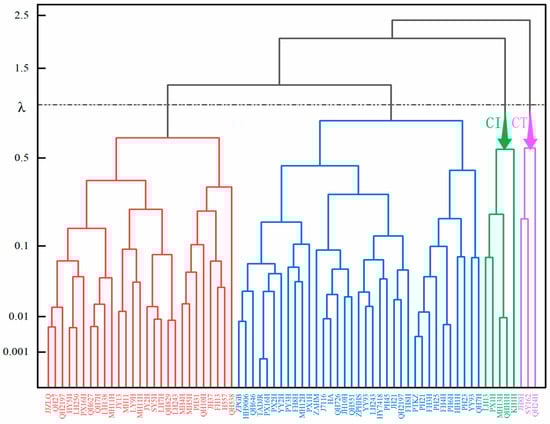
Figure 2.
Cluster analysis of cold resistance coefficients of comprehensive indicators. Note: cold-tolerant (CT); cold-intolerant (CI).
To better categorize the cold resistance of peanuts, systematic cluster analysis was performed on D values, dividing the cold resistance (λ = 1.0) of 70 peanut germplasms into 4 classes (Figure 2). Specifically, Class 1 is classified as highly cold-resistant, encompassing three peanut germplasms with D values ranging from 0.687 to 0.773. Class 2 is categorized as moderately cold-resistant, with D values ranging between 0.419 and 0.629 and including 35 materials. Class 3 is identified as mildly cold-resistant, with D values ranging from 0.247 to 0.410 and containing 28 materials. Finally, Class 4 is considered non-cold-resistant, with D values ranging from 0.115 to 0.202 and containing five materials.
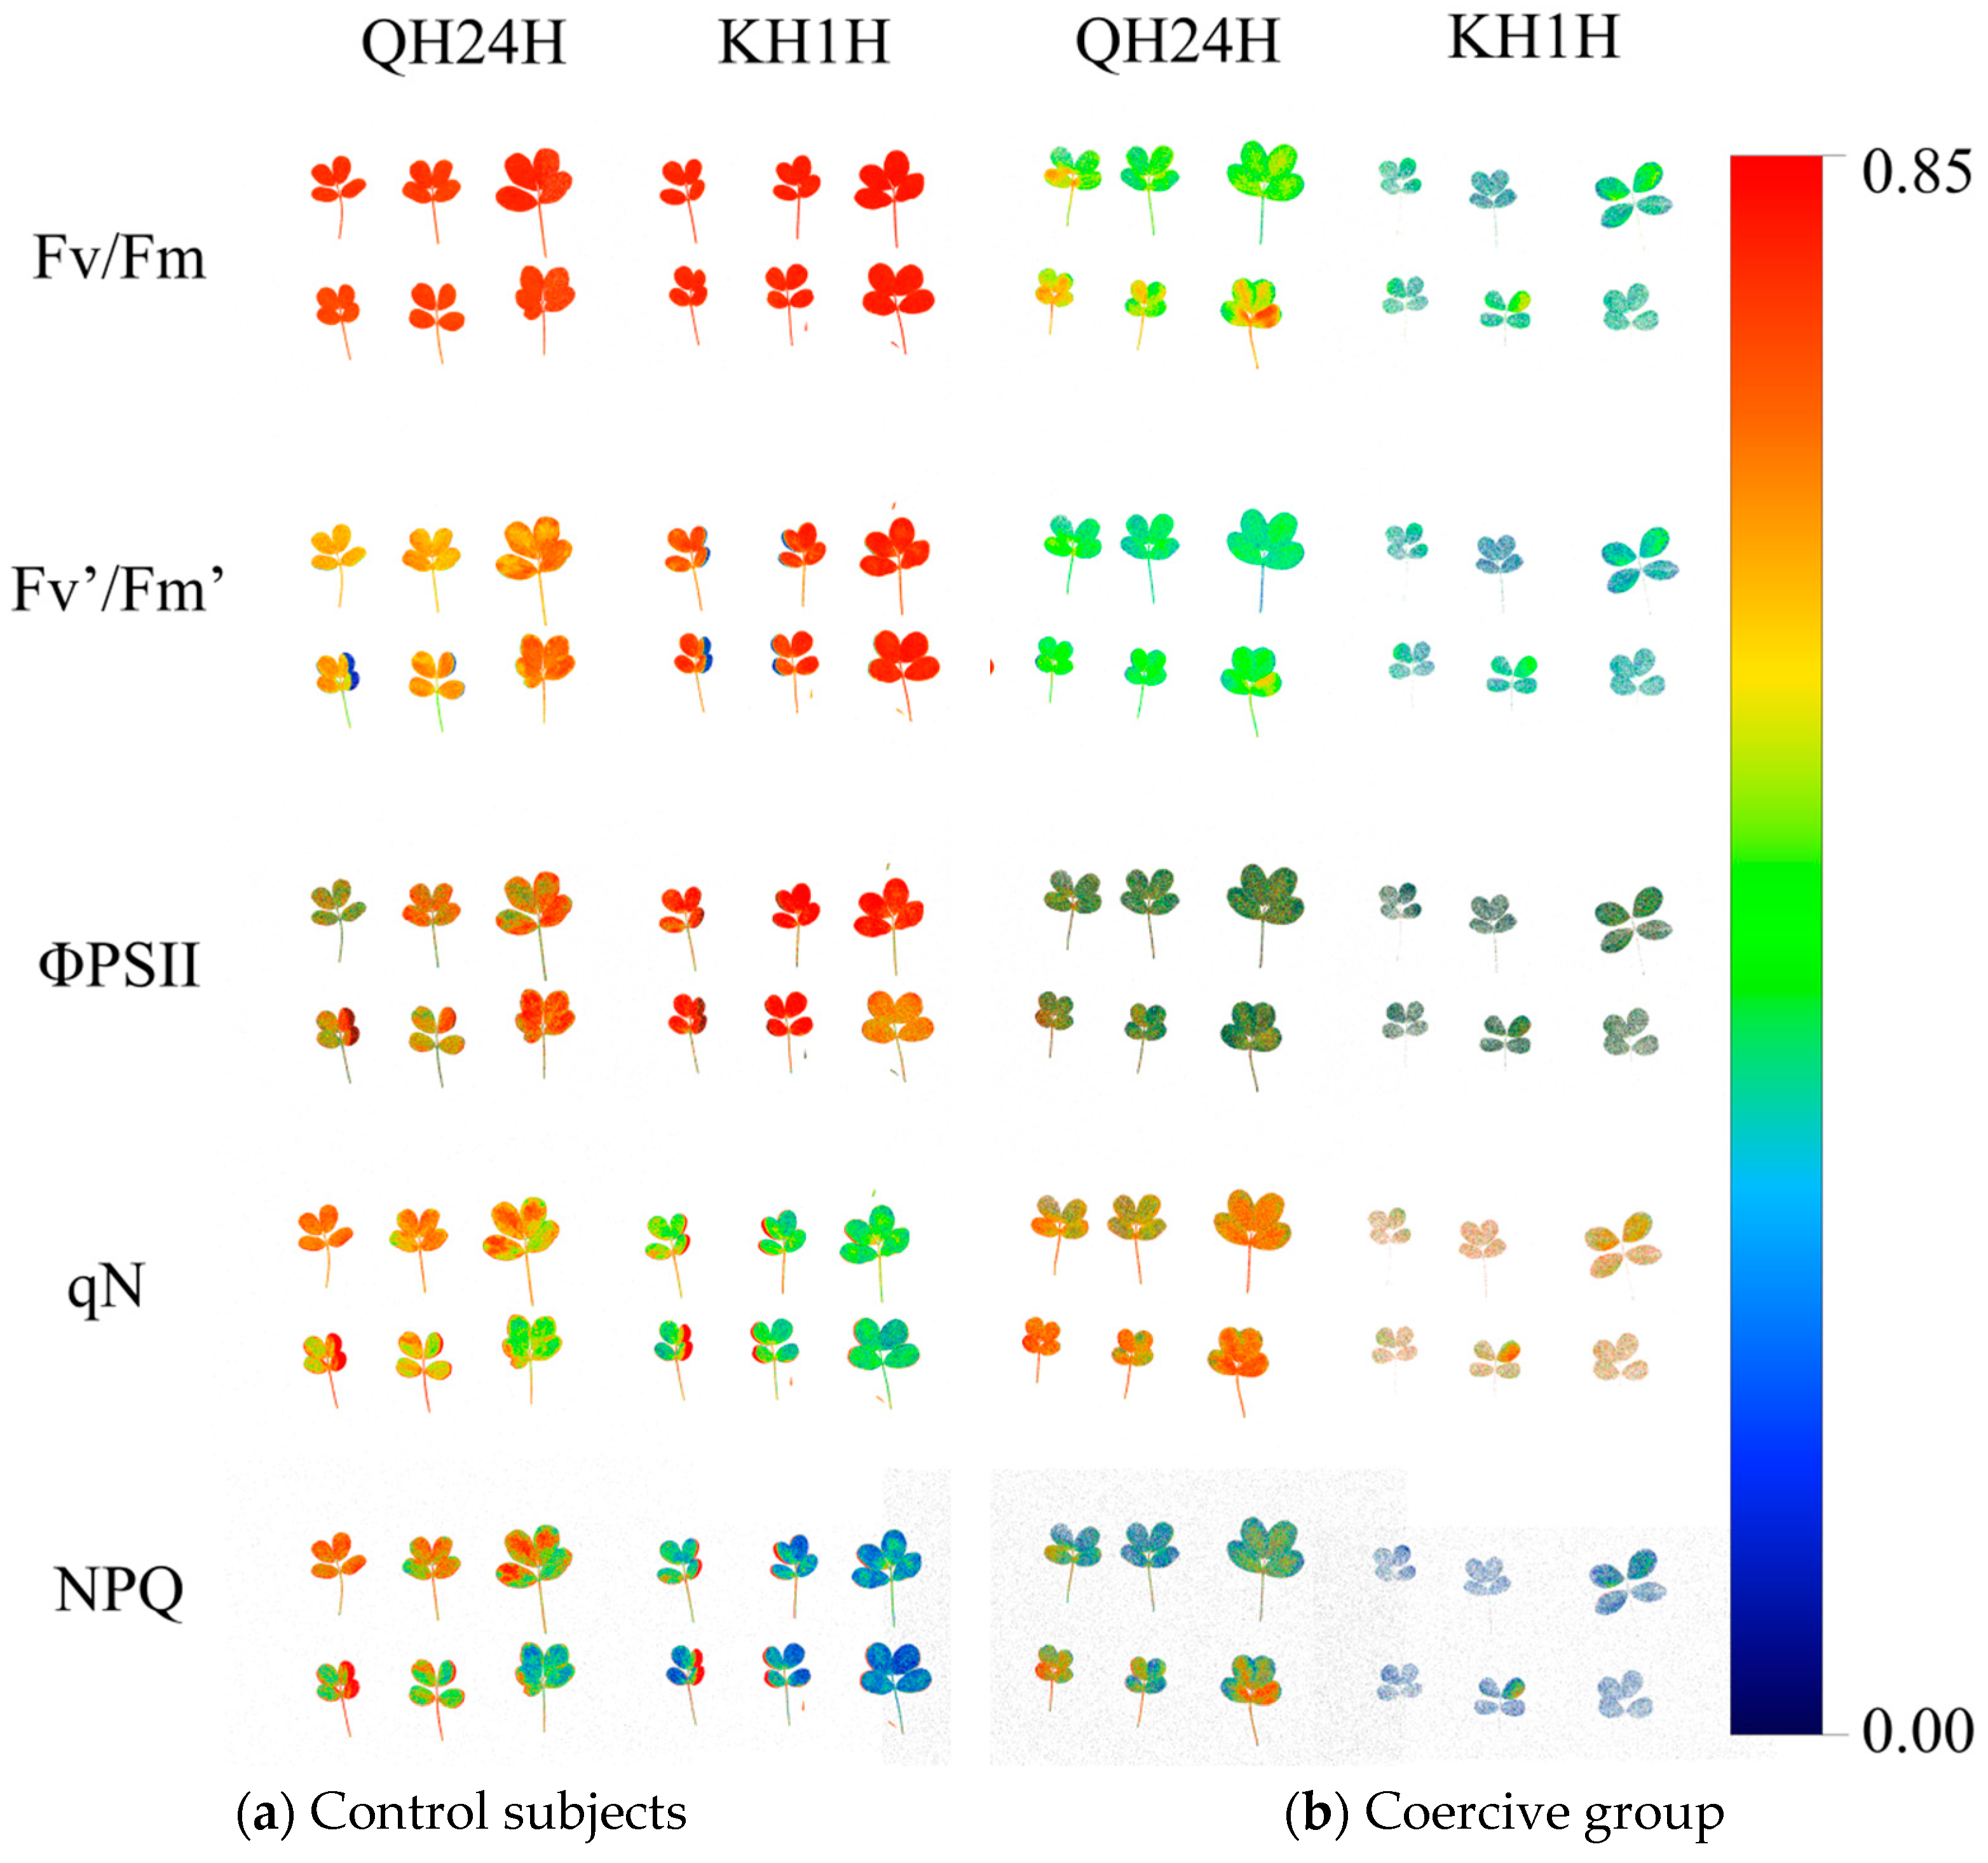
As indicated in Figure 3, almost all the processes involved in plant photosynthesis can be expressed using chlorophyll fluorescence parameters. To investigate the variation patterns of chlorophyll fluorescence parameters in peanut seedlings during the adaptation to low-temperature stress, this study employed a chlorophyll fluorescence imaging system to measure the chlorophyll fluorescence parameters of cold-tolerant peanut variety 70 (QH24H) and cold-sensitive peanut variety 49 (KH1H) (Figure 3). From the fluorescence in situ imaging of Fv/Fm, it can be observed that after 7 days of low-temperature stress, the leaf fluorescence color of variety 70 (QH24H) changed from orange-red to light green, whereas that of variety 49 (KH1H) transitioned from orange-red to blue-green. The color change of Fv’/Fm´ to blue-green in parallel with the decrease in Fv/Fm indicates a more significant reduction in Fv/Fm value for variety 49 (KH1H) under low-temperature stress, suggesting a more severe damage to the PSII reaction center. ΦPSII represents the actual photochemical efficiency of PSII. Under low-temperature stress, ΦPSII decreased by 558% and 187% for varieties QH24H and KH1H, respectively. Variety QH24H exhibited higher cold resistance, with its leaves appearing lighter and deeper green compared to KH1H after being subjected to 5 °C for 7 days. The photochemical quenching coefficient qN is an index used to measure the ability of capturing photon energy for photochemical reactions, that is, the light energy conversion efficiency of plants. Under low-temperature stress, variety 49 (KH1H) showed a significant decline after treated for 7 days at 5 °C, while variety 70 (QH24H) presented a slow downward trend, and the fluorescence image was similar to that of the control group. NPQ represents the plant’s thermal dissipation ability and reflects a self-protection mechanism in plants. Under low-temperature stress, the NPQ of variety 70 (QH24H) showed an ascending trend, while variety 49 (KH1H) exhibited a significant decrease, indicating that cold-resistant varieties can better dissipate excess light energy by increasing NPQ. Conversely, the self-protective thermal dissipation mechanism of temperature-sensitive varieties was severely disrupted.

Figure 3.
Pseudo-color image of chlorophyll fluorescence parameter ΦPSII in peanuts under low-temperature stress.
3.4. Establishment of Regression Equation and Screening of Identification Indicators
From the correlation analysis, as shown in Table 3, it is evident that the indicators Fv/Fm, ΦPSII, Rfd, Pn, Gs, Ci, and NPQ exhibit highly significant correlations with the comprehensive evaluation value (D) of cold tolerance. Therefore, these seven indicators are considered as independent variables, while D is regarded as the dependent variable. A stepwise regression analysis was performed to establish the regression model for evaluating the cold tolerance of peanut seedlings.
Y is the predicted value of cold tolerance evaluation, X1 represents Fo, X2 represents Fv/Fm, X3 represents ΦPSI, X4 represents Rfd activity, X5 represents Pn activity, X6 represents Ci activity, X7 represents Gs, and X8 represents NPQ.
An analysis of the prediction accuracy (EA) of the regression equation reveals that under the influence of low temperatures, when peanut seedlings are almost wilted, the values of all indicators approach zero, resulting in Y ≤ 0. In such cases, the sample can be directly classified as cold-sensitive. When Y > 0, only 1 sample has a prediction accuracy below 90%, while the average prediction accuracy of the remaining 69 samples reaches 97.4% (Table 4). The prediction accuracy of these 70 samples is above 95%, demonstrating that the vast majority of materials have a deviation of less than 5% between predicted and actual values. This proves that the selected indicators have a significant impact on the cold tolerance of seedlings, and this mathematical model can be used for the non-destructive assessment of cold tolerance indicators for peanut seedlings.
Table 4.
Prediction accuracy analysis of regression equation for evaluating cold tolerance of 70 peanut samples.
4. Discussion
Exploration and Utilization of Cold Tolerance Resources in Peanut Germplasm
Peanut is an important oilseed and economic crop with a preference for warm conditions, making it sensitive to temperature changes [32]. Therefore, the selection and breeding of peanut germplasms with strong cold tolerance is particularly crucial, especially in light of the increasing frequency of extreme cold climate events globally [33]. In the southern regions of China, spring is often accompanied by continuous occurrences of late frosts, which can significantly impact the growth and production of peanuts [34]. It is therefore essential to identify peanut germplasms suitable for low-temperature conditions in high-altitude regions.
The present study has revealed that under simulated conditions of extreme cold temperatures at 5 °C, various indicators of different peanut germplasms, such as Fm, Fv, Fv/Fm, Fv’/Fm’, ΦPSII, NPQ, qP, Rfd, Pn, Gs, and Tr, exhibited a decreasing trend compared to the control group, consistent with the findings of previous research by Li et al. [35]. The 70 peanut germplasm samples demonstrated differences across multiple indicators. A variation coefficient over 10% indicates significant variations in traits among germplasm resources, as noted in studies by Huang [36] and Liu [37]. In this study, the variation coefficient for 13 indicators of peanut germplasms ranged from 2.56% to 62.47%, suggesting that peanuts primarily rely on processes such as photosynthesis and respiration in leaves to counteract external abiotic stress under low-temperature conditions.
The photosynthetic process in plants is highly sensitive to temperature, and the disruption of carbon balance due to inhibited photosynthesis is a major cause of plant death [38,39]. Low temperatures directly affect the synthesis of chlorophyll in plants and the activity of photosynthetic organs, indirectly impacting photosynthesis through the diffusion resistance of stomata to CO2 and water stress. In this study, both the stomatal conductance (Gs) and transpiration rate (Tr) of peanut varieties in the low-temperature group significantly decreased under low-temperature stress, indicating a marked reduction in stomatal opening and impaired normal gas exchange in peanut seedlings. This ultimately affected the plant’s photosynthetic rate, with the cold-tolerant peanut varieties exhibiting significantly lower reduction than the cold-sensitive ones. Under adverse stress conditions, chlorophyll fluorescence parameters have been widely used as effective indicators to evaluate the extent of damage to the photosynthetic system [40]. In this experiment, indicators such as Fv/Fm, ΦPSII, and qP in the low-temperature group of peanut varieties showed varying degrees of decline, suggesting that the photosynthetic system of peanut seedlings was differently affected by low-temperature stress, leading to a significant decrease in light energy utilization efficiency. Notably, the impact was much lower on the cold-tolerant peanut varieties compared to the cold-sensitive ones. Therefore, the results of this study indicate that non-destructive parameters such as chlorophyll fluorescence and photosynthetic detection are effective for screening cold-tolerant peanut breeding.
Low temperatures can cause various effects on plants, including delayed structural development, disrupted physiological metabolism, reduced photosynthetic efficiency, and cell membrane damage leading to the leakage of cell ions and soluble substances [29]. Among these effects, photosynthesis is the most sensitive process to low temperatures. Photosynthetic rate, as an important parameter for studying plant light, also serves as a crucial indicator reflecting the plant’s growth status, stress resistance, and productivity [30]. Therefore, photosynthetic parameters can be used as one of the indicators for studying plant responses to low-temperature stress. Pn, Gs, and Tr plant leaves were applied as indicators for cold resistance [31].
Crop cold resistance is influenced by various factors such as genetics and the environment, making it challenging to assess accurately using a single indicator. However, introducing too many indicators can increase experimental errors and complexity. In this study, statistical methods like principal component analysis, membership function, and cluster analysis were employed [41]. These methods are commonly used for plant resistance evaluation [42]. Due to the different responses of indicators to low temperatures, directly evaluating resistance based on the membership function values of each indicator may lead to misjudgments in the low-temperature tolerance of some germplasm. Therefore, it is necessary to assign different weights to each indicator prior to evaluation [43,44]. Through cluster analysis, this study identified three highly cold-resistant and five highly cold-sensitive materials. The findings provide reference for breeding cold-resistant peanut varieties and studying the mechanisms of cold resistance in peanuts.
A model for peanut seedling cold resistance was constructed based on the cold resistance index (D) of 70 materials and the relative values of the 13 indicators. This model simplifies the evaluation of 13 indicators into 8, making the operation simpler and enhancing prediction accuracy. The model, constructed using a representative set of 70 peanut germplasm samples combined with cluster analysis to categorize cold resistance levels, can accurately predict the cold tolerance of unknown peanut germplasm resources.
5. Conclusions
In this study, 70 peanut varieties were subjected to treatments of low temperature (5 °C) and normal temperature (25 °C). Photosynthesis and fluorescence indices were used as evaluation metrics for the non-destructive identification of the cold tolerance of peanut seedlings. This study identified three highly cold-tolerant varieties (QH24H, SY162, and JH8H) and five highly cold-sensitive varieties (MH13H, QHH1H, PX1H, LH13, and KH1H). The findings provide insights for breeding cold-tolerant peanut varieties and investigating the mechanisms of cold resistance in peanut seedlings. Based on statistical methods, an evaluation model specifically tailored for peanut seedling cold resistance was developed. We demonstrated in this study that fluorescence spectroscopy, when analyzed together with photosynthetic feature extraction, provides a new avenue for rapid and non-destructive crop chilling injury monitoring, which is essential for the development of smart and precision agriculture.
Author Contributions
Conceptualization, methodology, data curation, writing—original, L.Y.; formal analysis, investigation, writing—review and editing, T.W.; software, C.Z.; validation, L.Z. and J.C.; resources, S.G.; visualization, supervision, R.W.; project administration, funding acquisition, Y.C. All authors have read and agreed to the published version of the manuscript.
Funding
This research was funded by the Key Technology for Digitization of Characteristic Agricultural Industries in Fuiian Province (XTCXGC2021015), Fujian Provincial Science and Technology Programme Spark Project (2021S0031), and Quanzhou Science and Technology Programme (2022N038).
Data Availability Statement
All the data supporting the findings of this study are included in this article.
Conflicts of Interest
The authors declare no conflicts of interest. The funders had no role in the design of the study; in the collection, analyses, or interpretation of data; in the writing of the manuscript; or in the decision to publish the results.
References
- Basuchaudhuri, P. Physiology of the Peanut Plant; CRC Press: Boca Raton, FL, USA, 2022. [Google Scholar]
- Kasnakoglu, H. FAOSTAT and CountrySTAT: Integrated Global and National Food and Agriculture Statistical Databases. In Proceedings of the XLIII Scientific Meeting, Societa Italiana di Statistica, Universita di Torino, Turin, Italy, 14–16 June 2006. [Google Scholar]
- Upadhyaya, H.D.; Reddy, L.J.; Dwivedi, S.L.; Gowda, C.L.L.; Singh, S. Phenotypic diversity in cold-tolerant peanut (Arachis hypogaea L.) germplasm. Euphytica 2009, 165, 279–291. [Google Scholar] [CrossRef]
- Arya, S.S.; Salve, A.R.; Chauhan, S. Peanuts as functional food: A review. J. Food. Sci. Technol. 2016, 53, 31–41. [Google Scholar] [CrossRef]
- Mingrou, L.; Guo, S.; Ho, C.T.; Bai, N. Review on chemical compositions and biological activities of peanut (Arachis hypogeae L.). J. Food Biochem. 2022, 46, e14119. [Google Scholar] [CrossRef] [PubMed]
- Toomer, O.T. Nutritional chemistry of the peanut (Arachis hypogaea). Crit. Rev. Food Sci. Nutr. 2018, 58, 3042–3053. [Google Scholar] [CrossRef] [PubMed]
- Prasad, P.V.V.; Boote, K.J.; Thomas, J.M.G.; Allen, L.H.; Gorbet, D.W. Influence of soil temperature on seedling emergence and early growth of peanut cultivars in field conditions. J. Agron. Crop Sci. 2006, 192, 168–177. [Google Scholar] [CrossRef]
- Zhang, H.; Dong, J.L.; Zhao, X.H.; Zhang, Y.M.; Ren, J.Y.; Xing, L.T.; Jiang, C.J.; Wang, X.G.; Wang, J.; Zhao, S.L.; et al. Research Progress in Membrane Lipid Metabolism and Molecular Mechanism in Peanut Cold Tolerance. Front. Plant Sci. 2019, 10, 838. [Google Scholar] [CrossRef] [PubMed]
- Chen, H.; Liu, N.; Xu, R.; Chen, X.; Zhang, Y.; Hu, R.; Lan, X.; Tang, Z.; Lin, G. Quantitative proteomics analysis reveals the response mechanism of peanut (Arachis hypogaea L.) to imbibitional chilling stress. Plant Biol. 2021, 23, 517–527. [Google Scholar] [CrossRef] [PubMed]
- Dong, J.; Zhang, H.; Ai, X.; Dong, Q.; Shi, X.; Zhao, X.; Zhong, C.; Yu, H. Improving chilling tolerance of peanut seedlings by enhancing antioxidant-modulated ROS scavenging ability, alleviating photosynthetic inhibition, and mobilizing nutrient absorption. Plant Biol. 2024, 26, 532–543. [Google Scholar] [CrossRef] [PubMed]
- Haerani, H.; Apan, A.; Nguyen-Huy, T.; Basnet, B. Modelling future spatial distribution of peanut crops in Australia under climate change scenarios. Geo-Spat. Inf. Sci. 2023, 1–20. [Google Scholar] [CrossRef]
- Zhang, H.; Jiang, C.; Ren, J.; Dong, J.; Shi, X.; Zhao, X.; Wang, X.; Wang, J.; Zhong, C.; Zhao, S.; et al. An Advanced Lipid Metabolism System Revealed by Transcriptomic and Lipidomic Analyses Plays a Central Role in Peanut Cold Tolerance. Front. Plant Sci. 2020, 11, 1110. [Google Scholar] [CrossRef]
- Wang, X.; Liu, Y.; Han, Z.; Chen, Y.; Huai, D.; Kang, Y.; Wang, Z.; Yan, L.; Jiang, H.; Lei, Y.; et al. Integrated Transcriptomics and Metabolomics Analysis Reveal Key Metabolism Pathways Contributing to Cold Tolerance in Peanut. Front. Plant Sci. 2021, 12, 752474. [Google Scholar] [CrossRef]
- Tong, B.; Shi, Y.S.; Ntambiyukuri, A.; Li, X.; Zhan, J.; Wang, A.Q.; Xiao, D.; He, L.F. Integration of Small RNA and Degradome Sequencing Reveals the Regulatory Network of Al-Induced Programmed Cell Death in Peanut. Int. J. Mol. Sci. 2022, 23, 246. [Google Scholar] [CrossRef] [PubMed]
- Kalarani, M.; Senthil, A.; Punitha, S.; Sowmyapriya, S.; Umapathi, M.; Geethalakshmi, V. Abiotic Stress Responses in Groundnut (Arachis hypogaea L.): Mechanisms and Adaptations. In Legumes: Physiology and Molecular Biology of Abiotic Stress Tolerance; Springer: Berlin/Heidelberg, Germany, 2023; pp. 279–290. [Google Scholar]
- Muncan, J.; Jinendra, B.M.S.; Kuroki, S.; Tsenkova, R. Aquaphotomics Research of Cold Stress in Soybean Cultivars with Different Stress Tolerance Ability: Early Detection of Cold Stress Response. Molecules 2022, 27, 744. [Google Scholar] [CrossRef] [PubMed]
- Peng, O.; Akers, W.; Berezin, M.Y. Detection of Cold Stress in Plants using Fluorescence Lifetime Imaging (FLIM). Curr. Anal. Chem. 2021, 17, 317–327. [Google Scholar] [CrossRef]
- Enders, T.A.; St Dennis, S.; Oakland, J.; Callen, S.T.; Gehan, M.A.; Miller, N.D.; Spalding, E.P.; Springer, N.M.; Hirsch, C.D. Classifying cold-stress responses of inbred maize seedlings using RGB imaging. Plant Direct 2019, 3, e00104. [Google Scholar] [CrossRef] [PubMed]
- Székely, A.; Szalóki, T.; Jancsó, M.; Pauk, J.; Lantos, C. Temporal Changes of Leaf Spectral Properties and Rapid Chlorophyll-A Fluorescence under Natural Cold Stress in Rice Seedlings. Plants 2023, 12, 2415. [Google Scholar] [CrossRef] [PubMed]
- Javornik, T.; Carović-Stanko, K.; Gunjača, J.; Vidak, M.; Lazarević, B. Monitoring drought stress in common bean using chlorophyll fluorescence and multispectral imaging. Plants 2023, 12, 1386. [Google Scholar] [CrossRef] [PubMed]
- Yan, F.; Dong, Y.; Li, Q.Q.; Zhao, F.Y.; Hou, X.M.; Liu, Y.; Li, Q.C.; Zhao, L.; Fan, G.Q.; Liu, K. Comprehensively evaluation on cold tolerance of foxtail millet varieties at germination stage. Acta Agron. Sin. 2024, 1–13. [Google Scholar]
- Li, T.; Yu, J.; Qiao, Y.F.; Miao, S.J. Effect of Short-Term Low Temperature on Seedling Growth and Nodule Nitrogen Fixation in Soybean. Chin. J. Agrometeorol. 2024, 45, 159–169. [Google Scholar]
- Kodad, O.; Morales, F.; Socias, R. Evaluation of almond flower tolerance to frosts by chlorophyll fluorescence. ITEA-Inf. Tec. Econ. Agrar. 2010, 106, 142–150. [Google Scholar]
- Mishra, A.; Mishra, K.B.; Hoermiller, I.I.; Heyer, A.G.; Nedbal, L. Chlorophyll fluorescence emission as a reporter on cold tolerance in Arabidopsis thaliana accessions. Plant Signal. Behav. 2011, 6, 301–310. [Google Scholar] [CrossRef]
- Bianchi, G.; Lo Scalzo, R.; Testoni, A.; Maestrelli, A. Nondestructive analysis to monitor potato quality during cold storage. J. Food Qual. 2014, 37, 9–17. [Google Scholar] [CrossRef]
- Baker, N.R.; Rosenqvist, E. Applications of chlorophyll fluorescence can improve crop production strategies: An examination of future possibilities. J. Exp. Bot. 2004, 55, 1607–1621. [Google Scholar] [CrossRef]
- Kumar, D.; Singh, H.; Raj, S.; Soni, V. Chlorophyll a fluorescence kinetics of mung bean (Vigna radiata L.) grown under artificial continuous light. Biochem. Biophys. Rep. 2020, 24, 100813. [Google Scholar] [CrossRef] [PubMed]
- Ibaraki, Y.; Dutta Gupta, S. Nondestructive evaluation of the photosynthetic properties of micropropagated plantlets by imaging photochemical reflectance index under low light intensity. Vitro Cell. Dev. Biol.-Plant 2010, 46, 530–536. [Google Scholar] [CrossRef]
- Rapacz, M.; Woźniczka, A. A selection tool for freezing tolerance in common wheat using the fast chlorophyll a fluorescence transient. Plant Breed. 2009, 128, 227–234. [Google Scholar] [CrossRef]
- Liang, F.; Zheng, C.-S.; Sun, X.-Z.; Wang, W.-L. Effects of low temperature-and weak light stress and its recovery on the photosynthesis and chlorophyll fluorescence parameters of cut flower chrysanthemum. Yingyong Shengtai Xuebao 2010, 21, 29. [Google Scholar] [PubMed]
- Togun, A.O.; Akparobi, S.O.; Ekanayake, I.J. Field studies on chlorophyll a fluorescence for low temperature tolerance testing of cassava (Manihot esculenta Crantz). J. Food Agric. Environ. 2004, 2, 166–170. [Google Scholar]
- Rai, S.; Deeksha Charak, D.C.; Rajeev Bharat, R.B. Scenario of oilseed crops across the globe. Plant Arch. 2016, 16, 125–132. [Google Scholar]
- Fu, D.; Ding, Y. The study of changing characteristics of the winter temperature and extreme cold events in China over the past six decades. Int. J. Climatol. 2021, 41, 2480–2494. [Google Scholar] [CrossRef]
- Song, Q.B.; Liu, Y.F.; Pang, J.Y.; Yong, J.W.H.; Chen, Y.L.; Bai, C.M.; Gille, C.; Shi, Q.W.; Wu, D.; Han, X.R.; et al. Supplementary Calcium Restores Peanut (Arachis hypogaea) Growth and Photosynthetic Capacity under Low Nocturnal Temperature. Front. Plant Sci. 2020, 10, 1637. [Google Scholar] [CrossRef]
- Li, W.; Sui, X.L.; Zhang, Z.X. Effects of temperature regime on low-light tolerance of Cucumis sativus seedling leaves in their photosynthesis. Ying Yong Sheng Tai Xue Bao 2008, 19, 2643–2650. [Google Scholar] [PubMed]
- Huang, Y.L.; Li, Y.Y.; Zhou, J.; Lao, C.Y.; Zhou, L.Z.; Wei, B.H.; Li, S.P.; Sheng, Z.Y. Analysis and Evaluation of Agronomic Traits of 266 Cassava Germplasm Resources. Chin. J. Trop. Crops 2024, 45, 712–721. [Google Scholar]
- Liu, L.Y.; Huang, Y.C.; Yang, N.; Liu, W.X.; Zhao, Y.M.; Long, C.F.; Dang, X.M. Genetic Diversity of Phenotypic Traits in 81 Capsicum annuum Germplasms. Chin. J. Trop. Crops 2023, 44, 706–715. [Google Scholar]
- Ch, O. Photoinhibition of Photosynthesis at Low Temperature in Barley and Scots Pine. Bachelor’s Thesis, Department of Plant Physiology, Umea University, Umea, Sweden, 1995. [Google Scholar]
- Xu, Z.; Zhang, J.X.; Wang, X.; Essemine, J.; Jin, J.; Qu, M.N.; Xiang, Y.; Chen, W.X. Cold-induced inhibition of photosynthesis-related genes integrated by a TOP6 complex in rice mesophyll cells. Nucleic Acids Res. 2023, 51, 1823–1842. [Google Scholar] [CrossRef] [PubMed]
- Lu, M.; Yuan, K.K.; Li, B.; Gao, P.; Wu, H.R.; Hu, J. Assessing chilling injury in cucumber seedlings using chlorophyll fluorescence based on a quantum genetic algorithm and support vector regression model. J. Asabe 2022, 65, 313–325. [Google Scholar] [CrossRef]
- Hannan, M.A.; Saha, N.R.; Roy, S.K.; Sun-hee, W.; Haque, M.S. Genetic Diversity Analysis and Molecular Screening for Salinity Tolerance in Wheat Germplasm. Plant Breed. Biotechnol. 2021, 9, 185–198. [Google Scholar] [CrossRef]
- Yadava, Y.K.; Singh, R.K.; Kumar, P.; Kumar, P.; Yadav, M.K.; Barh, A.; Upadhayay, H.D.; Kumar, R. Assay of Genetic Architecture for Identification of Waterlogging Tolerant Pigeonpea Germplasm. Natl. Acad. Sci. Lett.-India 2018, 41, 11–14. [Google Scholar] [CrossRef]
- Tian, H.L.; Wu, C.J.; Zhang, L.J.; Guo, S.H.; Wang, Y.Q.; Pei, S.S.; Zuo, X.Q.; Wang, Q.B.; Zhang, Q. Phenotypic diversity analysis of Polygala tenuifolia Willd germplasm resources in China. Genet. Resour. Crop Evol. 2024, 1–12. [Google Scholar] [CrossRef]
- Upadhyaya, H.D.; Wang, Y.H.; Gowda, C.L.L.; Sharma, S. Association mapping of maturity and plant height using SNP markers with the sorghum mini core collection. Theor. Appl. Genet. 2013, 126, 2003–2015. [Google Scholar] [CrossRef]
Disclaimer/Publisher’s Note: The statements, opinions and data contained in all publications are solely those of the individual author(s) and contributor(s) and not of MDPI and/or the editor(s). MDPI and/or the editor(s) disclaim responsibility for any injury to people or property resulting from any ideas, methods, instructions or products referred to in the content. |
© 2024 by the authors. Licensee MDPI, Basel, Switzerland. This article is an open access article distributed under the terms and conditions of the Creative Commons Attribution (CC BY) license (https://creativecommons.org/licenses/by/4.0/).