Abstract
Red solar-induced chlorophyll fluorescence (SIFB) is closely related to the photosynthetically active radiation absorbed by chlorophyll. The scattering and reabsorption of SIFB by the vegetation canopy significantly change the spectral intensity and shape of SIF, which affects the relationship between SIF and crop stress. To address this, we propose a method of modifying SIFB using SIF spectral shape characteristic parameters to reduce this influence. A red pseudokurtosis (PKB) parameter that can characterize spectral shape features was calculated using full-spectrum SIF data. On this basis, we analyzed the photosynthetic physiological mechanism of PKB and found that it significantly correlates with both the fraction of photosynthetically active radiation absorbed by chlorophyll(fPARchl) and the red SIF escape rate (fesc680); thus, it is closely related to the scattering and reabsorption of SIFB by the vegetation canopy. Consequently, we constructed an expression of PKB to modify SIFB. To evaluate the modified SIFB (MSIFB) in monitoring the severity of wheat stripe rust, we analyzed the correlations between SIFB, MSIFB, SIFB-VIs (a fusion of the vegetation index and SIFB), and MSIFB-VIs (a fusion of the vegetation index and MSIFB) with the severity level (SL), respectively. The results show that the correlation between MSIFB and the severity of wheat stripe rust increased by an average of 25.6% and at least 16.95% compared with that for SIFB. In addition, we constructed remote sensing monitoring models for wheat stripe rust using linear regression methods, with SIFB, MSIFB, SIFB-VIs, and MSIFB-VIs as independent variables. PKB significantly improves the accuracy and robustness of models based on SIFB and its fusion index SIFB-VIs in the constructed testing set. The R-value between the predicted SL and the measured SL of the remote sensing monitoring model for wheat stripe rust was established using MSIFB-VIs as the independent variable, and it was improved by an average of 39.49% compared with the model using SIFB-VIs. The RMSE was reduced by an average of 18.22%. Therefore, the SIFB modified by PKB can weaken the effects of chlorophyll reabsorption and canopy architecture on SIFB and improve the ability of SIFB to detect stress information.
1. Introduction
Wheat is the most important food product in the world, and its yield is crucial for the livelihood of nations. Yellow rust (stripe rust), caused by Puccinia striiformis f. sp. tritici (Pst), is a serious constraint to global wheat production. The optimal conditions for rust disease development involve warm days, mild nights, moisture, and humidity [1]. With global climate change, wheat yellow rust has increasingly become a problem. Approximately 70% of the world’s wheat area is susceptible to yellow rust, leading to recurrent epidemics and substantial economic losses [2]. To combat this threat, extensive international endeavors are being conducted to meticulously track the development and spread of virulent wheat rust species.
After stripe rust infection, the internal cell tissues of wheat leaves are destroyed, changing the biochemical composition of the wheat and the open ratio of chloroplast photoreaction centers, which leads to a decreased net photosynthetic rate, and the transfer and output of photosynthetic products are inhibited and disturbed [3]. The reflectance spectrum can be directly correlated with the biochemical and biophysical parameters of vegetation, including chlorophyll content and biomass, but it primarily represents “potential photosynthesis” rather than the actual physiological state [4]. Consequently, it is challenging to directly assess the physiological state of vegetation photosynthesis using the reflectance spectrum and to capture early photosynthetic responses to disease stress [5].
Solar-induced chlorophyll fluorescence (SIF) is the fluorescence emitted within the 640–800 nm wavelength range by chlorophyll in vegetation leaves when it returns to its ground state after being excited by sunlight [6]. SIF can reflect the inherent connection between vegetation and photosynthesis and is a direct detection method for “actual photosynthesis” [7,8]. It can be detected through remote sensing and is a direct and non-invasive indicator for measuring photosynthetic status. It is becoming an important tool for monitoring crop physiological conditions through remote sensing [9] and detecting stress information before changes occur in biochemical vegetation components and canopy structures [10]. The SIF spectrum emitted by vegetation has two peaks: red (approximately 685 nm, O2-B) and far-red (approximately 740 nm, O2-A). Far-red SIF (SIFA) originates from chlorophyll associated with photosystem I (PSI) and photosystem II (PSII), and it is significantly influenced by the structural characteristics of vegetation [11]. Red SIF (SIFB) is derived from chlorophyll associated with PSII and is closely related to chlorophyll reabsorption by vegetation. It can sensitively reflect the photosynthetic status of vegetation [12] and holds significant importance in monitoring crop stresses, such as diseases [13]. However, red SIF is significantly impacted by the absorption of chlorophyll within leaves [14], and its Fraunhofer absorption lines are narrower and shallower than those of far-red SIF [15]. Consequently, its inversion accuracy is less robust than that of far-red SIF. As a result, few studies are related to using red SIF [9,10,16]. The scattering and reabsorption effects of vegetation on SIF lead to the biochemical components and structural characteristics of vegetation having a significant impact on the spectral intensity and shape of SIF [11]. Therefore, the spectral features of full-spectrum SIF not only change with physiological regulation through energy dissipation pathways but also differ with variations in plant biochemical components [17]. These factors significantly impact the shape and intensity of SIF spectral curves. Full-spectrum SIF provides not only intensity information at peaks but also shape information near peaks, enabling a more comprehensive and accurate reflection of crop physiological changes induced by disease and stress [18]. However, current research has mainly focused on monitoring crop stress conditions based on single-band SIF intensity, without considering the shape information of full-band SIF spectra, missing out on valuable information contained in unused spectral bands. Based on this, we extracted the full-spectrum SIF spectrum using the F-SFM algorithm to fully utilize its shape and intensity information. Furthermore, the standardized fourth central moment was extracted from the red SIF spectrum and was used to calculate pseudokurtosis (PKB) under different disease severity levels. Based on the analysis of the physiological mechanism of PKB, we used PKB to modify SIFB (MSIFB) to eliminate the influence of reabsorption and scattering effects on SIFB. Finally, we analyzed the correlation between MSIFB and the severity of wheat stripe rust and evaluated the effectiveness of MSIFB in estimating wheat stripe rust severity. The findings of this study are significant for improving wheat stripe rust monitoring accuracy and provide an important reference value for the remote sensing monitoring of other crop stresses.
2. Materials and Methods
The data used in this study primarily consisted of measured data from plot control experiments, natural disease field experiments on stripe rust, and model simulation data. The measured data mainly comprised field canopy spectra and wheat stripe rust disease severity levels. The model simulation data were divided into two parts: the Fluspect model simulates absorption spectra and analyzes the influence of vegetation reabsorption effects on the shape of the SIF spectrum; the SCOPE model simulates SIF spectral curves and photosynthesis-related parameters to analyze the photosynthetic physiological mechanisms underlying shape parameters.
2.1. Overview of the Study Area and Data Acquisition
2.1.1. Plot Disease Field Experiment
A plot disease field experiment was conducted at the experimental station of the Chinese Academy of Agricultural Sciences in Langfang, Hebei Province (located between a latitude of 38°28′ N and 40°15′ N and longitude of 114°47′ E and 117°14′ E). The wheat variety Mingxian 169 was used, as it is highly susceptible to stripe rust. The seeding density was set at 113 grains per square meter. On 9 April 2018, a spore solution with a concentration of 9 mg/100 mL was used to inoculate the wheat with stripe rust. Each experimental group covered 220 square meters and was divided into 8 quadrats.
2.1.2. Natural Disease Field Experiment
The natural disease field experimental area was located in Qishan County, Baoji City, Shaanxi Province, China (39°30′ N, 116°36′ E) (Figure 1). This area is situated close to the over-summering region of stripe rust in Longnan and belongs to the warm temperate semi-humid climate zone. The annual precipitation ranges from 590 to 1000 mm. These climatic and geographical factors provide suitable conditions for stripe rust outbreaks. The soil types in the natural disease field area were mainly semialfisol and primary soil, and the wheat variety used was Xinong 822. The planting time and management practices for wheat varied between farmers in the survey area.
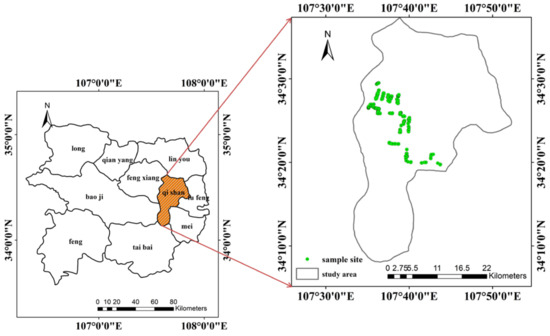
Figure 1.
Overview of the natural disease field area; the green dots depict sampling sites.
2.1.3. Disease Severity and Field Canopy Spectral Measurement
The measurement times for the plot disease field experiment were 15, 18, 24, and 30 May 2018, with 7 quadrats measured each day. Each plot was 3 m × 7 m, and each quadrat was 40 cm × 40 cm. For the field natural disease experiment, the measurement times were 16, 17, 28, 29, and 30 April and 12 and 13 May 2021, with 30 quadrats measured daily. The sample plot size was also 40 cm × 40 cm.
The canopy spectrum was measured using a QE-pro spectrometer (Ocean Optics, Inc., Dunedin, FL, USA) [19]. The measurement height was 0.9 m above the wheat canopy, with a probe view optical field of 25° and an observed area of 0.13 m2. Observations were made perpendicular to the canopy. For each quadrat, spectral data for the sampling point were derived by averaging 10 consecutive observations [20]. Figure 1 illustrates the measurement area for each period.
The five-point sampling method was adopted to investigate the severity level (SL) of wheat stripe rust. Firstly, five symmetrical points were selected within each quadrat. Then, two wheat plants were randomly selected at each point to investigate their disease severity. Disease severity was quantified referring to the “Technical Specifications for Wheat Stripe Rust Forecasting” national standard (GB/T15795-2011) [21].
In addition, the chlorophyll content (Cab) and the leaf area index (LAI) were measured as supporting data. Cab was measured using Dualex, a new multi-function blade-measuring instrument developed by Force-A, France. The LAI was obtained through digital hemispherical photography measurements [22]. All observed targets and timings corresponded to the disease experiment.
2.2. Simulation Data
2.2.1. Fluspect Model
We used the Fluspect-B model to simulate absorption spectra and analyze the impact of vegetation reabsorption effects on the shape of SIF spectra. The Fluspect-B model is based on the PROSPECT model and incorporates the concept of dense leaf layers [23]. Under incident light, the Fluspect-B model simulates leaf spectra by inputting various parameters, including chlorophyll and carotenoid content, leaf water content, dry matter and senescent matter (brown pigments) content, leaf structure parameters, and fluorescence quantum yield. The input parameters are presented in the Table 1 below.

Table 1.
Main input parameters for Fluspect-B simulations.
2.2.2. SCOPE 2.0 Model
SCOPE (Soil-Canopy-Observation of Photosynthesis and Energy) is a widely used radiative transfer model that simulates the interaction between solar radiation and vegetation canopies [24]. Based on the SCOPE 2.0 model, we simulated datasets for the wheat canopy, including the SIF escape rate (fesc), the chlorophyll ab absorption of photosynthetically active radiation (aPARchl), photosynthetic active radiation (PAR), the fraction of absorbed photosynthetically active radiation by chlorophyll (fPARchl), canopy net photosynthesis (CNP), electron transport rate (ETR), and nonphotochemical quenching (NPQ). PAR is calculated by integrating solar irradiance from 400 to 700 nm, while calculating fPARchl follows a specific methodology. Referring to the results of [25], and considering the measured chlorophyll content under different stripe rust severities, the Cab parameter input range shown in Table 2 was set. The parameter ranges for dry matter content (Cdm) and equivalent water thickness (Cw) were determined based on parameters set by [25]. Changing the thickness of the leaf blades (N) affects internal radiation transmission within the leaves. Under stress conditions, the proportion of the functional reaction center of the vegetation (qLs) and the maximum carboxylation rate (Vcmax) are altered [26]. In the SCOPE model, these quantity changes can be achieved by adjusting the qLs and stress factor parameters. Based on previous research results, the wheat leaf inclination angle was set as spherical [25]. By changing the LAI to express differences in the canopy’s geometric structure, we could set the solar zenith angle (SZA) according to the solar position from 10:00 to 16:00 in the experimental area. The observation zenith angle (VZA) was set perpendicular to the canopy direction. The SCOPE model results were validated using the measured data ranges.
Table 2.
Main input parameters for SCOPE simulations.
2.3. Canopy Spectral Processing
2.3.1. Full-Spectrum SIF Spectral Retrieval
Full-spectrum SIF spectral retrieval uses the SIF full-spectrum spectral fitting method (F-SFM) proposed in [27]. This method models the full-spectrum reflectance and SIF within the 650–800 nm region using PCA, based on a training dataset simulated by the SCOPE model. The weighting coefficients of the principal components are then estimated using the least-squares fitting method.
The total upwelling radiance at the top of the canopy can be expressed as follows [27]:
where R is the canopy reflectance, and E is the downwelling irradiance.
PCA was used to extract features from the SCOPE simulation data and accurately estimate the reflectance and SIF spectrum:
where X is the matrix representing the training dataset, Φ is the matrix representing the full set of reflectance PCs (or SIF), and W is a matrix whose columns are the eigenvectors of XTX.
The reflectance and SIF can then be reconstructed using a linear combination of the first few PCs in Φ:
where and are the reconstructed spectra of the reflectance and SIF, respectively; and are the i-th PC of the reflectance and SIF, respectively; ki and ji are the weight coefficients of the i-th PC; and nr and nF are the numbers of reflectance and SIF PCs that were used, respectively. The training set used by [27] for their F-SFM algorithm was derived from data simulated by the SCOPE model, which inherently cannot directly simulate spectral data under stripe rust stress. As a result, Liu et al.‘s findings could not be directly applied to extracting full-band SIF spectra in this study. Given that the stress factor can describe variation in Vcmax in vegetation under stress and that qLs can characterize the impact of stress on the photosynthetic reaction centers of vegetation, we incorporated variations in both stress factors and qLs into our SCOPE simulations. The resulting simulated data were then used as the training set for the F-SFM algorithm. This modification to the training set enabled us to calculate full-spectrum SIF under different disease severity levels.
2.3.2. Full-Spectrum SIF Spectral Preprocessing
The instantaneous SIF intensity signal of the canopy detected by the QE Pro spectrometer is susceptible to incident solar radiation. Normalizing SIF using PAR can reduce the influence of incident radiation intensity and angle on the SIF intensity of the canopy [28,29]:
where SIF is the normalized SIF at the λ wavelength, SIFλ is the SIF at the λ wavelength, and PAR is photosynthetically active radiation measured by solar irradiance integration.
2.4. The Influence of Canopy on the Shape of SIF Spectrum
The impact of the vegetation canopy on SIFB encompasses both scattering and absorption, with chlorophyll reabsorption being particularly severe [16,25]. Assuming there is a non-reflective surface beneath the canopy (the “black soil” condition), the SIF from the leaves to the canopy can be expressed as follows:
where is the wavelength, SIFcanopy is the canopy-level SIF; SIFleaf is the leaf-level SIF; and are the scattering rate and absorption rate, respectively; and represents the probability of SIF escaping from the leaves to the canopy. For the entire SIFB emission peak, the canopy’s effect on SIF varies across different bands, changing the SIF shape from the leaf level to the canopy level. Extracting the SIF emission peak in the red band is crucial. In taking the minimum value between the two fluorescence peaks (near 700 nm) as the dividing point, the shorter wavelength SIF value greater than this point is designated as the left peak (Figure 2).
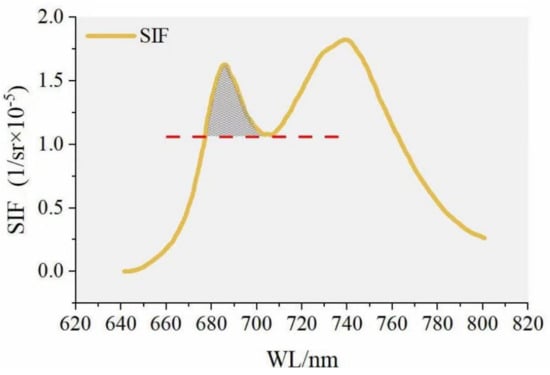
Figure 2.
Emission peak range: the shaded area is the SIFB emission peak.
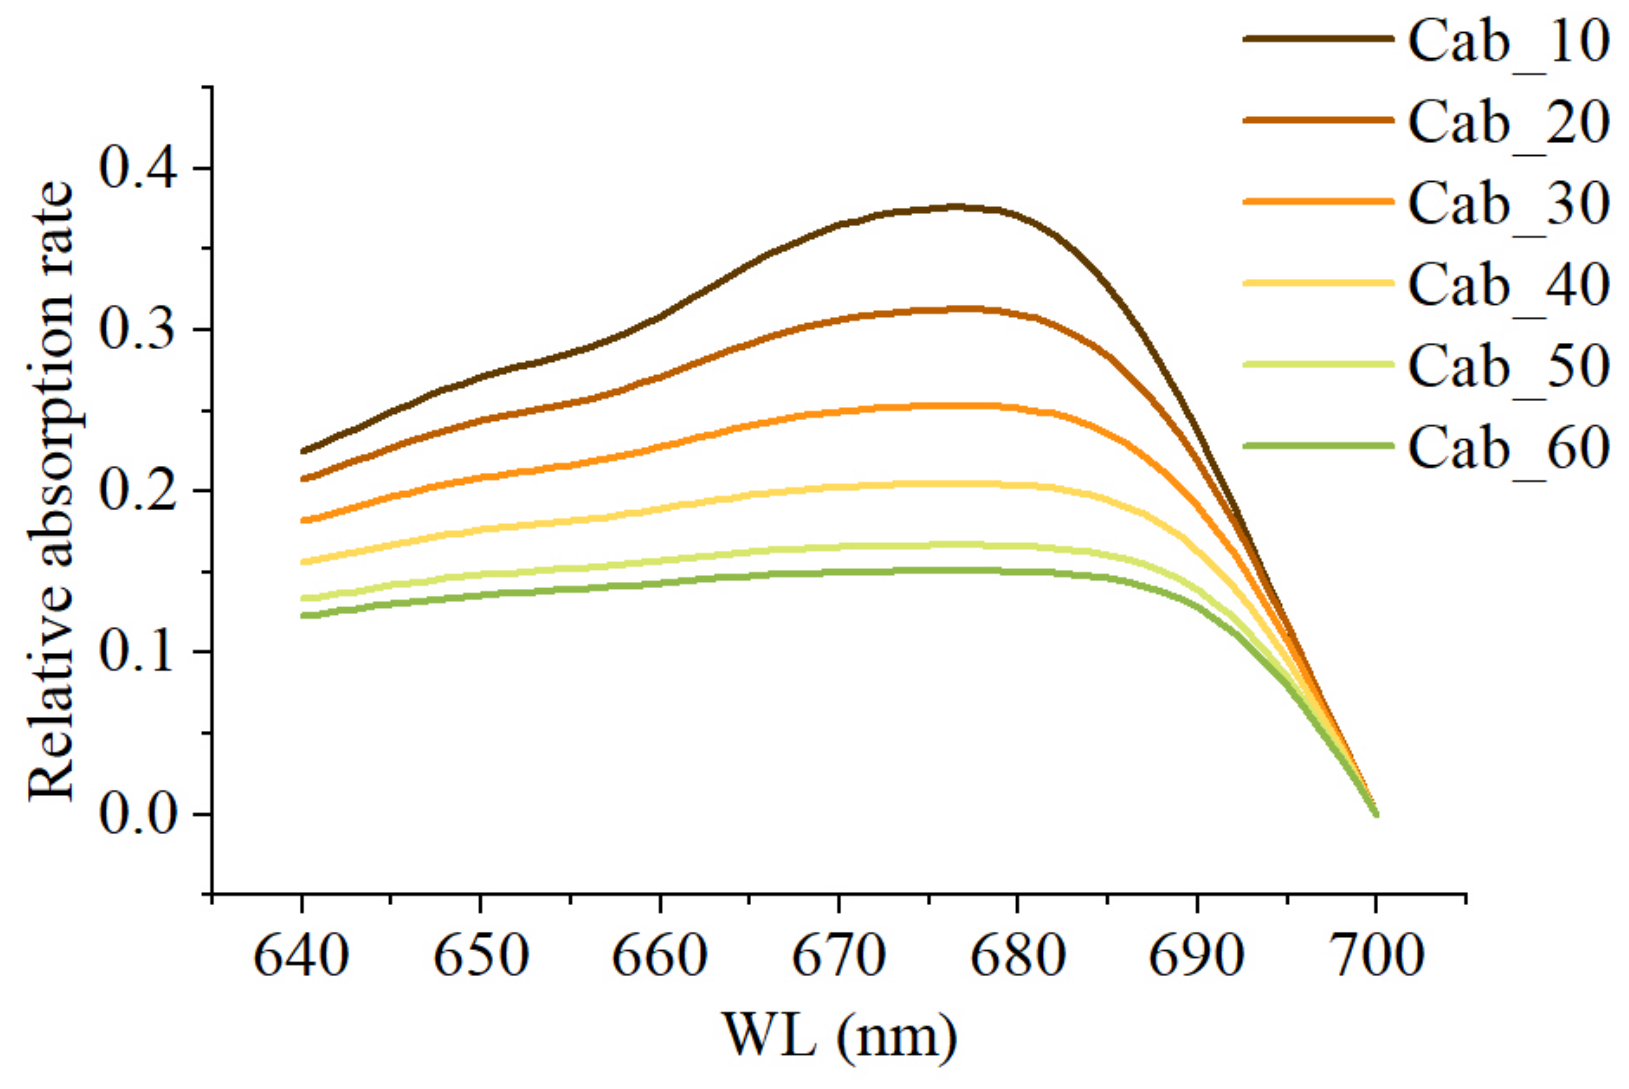
Vegetation exhibits high absorption rates for photons in the 600–700 nm range, peaking around 680 nm, with lower absorption rates closer to 640 nm and 700 nm [30]. The chlorophyll content in vegetation is closely linked to chlorophyll reabsorption, and as the chlorophyll content increases, the rate of decrease in relative absorption at 680 nm is higher than in other bands [30] (Figure 3). This subsequently affects the shape of the SIF in the red spectrum within the canopy, necessitating the use of kurtosis to reflect the flatness of the curve. Kurtosis is defined as the standardized fourth-order central moment of a sample, essentially expressing the fourth-order statistic of the data distribution [31]. When a large amount of data are distributed closely around the mean, the curve’s distribution is relatively narrow, resulting in positive kurtosis. Conversely, when few data are distributed around the mean, the curve’s distribution is relatively wide, resulting in negative kurtosis.
where K is kurtosis; n is the number of bands, which represents the emission peak width; xi is the fluorescence value of the i-th band; and μ and σ are the mean and standard deviation of the data, respectively.

Figure 3.
Relative absorption rates at different chlorophyll contents.
In summary, the higher absorption of SIFB by the canopy results in a smaller K for the red canopy SIF curve. The following relationship between fesc (680) and K can be obtained:
Reflectance can effectively describe the directional reflection information of vegetation at a specific band (i.e., scattering in multiple directions). However, vegetation has low scattering properties in SIFB, meaning that canopy scattering has minimal impact on the shape of the SIFB spectrum [25]. Notably, reflectivity increases near 700 nm, which could result in a more pronounced SIFB canopy signature shape. In this study, we can consider the scattering within the 640–690 nm range a relatively constant factor, namely,
The width of the red-band SIF emission peak is not constant, and it becomes relatively narrow as the emission peak becomes sharper. Therefore, we introduce the emission peak width (n) as a factor and construct a pseudokurtosis metric. This metric compensates for the scattering effects in this spectral region and more accurately represents the SIF signature.
The fesc is the probability of fluorescence photons escaping from the photosystem level to the canopy level, negatively correlating with absorption and scattering. At this time, the relationship between the PKB and the red SIF escape rate (fesc680) can be approximately obtained:
2.5. Modification of SIFB
2.5.1. Photosynthetic Physiological Basis of PKB
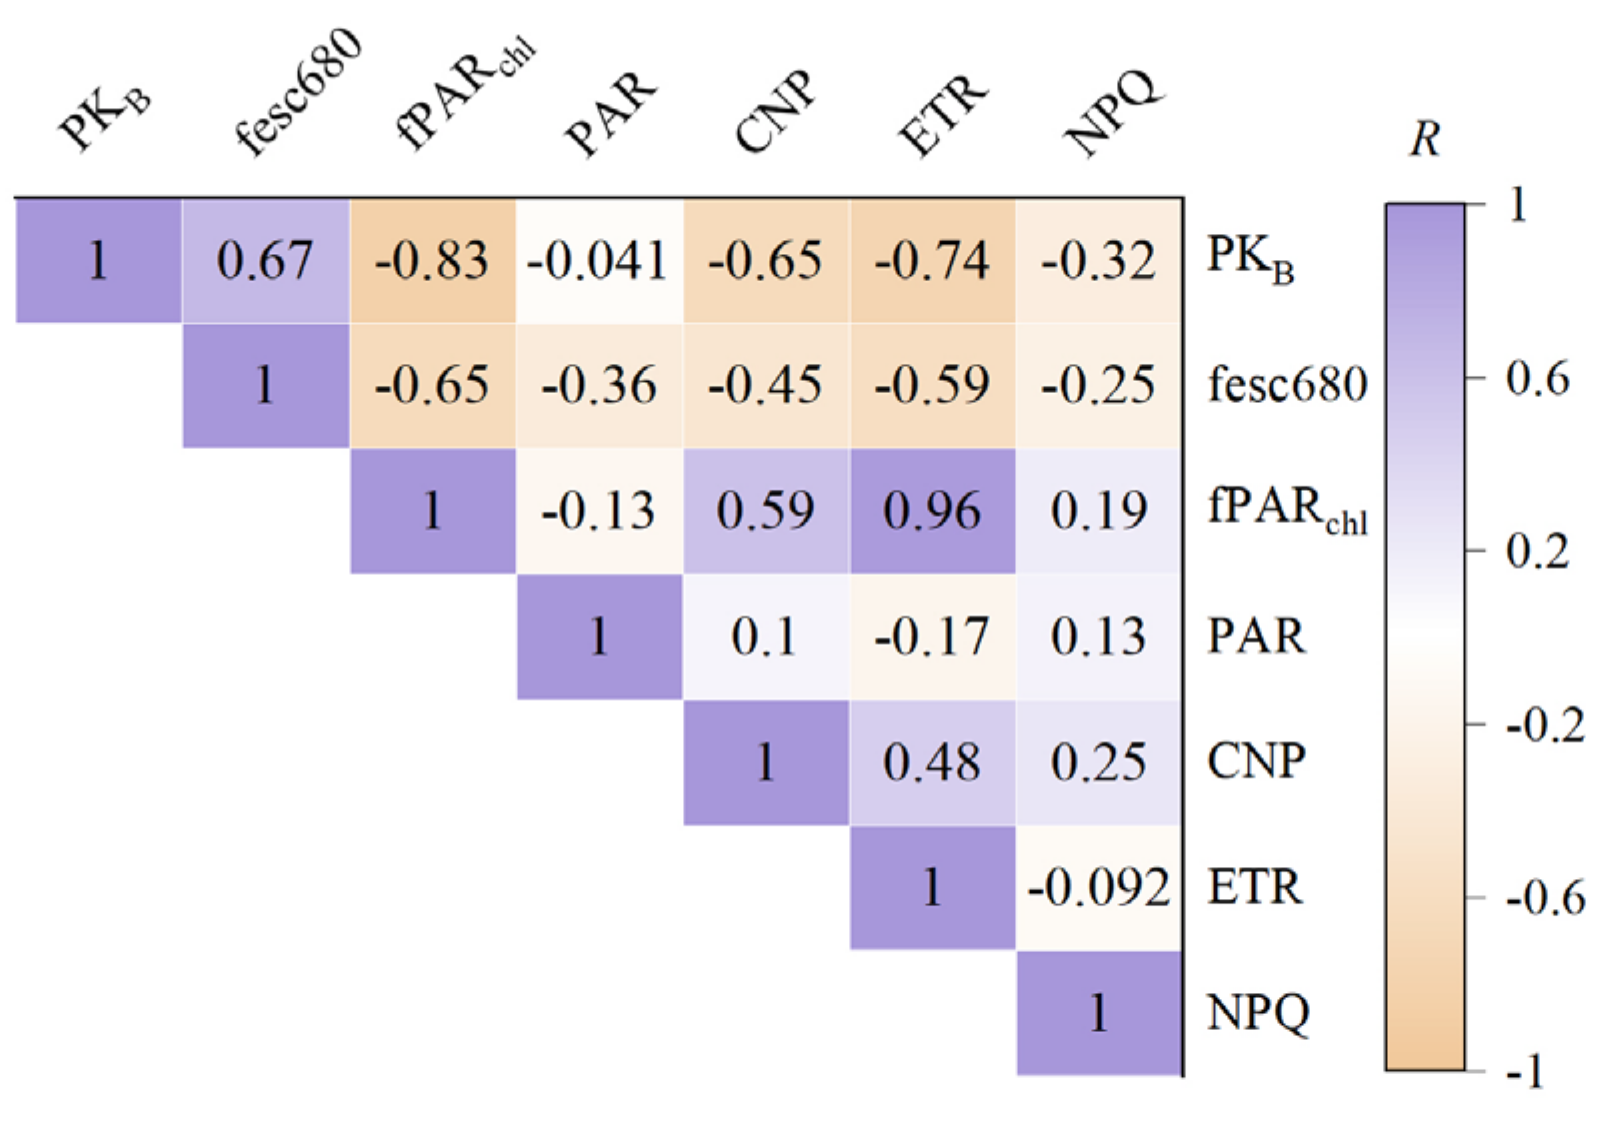
To quantitatively investigate the relationship between PKB and the photosynthetic physiological status of wheat, we employed the SCOPE model to simulate various parameters pertinent to photosynthesis, including PAR, fPARchl, CNP, ETR, and NPQ, as well as fesc680. Based on these simulations, we conducted a correlation analysis between PKB and the aforementioned characteristic parameters (Figure 4) to gain further insight into the physical significance of PKB.

Figure 4.
The correlation coefficient between PKB and photosynthetic parameters.
Figure 4 demonstrates a significant correlation (p < 0.001) between PKB and key photosynthetic process parameters, including the fraction of PAR absorbed by chlorophyll and the canopy structure parameter, fesc680. Notably, the correlation between PKB and fPARchl was the strongest, with a correlation coefficient of R = −0.83, closely followed by the correlation between PKB and the ETR at R = −0.74. These findings suggest that the shape feature parameter of PKB can effectively capture and characterize vegetation photosynthetic information. Additionally, the correlation between PKB and fesc680 yields a correlation coefficient of R = 0.67, consistent with the theoretical derivation presented in Section 2.4. In summary, PKB can simultaneously represent photosynthetic capacity (via fPARchl) and canopy structure (via fesc680), highlighting its potential as a comprehensive indicator of vegetation photosynthetic status.
2.5.2. Modifying SIFB by Means of PKB
Compared with the canopy SIF detected by a sensor, the fluorescence quantum yield (SIFy)—a parameter closely associated with the physiological status of plants—has been found to provide higher monitoring accuracy for detecting wheat stripe rust severity [10]. The relationship between SIF and SIFy can be mathematically expressed as follows [32]:
In practical applications, it is difficult to estimate the fesc680 of SIF in the red band under stress conditions [16].
PKB also has a good correlation with fPARchl when characterizing fesc680. Therefore, using PKB to modify SIFB can not only reduce the effect of canopy reabsorption and scattering on SIFB but also weaken the effect of fPARchl on SIFB. Based on this rationale, we propose modifying the canopy directionality SIFB detected by the sensor, leveraging the expression of fluorescence quantum yield to derive a modified SIFB (MSIFB):
2.5.3. Fusing MSIFB with Vegetation Indices (VIs)
To comprehensively assess the efficacy of MSIFB in monitoring wheat stripe rust severity, we conducted a detailed analysis of the correlation between MSIFB, MSIFB fused with vegetation indices (MSIFB-VIs), and wheat stripe rust severity. Furthermore, the remote sensing monitoring accuracy for wheat stripe rust was also evaluated.
The normalized difference vegetation index (NDVI) is a valuable tool for characterizing vegetation population biomass [9] and monitoring changes in canopy structure [25]. Widely employed in vegetation area extraction and crop physiological state monitoring, fusing NDVI with MSIFB (MSIFB-N) has the potential to mitigate the impact of canopy geometry to a certain extent, enhancing the accuracy of wheat stripe rust monitoring. The expression of this fusion is as follows:
Stripe rust infections significantly alter chlorophyll content in wheat mesophyll cells. Incorporating chlorophyll content parameters can further enhance the monitoring accuracy of SIFB for stripe rust [9]. The MERIS Terrestrial Chlorophyll Index (MTCI) is highly sensitive to chlorophyll content [33] and is frequently used as an index to estimate chlorophyll content. Fusing MTCI and MSIFB (MSIFB-M) can potentially mitigate the effects of chlorophyll reabsorption to some extent [9]. The fused expression is as follows:
Furthermore, we attempted to enhance the correlation between MSIFB and stripe rust severity after fusing the NDVI and MTCI indices. The resulting expression for the fused index is as follows:
3. Results
3.1. Performance Evaluation of PKB Modifying SIFB
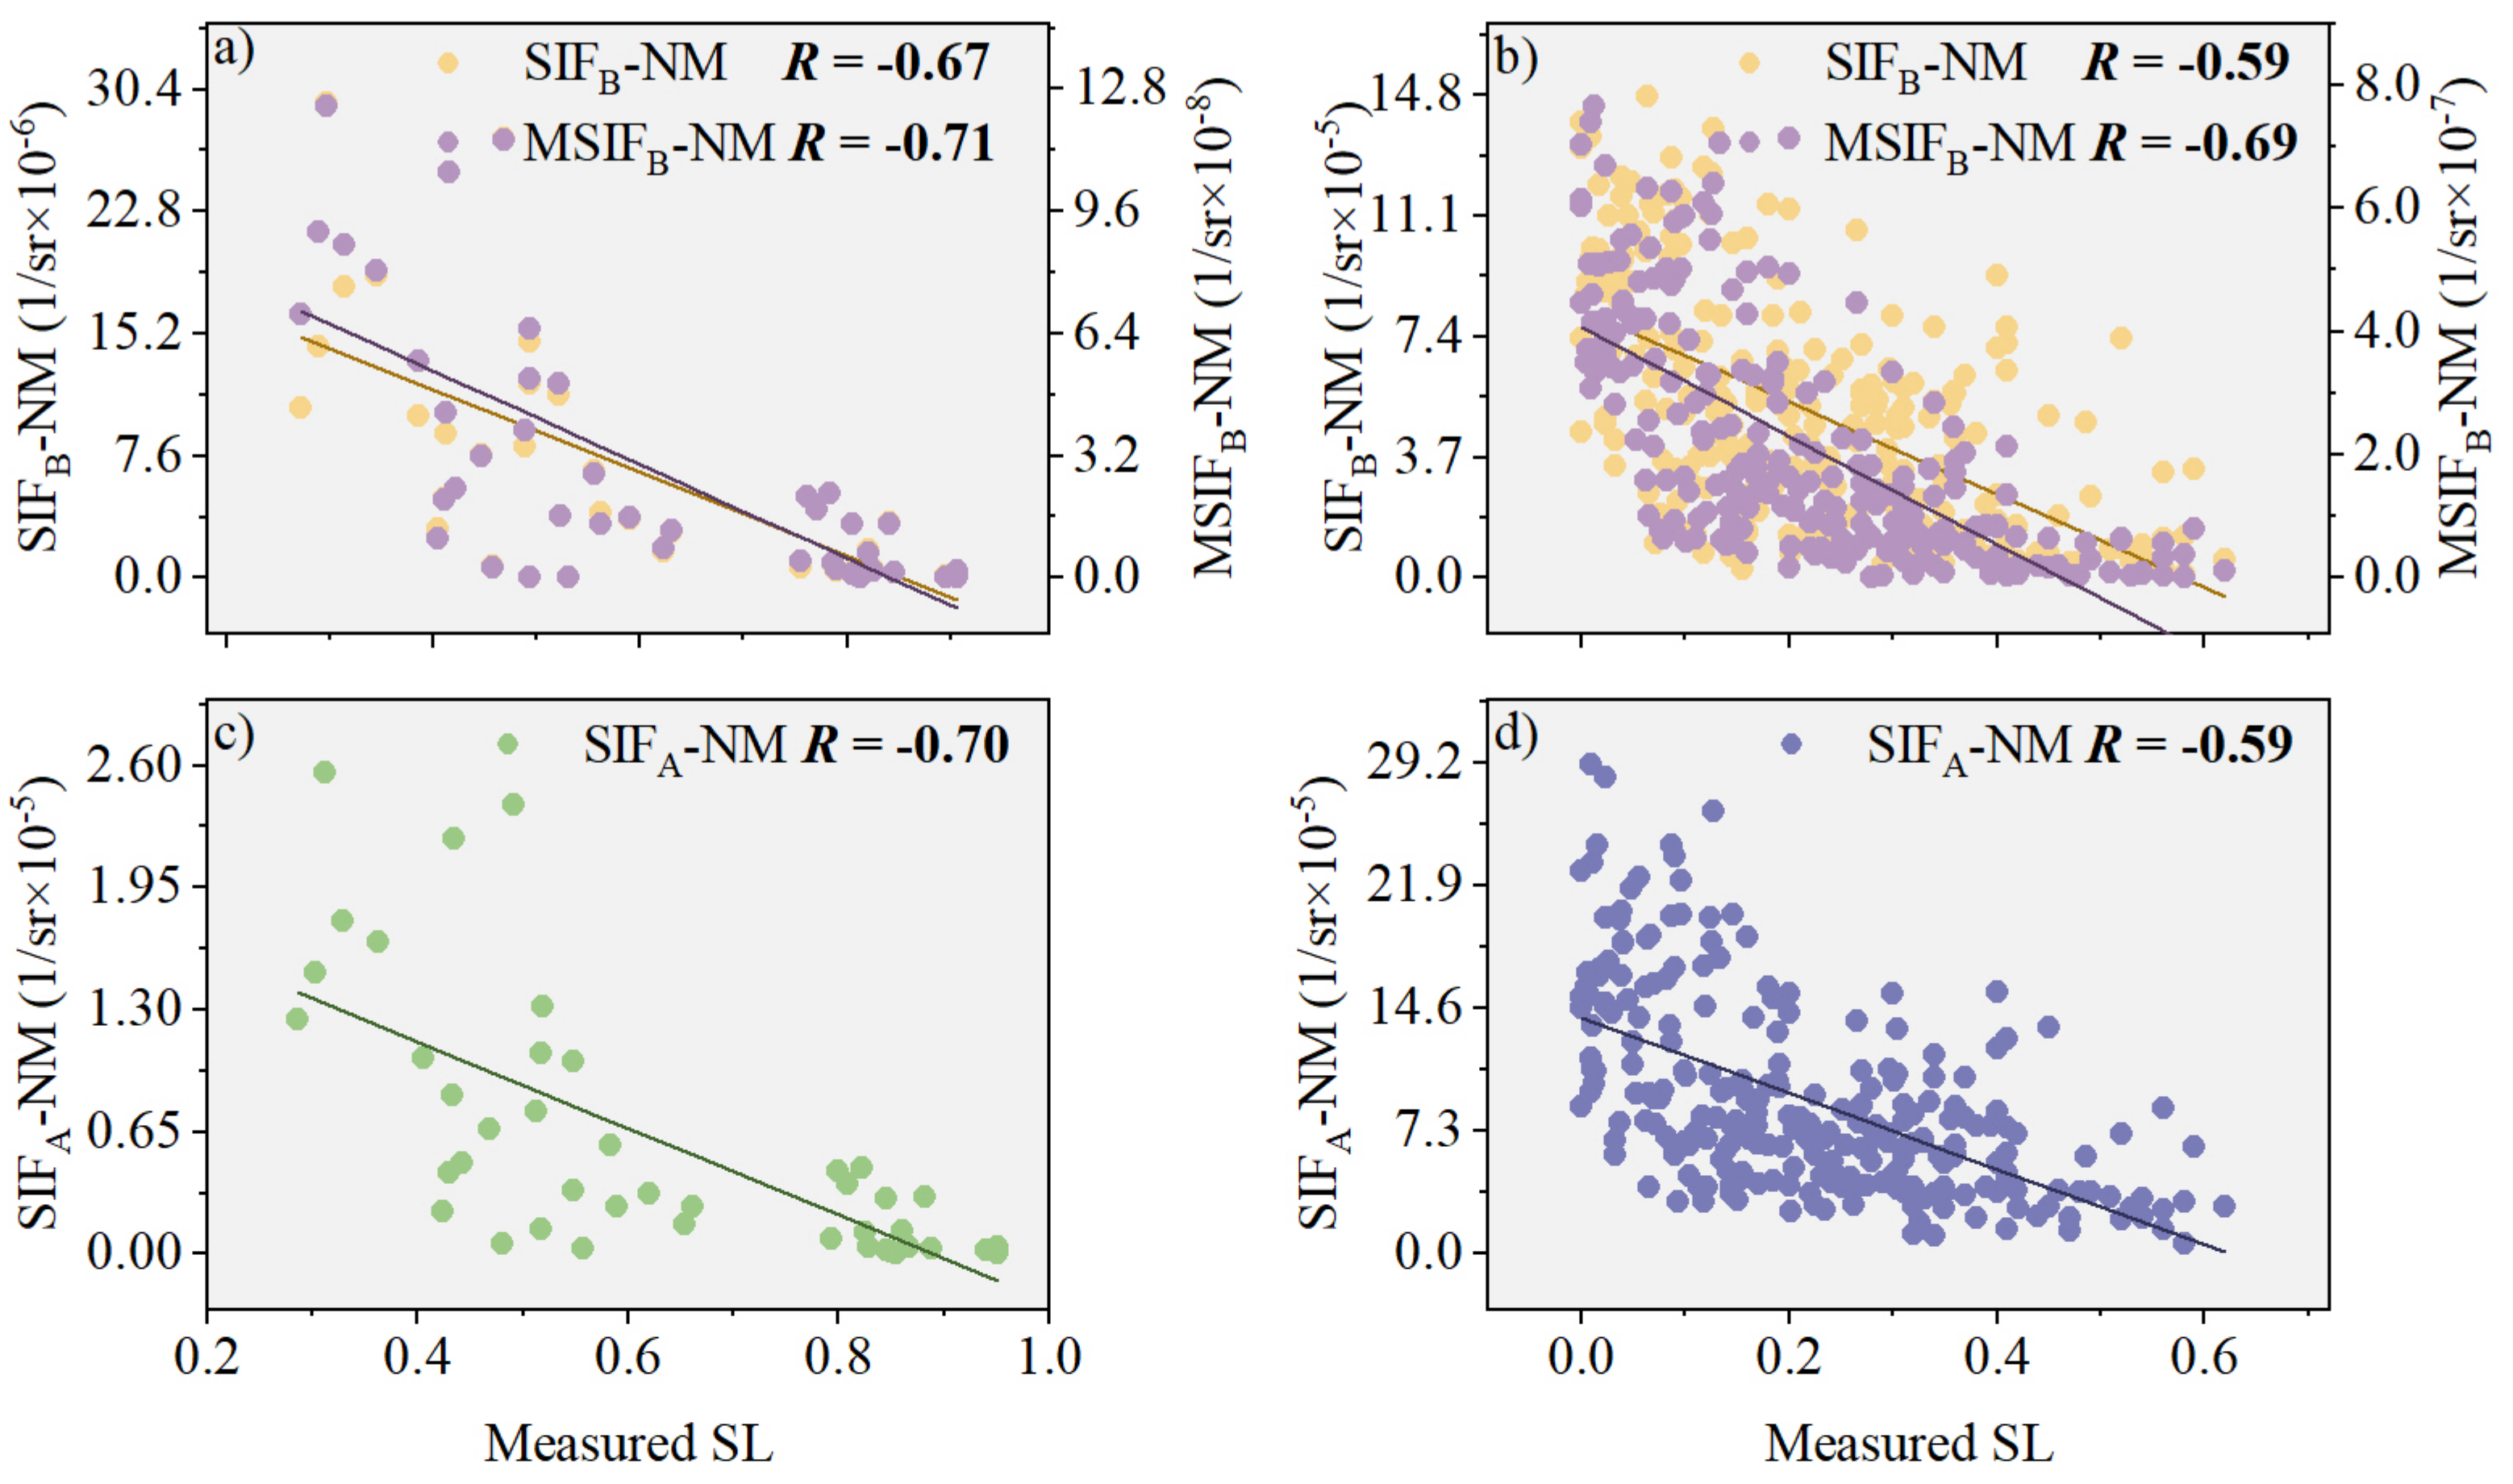
To assess the enhancement effect of the characteristic parameter (PKB) on canopy SIFB, we analyzed the correlations between SIFB and SL, as well as those between MSIFB and SL, using field-measured data (Figure 5). In the natural disease field experiment, our results indicate that the correlation between MSIFB and SL increased by 34.00% compared with SIFB (Figure 5b), which is closely tied to the correlation between PKB and another factor (assuming that “fesc” is a placeholder for another variable that was not explicitly defined in this context). In contrast to SIFA, the correlation coefficient (R) for MSIFB was notably higher, 36.73% above that of SIFA (Figure 5d). However, in the plot disease field experiment, we observed that the improved correlation between MSIFB and SL was not significant compared with SIFB and SIFA. Specifically, the correlation between MSIFB and SL increased by only 8.06% compared with SIFB (Figure 5a) and by a mere 1.52% compared with SIFA (Figure 5c).
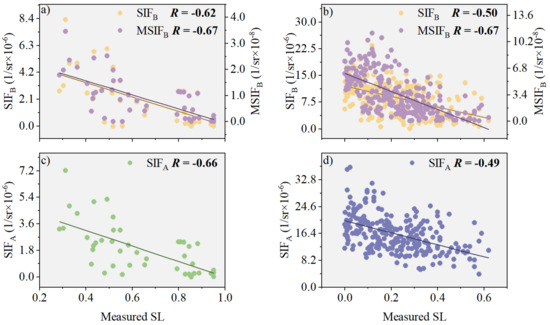
Figure 5.
The relationship between SIFB and SL before and after PKB modification is investigated in the following experiments: (a) Plot disease field experiment (n = 45); (b) Natural disease field experiment (n = 253). Additionally, the relationship between SIFA and SL is also examined in: (c) Plot disease field experiment (n = 45); (d) Natural disease field experiment (n = 253). Note: All scatter plots exhibit extremely significant correlation (p < 0.001), with the different color lines representing the regression lines.
3.2. Performance Evaluation of PKB Modifying SIFB-VIs
3.2.1. Performance Analysis of MSIFB-N in Monitoring Wheat Stripe Rust SL
Based on field measurements, we analyzed the correlations between SIFB-N and stripe rust severity and between MSIFB-N and SL (Figure 6). Figure 6 demonstrates that the correlation between MSIFB-N and SL improved to varying degrees in both the natural disease field experiment and the plot disease field experiment. Specifically, in the natural disease field experiment, the correlation between MSIFB-N and SL increased by 30.77% compared with SIFB-N (Figure 6a) and by 25.93% compared with SIFA-N fused with NDVI (Figure 6d). In the plot disease field experiment, the correlation between MSIFB-N and SL improved by 6.06% compared with SIFB-N (Figure 6b).
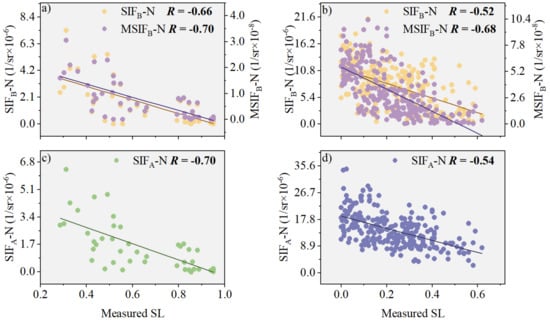
Figure 6.
The relationship between SIFB-N and SL, both before and after PKB modification, is investigated in the following experiments: (a) Plot disease field experiment (n = 45); (b) Natural disease field experiment (n = 253). Additionally, the relationship between SIFA-N and SL is also examined in separate experiments: (c) Plot disease field experiment (n = 45); (d) Natural disease field experiment (n = 253). The different color lines in the scatter plots denote the regression lines.
3.2.2. Performance Analysis of MSIFB-M in Monitoring Wheat Stripe Rust SL
Based on field measurements, we analyzed the correlations between SIFB-M and stripe rust severity and between MSIFB-M and SL (Figure 7). Figure 7 shows that in both the natural disease field experiment and the plot disease field experiment, there was a varying degree of improvement in the correlation between MSIFB-M and SL compared with SIFB-M. Specifically, in the natural disease field experiment focused on wheat stripe rust, the R between MSIFB-M and SL increased by 20.69% compared with SIFB-M and by 20.69% compared with SIFA-M fused with MTCI (Figure 7b,d). In the plot disease field experiment, the correlation between MSIFB-M and SL improved by 13.48% compared with SIFB-M (Figure 7a) and by a relatively modest 1.43% compared with SIFA-M (Figure 7c).
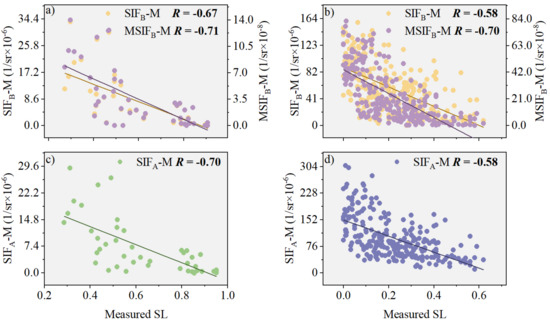
Figure 7.
The relationship between SIFB-M and SL, both before and after PKB modification, is investigated in the following experiments: (a) Plot disease field experiment (n = 45); (b) Natural disease field experiment (n = 253). Additionally, the relationship between SIFA-M and SL is also examined in: (c) Plot disease field experiment (n = 45); (d) Natural disease field experiment (n = 253). The different color lines in the scatter plots represent the regression lines for the respective relationships.
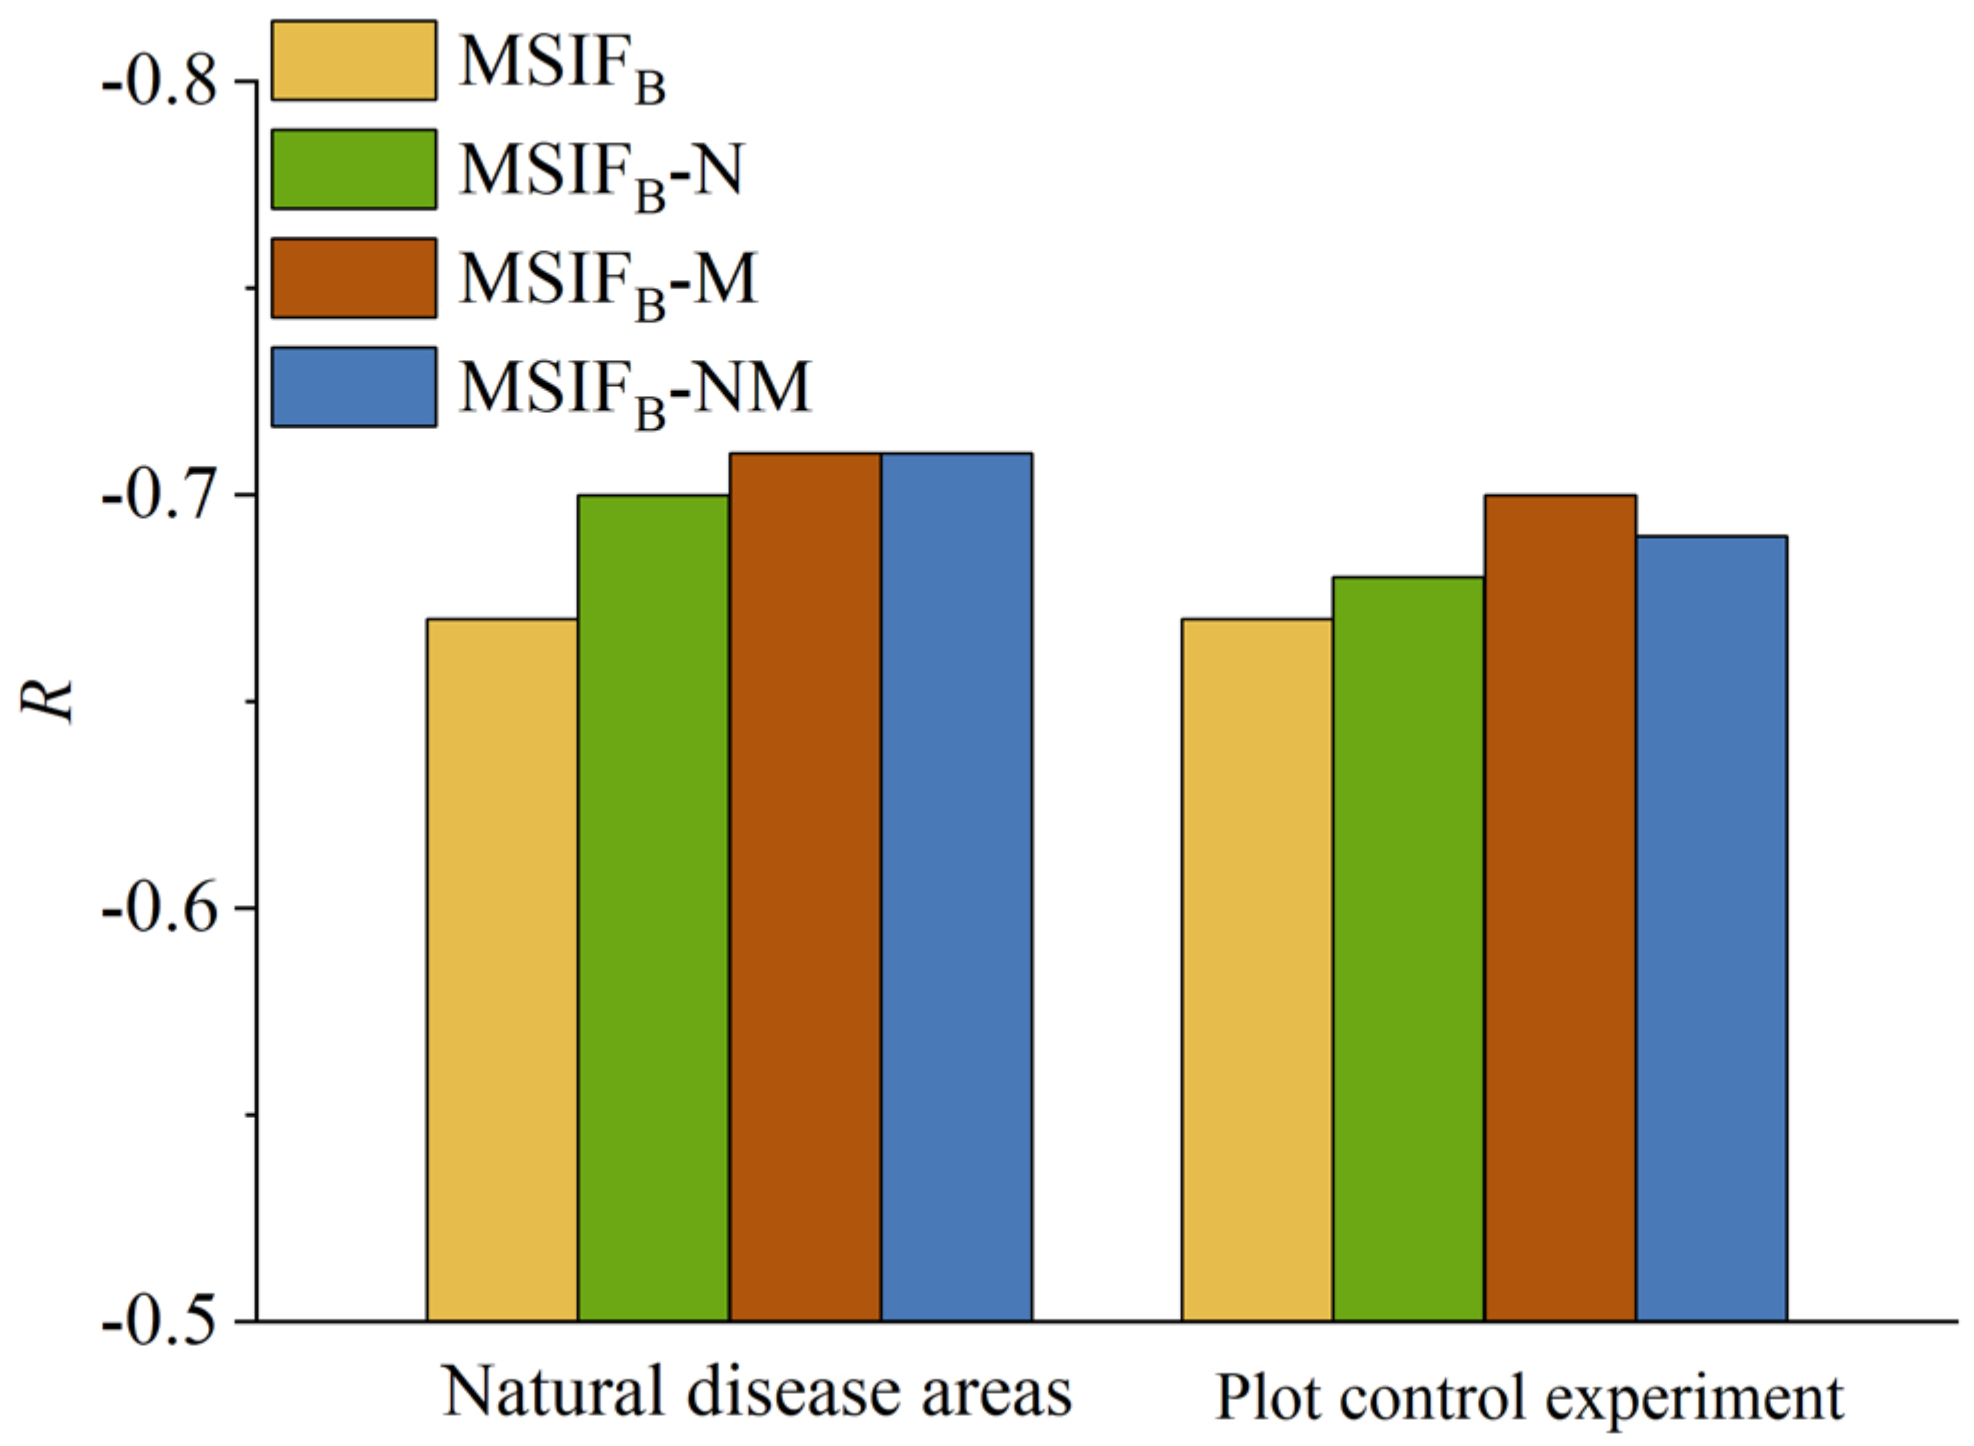
3.2.3. Performance Analysis of MSIFB-NM in the Monitoring of the Wheat Stripe Rust SL
PKB shows promising performance in enhancing the efficacy of SIFB-N and SIFB-M for monitoring stripe rust severity. We now delve further into improving the correlation between MSIFB and SL, specifically after fusing the NDVI and MTCI indices. Based on field-measured data, we separately analyzed the correlations of SIFB-NM and MSIFB-NM with SL (Figure 8). Figure 8 shows that in both the natural disease field experiment and the plot disease field experiment, there was a varying degree of improvement in the correlation between MSIFB-NM and SL compared with that for SIFB-NM. Specifically, in the natural disease field experiment, the correlation between MSIFB-NM and SL increased by 16.95% compared with those for both SIFB-NM and SIFA-NM (Figure 8b). In the plot disease field experiment, we observed that the correlation between MSIFB-NM and SL improved by 13.48% compared with that for SIFB-NM (Figure 8a) and by a more modest 1.43% compared with that for SIFA-NM (Figure 8c).
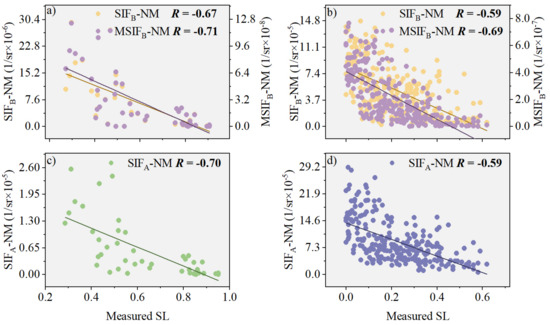
Figure 8.
The relationship between SIFB-NM and SL, before and after PKB modification, is explored in the following experiments: (a) Plot disease field experiment with a sample size of 45; (b) Natural disease field experiment with a sample size of 253. Additionally, the relationship between SIFA-NM and SL is also examined in: (c) Another plot disease field experiment with a sample size of 45; (d) A separate natural disease field experiment with a sample size of 253. The different color lines in the scatter plots indicate the regression lines for the corresponding relationships.
3.3. Model Evaluation of PKB for Improved Performance of SIFB
PKB can improve the correlation between SIFB and wheat stripe rust severity. To further assess whether MSIFB can enhance the accuracy of wheat stripe rust SL monitoring, we compared and analyzed changes in the performance of SIFB within the wheat stripe rust remote sensing monitoring model before and after applying PKB.
In the construction and accuracy evaluation of the wheat stripe rust SL model, 253 sample data points were used. These data were divided into a training group of 152 samples and a verification group of 101 samples, adhering to a ratio of 6:4. Subsequently, SIFB indices, MSIFB, and MSIFB-VIs were employed as independent variables to develop the SL estimation model. The performance of this model, as measured by determining the R and RMSE values, is presented in Table 3.
Table 3.
Evaluation of model accuracy.
Table 3 shows that using MSIFB or MSIFB-VIs as independent variables results in varying degrees of improvement in model accuracy compared with SIFB or SIFB-VIs. Specifically, the wheat stripe rust remote sensing monitoring model constructed with MSIFB as the independent variable increased by 21.27% in the R between the predicted and measured SL, accompanied by a 9.02% RMSE decrease compared with SIFB. When fused with NDVI, the model using MSIFB-N as the independent variable exhibited a 19.86% R increase and a 9.92% RMSE decrease compared with SIFB-N. Similarly, in the training sample set fused with MTCI, the model with MSIFB-M as the independent variable showed a 12.69% R increase and an 8.59% RMSE decrease compared with SIFB-M. Lastly, when fused with both NDVI and MTCI (NDVI*MTCI), the model using MSIFB-NM as the independent variable demonstrated an R increase of 11.73% and an RMSE decrease of 8.59% compared with SIFB-NM. There are varying degrees of improvement in model accuracy when using MSIFB or MSIFB-VIs as independent variables compared with unrevised SIFB or SIFB-VIs.
Using the remaining 101 data points from the modeling as verification samples, we evaluated the ability of PKB to improve SIFB in the wheat stripe rust SL monitoring model, and the wheat stripe rust SL prediction model constructed with the MSIFB method was tested (Figure 9). Figure 9 shows that PKB significantly enhances the accuracy and robustness of models based on SIFB and its fusion indices (SIFB-VIs) in the constructed testing set. Compared with SIFB, the model established with MSIFB as the independent variable shows a 66.67% R increase and a 20.30% RMSE decrease when predicting SL. In the testing set fused with NDVI, the model with MSIFB-N as the independent variable exhibits a 56.52% R increase and a 20.77% RMSE decrease compared with SIFB-N. Similarly, in the testing set fused with MTCI, the model using MSIFB-M as the independent variable demonstrates a 32.14% R increase and a 17.36% RMSE decrease compared with SIFB-M. Lastly, in the testing set fused with both NDVI and MTCI, the model employing MSIFB-NM as the independent variable shows a 29.82% R increase and a 16.53% RMSE decrease compared with SIFB-NM when predicting SL. Notably, the increased accuracy of the wheat stripe rust severity estimation model over SIFB-NM when using MSIFB-NM as the independent variable is the smallest compared with other MSIFB-VIs. This can be attributed to the fact that NDVI represents vegetation biomass, which is inherently linked to chlorophyll content; conversely, MTCI is a vegetation index specifically tailored to quantifying chlorophyll content. The combination of these two indices may result in information redundancy, contributing to the relatively modest enhancement in model accuracy.
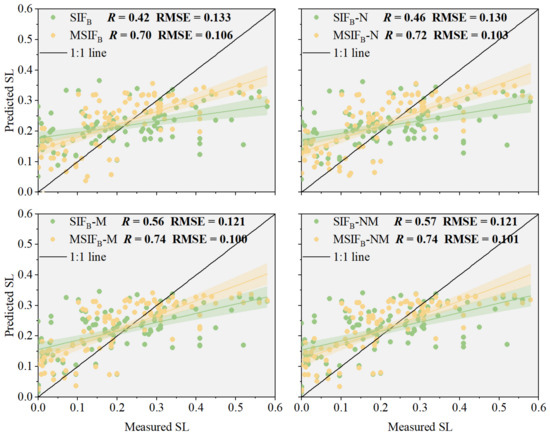
Figure 9.
Model accuracy verification. The different color lines denote the regression.
3.4. Changes in SL, SIFB, MSIFB, and Cab with Growth Period
Clarifying the influence of the wheat growth period on SIFB is crucial for tracking the degree of disease stress using MSIFB [34]. Figure 10 illustrates the changes in SIFB (Figure 10b), MSIFB (Figure 10c), and Cab (Figure 10d) under both healthy (Figure 10a) and diseased conditions from the heading to filling stages. As the wheat plant develops, the specific leaf area increases, and the rate of increase becomes more pronounced (Figure 10a). Under healthy conditions, the SIFB of wheat generally increases with development, whereas the SIFB of wheat affected by stripe rust remains relatively unchanged throughout the growth period (Figure 10b). Similarly, the Cab of healthy wheat modestly increases over time, whereas the Cab of stripe rust-infected wheat exhibits an insignificant decrease overall (Figure 10d). In contrast to SIFB and Cab, MSIFB does not significantly vary with wheat development under healthy conditions, and under the influence of stripe rust, it further decreases with growth (Figure 10c). This suggests that the physiological changes in vegetation associated with the growth period are not readily reflected in MSIFB, making it a potentially useful indicator for distinguishing between healthy and disease-stressed wheat plants.
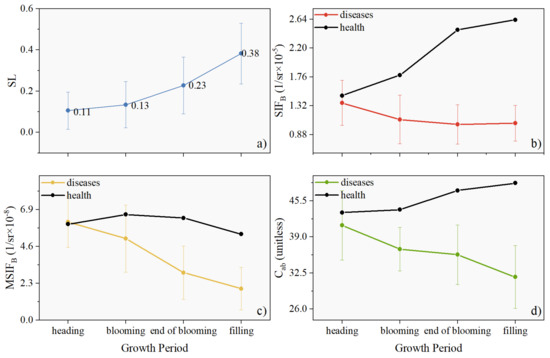
Figure 10.
Mean and standard deviation plots showing the growth dynamic of SL (a), SIFB (b), MSIFB (c), and Cab (d) for winter wheat.
4. Discussion
4.1. The Accuracy of F-SFM in Calculating PKB
The accuracy of the modified SIFB based on PKB significantly relies on the precision of extracting full-band SIF values. The F-SFM algorithm has demonstrated exceptional retrieval accuracy within the 650–770 nm range, which encompasses the peak emission band of the red spectrum [27,35]. In the presence of atmospheric effects, the F-SFM algorithm continues to outperform other bands within this spectral range [35]. When operating under conditions with a high signal-to-noise ratio (SNR) of 1000:1 and a spectral resolution (SR) of 0.30 nm, the F-SFM algorithm typically exhibits a low root mean square error, which is sufficient for instruments like the QE-Pro spectrometer [27]. Additionally, except for a slightly decreased accuracy at a VZA of 25°, the F-SFM algorithm maintains a high retrieval accuracy across various VZAs, making it suitable for standard remote sensing observations. However, the overall full-spectrum retrieval accuracy of SIF is contingent upon the representativeness of the training dataset used. Consequently, we modified the training set for the F-SFM algorithm to better suit the retrieval of SIF under stress conditions. In general, this algorithm is well suited for our study. Furthermore, recent advancements in full-spectrum SIF inversion algorithms [35,36] have laid a foundation for the high-precision extraction of PKB, further enhancing the potential of this research approach.
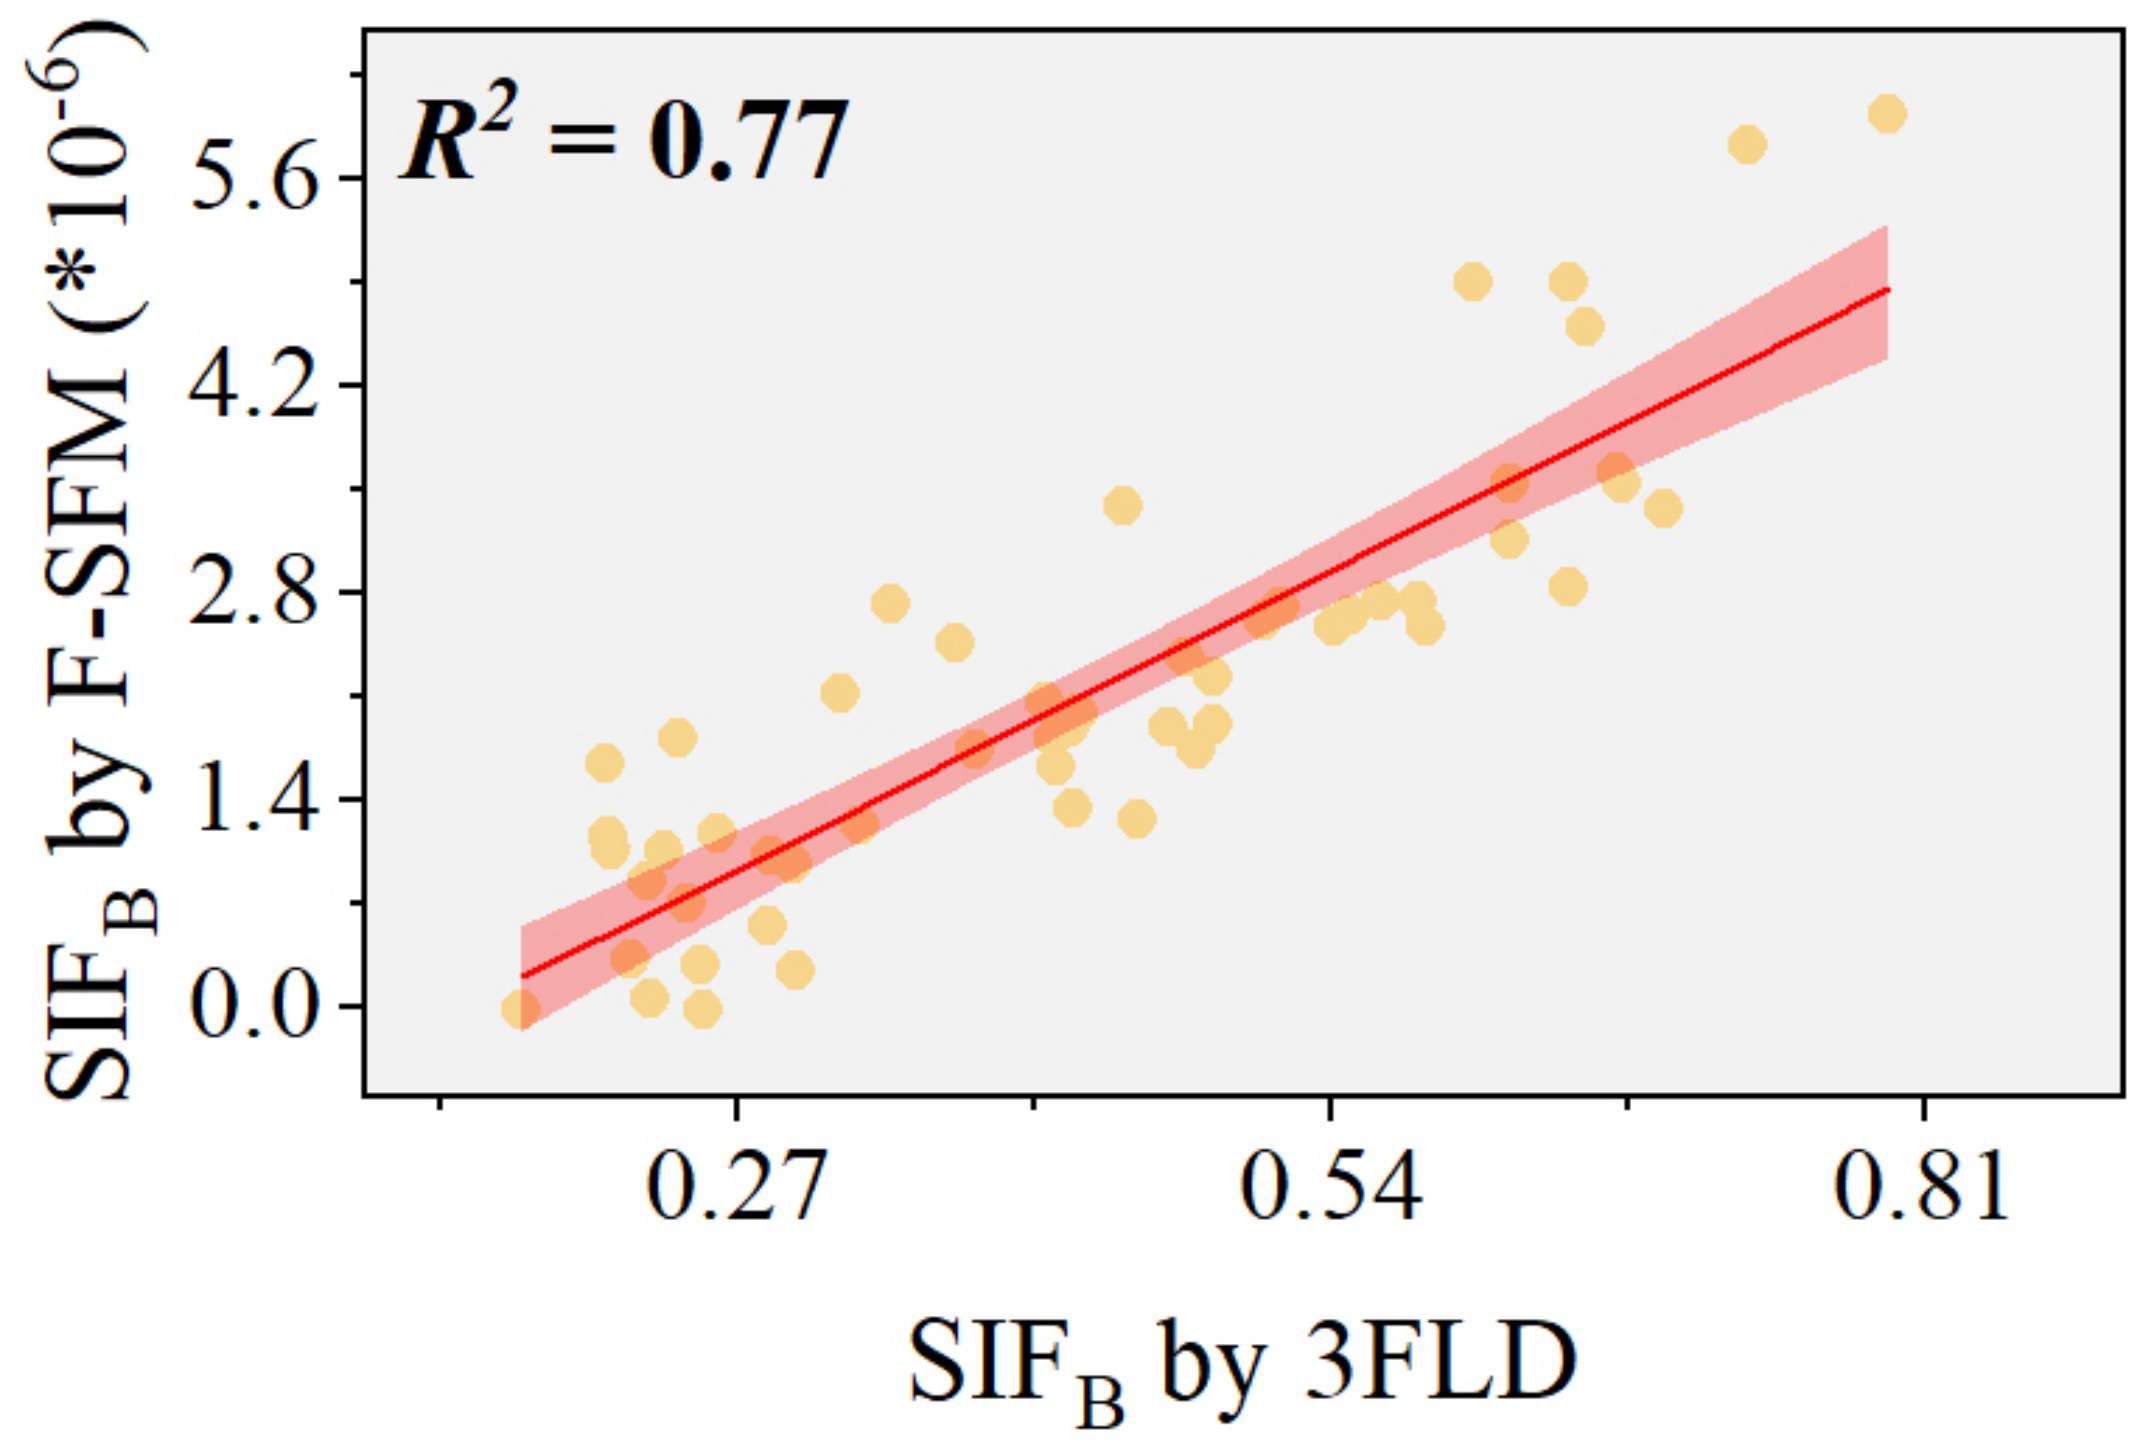
Research has shown that the 3FLD algorithm can effectively retrieve SIFB measured by the QE-pro spectrometer [27]. To further validate the accuracy of the F-SFM algorithm after refining its training set, we conducted an analysis using experimental data from controlled wheat rust plots. We employed red SIF retrieved by the 3FLD algorithm as a benchmark reference (Figure 11). We found an R2 value of 0.77 between the SIFB values obtained by the F-SFM algorithm and those from the 3FLD algorithm, indicating a robust correlation and confirming the precision of the adjusted F-SFM algorithm in extracting SIFB from experimental data.

Figure 11.
Accuracy of the F-SFM algorithm: The red line denotes the regression line, with the accompanying shaded area representing the 95% confidence interval around the regression estimate.
4.2. Physiological Mechanism of MSIFB Improving Remote Sensing Monitoring of Wheat Stripe Rust
The experimental data show that PKB, as an improved canopy SIFB parameter, can effectively improve the correlation between SIFB and SL and the estimation accuracy of wheat stripe rust. The observed SIF can be divided into three influencing factors: absorbed PAR (aPAR), fesc, and SIFy (Equation (17)). Stripe rust mainly affects the biochemical components of vegetation, causing changes in SIFy, and it is thus more closely related to SIFy. PKB can simultaneously weaken the effects of canopy reabsorption and scattering on SIFB, characterizing SL to a greater extent.
As a source of energy in photochemical reactions, aPARchl has a strong effect on SIFB. Studies have shown that the effective light use efficiency of canopy fluorescence (LUEf) can more accurately capture the dynamic response of vegetation under stress conditions [37], explaining both the fluorescence quantum yield and proportion of emitted photons that escape from the canopy [17]. LUEf is defined as
The analysis in Section 3.2 showed that the relationship between fPARchl and PKB can be obtained as follows:
The results of [28] showed that fPARchl can be expressed as a linear function of fPAR:
Therefore, PKB has an approximate relationship with fPAR:
When using PKB to improve SIFB, MSIFB is similar to LUEf, which can more accurately capture the dynamic response of vegetation under stress conditions [37].
Fluorescence emission intensity is jointly determined by PSI and PSII. PSII is the photoreaction stage, absorbing light energy to split water and generate energy, which is subsequently utilized by PSI for the dark reaction. Notably, the fluorescence emitted by PSII is usually the dominant signal [25], with an emission wavelength range of 640 nm to 800 nm. By contrast, the fluorescence energy emitted by PSI is lower, and its emission is primarily concentrated at 700 nm to 750 nm [38]. Therefore, changes in SIFB can be attributed to PSII alone. In other words, only the fluorescence of PSII varies with photochemical changes [13]. The strong correlation between PKB and fesc680 brings MSIFB closer to the PS-level SIF. This allows the SIF emitted by PSII to be better expressed, which is more closely associated with photochemical changes and can more accurately reflect the SL.
The above analyses indicate that PKB, an indicator highly correlated with fPARchl and fesc680, can simultaneously reduce the impact of canopy radiative transfer and fPARchl on SIFB, resulting in MSIFB being closer to SIFy.
4.3. Analysis of the Correlation between MSIFB and the SL Improved by VIs
VIs can effectively complement the incomplete weakening of canopy structure and chlorophyll reabsorption caused by MSIFB (Figure 12). Therefore, incorporating NDVI—which sensitively reflects changes in canopy structure—and the MTCI—closely related to chlorophyll content [9,25]—with MSIFB can further mitigate the impact of the canopy structure and chlorophyll reabsorption on SIFB. In our natural disease field experiment on wheat stripe rust disease, adding VIs improved the correlation between MSIFB and SL to some extent (Figure 7). The MTCI significantly enhanced the correlation between MSIFB and SL. The R-value between MSIFB-M and SL increased by 4.48% compared with MSIFB alone, indicating that the MTCI can better complement the incomplete effect of PKB in mitigating the canopy chlorophyll reabsorption on SIFB. However, compared with the individual MTCI, the combination of NDVI and MTCI showed a lower correlation enhancement between MSIFB and SL because both NDVI and MTCI can represent chlorophyll content to a certain extent. They may provide similar or overlapping information and introduce errors. These results indirectly demonstrate that the primary factor influencing SIFB is the chlorophyll reabsorption effect of vegetation.

Figure 12.
VI compensation for MSIFB.
4.4. Effect of Growth Period
If not prevented and controlled, rust disease severity will worsen with the development of wheat [39], as evident in Figure 10a. In healthy wheat, Cab, SIFB, and MSIFB exhibit similar changes alongside wheat development (Figure 10b–d), consistent with temporal changes in chlorophyll content and aPAR observed in numerous studies [40,41]. However, under rust stress, the consistency of SIFB changes that come with wheat development is disrupted (Figure 10b,d), attributable to the rust pathogen altering the open ratio of PSII reaction centers. Reactive oxygen species (ROS) play a pivotal role in regulating plant immune defense [42]. Low ROS concentrations can activate immune-related gene expression [43], whereas high ROS concentrations can inactivate pathogens [44]. Producing ROS decreases the expression of genes related to photosynthesis [45], explaining the reduction in Cab observed under rust infection.
When infected by stripe rust, MSIFB changes more regularly with the growth period under the influence of PKB, showing an opposite trend from SL and the same trend as Cab (Figure 10b–d). Therefore, PKB can eliminate the growth period effects on SIFB in wheat stripe rust monitoring.
Our results indicate that the PKB’s performance in modifying SIFB varied across field experiments. Specifically, PKB exhibited higher performance in natural disease field experiments than in plot disease field experiments. The measurement times for the plot disease field experiment were 15, 18, 24, and 30 May 2018, when wheat was in the filling stage. However, the measurement times for the natural disease field experiment were 16, 17, 28, 29, and 30 April and 12 and 13 May 2021, covering the wheat heading, blooming, and filling stages. The canopy structure of crops changes with their development [46], and there are significant differences in the LAI at different growth stages (Figure 13). The natural disease field experiment encompassed more changes in canopy structure than the plot disease field experiment. Therefore, the ability of PKB to attenuate the effects of canopy reabsorption and scattering on SIFB is more pronounced in natural disease field experiments.
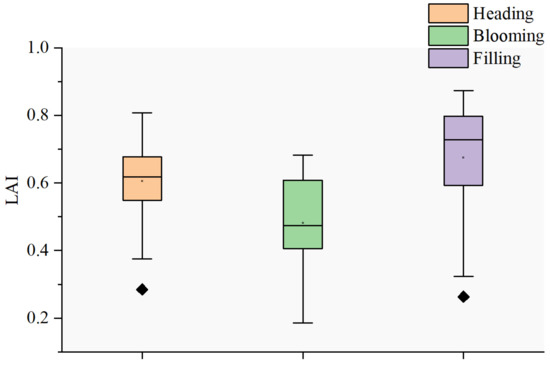
Figure 13.
A box plot displaying the median, 0th percentile (minimum), 25th percentile (first quartile), 75th percentile (third quartile), and 100th percentile (maximum) of the LAI across different growth periods. The outliers in the data are represented by individual points outside the whiskers.
4.5. Prospect
Because the stripe rust pathogen primarily affects the photosynthetic ability of wheat, the close relationship between SIFB and vegetation photosynthetic physiology, as well as canopy structure, renders it a valuable tool for detecting diseases that impact wheat photosynthesis. Therefore, the ability of PKB to improve the correlation between SIFB and SL is expected to apply to monitoring a wider range of disease stresses. Furthermore, based on the physiological mechanism analysis of PKB presented in this study, we anticipate that the ability of PKB to modify SIFB will further enhance the relationship between SIFB and GPP, although this hypothesis requires validation with actual data.
5. Conclusions
Based on the F-SFM full-spectrum SIF inversion algorithm, we extracted the shape feature parameter (PKB) associated with SIFB. By analyzing the correlation between PKB and parameters such as photosynthetic physiology and canopy structure, we could utilize PKB to refine SIFB. We evaluated the performance of the MSIFB in monitoring wheat stripe rust using field experiment data. The results show that, whether single-band SIFB or SIFB-VIs, PKB can improve the correlation between SIFB and SL and enhance the accuracy of wheat stripe rust remote sensing monitoring. Its effectiveness and robustness were validated through field experiments with natural disease conditions and plot-based disease field experiments.
Author Contributions
Conceptualization, X.J. and Q.Y.; data curation, X.J., Q.Y., B.L., K.D. and Y.X.; formal analysis, X.J., Q.Y. and B.C.; funding acquisition, X.J., Q.Y. and B.C.; investigation, X.J., Q.Y., B.C., B.L., K.D. and Y.X.; methodology, X.J. and Q.Y.; project administration, X.J. and Q.Y.; resources, X.J., Q.Y., B.L., K.D. and Y.X.; visualization, X.J., Q.Y. and K.D.; writing—original draft, X.J. and Q.Y.; writing—review and editing, X.J., Q.Y. and B.C. All authors have read and agreed to the published version of the manuscript.
Funding
This research was funded by the National Natural Science Foundation of China (42171394, 41961054).
Data Availability Statement
The datasets presented in this article are not readily available due to these datasets being measured together with other units; they are not suitable for public release for the time being.
Conflicts of Interest
The authors declare no conflict of interest.
References
- Soomro, S.; Samoo, M.S.; Jamali, A.R.; Channa, G.S. Assessing leaf rust resistance in Pakistani wheat landraces and its impact on grain yield. Plant Prot. 2024, 8, 269–274. [Google Scholar]
- Hussain, S.; Shah, S.J.A.; Leconte, M.; de Vallavieille-Pope, C. Assessment of genetic variability for wheat yellow rust resistance and Puccinia striiformis f. sp. tritici pathotypes from Pakistan. Plant Prot. 2024, 8, 239–255. [Google Scholar]
- Martinelli, F.; Scalenghe, R.; Davino, S.; Panno, S.; Scuderi, G.; Ruisi, P.; Villa, P.; Stroppiana, D.; Boschetti, M.; Goulart, L.R.; et al. Advanced methods of plant disease detection. A review. Agron. Sustain. Dev. 2015, 35, 1–25. [Google Scholar] [CrossRef]
- Guanter, L.; Zhang, Y.; Jung, M.; Joiner, J.; Voigt, M. Global and time-resolved monitoring of crop photosynthesis with chlorophyll fluorescence. Proc. Natl. Acad. Sci. USA 2014, 111, 1327–1333. [Google Scholar] [CrossRef]
- Ashourloo, D.; Mobasheri, M.; Huete, A. Developing Two Spectral Disease Indices for Detection of Wheat Leaf Rust (Pucciniatriticina). Remote Sens. 2014, 6, 4723–4740. [Google Scholar] [CrossRef]
- Zhang, Z.; Chen, J.M.; Guanter, L.; He, L.; Zhang, Y. From Canopy-Leaving to Total Canopy Far-Red Fluorescence Emission for Remote Sensing of Photosynthesis: First Results From TROPOMI. Geophys. Res. Lett. 2019, 46, 12030–12040. [Google Scholar] [CrossRef]
- Wieneke, S.; Ahrends, H.; Damm, A.; Pinto, F.; Stadler, A.; Rossini, M.R.U. Airborne based spectroscopy of red and far-red sun-induced chlorophyll fluorescence: Implications for improved estimates of gross primary productivity. Remote Sens. Environ. 2016, 184, 654–667. [Google Scholar] [CrossRef]
- Somkuti, P.; Bösch, H.; Feng, L.; Palmer, P.I.; Parker, R.J.; Quaife, T. A new space-borne perspective of crop productivity variations over the US Corn Belt. Agric. For. Meteorol. 2020, 281, 107826. [Google Scholar] [CrossRef]
- Duan, W.; Jing, X.; Liu, L. Monitoring of Wheat Stripe Rust Based on Integration of SIF and Reflectance Spectrum. Spectrosc. Spectr. Anal. 2022, 42, 859–865. [Google Scholar]
- Jing, X.; Li, B.; Ye, Q.; Zou, Q.; Yan, J.; Du, K. Integrate the Canopy SIF and Its Derived Structural and Physiological Components for Wheat Stripe Rust Stress Monitoring. Remote Sens. 2022, 14, 3427. [Google Scholar] [CrossRef]
- Knyazikhin, Y.; Schull, M.A.; Stenberg, P.; Moettus, M.; Rautiainen, M.; Yang, Y.; Marshak, A.; Carmona, P.L.; Kaufmann, R.K.; Lewis, P. Hyperspectral remote sensing of foliar nitrogen content. Proc. Natl. Acad. Sci. USA 2012, 110, E185–E192. [Google Scholar] [CrossRef] [PubMed]
- Joiner, J.; Yoshida, Y.; Guanter, L.; Middleton, E.M. New methods for the retrieval of chlorophyll red fluorescence from hyperspectral satellite instruments: Simulations and application to GOME-2 and SCIAMACHY. Atmos. Meas. Tech. 2016, 9, 3939–3967. [Google Scholar] [CrossRef]
- Porcar-Castell, A.; Tyystjrvi, E.; Atherton, J.; Tol, C.V.D.; Flexas, J.; Pfündel, E.E.; Moreno, J.; Frankenberg, C.; Berry, J.A. Linking chlorophyll a fluorescence to photosynthesis for remote sensing applications: Mechanisms and challenges. J. Exp. Bot. 2014, 65, 4065–4095. [Google Scholar] [CrossRef] [PubMed]
- Wittenberghe, S.V.; Alonso, L.; Verrelst, J.; Moreno, J.; Samson, R. Bidirectional sun-induced chlorophyll fluorescence emission is influenced by leaf structure and light scattering properties—A bottom-up approach. Remote Sens. Environ. 2015, 158, 169–179. [Google Scholar] [CrossRef]
- Huang, C. Study on Remote Sensing Inversion Method of Vegetation Chlorophyll Fluorescence Induced by Sunlight; University of Chinese Academy of Sciences: Beijing, China, 2013. [Google Scholar]
- Liu, X.; Liu, L.; Hu, J.; Guo, J.; Du, S. Improving the potential of red SIF for estimating GPP by downscaling from the canopy level to the photosystem level. Agric. For. Meteorol. 2020, 281, 107846. [Google Scholar] [CrossRef]
- Yang, P.; van der Tol, C. Linking canopy scattering of far-red sun-induced chlorophyll fluorescence with reflectance. Remote Sens. Environ. 2018, 209, 456–467. [Google Scholar] [CrossRef]
- Liu, Z.; Lu, X.; An, S.; Heskel, M.; Tang, J. Advantage of multi-band solar-induced chlorophyll fluorescence to derive canopy photosynthesis in a temperate forest. Agric. For. Meteorol. 2019, 279, 107691. [Google Scholar] [CrossRef]
- Ren, K.; Dong, Y.; Huang, W.; Guo, A.; Jing, X. Monitoring of winter wheat stripe rust by collaborating canopy SIF with wavelet energy coefficients. Comput. Electron. Agric. 2023, 215, 108366. [Google Scholar] [CrossRef]
- Du, K.; Jing, X.; Zeng, Y.; Ye, Q.; Li, B.; Huang, J. An Improved Approach to Monitoring Wheat Stripe Rust with Sun-Induced Chlorophyll Fluorescence. Remote Sens. 2023, 15, 693. [Google Scholar] [CrossRef]
- GB/T15795-2011; Technical Specifications for Forecasting Wheat Stripe Rust. General Administration of Quality Supervision, Inspection and Quarantine of the People’s Republic of China: Beijing, China; China National Standardization Management Committee: Beijing, China, 2011. [Google Scholar]
- Camacho, F.; Lacaze, R.; Weiss, M. GEOV1: LAI, FAPAR essential climate variables and FCOVER global time series capitalizing over existing products. Part 2: Validation and intercomparison with reference products. Remote Sens. Environ. 2013, 137, 310–329. [Google Scholar] [CrossRef]
- Vilfan, N.; Van der Tol, C.; Muller, O.; Rascher, U.; Verhoef, W. Fluspect-B: A model for leaf fluorescence, reflectance and transmittance spectra. Remote Sens. Environ. Interdiscip. J. 2016, 186, 596–615. [Google Scholar] [CrossRef]
- Vander Tol, C.; Verhoef, W.; Timmermans, J.; Verhoef, A.; Su, Z. An integrated model of soil-canopy spectral radiances, photosynthesis, fluorescence, temperature and energy balance. Biogeosciences 2009, 6, 3109–3129. [Google Scholar] [CrossRef]
- Liu, X.; Guanter, L.; Liu, L.; Damm, A.; Zbyněk, M.; Rascher, U.; Peng, D.; Du, S.; Gastellu-Etchegorry, J.P. Downscaling of solar-induced chlorophyll fluorescence from canopy level to photosystem level using a random forest model. Remote Sens. Environ. 2019, 231, 110772. [Google Scholar] [CrossRef]
- Song, X.; Zhou, G.; He, Q.; Zhou, H. Quantitative Response of Maize Vcmax25 to Persistent Drought Stress at Different Growth Stages. Water 2021, 13, 1971. [Google Scholar] [CrossRef]
- Liu, X.; Liu, L.; Zhang, S.; Zhou, X. New Spectral Fitting Method for Full-Spectrum Solar-Induced Chlorophyll Fluorescence Retrieval Based on Principal Components Analysis. Remote Sens. 2015, 7, 10626. [Google Scholar] [CrossRef]
- Du, S.; Liu, L.; Liu, X.; Hu, J. Response of Canopy Solar-Induced Chlorophyll Fluorescence to the Absorbed Photosynthetically Active Radiation Absorbed by Chlorophyll. Remote Sens. 2017, 9, 911. [Google Scholar] [CrossRef]
- Goulas, Y.; Fournier, A.; Daumard, F.; Champagne, S.; Ounis, A.; Marloie, O.; Moya, I. Gross Primary Production of a Wheat Canopy Relates Stronger to Far Red Than to Red Solar-Induced Chlorophyll Fluorescence. Remote Sens. 2017, 9, 97. [Google Scholar] [CrossRef]
- Radoti, K.; Mel, T.B. Using optical fibers to measure absorption in intact conifer leaves, relative numbers of chloroplasts, and pigment content. J. Biol. Phys. 2020, 46, 33–43. [Google Scholar] [CrossRef]
- Bump, W. The Normal Curve Takes Many Forms: A Review of Skewness and Kurtosis. 1991. Available online: https://files.eric.ed.gov/fulltext/ED342790.pdf (accessed on 2 July 2023).
- Rascher, U.; Alonso, L.; Burkart, A.; Cilia, C.; Zemek, F. Sun-induced fluorescence—A new probe of photosynthesis: First maps from the imaging spectrometer HyPlant. Glob. Chang. Biol. 2015, 21, 4673–4684. [Google Scholar] [CrossRef]
- Zhang, S.; Liu, L. The potential of the meris terrestrial chlorophyll index for crop yield prediction the potential of the meris terrestrial chlorophyll index for crop yield prediction. Remote Sens. Lett. 2014, 5, 733–742. [Google Scholar] [CrossRef]
- Liu, L.; Liu, X.; Hu, J.; Guan, L. Assessing the wavelength-dependent ability of solar-induced chlorophyll fluorescence to estimate the GPP of winter wheat at the canopy level. Int. J. Remote Sens. 2017, 38, 4396–4417. [Google Scholar] [CrossRef]
- Zhao, F.; Li, R.; Verhoef, W.; Cogliati, S.; Liu, X.; Huang, Y.; Guo, Y.; Huang, J. Reconstruction of the full spectrum of solar-induced chlorophyll fluorescence: Intercomparison study for a novel method. Remote Sens. Environ. 2018, 219, 233–246. [Google Scholar] [CrossRef]
- Scodellaro, R.; Cesana, I.; D’Alfonso, L.; Bouzin, M.; Collini, M.; Chirico, G.; Colombo, R.; Miglietta, F.; Celesti, M.; Schuettemeyer, D.; et al. A novel hybrid machine learning phasor-based approach to retrieve a full set of solar-induced fluorescence metrics and biophysical parameters. Remote Sens. Environ. 2022, 280, 113196. [Google Scholar] [CrossRef]
- Wang, C.; Guan, K.; Peng, B.; Chen, M.; Jiang, C.; Zeng, Y.; Wu, G.; Wang, S.; Wu, J.; Yang, X. Satellite footprint data from OCO-2 and TROPOMI reveal significant spatio-temporal and inter-vegetation type variabilities of solar-induced fluorescence yield in the US Midwest. Remote Sens. Environ. 2020, 241, 111728. [Google Scholar] [CrossRef]
- Kalaji, H.M.; Schansker, G.; Brestic, M.; Bussotti, F.; Calatayud, A.; Ferroni, L.; Goltsev, V.; Guidi, L.; Jajoo, A.; Li, P. Frequently asked questions about chlorophyll fluorescence, the sequel. Photosynth. Res. 2017, 132, 13–66. [Google Scholar] [CrossRef] [PubMed]
- Porcar-Castell, A.; Malenovsk, Z.; Magney, T.; Wittenberghe, S.V.; Fernández-Marín, B.; Maignan, F.; Zhang, Y.; Maseyk, K.; Atherton, J.; Albert, L.P. Chlorophyll a fluorescence illuminates a path connecting plant molecular biology to Earth-system science. Nat. Plants 2021, 7, 998–1009. [Google Scholar] [CrossRef] [PubMed]
- Ali, S.; Gladieux, P.; Leconte, M.; Gautier, A.; Justesen, A.F.; Hovmøller, M.S.; Enjalbert, J.M.; De Vallavieille-Pope, C.; Mcdonald, B.A. Origin, Migration Routes and Worldwide Population Genetic Structure of the Wheat Yellow Rust Pathogen Puccinia striiformis f.sp. tritici. PLoS Pathog. 2014, 10, e1003903. [Google Scholar] [CrossRef] [PubMed]
- Ma, L.; Sun, L.; Wang, S.; Chen, J.; Chen, B.; Zhu, K.; Amir, M.; Wang, X.; Liu, Y.; Wang, P.; et al. Analysis on the relationship between sun-induced chlorophyll fluorescence and gross primary productivity of winter wheat in northern China. Ecol. Indic. 2022, 139, 108905. [Google Scholar] [CrossRef]
- Dufranne, D.; Moureaux, C.; Vancutsem, F.; Bodson, B.; Aubinet, M. Comparison of carbon fluxes, growth and productivity of a winter wheat crop in three contrasting growing seasons. Agric. Ecosyst. 2011, 141, 133–142. [Google Scholar] [CrossRef]
- Kangasjrvi, S.; Tikkanen, M.; Durian, G.; Aro, E.M. Photosynthetic light reactions—An adjustable hub in basic production and plant immunity signaling. Plant Physiol. Biochem. 2014, 81, 128–134. [Google Scholar] [CrossRef]
- Qi, J.; Song, C.P.; Wang, B.; Zhou, J.; Kangasjärvi, J.; Zhu, J.K.; Gong, Z. Reactive oxygen species signaling and stomatal movement in plant responses to drought stress and pathogen attack. J. Integr. Plant Biol. 2018, 60, 805–826. [Google Scholar] [CrossRef] [PubMed]
- Bowling, S.A.; Guo, A.; Cao, H.; Gordon, A.S.; Dong, K.X. A mutation in Arabidopsis that leads to constitutive expression of systemic acquired resistance. Plant Cell Online 1994, 6, 1845–1857. [Google Scholar]
- Hu, Y.; Zhong, S.; Zhang, M.; Liang, Y.; Gong, G.; Chang, X.; Tan, F.; Yang, H.; Qiu, X.; Luo, L. Potential Role of Photosynthesis in the Regulation of Reactive Oxygen Species and Defence Responses to Blumeria graminis f. sp. tritici in Wheat. Int. J. Mol. Sci. 2020, 21, 57–67. [Google Scholar] [CrossRef] [PubMed]


Disclaimer/Publisher’s Note: The statements, opinions and data contained in all publications are solely those of the individual author(s) and contributor(s) and not of MDPI and/or the editor(s). MDPI and/or the editor(s) disclaim responsibility for any injury to people or property resulting from any ideas, methods, instructions or products referred to in the content. |
© 2024 by the authors. Licensee MDPI, Basel, Switzerland. This article is an open access article distributed under the terms and conditions of the Creative Commons Attribution (CC BY) license (https://creativecommons.org/licenses/by/4.0/).