
Nitrogen Fertilization Alleviates Barley (Hordeum vulgare L.) Waterlogging


Abstract
:1. Introduction
2. Materials and Methods
2.1. Plant Materials and Fertiliser Treatments
2.2. Plant Recovery Indicators
2.3. Shoot Biomass
2.4. Grain Yield and Yield Components
2.5. Data Analysis
3. Results
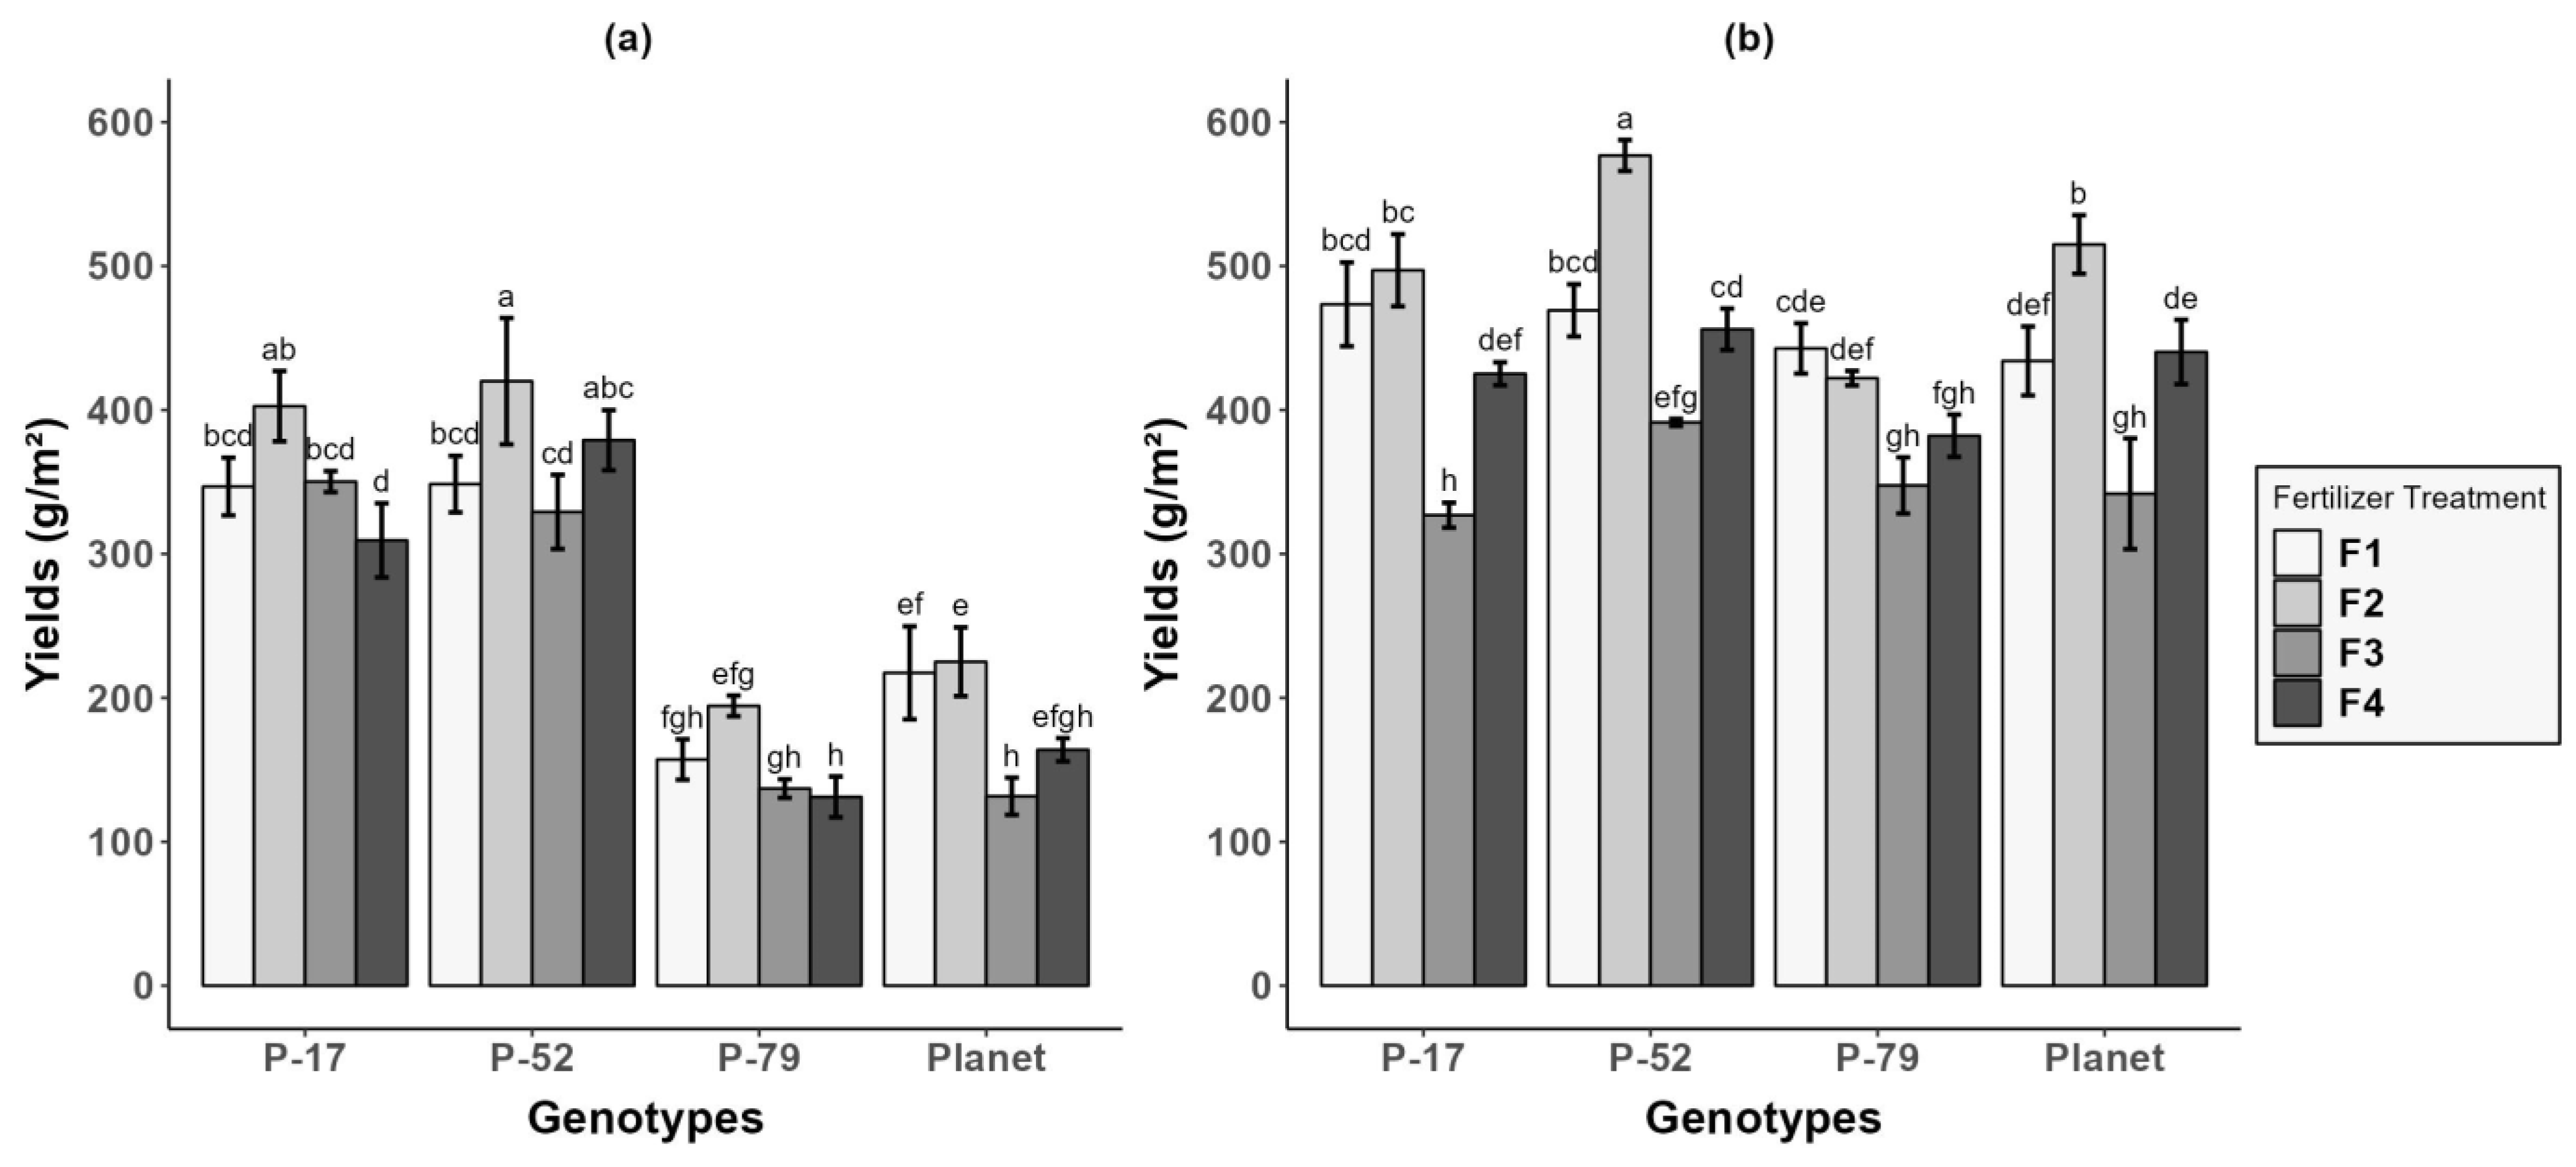
3.1. Yield
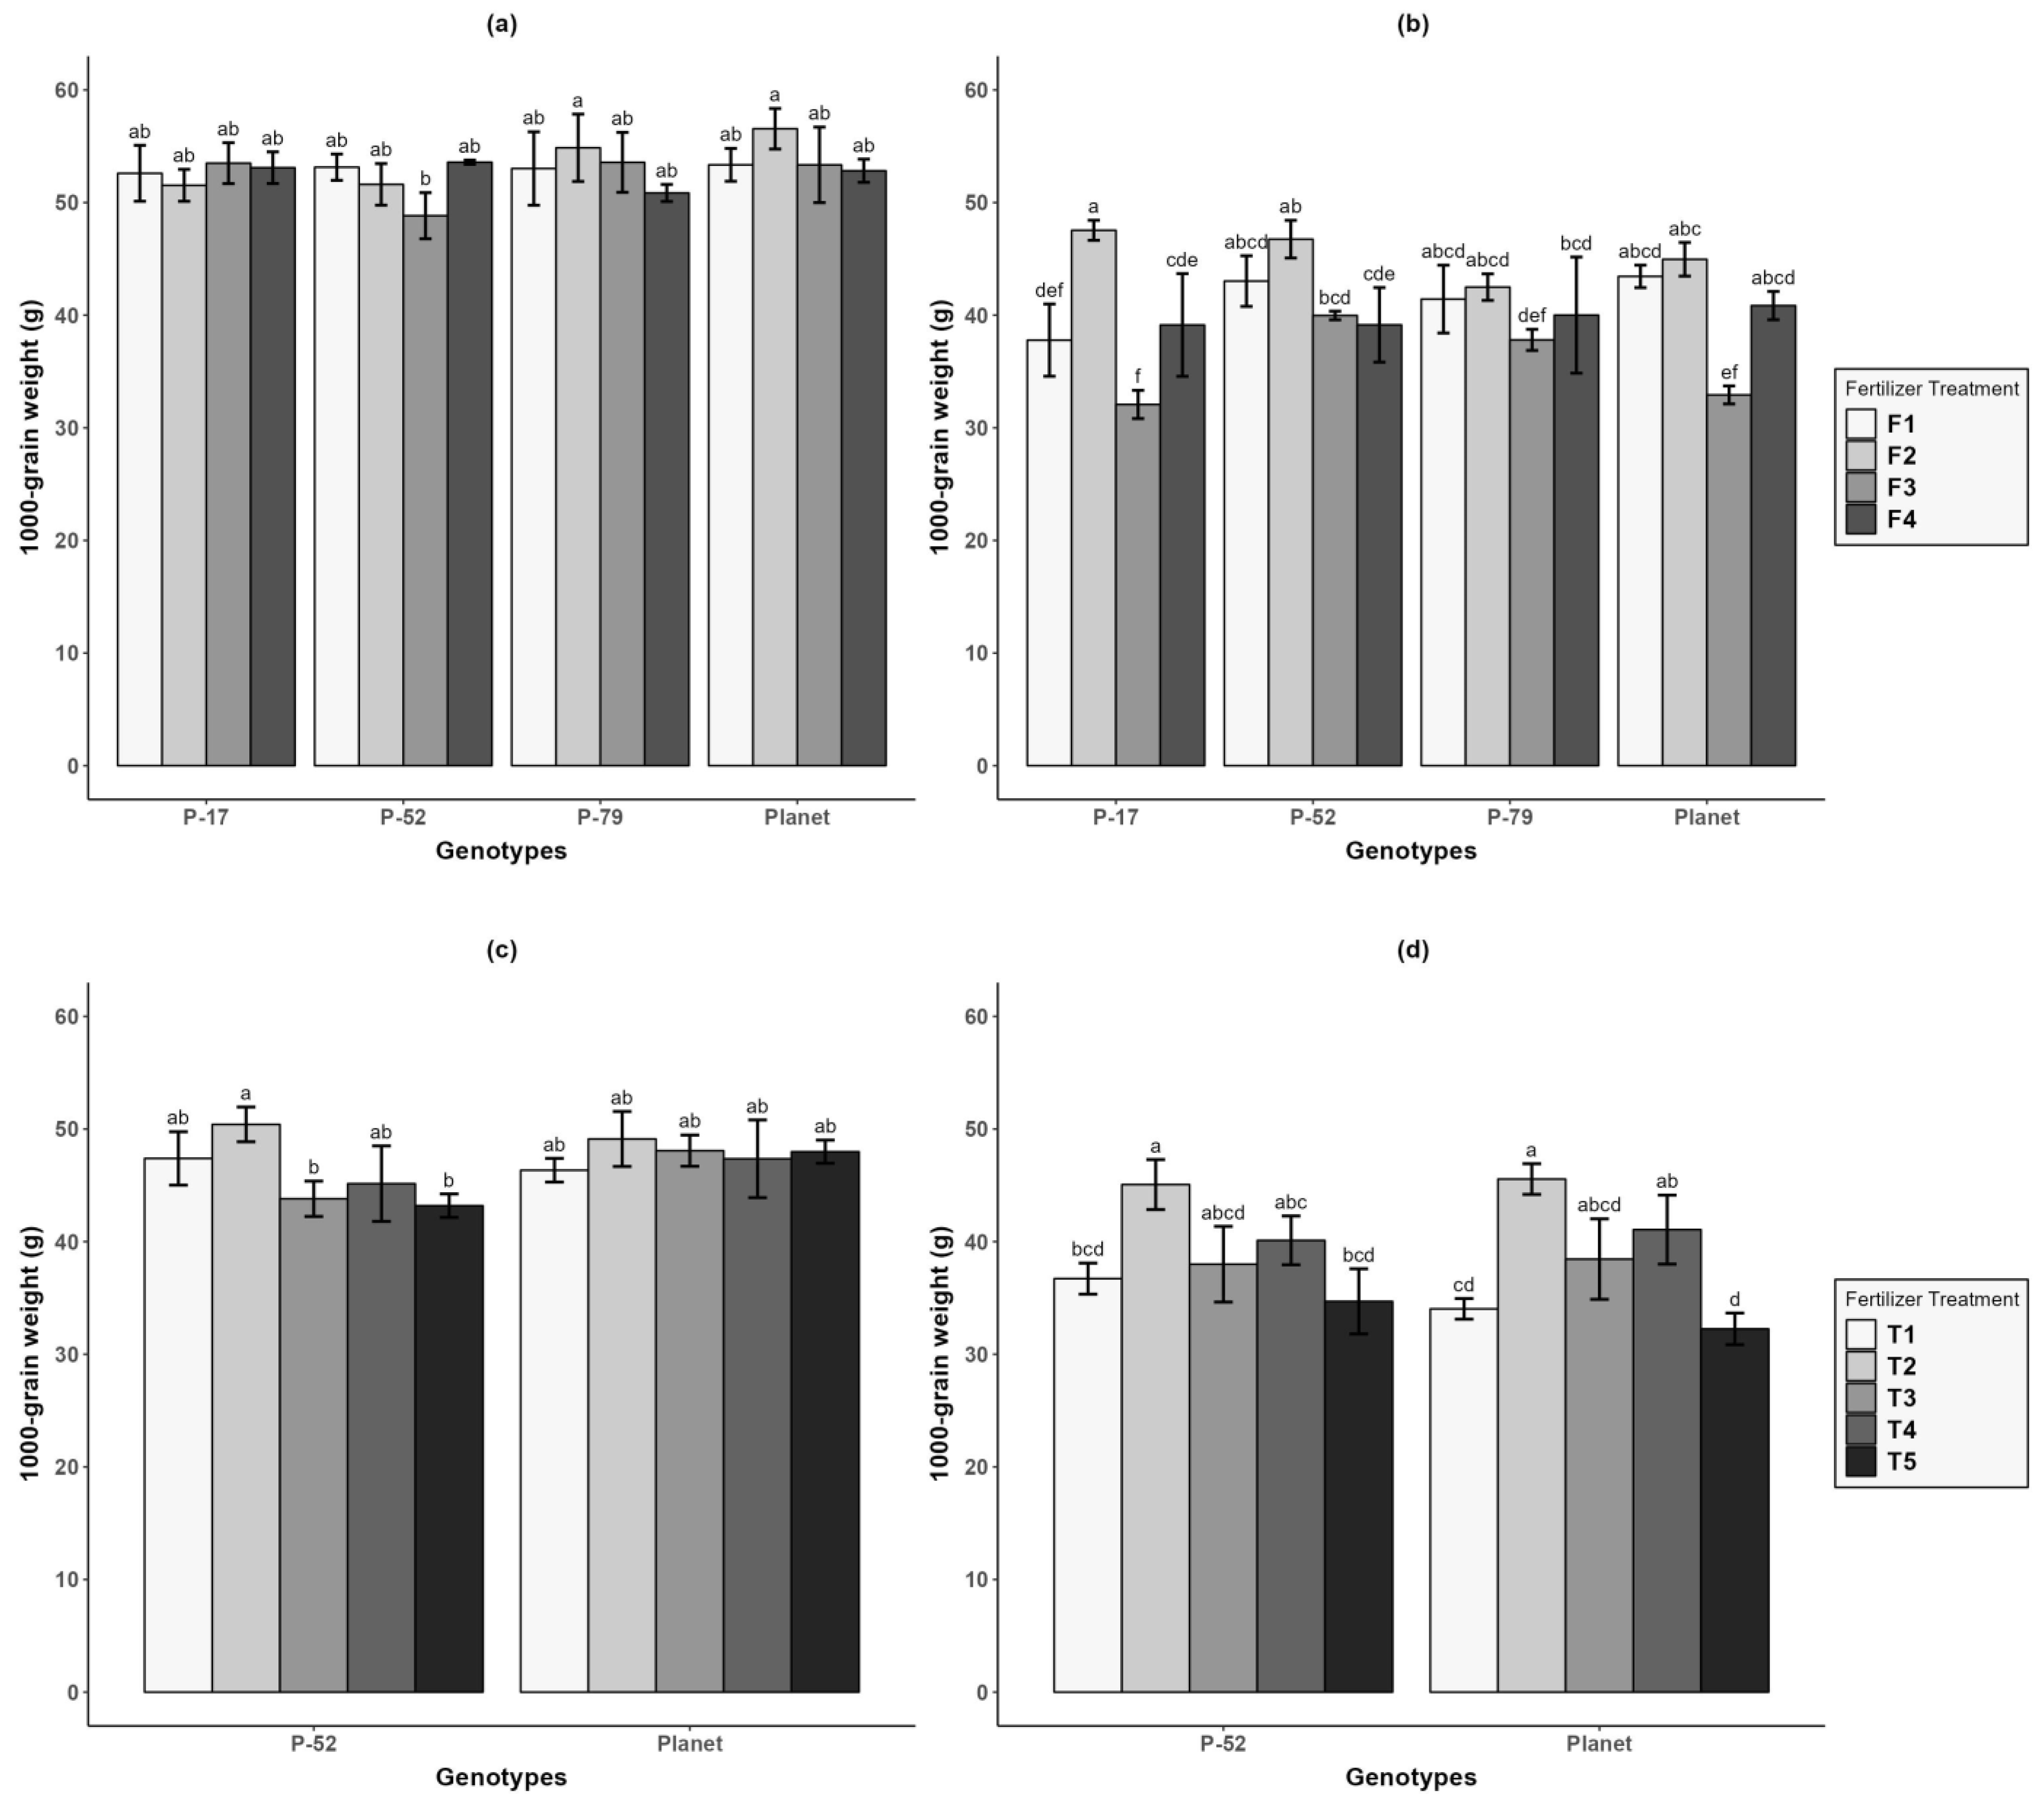
3.2. Yield Components
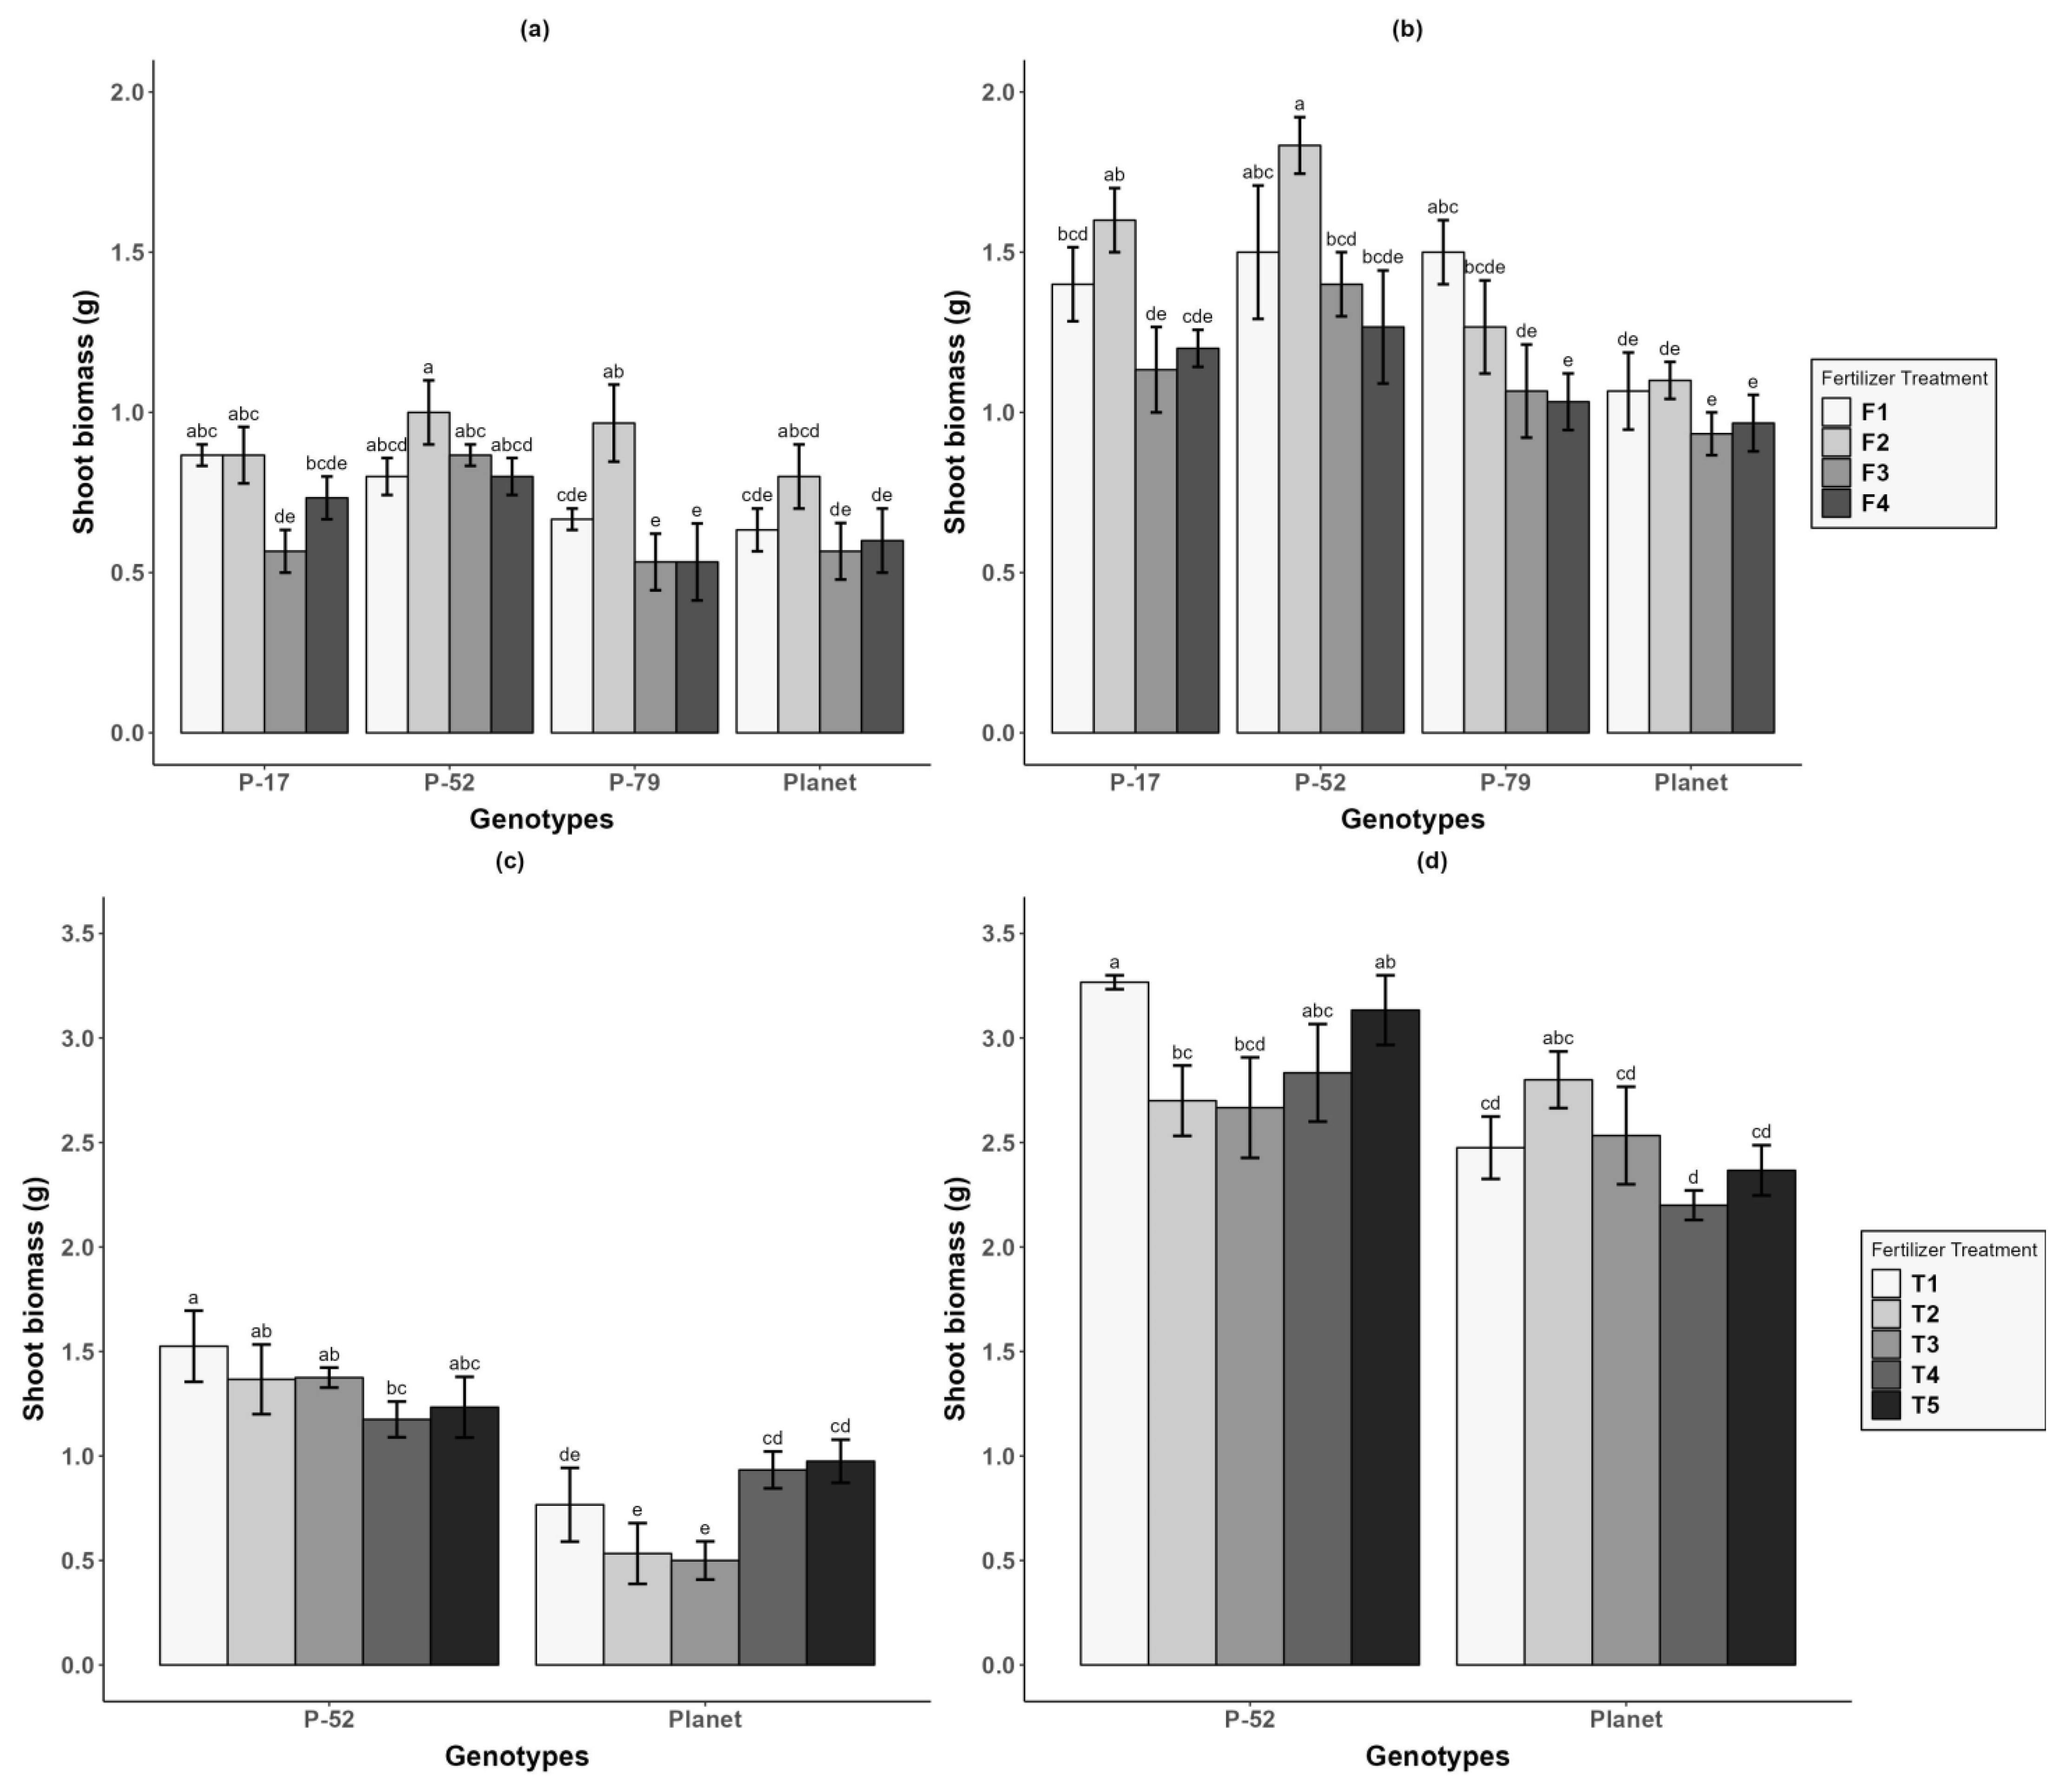
3.3. Shoot Biomass
3.4. Fertiliser at Different Crop Growth Stages Influences Plant Recovery
4. Discussion
4.1. Crop Genotype Dictates Relative Waterlogging Impacts
4.2. Yield Penalty under Waterlogging Primarily Governed by Spike Number
4.3. Effects of Waterlogging on Grain Weight
4.4. Impacts of Different Fertiliser Application Methods on Alleviating Waterlogging Damage
4.5. Future Directions
5. Conclusions
Supplementary Materials
Author Contributions
Funding
Data Availability Statement
Acknowledgments
Conflicts of Interest
References
- Jackson, M.; Colmer, T. Response and adaptation by plants to flooding stress. Ann. Bot. 2005, 96, 501–505. [Google Scholar] [CrossRef] [PubMed]
- Setter, T.; Waters, I. Review of prospects for germplasm improvement for waterlogging tolerance in wheat, barley and oats. Plant Soil 2003, 253, 1–34. [Google Scholar] [CrossRef]
- Hidalgo, F.D.; Naidu, S.; Nichter, S.; Richardson, N. Economic determinants of land invasions. Rev. Econ. Stat. 2010, 92, 505–523. [Google Scholar] [CrossRef]
- Liu, K.; Harrison, M.T.; Ibrahim, A.; Manik, S.N.; Johnson, P.; Tian, X.; Meinke, H.; Zhou, M. Genetic factors increasing barley grain yields under soil waterlogging. Food Energy Secur. 2020, 9, e238. [Google Scholar] [CrossRef]
- Malik, A.I.; Colmer, T.D.; Lambers, H.; Schortemeyer, M. Changes in physiological and morphological traits of roots and shoots of wheat in response to different depths of waterlogging. Funct. Plant Biol. 2001, 28, 1121–1131. [Google Scholar] [CrossRef]
- Dennis, E.S.; Dolferus, R.; Ellis, M.; Rahman, M.; Wu, Y.; Hoeren, F.; Grover, A.; Ismond, K.; Good, A.; Peacock, W. Molecular strategies for improving waterlogging tolerance in plants. J. Exp. Bot. 2000, 51, 89–97. [Google Scholar] [CrossRef]
- Zhang, H.; Turner, N.; Poole, M.; Simpson, N. Crop production in the high rainfall zones of southern Australia—Potential, constraints and opportunities. Aust. J. Exp. Agric. 2006, 46, 1035–1049. [Google Scholar] [CrossRef]
- Zhou, M. Barley production and consumption. In Genetics and Improvement of Barley Malt Quality. Springer: Berlin/Heidelberg, Germany, 2009; pp. 1–17. [Google Scholar] [CrossRef]
- Lukinac, J.; Jukić, M. Barley in the production of cereal-based products. Plants 2022, 11, 3519. [Google Scholar] [CrossRef] [PubMed]
- Ahmed, F.; Rafii, M.; Ismail, M.R.; Juraimi, A.S.; Rahim, H.; Asfaliza, R.; Latif, M.A. Waterlogging tolerance of crops: Breeding, mechanism of tolerance, molecular approaches, and future prospects. BioMed Res. Int. 2013, 2013, 963525. [Google Scholar] [CrossRef]
- Liu, K.; Harrison, M.T.; Shabala, S.; Meinke, H.; Ahmed, I.; Zhang, Y.; Tian, X.; Zhou, M. The state of the art in modeling waterlogging impacts on plants: What do we know and what do we need to know. Earth’s Future 2020, 8, e2020EF001801. [Google Scholar] [CrossRef]
- Liu, K.; Harrison, M.T.; Archontoulis, S.V.; Huth, N.; Yang, R.; Liu, D.L.; Yan, H.; Meinke, H.; Huber, I.; Feng, P. Climate change shifts forward flowering and reduces crop waterlogging stress. Environ. Res. Lett. 2021, 16, 094017. [Google Scholar] [CrossRef]
- Singh, B.P.; Tucker, K.A.; Sutton, J.D.; Bhardwaj, H.L. Flooding reduces gas exchange and growth in snap bean. HortScience 1991, 26, 372–373. [Google Scholar] [CrossRef]
- Nandy, P.; Das, S.K.; Tarafdar, J.C. Effect of Integrated Nutrient Management and Foliar Spray of Zinc in Nanoform on Rice Crop Nutrition, Productivity and Soil Chemical and Biological Properties in Inceptisols. J. Soil Sci. Plant Nutr. 2022, 23, 540–555. [Google Scholar] [CrossRef]
- Marashi, S.K. Evaluation of uptake rate and distribution of nutrient ions in wheat (Triticum aestivum L.) under waterlogging condition. Iran. J. Plant Physiol. 2018, 8, 2539–2547. [Google Scholar]
- Yamauchi, T.; Colmer, T.D.; Pedersen, O.; Nakazono, M. Regulation of root traits for internal aeration and tolerance to soil waterlogging-flooding stress. Plant Physiol. 2018, 176, 1118–1130. [Google Scholar] [CrossRef]
- Yordanova, R.; Uzunova, A.; Popova, L. Effects of short-term soil flooding on stomata behaviour and leaf gas exchange in barley plants. Biol. Plant. 2005, 49, 317–319. [Google Scholar] [CrossRef]
- Ashraf, M.; Arfan, M. Gas exchange characteristics and water relations in two cultivars of Hibiscus esculentus under waterlogging. Biol. Plant. 2005, 49, 459–462. [Google Scholar] [CrossRef]
- Zhang, Y.; Song, X.; Yang, G.; Li, Z.; Lu, H.; Kong, X.; Eneji, A.E.; Dong, H. Physiological and molecular adjustment of cotton to waterlogging at peak-flowering in relation to growth and yield. Field Crops Res. 2015, 179, 164–172. [Google Scholar] [CrossRef]
- Tian, G.; Qi, D.; Zhu, J.; Xu, Y. Effects of nitrogen fertilizer rates and waterlogging on leaf physiological characteristics and grain yield of maize. Arch. Agron. Soil Sci. 2021, 67, 863–875. [Google Scholar] [CrossRef]
- Manik, S.; Pengilley, G.; Dean, G.; Field, B.; Shabala, S.; Zhou, M. Soil and crop management practices to minimize the impact of waterlogging on crop productivity. Front. Plant Sci. 2019, 10, 140. [Google Scholar] [CrossRef]
- Sayre, K.D.; Hobbs, P.R. The raised-bed system of cultivation for irrigated production conditions. In Sustainable Agriculture and the International Rice-Wheat System; CRC Press: Boca Raton, FL, USA, 2004; pp. 337–355. [Google Scholar] [CrossRef]
- Savci, S. An agricultural pollutant: Chemical fertilizer. Int. J. Environ. Sci. Dev. 2012, 3, 73. [Google Scholar] [CrossRef]
- Chae, H.-S.; Noh, H.-J.; Song, W.S.; Cho, H.-H. Efficiency and effectiveness of vitamin C-substrate organo-mineral straight fertilizer in lettuce (Lactuca sativa L.). Chem. Biol. Technol. Agric. 2018, 5, 4. [Google Scholar] [CrossRef]
- Kisaakye, E.; Acuña, T.B.; Johnson, P.; Shabala, S. Improving wheat growth and nitrogen-use efficiency under waterlogged conditions. In Proceedings of the 18th Australian Agronomy Conference, Ballarat, VIC, Australia, 24–28 September 2017; pp. 1–4. [Google Scholar]
- Robertson, D.; Zhang, H.; Palta, J.A.; Colmer, T.; Turner, N.C. Waterlogging affects the growth, development of tillers, and yield of wheat through a severe, but transient, N deficiency. Crop Pasture Sci. 2009, 60, 578–586. [Google Scholar] [CrossRef]
- Wu, J.; Li, J.; Wei, F.; Wang, C.; Zhang, Y.; Sun, G. Effects of nitrogen spraying on the post-anthesis stage of winter wheat under waterlogging stress. Acta Physiol. Plant. 2014, 36, 207–216. [Google Scholar] [CrossRef]
- Rasaei, A.; Ghobadi, M.-E.; Jalali-Honarmand, S.; Ghobadi, M.; Saeidi, M. Impacts of waterlogging on shoot apex development and recovery effects of nitrogen on grain yield of wheat. Eur. J. Exp. Biol. 2012, 2, 1000–1007. [Google Scholar]
- Qi, D.; Pan, C. Responses of shoot biomass accumulation, distribution, and nitrogen use efficiency of maize to nitrogen application rates under waterlogging. Agric. Water Manag. 2022, 261, 107352. [Google Scholar] [CrossRef]
- Rao, R.; Bryan, H.H.; Reed, S.T. Assessment of foliar sprays to alleviate flooding injury in corn (Zea mays L.). Proc. Fla. State Hortic. Soc. 2002, 115, 208–211. [Google Scholar]
- Watson, E.; Lapins, P.; Barron, R. Effect of waterlogging on the growth, grain and straw yield of wheat, barley and oats. Aust. J. Exp. Agric. 1976, 16, 114–122. [Google Scholar] [CrossRef]
- Kaur, G.; Nelson, K.A.; Motavalli, P.P. Early-season soil waterlogging and N fertilizer sources impacts on corn N uptake and apparent N recovery efficiency. Agronomy 2018, 8, 102. [Google Scholar] [CrossRef]
- Simpson, N.L.; Brennan, R.F.; Anderson, W.K. Grain yield increases in wheat and barley to nitrogen applied after transient waterlogging in the high rainfall cropping zone of western Australia. J. Plant Nutr. 2016, 39, 974–992. [Google Scholar] [CrossRef]
- Manik, S.N.; Quamruzzaman, M.; Livermore, M.; Zhao, C.; Johnson, P.; Hunt, I.; Shabala, S.; Zhou, M. Impacts of barley root cortical aerenchyma on growth, physiology, yield components, and grain quality under field waterlogging conditions. Field Crops Res. 2022, 279, 108461. [Google Scholar] [CrossRef]
- Huang, S.; Tang, L.; Hupy, J.P.; Wang, Y.; Shao, G. A commentary review on the use of normalized difference vegetation index (NDVI) in the era of popular remote sensing. J. For. Res. 2021, 32, 1–6. [Google Scholar] [CrossRef]
- Horton, N.J.; Kleinman, K. Using R and RStudio for Data Management, Statistical Analysis, and Graphics; CRC Press: Boca Raton, FL, USA, 2015. [Google Scholar]
- Ploschuk, R.A.; Miralles, D.J.; Colmer, T.D.; Ploschuk, E.L.; Striker, G.G. Waterlogging of winter crops at early and late stages: Impacts on leaf physiology, growth and yield. Front. Plant Sci. 2018, 9, 1863. [Google Scholar] [CrossRef]
- de San Celedonio, R.P.; Abeledo, L.G.; Miralles, D.J. Identifying the critical period for waterlogging on yield and its components in wheat and barley. Plant Soil 2014, 378, 265–277. [Google Scholar] [CrossRef]
- Masoni, A.; Pampana, S.; Arduini, I. Barley response to waterlogging duration at tillering. Crop Sci. 2016, 56, 2722–2730. [Google Scholar] [CrossRef]
- Zhou, M. Accurate phenotyping reveals better QTL for waterlogging tolerance in barley. Plant Breed. 2011, 130, 203–208. [Google Scholar] [CrossRef]
- Abeledo, L.G.; Calderini, D.F.; Slafer, G.A. Genetic improvement of yield responsiveness to nitrogen fertilization and its physiological determinants in barley. Euphytica 2003, 133, 291–298. [Google Scholar] [CrossRef]
- de San Celedonio, R.P.; Abeledo, L.G.; Miralles, D.J. Physiological traits associated with reductions in grain number in wheat and barley under waterlogging. Plant Soil 2018, 429, 469–481. [Google Scholar] [CrossRef]
- Marti, J.; Savin, R.; Slafer, G. Wheat yield as affected by length of exposure to waterlogging during stem elongation. J. Agron. Crop Sci. 2015, 201, 473–486. [Google Scholar] [CrossRef]
- Alzueta, I.; Abeledo, L.G.; Mignone, C.M.; Miralles, D.J. Differences between wheat and barley in leaf and tillering coordination under contrasting nitrogen and sulfur conditions. Eur. J. Agron. 2012, 41, 92–102. [Google Scholar] [CrossRef]
- de San Celedonio, R.P.; Abeledo, L.G.; Brihet, J.M.; Miralles, D.J. Waterlogging affects leaf and tillering dynamics in wheat and barley. J. Agron. Crop Sci. 2016, 202, 409–420. [Google Scholar] [CrossRef]
- Anderson, W.; McLean, R. Increased responsiveness of short oat cultivars to early sowing, nitrogen fertilizer and seed rate. Aust. J. Agric. Res. 1989, 40, 729–744. [Google Scholar] [CrossRef]
- Bulman, P.; Smith, D.L. Yield and yield component response of spring barley to fertilizer nitrogen. Agron. J. 1993, 85, 226–231. [Google Scholar] [CrossRef]
- Babaeian, M.; Esmaeilian, Y.; Tavassoli, A.; Asgharzade, A.; Sadeghi, M. The effects of water stress, manure and chemical fertilizer on grain yield and grain nutrient content in barley. Sci. Res. Essays 2011, 6, 3697–3701. [Google Scholar] [CrossRef]
- Pushman, F.M.; Bingham, J. The effects of a granular nitrogen fertilizer and a foliar spray of urea on the yield and bread-making quality of ten winter wheats. J. Agric. Sci. 1976, 87, 281–292. [Google Scholar] [CrossRef]
- Souza, S.R.; Stark, E.M.L.; Fernandes, M.S. Foliar spraying of rice with nitrogen: Effect on protein levels, protein fractions, and grain weight. J. Plant Nutr. 1999, 22, 579–588. [Google Scholar] [CrossRef]
- Pang, J.; Ross, J.; Zhou, M.; Mendham, N.; Shabala, S. Amelioration of detrimental effects of waterlogging by foliar nutrient sprays in barley. Funct. Plant Biol. 2007, 34, 221–227. [Google Scholar] [CrossRef]
- Thongbai, P.; Milroy, S.; Bange, M.; Rapp, G.; Smith, T. Agronomic responses of cotton to low soil oxygen during waterlogging. In Proceedings of the 10th Australian Agronomy Conference, Hobart, TSA, Australia, 29 January–1 February 2001; pp. 1600–1730. [Google Scholar]
- Elzenga, J.T.M.; van Veen, H. Waterlogging and plant nutrient uptake. In Waterlogging Signalling and Tolerance in Plants; Springer: Berlin/Heidelberg, Germany, 2010; pp. 23–35. [Google Scholar] [CrossRef]


| Treatments | At Sowing | 7 d after WL (7 DWL) | 21 d after WL (21 DWL) | 0 d after Recovery (0 DR) | 30 d after Recovery (30 DR) |
|---|---|---|---|---|---|
| T1 | 30 kg·ha−1 | 20 kg·ha−1 foliar spray | 90 kg·ha−1 | 90 kg·ha−1 | |
| T2 | 30 kg·ha−1 | 20 kg·ha−1 foliar spray | 90 kg·ha−1 | ||
| T3 | 30 kg·ha−1 | 90 kg·ha−1 | 90 kg·ha−1 | ||
| T4 | 30 kg·ha-1 | 20 kg·ha−1 foliar spray | 20 kg·ha−1 foliar spray | 90 kg·ha−1 | |
| T5 | 30 kg·ha−1 | 180 kg·ha−1 | 90 kg·ha−1 |
| Treatment | At Sowing | 28 d after WL (28 DWL) | 0 d after Recovery (0 DR) | 30 d after Recovery (30 DR) |
|---|---|---|---|---|
| F1 | 45 kg·ha−1 | 45 kg·ha−1 | 45 kg·ha−1 | 45 kg·ha−1 |
| F2 | 45 kg·ha−1 | 90 kg·ha−1 | 45 kg·ha−1 | |
| F3 | 45 kg·ha−1 | 45 kg·ha−1 | ||
| F4 | 45 kg·ha−1 | 90 kg·ha−1 | 45 kg·ha−1 |
Disclaimer/Publisher’s Note: The statements, opinions and data contained in all publications are solely those of the individual author(s) and contributor(s) and not of MDPI and/or the editor(s). MDPI and/or the editor(s) disclaim responsibility for any injury to people or property resulting from any ideas, methods, instructions or products referred to in the content. |
© 2024 by the authors. Licensee MDPI, Basel, Switzerland. This article is an open access article distributed under the terms and conditions of the Creative Commons Attribution (CC BY) license (https://creativecommons.org/licenses/by/4.0/).
Share and Cite
Chen, J.; Zhao, C.; Harrison, M.T.; Zhou, M. Nitrogen Fertilization Alleviates Barley (Hordeum vulgare L.) Waterlogging. Agronomy 2024, 14, 1712. https://doi.org/10.3390/agronomy14081712
Chen J, Zhao C, Harrison MT, Zhou M. Nitrogen Fertilization Alleviates Barley (Hordeum vulgare L.) Waterlogging. Agronomy. 2024; 14(8):1712. https://doi.org/10.3390/agronomy14081712
Chicago/Turabian StyleChen, Jianbo, Chenchen Zhao, Matthew Tom Harrison, and Meixue Zhou. 2024. "Nitrogen Fertilization Alleviates Barley (Hordeum vulgare L.) Waterlogging" Agronomy 14, no. 8: 1712. https://doi.org/10.3390/agronomy14081712