Article

The Carbon Footprint and Influencing Factors of the Main Grain Crops in the North China Plain

1
State Key Laboratory of Nutrient Use and Management/Key Laboratory of Wastes Matrix Utilization, Ministry of Agriculture and Rural Affair/Institute of Agricultural Resources and Environment, Shandong Academy of Agricultural Sciences, Jinan 250100, China
2
Dezhou Academy of Agricultural Sciences, Dezhou 253015, China
3
Agricultural Technology Extension Center, Linshu Agricultural and Rural Bureau, Linshu 276700, China
*
Authors to whom correspondence should be addressed.
These authors contributed to this work equally.
Agronomy 2024, 14(8), 1720; https://doi.org/10.3390/agronomy14081720
Submission received: 1 July 2024 / Revised: 25 July 2024 / Accepted: 2 August 2024 / Published: 5 August 2024

Abstract

:
The North China Plain (NCP) serves as a critical grain-producing region in China, playing a pivotal role in ensuring the nation’s food security. A comprehensive analysis of the carbon footprint (CF) related to the cultivation of major grain crops within this region and the proposal of strategies to reduce emissions through low-carbon production methods are crucial for advancing sustainable agricultural practices in China. This study employed the lifecycle assessment (LCA) method to estimate the CF of wheat, maize, and rice crops over a period from 2013 to 2022, based on statistical data collected from five key provinces and cities in the NCP: Beijing, Tianjin, Hebei, Shandong, and Henan. Additionally, the Logarithmic Mean Divisia Index (LMDI) model was utilized to analyze the influencing factors. The results indicated that the carbon footprints per unit area (CFA) of maize, wheat, and rice increased between 2013 and 2022. Rice had the highest carbon footprint per unit yield (CFY), averaging 1.1 kg CO2-eq kg−1, with significant fluctuations over time. In contrast, the CFY of wheat and maize remained relatively stable from 2013 to 2022. Fertilizers contributed the most to CF composition, accounting for 48.8%, 48.0%, and 25.9% of the total carbon inputs for wheat, maize, and rice, respectively. The electricity used for irrigation in rice production was 31.8%, which was much higher than that of wheat (6.8%) and maize (7.1%). The LMDI model showed that the labor effect was a common suppressing factor for the carbon emissions of maize, wheat, and rice in the NCP, while the agricultural structure effect and the economic development effect were common driving factors. By improving the efficiency of fertilizer and pesticide utilization, cultivating new varieties, increasing the mechanical operation efficiency, the irrigation efficiency, and policy support, the CF of grain crop production in the NCP can be effectively reduced. These efforts will contribute to the sustainable development of agricultural practices in the NCP and support China’s efforts to achieve its “double carbon” target.

1. Introduction

The global climate change trend of climate warming, which has been widely recognized by the scientific community since the industrial revolution, is mainly caused by natural factors and the large amount of greenhouse gas emissions from human industrialization processes [1]. Mitigating greenhouse gas emissions and reducing the extreme events caused by climate warming are important environmental issues that all countries around the world need to consider [2]. The “Change Our Future: 2030 Agenda for Sustainable Development” document, adopted at the “United Nations Sustainable Development Summit” in 2015, emphasized the need for member countries to take decisive action against the threat of climate change and collaborate internationally to accelerate global greenhouse gas reduction efforts to counteract its adverse effects. China, in particular, committed to peaking its carbon dioxide emissions by 2030 and striving for carbon neutrality by 2060 at the 75th session of the United Nations General Assembly. This commitment has exerted an immense pressure on various industries in China to reduce their emissions [3]. According to the findings of the sixth assessment report released by the Intergovernmental Panel on Climate Change (IPCC), greenhouse gas emissions caused by anthropogenic activities are the main driver of climate warming [4]. Agriculture, in particular, is a major contributor to these emissions, accounting for 19–29% of anthropogenic greenhouse gas emissions [5]. With China’s emission reduction plan advancing, the share of agricultural carbon emissions is expected to increase significantly. Therefore, regulating the level of agricultural carbon emissions is paramount for China in fulfilling its emission reduction commitments, enhancing its climate change adaptation capabilities, and achieving its “double carbon” goal [6]. Hence, it is imperative to study the changes in crop production carbon emissions and consider potential emission reduction strategies. This will aid in not only meeting China’s emission reduction commitments but also achieving sustainable agricultural practices that contribute to global climate stabilization efforts.
The evaluation of the carbon footprint (CF), as a systematic approach in assessing the environmental impact of agricultural production activities, provides a robust means to assess crop production carbon emissions [7]. This assessment considers not only the indirect carbon emissions stemming from agricultural inputs such as fertilizers, pesticides, seeds, and diesel but also the direct carbon emissions from farmland [8]. In recent years, numerous studies have been conducted on crop CFs. These encompass methodologies for calculating CFs at the farmland scale [9], spatial variations in CFs at the regional level [10,11], and identifying the influencing factors of CFs [12]. For instance, Duan et al. (2011) estimated China’s farmland ecosystem carbon emissions, carbon absorption, and CFs based on statistical data regarding crop yields and inputs to farmland production from 1990 to 2009. Their findings indicated a rising trend in carbon emissions, carbon intensity, carbon absorption, and CFs [13]. Furthermore, Wang et al. (2015) employed lifecycle assessment (LCA) to analyze the dynamic of crop CF in the North China Plain (NCP). They highlighted the significant contribution of nitrogen fertilizers and irrigation electricity to the overall footprint [14]. Similarly, Hillier et al. (2009) conducted observations and calculations of crop CFs throughout their lifecycle in the UK, emphasizing that fertilizer application was the largest contributor to the overall CF [15]. Moreover, the Logarithmic Mean Divisia Index (LMDI) model has been utilized to analyze the macro-level impact of economic level, population size, employment structure, production structure, and production efficiency on carbon emissions [12,16]. Research by Huang et al. (2022) indicated that economic levels were the primary factor driving the increase in greenhouse gas emissions in cotton cultivation in China [11]. Similarly, He et al. (2023) found that, while economic levels promoted carbon emissions in crop production, production efficiency had an inhibitory effect on carbon emissions [12]. In conclusion, these studies collectively emphasize the importance of considering multiple factors in mitigating the environmental impact of agricultural production activities and reducing CFs.
The NCP stands as a pivotal grain-producing region in China, accounting for over 20% of the national total grain crop planting area [17,18,19,20,21,22,23,24,25,26]. Given its immense potential to reduce greenhouse gas emissions in agriculture, analyzing the spatiotemporal changes and driving forces behind the CF of grain crops, especially in the context of China’s carbon peak and carbon neutrality goals, holds great significance. This endeavor is crucial for China to fulfill its emission reduction commitments. However, existing research on grain crop carbon emissions in the NCP has been limited to specific regional studies and the implementation of low-carbon technologies for carbon reduction in farmland. There is a dearth of studies exploring the recent spatiotemporal changes and driving factors of CFs in the region [9,14]. Therefore, this study used the LCA method and the LMDI model to analyze the changes and influencing factors of the CFs of maize, wheat, and rice in the NCP in the past ten years and proposed effective measures for grain crop carbon reduction in the NCP. The aim was to provide a theoretical basis for China to achieve its “double carbon” target as soon as possible.

2. Material and Methods
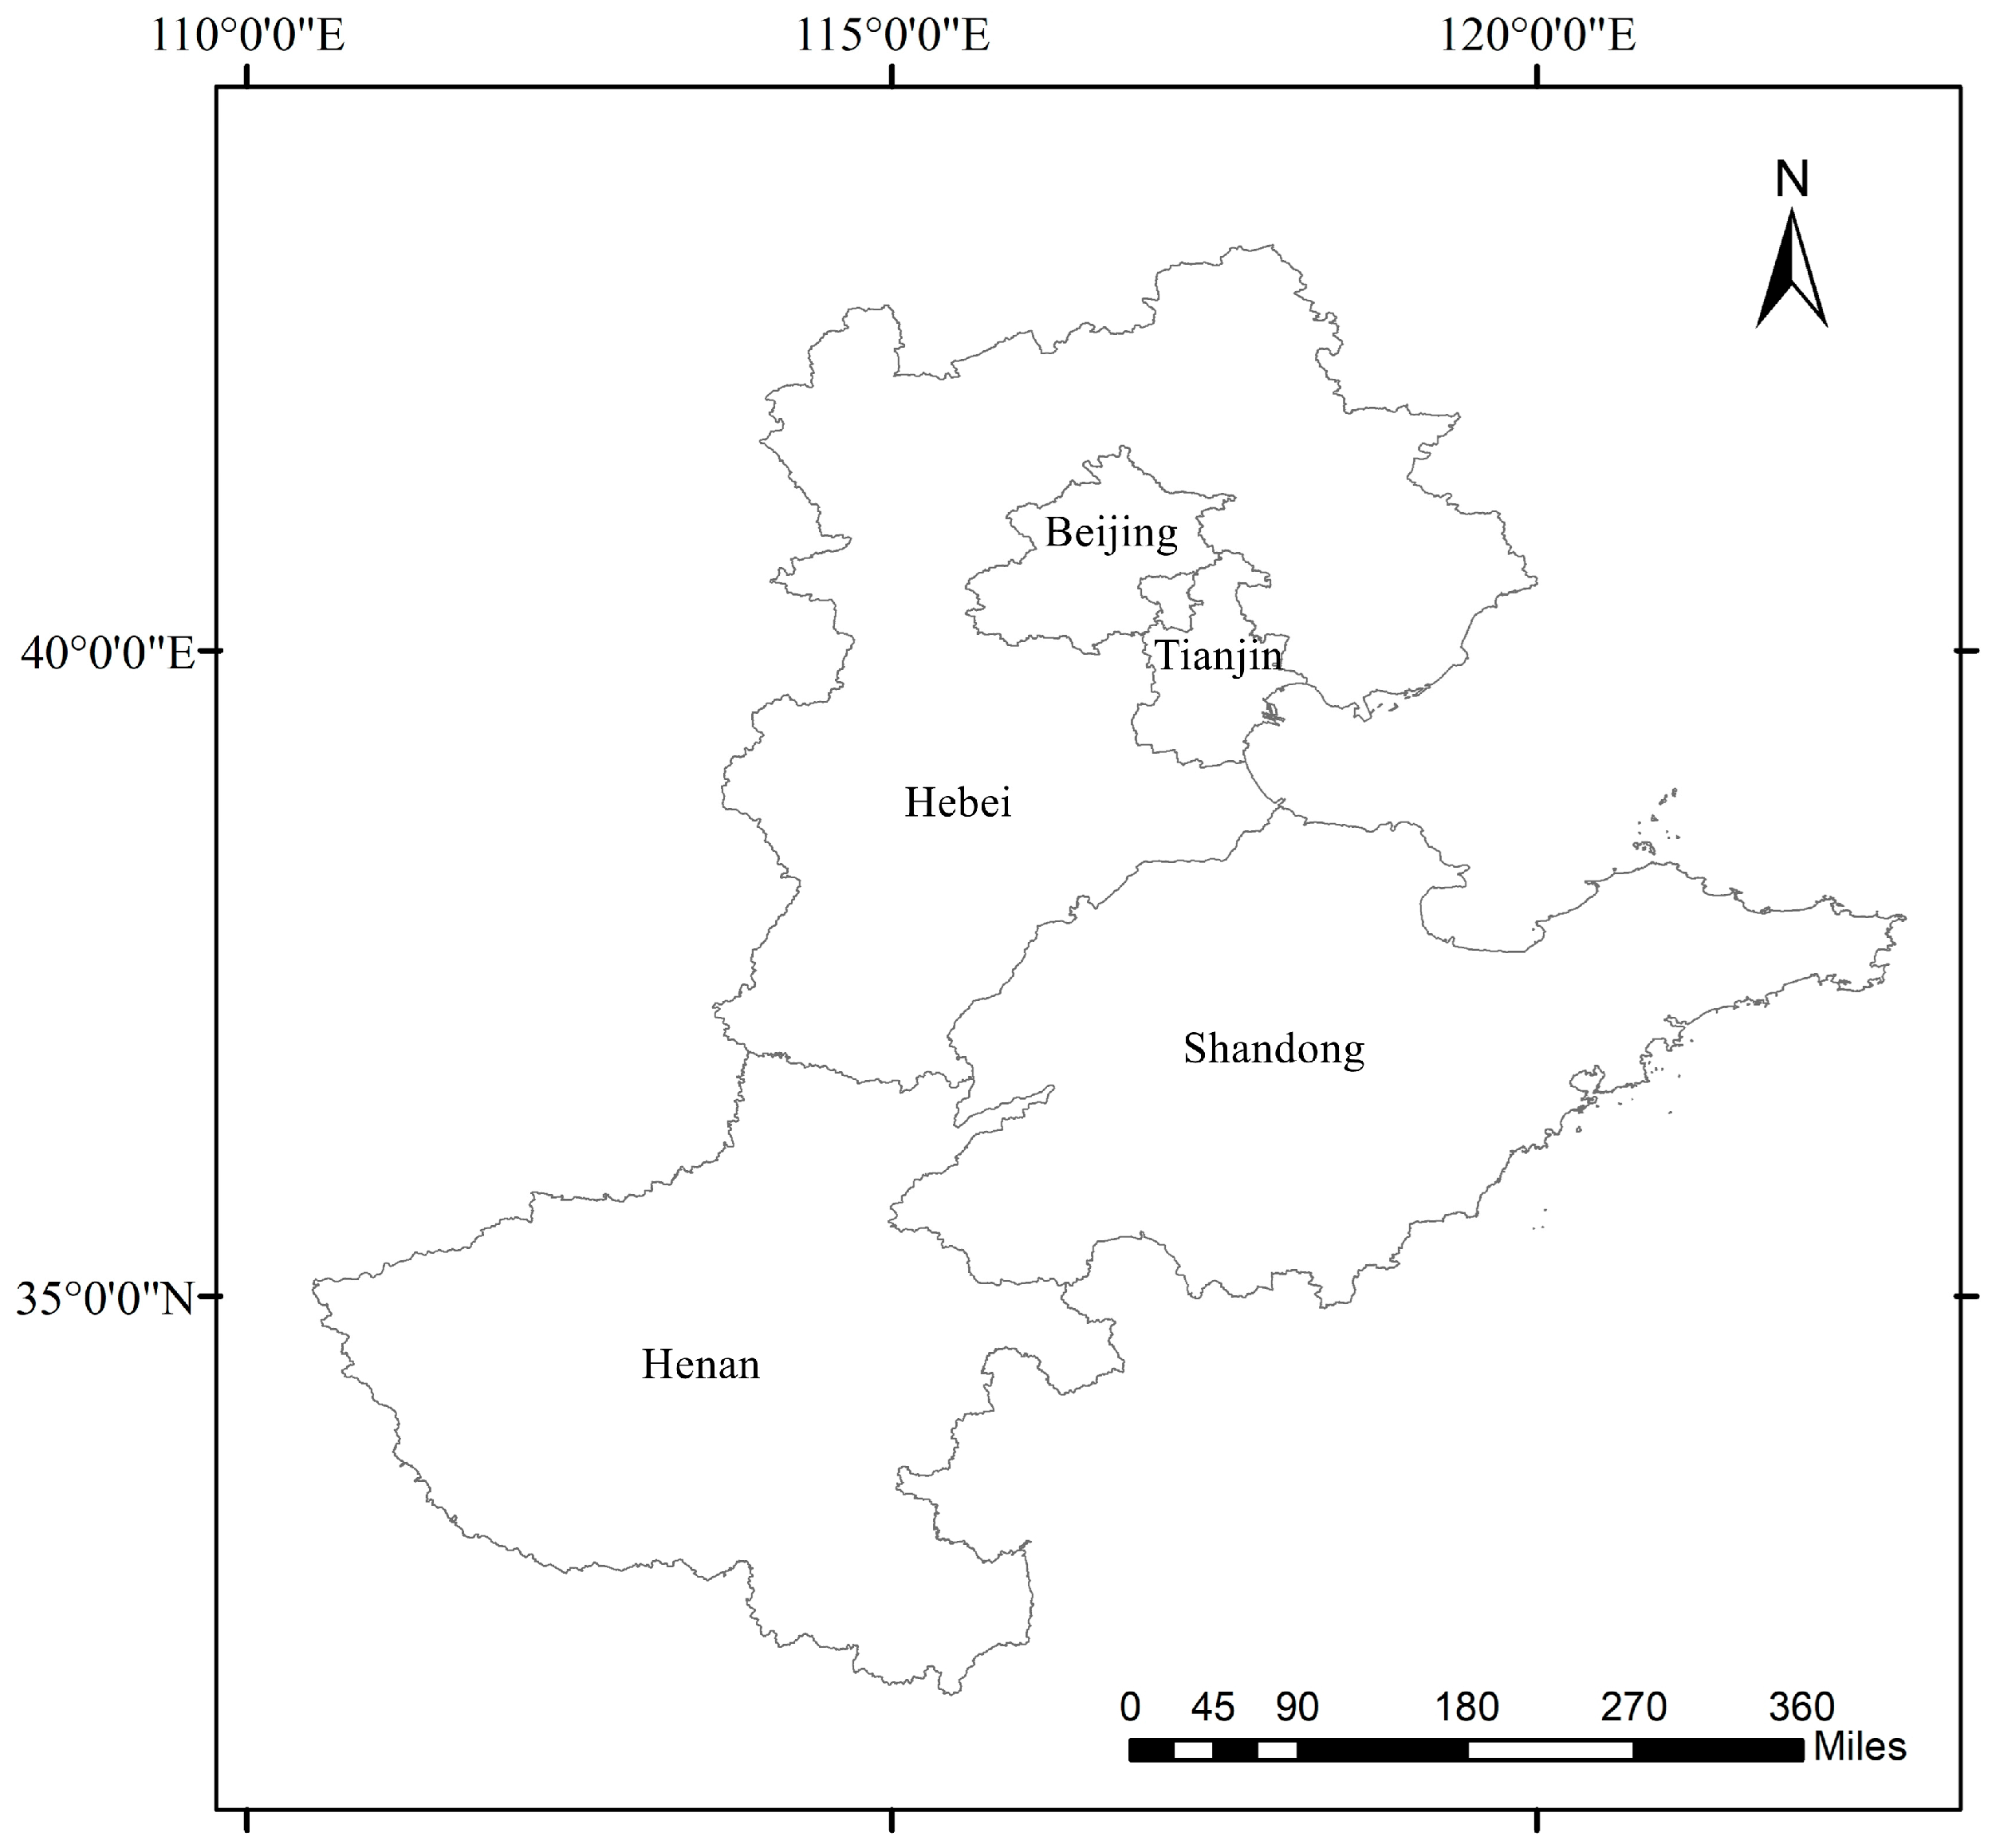
2.1. Study Area

The North China Plain (NCP) is an essential part of the vast and illustrious Great Plains of Eastern China. It spans a total area of 3.0 × 10⁵ km2, constituting 3.1% of the entire country’s land territory. This study focuses on the provinces of Beijing, Tianjin, Hebei, Shandong, and Henan located within the NCP (Figure 1). Over a ten-year period, from 2013 to 2022, the CF of essential crops such as maize, wheat, and rice was meticulously calculated throughout their entire lifecycle, from planting to harvest.

2.2. Data Sources

The data of the unit yield, total production, and sown area of maize, wheat, and rice in various provinces of the NCP were sourced from the “Statistical Yearbook” from 2014 to 2023 [17,18,19,20,21,22,23,24,25,26]. The data on crop seed, labor, plastic film, fertilizer, and other inputs were taken from the “The National Cost-Benefit Survey for Agricultural Product”, spanning the years from 2014 to 2023 [27,28,29,30,31,32,33,34,35,36]. The data on pesticide, diesel, and irrigation electricity were calculated based on the total inputs and the unit price of agricultural materials in the same collection of information and in the “China Price Yearbook” [37,38,39,40,41,42,43,44,45,46]. The amount of nitrogen fertilizer was calculated based on the usage of monovalent nitrogen fertilizer and the types and quantities of compound fertilizers used. In the analysis of the CF influencing factors, the data of the total crop output value, the total agricultural output value, the total output value of the primary industry, and the number of employed population in the primary industry all come from the “Statistical Yearbook” from 2014 to 2023.

2.3. Calculation of Agricultural Carbon Emissions

The carbon footprint (CF) serves as a pivotal environmental metric for assessing greenhouse gas emissions in a specific crop production system. The CF encompasses direct and indirect emissions. Direct emissions from wheat and maize fields primarily consist of N2O, while rice fields are associated with both N2O and CH4 emissions. In our study, the calculation of CH4 emissions from rice paddy soil was based on the emission rates determined by Huang et al. (2019) for each province [47]. Specifically, the respective CH4 emissions in Beijing, Tianjin, Hebei, Shandong, and Henan were 132.3, 113.4, 153.3, 210, and 178.5 kg ha−1, providing an accurate portrayal of the environmental impact of these crop production systems [47]. The N2O emissions were estimated using the following formula [4]:
C F N 2 O = D C F N 2 O + G C F N 2 O + L C F N 2 O
D C F N 2 O = N × F 1 × 44 28 × 273
G C F N 2 O = N × F G × F 2 × 44 28 × 273
L C F N 2 O = N × F L × F 3 × 44 28 × 273
D C F N 2 O  refers to the direct nitrogen fertilizer application-induced soil N2O emissions (kg CO2·eq·ha−1). G C F N 2 O    indicates the indirect N2O emissions caused by the volatilization of NH3 and NOx that occurs after sedimentation in agricultural soil, which are then released into the atmosphere, considered indirect N2O emissions (kg CO2·eq·ha−1). L C F N 2 O  refers to the indirect N2O emissions due to groundwater seepage (kg CO2·eq·ha−1). F1 is the direct N2O emission factor for nitrogen fertilizer input, with emission factors of 0.0042 for rice, 0.0105 for maize, and 0.0105 for wheat [48]. F2 and F3 are the direct N2O emission factors for nitrogen fertilizer input, nitrogen deposition-induced indirect N2O emissions, and groundwater seepage and runoff-induced indirect N2O emissions, with emission factors of 0.01 and 0.0075, respectively. FG represents the proportion of fertilizer in the form of volatilized NH3 and NOx (0.1 kg kg−1). FL is the proportion of nitrogen lost through groundwater seepage and surface runoff (0.3 kg kg−1). In addition, 44/28 is the ratio of the molecular weight of N2O to N2, and 273 is the global warming potential of N2O relative to CO2 on a 100-year time scale, expressed in CO2 equivalents [4].
The CF also encompasses indirect emissions that arise from various agricultural inputs such as seeds, pesticides, fertilizers, diesel fuel, irrigation electricity, plastic films, and labor throughout the entire period from crop sowing to harvesting. The calculation formula used was as follows:
C F i n d i r e c t = i = 1 n I i × C i
where Ii represents the amount of agricultural inputs, and Ci represents the corresponding CO2 emission factor for the agricultural inputs (Table 1).
The carbon footprint per unit area (CFA) and the carbon footprint per unit seed yield (CFY) were calculated as follows:
C F A = C F i n p u t + C F d i r e c t
C F Y = C F A Y
where CFinput indicates the indirect carbon dioxide equivalent emissions generated by the agricultural inputs for a certain crop, CFdirect represents the direct carbon dioxide equivalent emissions generated by CH4 and N2O from a certain crop’s farmland, and Y is the grain yield per unit area of a certain crop.
The carbon efficiency (CFE) of crop production was calculated as follows:
C F E = Y C F A
where CFA is the carbon footprint per unit area, and Y is the grain yield per unit area of a certain crop.
The Logarithmic Mean Divisia Index (LMDI) refers to a statistical analysis method that uses a statistical index system to analyze the degree of influence of various factors. This method satisfies factor reversibility, the decomposition results have no residual terms, and the additive and multiplicative decomposition models have consistent decomposition effects. It has been widely used by scholars in carbon emission research and has certain rationality. Based on the actual production process of agricultural production in China, the agricultural CO2 emissions were decomposed into predefined factors such as the carbon efficiency effect, the crop production efficiency, the agricultural structure effect, the economic development level, and the labor effect, and the extended Kaya identity and the LMDI method were applied to identify, quantify, and explain the main drivers of greenhouse gas changes [49,50].
C = C CGDP × CGDP AGDP × AGDP PGDP × PGDP P × P = CI × PI × SI × EI × LI
where C represents the greenhouse gas emissions from crop production, CGDP is the total output value of crops, AGDP is the total output value of agriculture, PGDP is the output value of the primary industry, and P represents the employment population in the primary industry. CI = C/CGDP represents the emission intensity, which refers to the ratio of greenhouse gas emissions per unit area of crop production to the total output value of crops; PI = CGDP/AGDP represents the crop production efficiency, which indicates the proportion of the total crop output in the total agricultural output; SI = AGDP/PGDP represents the production structure level, which is the proportion of the total agricultural output to the total primary industry output; EI = PGDP/P represents the economic development level, which refers to the ratio of the total primary industry output to the employment population in the primary industry; and LI represents the employment structure. The carbon efficiency effect (ΔCI) refers to the changes in crop emissions per unit area and the total crop output. The crop production effect (ΔPI) represents the changes in the proportion of crop output in the total agricultural output. The agricultural structure effect (ΔSI) refers to the changes in the proportion of agricultural output in the primary industry output. The economic development effect (ΔEI) represents changes in the ratio of labor input to economic output in the primary industry, and the labor effect (ΔLI) represents changes in the labor input. Ct and Ct−1 refer to the greenhouse gas emissions of crops at the t and t−1 periods, respectively. ΔCtotal represents the change in crop greenhouse gas emissions over a period of time. Through the additive decomposition of crop emissions, the carbon emission factor was decomposed into the following:
Δ CI = C t C t 1 ln C t ln C t 1 × ln CI t CI t 1
Δ PI = C t C t 1 ln C t ln C t 1 × ln PI t PI t 1
Δ SI = C t C t 1 ln C t ln C t 1 × ln SI t SI t 1
Δ EI = C t C t 1 ln C t ln C t 1 × ln EI t EI t 1
Δ LI = C t C t 1 ln C t ln C t 1 × ln LI t LI t 1
Δ C total = Δ CI + Δ PI + Δ SI + Δ EI + Δ LI

3. Results

3.1. Crop Yield and Sown Area

From 2013 to 2022, the grain yields of both maize and wheat in the five provinces of the NCP consistently demonstrated a steady increase. Specifically, in 2022, the yields of maize and wheat were found to be 0.5 and 0.7 t hm−2 higher than they were in 2013, respectively. On the other hand, the rice yields in these provinces initially increased but later experienced a slight decline over this same timeframe. The rice planting area in the five provinces of the NCP was relatively stable from 2013 to 2022. The maize and wheat planting areas saw a significant increase in 2017, with an increase of 0.56 million hectares and 1.8 million hectares, respectively, in the five provinces of the NCP compared to 2016. From 2013 to 2022, the overall rice yield in the five provinces remained relatively consistent, while the total yields of both wheat and maize exhibited a gradual upward trend. Notably, in 2022, the combined yields of wheat and maize in these five provinces reached 7.2 × 10⁷ t and 8.0 × 10⁷ t, respectively, which were approximately 11.9 and 10.7 times greater than the total rice yields (Figure 2).

3.2. Carbon Footprint

3.2.1. Area-Scaled Carbon Footprint

The CFA of maize, wheat, and rice demonstrated varied trends across different provinces in China from 2013 to 2022. The CFA of rice was higher than that of maize and wheat in different provinces. In Beijing and Tianjin, the CFA of maize, wheat, and rice showed a slight upward trend. Compared to the CFA of maize, wheat, and rice in 2013, the average increase in the CFA of maize, wheat, and rice in the two provinces in 2022 was 190.7, 296.1, and 36.9 kg CO2-eq hm−2. In Hebei, the CFA of rice exhibited a unique pattern, first decreasing and then increasing from 2013 to 2022. It reached a minimum of 7.8 t CO2-eq hm−2 in 2016 and peaked at 10.0 t CO2-eq hm−2 in 2020. In contrast, the CFA of maize and wheat remained relatively stable over this period. The Shandong province experienced a yearly decreasing trend in the CFA of rice from 2013 to 2022. Specifically, the CFA of rice in Shandong decreased by 7.7% in 2022 compared to the baseline year of 2013. There was a slight decrease in the CFA of maize from 2013 to 2022, while the CFA of rice showed a slight increase. In Henan, an increasing trend was observed in the CFA of maize, wheat, and rice from 2013 to 2022. Compared to the baseline year of 2013, the CFA of maize, wheat, and rice in Henan increased by 14.2%, 13.3%, and 4.1%, respectively, in 2022 (Figure 3).

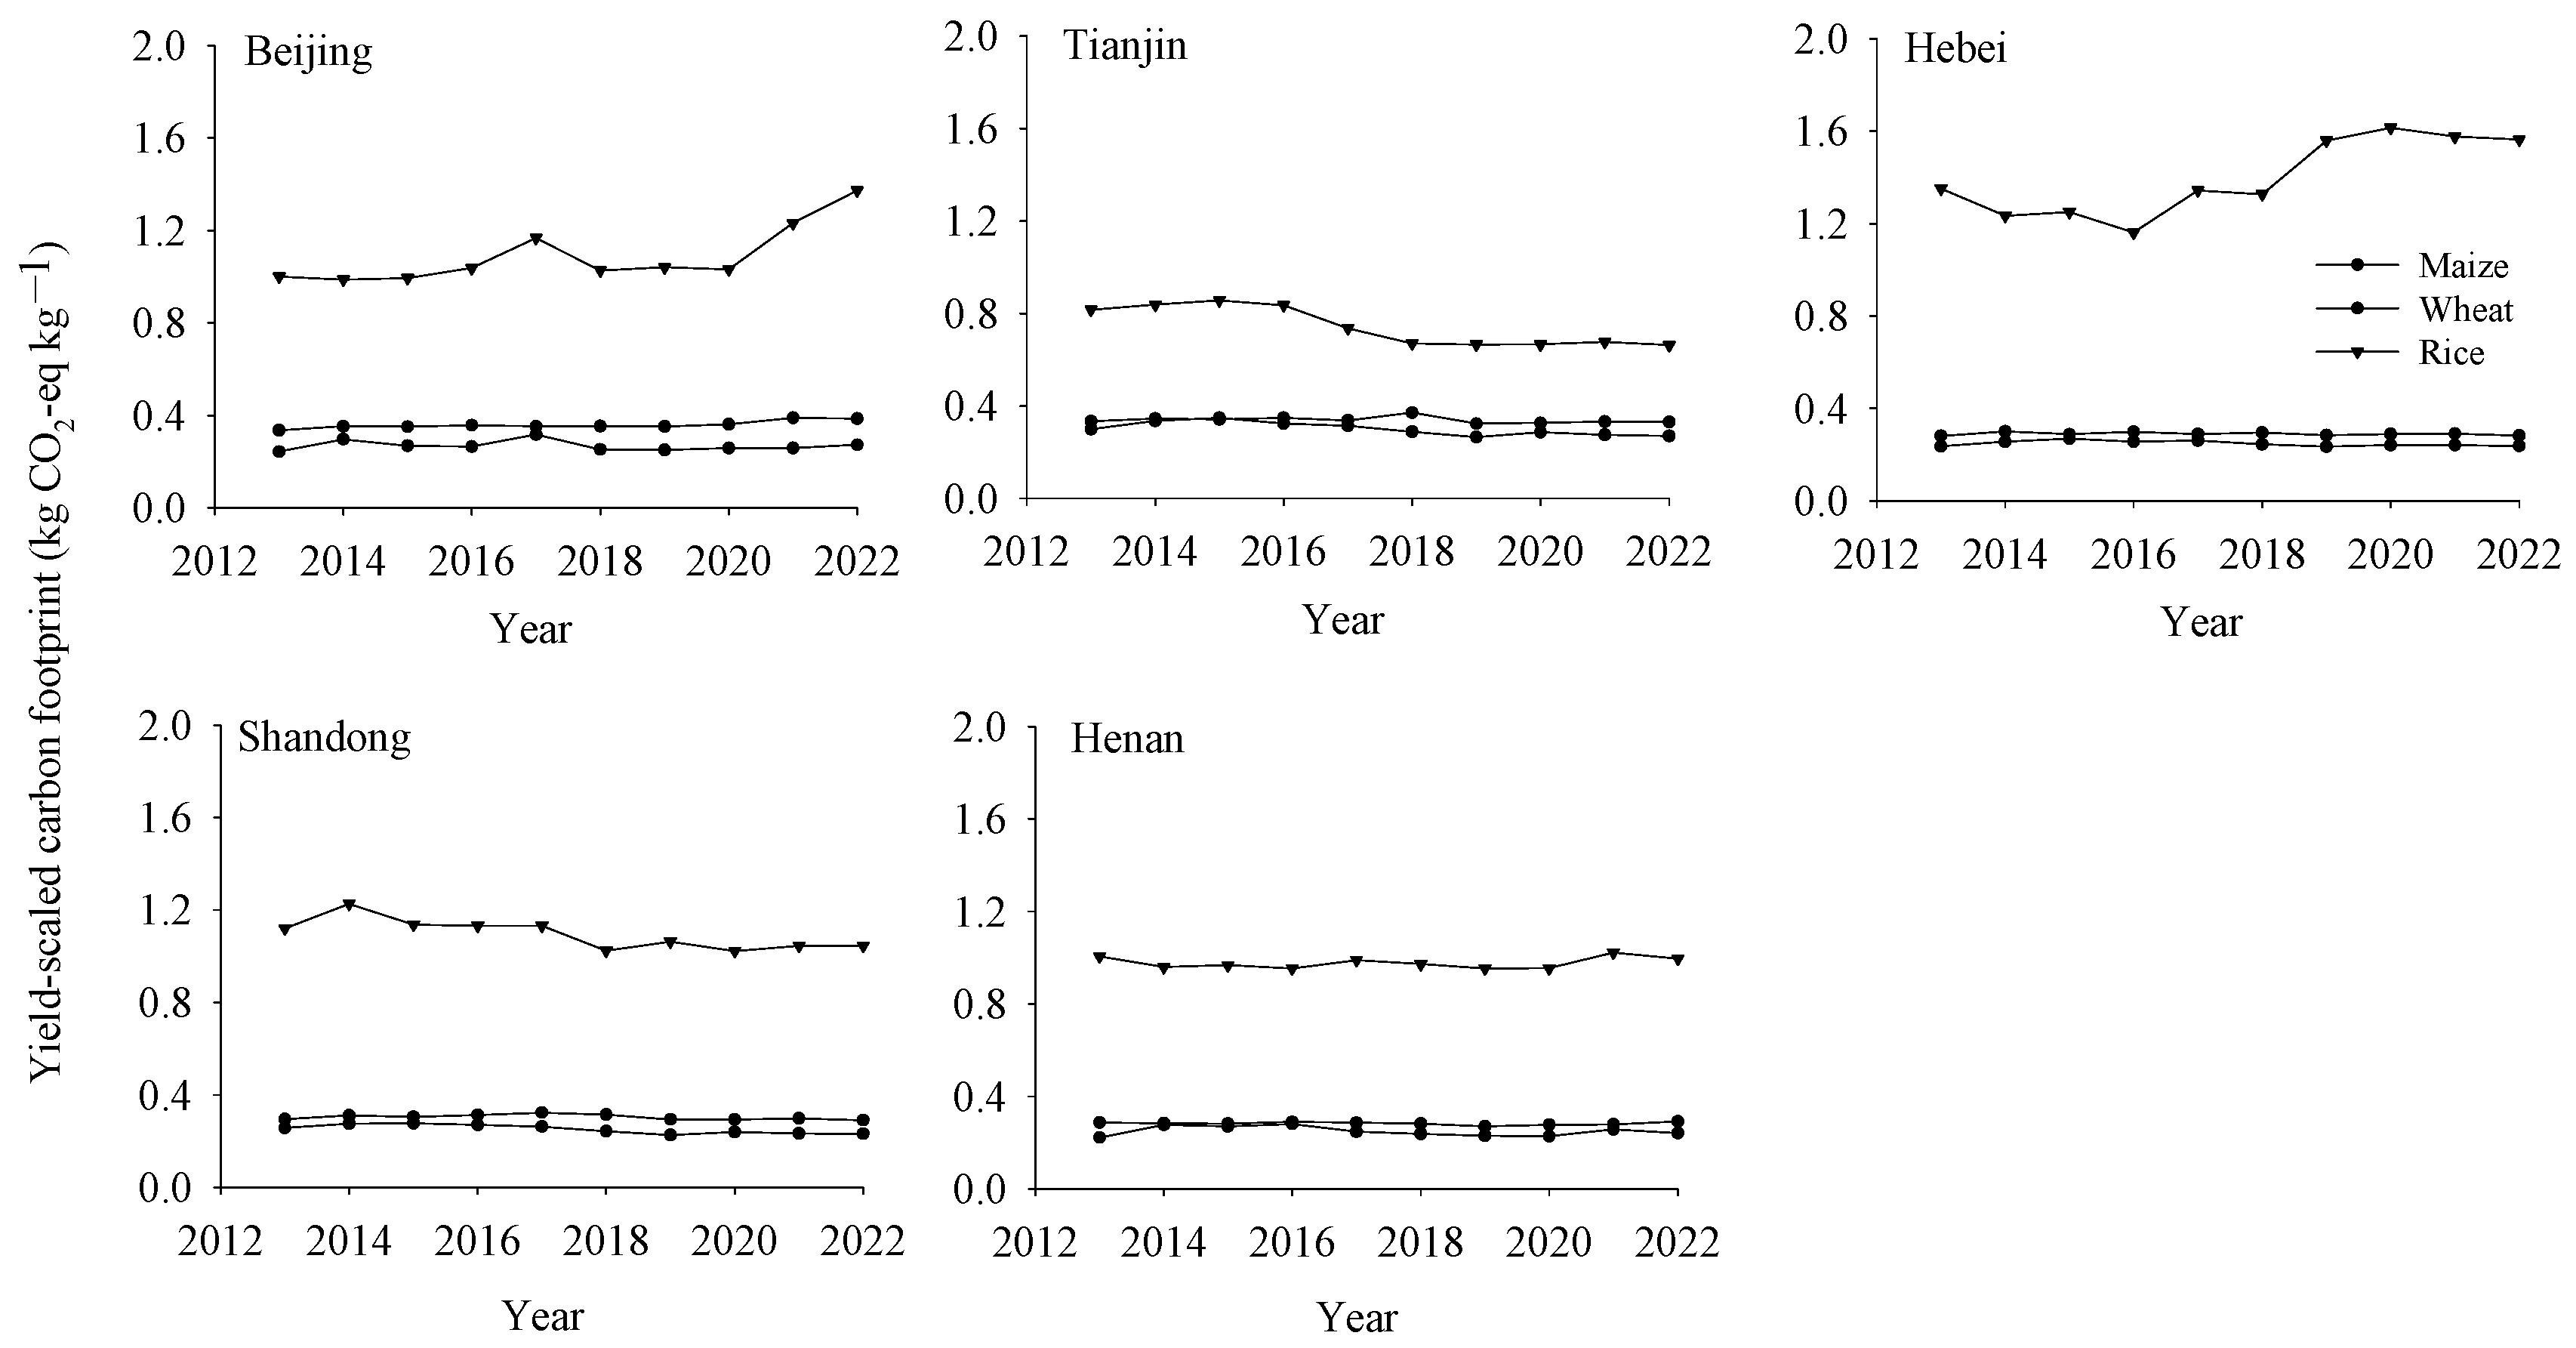
3.2.2. Yield-Scaled Carbon Footprint

The CFY of rice consistently surpassed that of maize and wheat in various provinces of the NCP. In Beijing, the CFY of maize, wheat, and rice exhibited an increasing, decreasing, and then increasing trend over the years, from 2013 to 2022. Specifically, the CFY of maize ranged from a low of 0.24 kg CO2-eq kg−1 in 2013 to a peak of 0.32 kg CO2-eq kg−1 in 2017, while the CFY of wheat peaked at 0.39 kg CO2-eq kg−1 in 2021. Notably, the CFY of rice reached a significant increase of 1.37 kg CO2-eq kg−1 in 2022, marking a 37.0% increase compared to its 2013 level. In Tianjin, a similar pattern was observed with the CFY of maize and rice increasing slightly before stabilizing or decreasing, while the CFY of wheat reached a peak in 2018 and remained relatively steady. The peak CFY for maize and rice occurred in 2015, but, by 2022, these values had decreased by 22.9% and 23.3%, respectively, compared to their 2015 levels. In Hebei, the CFY of maize and wheat exhibited minimal fluctuations over time. However, the CFY of rice demonstrated a unique pattern—decreasing initially, then increasing, and finally decreasing again—with a peak in 2020 at 1.61 kg CO2-eq kg−1. Shandong saw a general decline in the CFY of maize, wheat, and rice from 2013 to 2022. In comparison to the baseline year of 2013, the CFY of maize, wheat, and rice decreased by 11.5%, 3.3%, and 6.3%, respectively, in 2022. In Henan, the CFY of maize and rice exhibited slight fluctuations over the years, with a peak for maize in 2016 at 0.28 kg CO2-eq kg−1 and a peak for rice in 2021 at 1.02 kg CO2-eq kg−1. On the other hand, the CFY of wheat remained relatively constant from 2013 to 2022 (Figure 4).

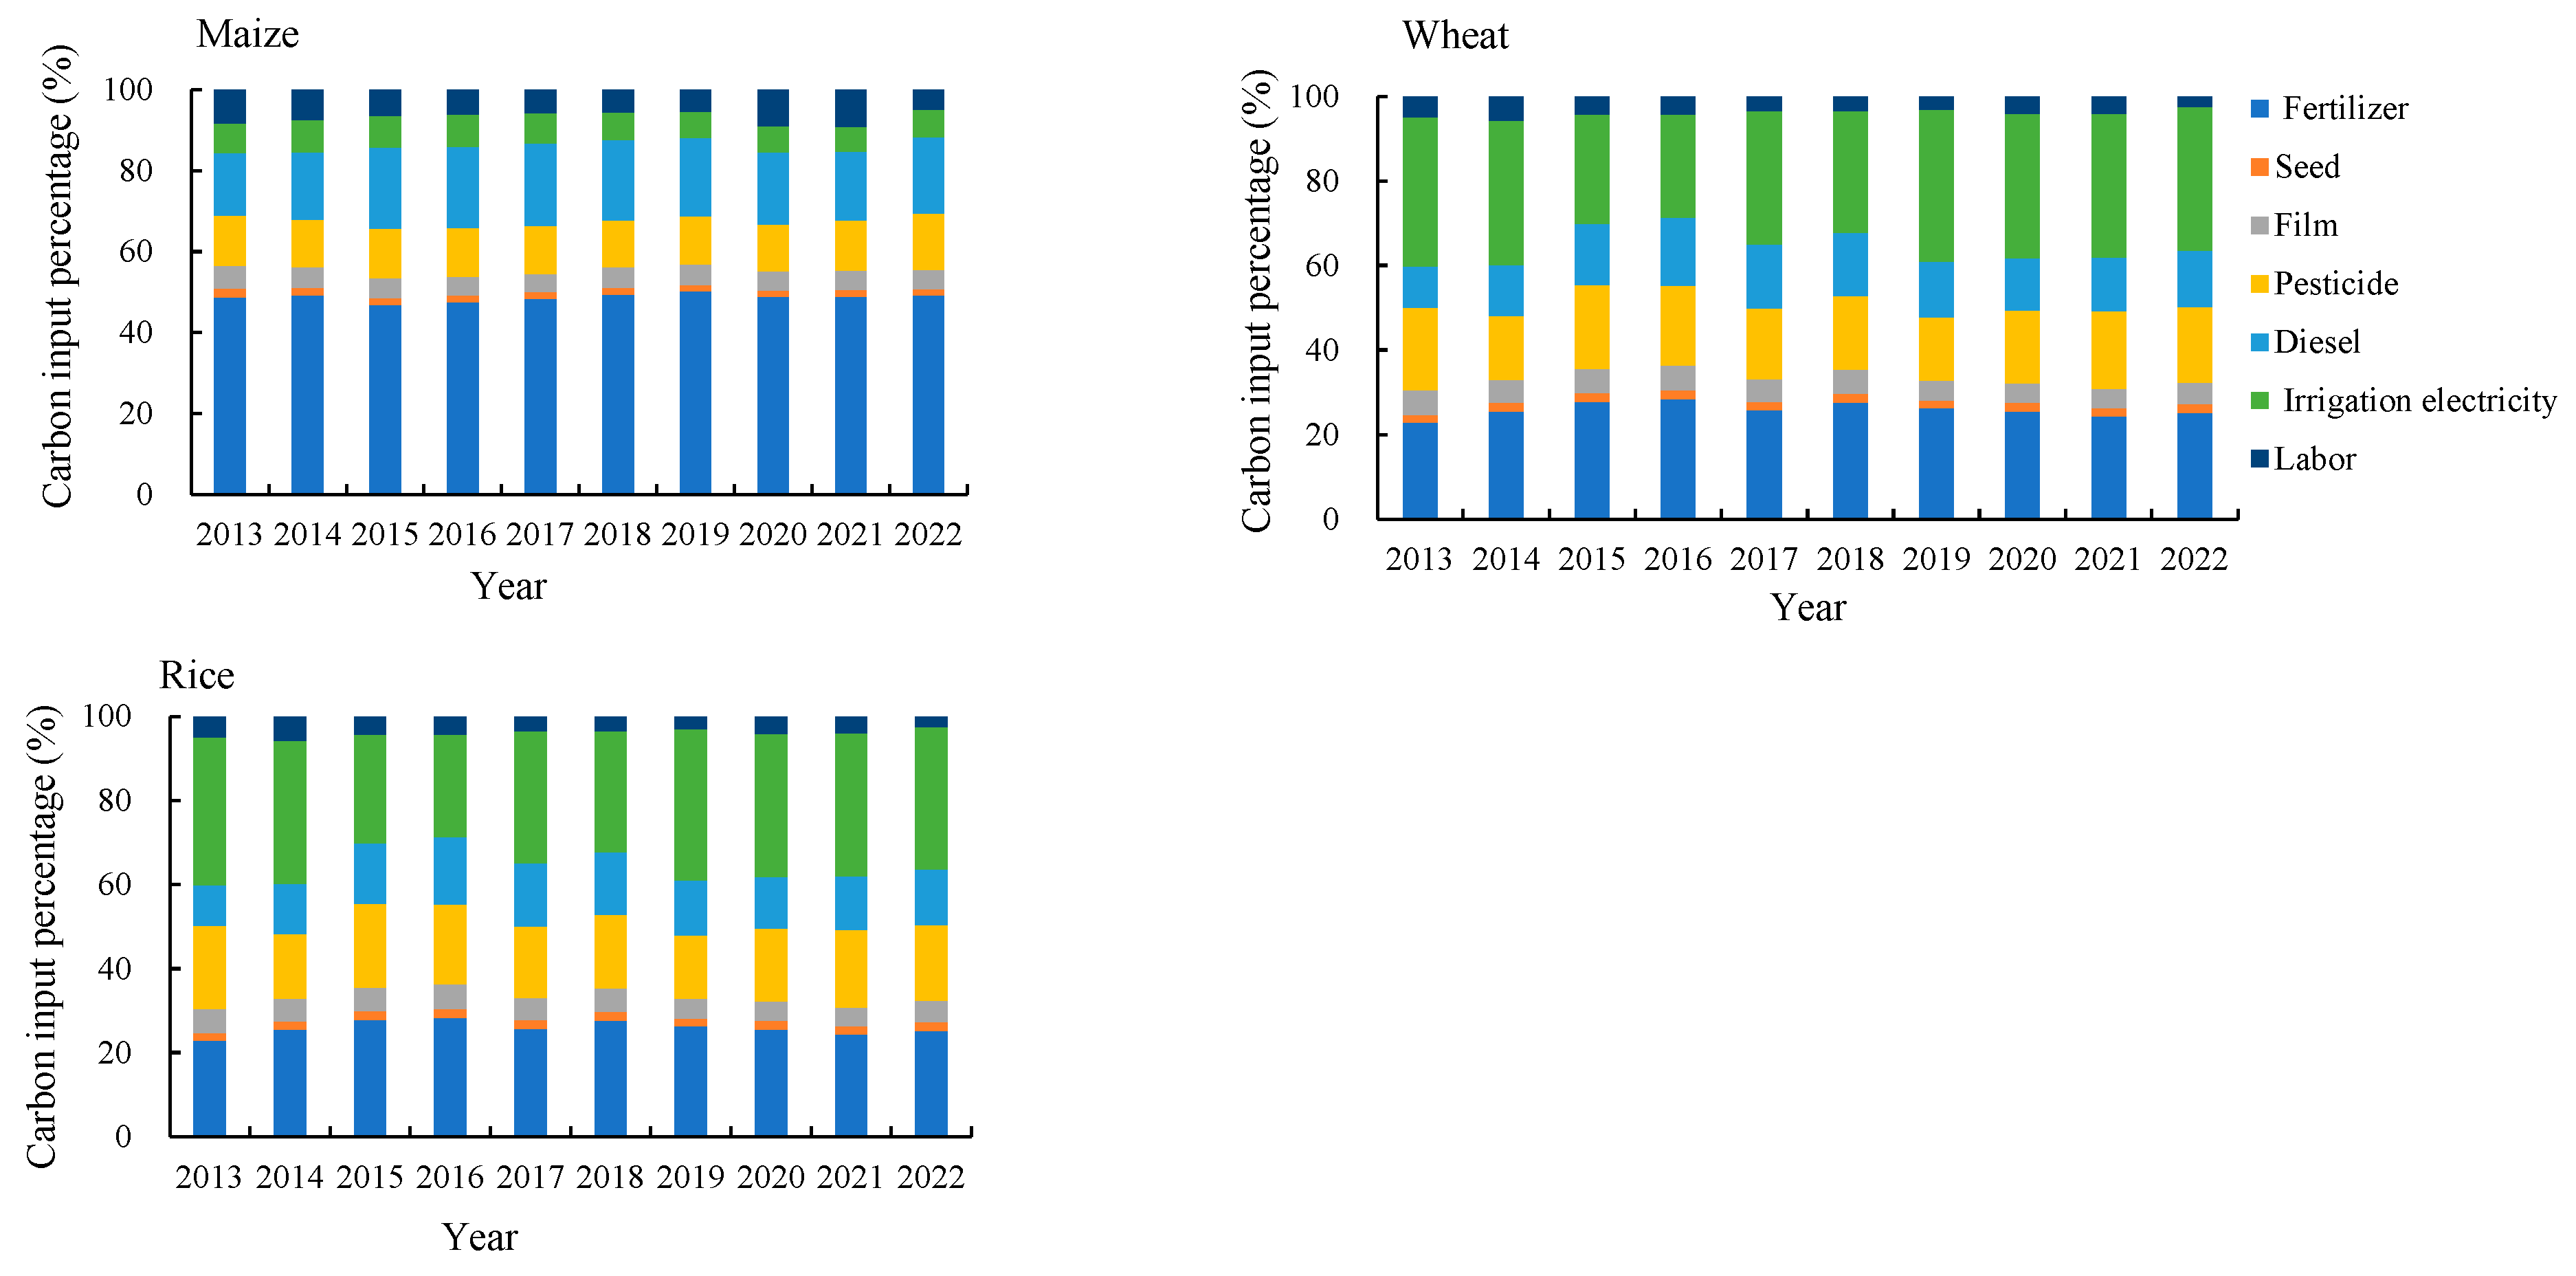
3.3. Agricultural Carbon Emissions from Different Agricultural Carbon Sources

In the NCP, the combined contribution of fertilizers, pesticides, and diesel fuel to the carbon inputs for both maize and wheat was significant, accounting for 79.5% and 77.8%, respectively. Among these inputs, fertilizer contributed the largest share, with 48.8% and 48.0% of the total carbon input for wheat and maize, respectively. Pesticide followed, with a share of 12.1% and 11.4%, while diesel fuel made up 18.6% and 18.3% of the total carbon input for wheat and maize. Over the decade from 2013 to 2022, there were minimal yearly fluctuations in the proportion of fertilizer and diesel fuel inputs in relation to wheat and maize carbon inputs. However, the proportion of pesticide inputs increased annually, with a notable increase of 1.6 and 3.9 percentage points for maize and wheat, respectively, in 2022. On the other hand, the proportion of irrigation electricity input for wheat showed a decreasing trend, decreasing by 3.6 percentage points between 2013 and 2022. In the case of rice, fertilizer, irrigation electricity, and pesticides accounted for a relatively high proportion, accounting for 25.9%, 31.8%, and 17.7% of the total carbon input, respectively. From 2013 to 2022, the proportion of fertilizer input in rice first increased then decreased, peaking at 28.4% in 2016, which was a 5.5 percentage point increase compared to 2013. The proportion of diesel input also followed a similar trend of initially increasing, subsequently decreasing, and then rising again, reaching a maximum of 15.9% in 2016, which was a 6.3 percentage point increase from the 2013 levels. In contrast, the seed, plastic film, and labor inputs accounted for only 11.3% of the total rice inputs and varied more consistently from year to year (Figure 5).

3.4. Carbon Efficiency of Crop Production

Between 2013 and 2022, the carbon efficiency of maize production in Beijing experienced a notable decline, reaching a low point of 3.15 kg kg−1 CO2-eq in 2017. This was a 23.4% decrease compared to the peak value in 2013. Conversely, the carbon efficiency of wheat and rice demonstrated a yearly downward trend, with their carbon efficiencies in 2022 being 12.8% and 27.2% lower than those in 2013, respectively. In Tianjin, the carbon efficiency of both maize and rice crop production generally showed an increasing year-on-year trend. Specifically, the peak carbon efficiency of maize production reached 3.77 kg kg−1 CO2-eq in 2019, while the carbon efficiency of rice production in 2022 was 23.0% higher than that in 2013. The carbon efficiency of wheat production in Tianjin was relatively stable overall. In Hebei, the carbon efficiency of maize production showed a trend of decreasing first and then increasing and generally tended to be stable after 2019, with the maize production carbon efficiency reaching a low point of 3.70 kg kg−1 CO2-eq in 2015. Fluctuations were observed in wheat production, while the carbon efficiency of rice production consistently declined year-on-year, with a 13.5% decrease from 2013 to 2022. The Shandong province exhibited an overall increase in the carbon efficiency of maize production from 2013 to 2022, peaking in 2019 at 4.42 kg kg−1 CO2-eq, which was 22.4% higher than in 2015. The wheat and rice production carbon efficiency of Shandong showed slight fluctuations from 2013 to 2022. The maize production carbon efficiency of Henan showed significant fluctuations from 2013 to 2022, reaching a low point of 3.56 kg kg−1 CO2-eq in 2016, which was 20.7% lower than the peak point of maize production carbon efficiency in 2013. In contrast, the carbon efficiency of both wheat and rice production demonstrated relatively minor fluctuations and generally stabilized from 2013 to 2022 (Figure 6).

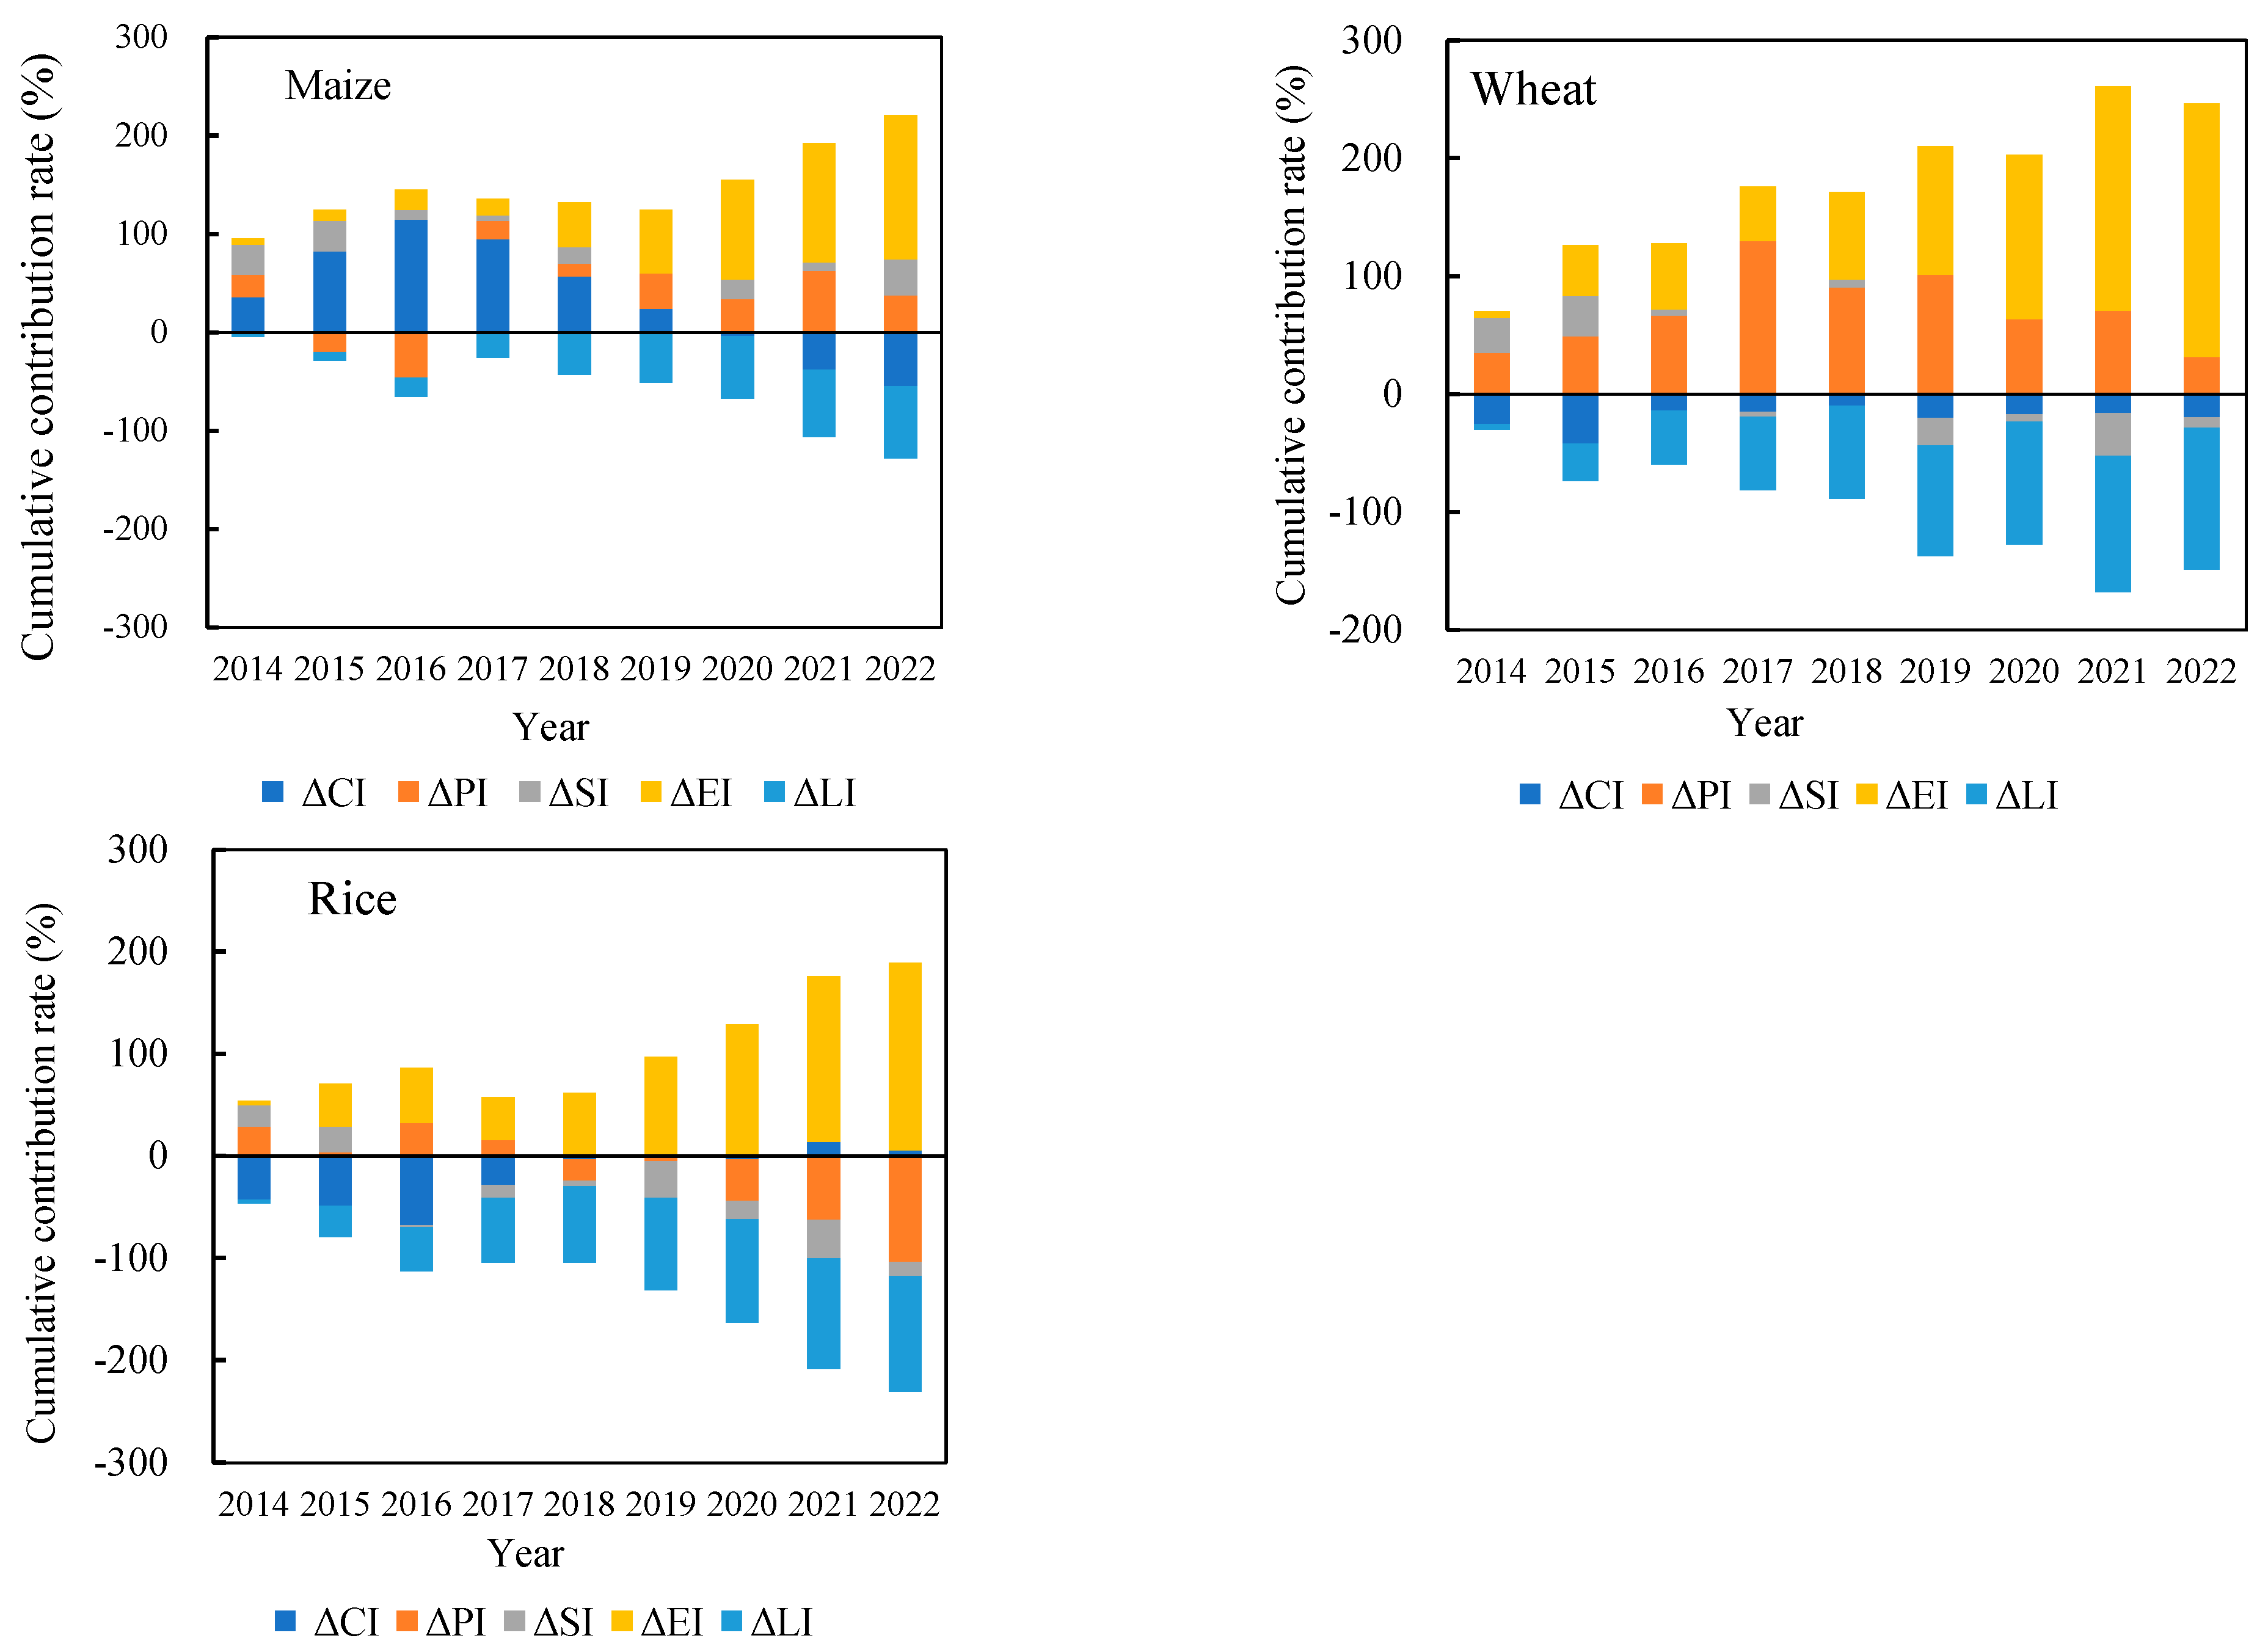
3.5. Main Influencing Factors of Agricultural Carbon Emissions

The CI and LI were inhibitory factors for maize carbon emissions, while the PI, SI, and EI were driving factors. Specifically, in the period from 2014 to 2015, the CI acted as a driving factor but shifted to an inhibitory factor between 2017 and 2022. As a result, the reduction in carbon emissions due to CI and LI was estimated at 5.08 × 10⁶ t and 4.23 × 10⁶ t, respectively. Conversely, the increase in carbon emissions caused by the PI, SI, and EI was 2.97 × 10⁶ t, 7.46 × 10⁵ t, and 8.61 × 10⁶ t, respectively. The combined effect of these five factors led to a total increase in carbon emissions of 3.01 × 10⁶ t. From 2014 to 2022, the EI’s contribution to the increase in maize carbon emissions stood out as the highest, at 146.6% (Table 2). In contrast, the contribution rate of the LI was the lowest, with a negative value of −73.3% (Table 2; Figure 7).
From 2014 to 2022, the CI, PI, and LI collectively acted as factors that contributed to the reduction in wheat carbon emissions. Conversely, the SI and EI were identified as driving forces for increased emissions. The reduction in wheat carbon emissions attributed to the CI, PI, and LI was estimated at 4.60 × 10⁵ t, 3.80 × 10⁶ t, and 5.70 × 10⁶ t, respectively. The increase in wheat carbon emissions due to the SI and EI was 1.04 × 10⁶ t and 1.16 × 10⁷ t, respectively. In total, the combined effect of these five factors resulted in an increase in the wheat carbon emissions of 2.67 × 10⁶ t over the observed decade (Table 3). Among these factors, the EI stood out as the primary contributor to the increase in wheat carbon emissions, with a contribution rate of 215.1%. In contrast, the contribution rate of the LI was the lowest, with a negative value of −120.2% (Table 3; Figure 7).
From 2014 to 2022, the PI and SI played a role in reducing rice carbon emissions, while the CI, SI, and EI were driving forces for increased emissions. Specifically, the reduction in rice carbon emissions caused by the PI was 3.15 × 10⁶ t and that caused by the SI was 1.77 × 10⁶ t. The increase in rice carbon emissions caused by the CI, SI, and EI was 6.89 × 10⁵ t, 3.21 × 10⁵ t, and 3.60 × 10⁶ t, respectively. The combined effect of these five factors resulted in a net decrease of 3.09 × 10⁵ t in rice carbon emissions over the observed decade (Table 4). Among these factors, the EI contributed the most to rice carbon emissions, with a contribution rate of 183.6%, while the LI contributed the least, with a contribution rate of −112.9% (Table 4; Figure 7).

4. Discussions

4.1. Changes in Maize, Wheat, and Rice Yields, Sown Area, and Agricultural Inputs in the NCP

As the foremost grain crop production region in China, the NCP accounts for over 50% of the national wheat cultivation area and 26.5% of the maize cultivation area [17,18,19,20,21,22,23,24,25,26]. From 2013 to 2022, the NCP consistently witnessed an increase in both the yield and total production of wheat and maize, primarily attributed to the enhancement of crop varieties and the optimized management of water and fertilizers [51]. The expansion of the maize planting area in this period consequently led to a surge in the total maize production (Figure 1). Interestingly, this increasing maize planting area in the NCP was inversely correlated with the decrease in the soybean planting area. The efficiency and scale advantage index of soybean in this region continued to decline due to the low yield per unit area, which affected farmers’ planting enthusiasm [52]. The significant improvement in the maize yield per unit area and the expansion of the area, together, resulted in the increase in the total maize production [52]. The rice planting area in the NCP was relatively small, accounting for less than 3% of the total rice planting area. The scarcity of water resources and economic factors in the NCP have led to a decrease in the rice planting area [53].
Throughout the crop lifecycle in the NCP, the fertilizer, pesticide, diesel, and irrigation electricity inputs were the primary sources of carbon emissions for maize, wheat, and rice. Although fluctuations in the fertilizer inputs for maize, wheat, and rice were relatively minor due to the national “zero growth” in fertilizer policies from 2013 to 2022, the fertilizer inputs still remained the largest contributor to carbon emissions in the NCP [54]. Hence, future efforts to reduce agricultural carbon emissions in the NCP should prioritize fertilizer innovation, implement integrated nutrient management, increase fertilizer utilization rates, and reduce fertilizer inputs [55]. This strategic approach is crucial for mitigating carbon emissions and promoting sustainable agricultural practices in the NCP.

4.2. Changes in the CF of Maize, Wheat, and Rice Production in the NCP and Their Influence Factors

The CFY of wheat and maize in the NCP demonstrated a relatively stable trend from 2013 to 2022. However, the CFY of rice experienced significant fluctuations, exhibiting diverse patterns across various provinces. Specifically, there was a gradual increase in the CFY of rice in Hebei and Beijing over the observed decade. By analyzing the carbon input structure and rice production in these two provinces, it was found that the irrigation electricity input in Hebei increased gradually after 2016, while the rice production in Beijing showed a decreasing trend from 2013 to 2022. In addition, the CFY of rice in Tianjin and Shandong has also shown a decreasing trend over the years, mainly due to the increasing yield per unit area. Among the three crops in the NCP, the CFY of rice from 2013 to 2022 was the highest (1.06 kg CO2-eq kg−1), followed by maize (0.32 kg CO2-eq kg−1) and, lastly, wheat (0.26 kg CO2-eq kg−1) (Figure 4). This study’s findings were slightly below the national average reported by previous research. For instance, Cheng et al. (2015) documented that the CFY of rice, wheat, and maize production in China was 1.36, 0.51, and 0.44 kg CO2-eq kg−1, respectively [56]. Chen et al. (2014) reported similar values, with a slight variation in the wheat and maize CFY at approximately 1.38, 0.63, and 0.44 kg CO2-eq kg−1, respectively [55]. Additionally, studies by Liu et al. (2017) and Zhang et al. (2017) confirmed that the CFY in the NCP was generally lower than the national average [57,58]. In comparison to other countries like the United States and India, the grain crops in the NCP exhibit higher CFs. For instance, Snyder et al. (2009) found that the CFY for maize in the United States ranged from 0.12 to 0.25 kg CO2-eq kg−1, while, for wheat, it was between 0.25 and 0.35 kg CO2-eq kg−1 [59]. Similarly, Pathak et al. (2010) noted that the CFY for wheat in India was approximately 0.12 kg CO2-eq kg−1 [60]. The primary reason for these differences in the CFs between the NCP and other countries was attributed to variations in farming practices and other factors. Countries like the United States, with lower nitrogen fertilizer inputs and higher levels of agricultural mechanization, had significantly lower CFs compared to the NCP. Therefore, there was great potential for optimization in the grain production practices in the NCP.
Carbon emissions from staple crops were affected by various factors. According to the results of the LMDI decomposition analysis, it is evident that the labor effect frequently acted as a mitigating factor for carbon emissions stemming from the three primary grain crops in the NCP. Over the past ten years, a general downward trend has been observed in carbon emissions under this influence, suggesting a reduction in the number of individuals engaged in agricultural labor in the region. This could potentially be attributed to urbanization and land transfers across various regions of the plain [61]. This also implied a positive outcome of improved production efficiency [62]. Pata et al. (2021) also found that human capital plays a key role in reducing environmental degradation in China [63]. The economic development effect was a common driving factor for carbon emissions derived from maize, wheat, and rice in the NCP. This indicated rapid growth in the production inputs and per capita agricultural production, highlighting that the economic effect was a key driver of carbon emissions from grain crop production in the NCP. Economic growth will lead to an increase in carbon emissions from grain crop cultivation. Consequently, there is a need to improve production efficiency and continuously reduce carbon emissions through agricultural science and technology innovations [12,63]. Furthermore, the crop production effect acted as a suppressing factor for wheat and rice carbon emissions, and this trend has been fluctuating over the past decade. This indicated that the proportion of economic crops in the total agricultural output was increasing, aiming to enhance farmers’ income and adjust planting structures [64]. In conclusion, while ensuring grain crop production in the NCP, the scientific adjustment of grain crop industrial structures, the adoption of modern low-carbon planting technologies, and renewable energy consumption can ensure the high-quality and green development of grain crop production in the region [65,66].

4.3. Carbon Emission Reduction Measures and Prospects for Grain Crops in the NCP

Ensuring food security, dealing with the climate warming caused by greenhouse gas emissions, and environmental degradation are challenges faced by all countries in the world today [67]. As one of the largest developing countries in the world, China’s grain production has a crucial impact on global food security and climate change [68]. Reducing the CF of grain production in China will not only help slow down global warming and promote sustainable agricultural development but also protect natural resources, promote economic development, and improve food security [69]. Currently, the utilization of agricultural production materials in China surpasses that in Western developed nations. To reduce the CF of crop production, it is crucial to decrease the quantity of the materials used and enhance their utilization efficiency [70]. There is a significant opportunity to reduce emissions from grain crops within the NCP. Fertilizer, an important contributor to the CF, is applied in large quantities and has a low utilization rate in the NCP [55]. Optimizing fertilization practices and implementing comprehensive nutrient management can greatly enhance fertilizer efficiency, thus considerably reducing the CF of rice and maize production [71]. Studies have shown that reducing nitrogen fertilizer application by 30% would reduce the CF of rice and maize by 6.5% and 25.5%, respectively [56]. Similarly, a 20% reduction in nitrogen fertilizer application while maintaining grain yield could result in a 7.6%, 12.7%, and 11.1% reduction in the CF of rice, wheat, and maize, respectively [72]. Furthermore, strategic reductions in the chemical nitrogen fertilizer application rates (between 19% and 25%) combined with optimized nitrogen fertilizer management measures could not only increase crop yields but also significantly reduce their carbon footprints by up to 37%–59% [55]. Therefore, improving the fertilizer utilization rate, paying attention to fertilizer types and application methods, and reducing fertilizer application are key to reducing the CF of agricultural production in the NCP [73]. Pesticides are an important component of crop production’s CF. This study highlighted that pesticide input contributed significantly to carbon emissions in wheat, maize, and rice, accounting for 12.1%, 11.4%, and 17.7% of carbon emissions from agricultural inputs, respectively. Therefore, reducing pesticide application and enhancing their efficacy are crucial for mitigating carbon emissions. Moreover, irrigation is the largest field use in agricultural production. Scientific and reasonable irrigation strategies can reduce carbon emissions while increasing crop yield. Water-saving irrigation measures in the NCP could effectively reduce wheat and maize CFs and environmental costs [74]. During rice cultivation, intermittent irrigation technology can be used to reduce farmland carbon emissions while improving water-use efficiency [75]. With the rapid progress of agricultural modernization and the enhancement of the agricultural mechanization levels, the rise in diesel consumption associated with agricultural machinery usage will inevitably lead to an increase in carbon emissions. Consequently, there is an urgent need to increase the utilization rate of agricultural machinery, prolong its service life, and address the pressing issue of carbon emission reduction [76,77,78].
Soil carbon storage stands as the largest carbon sink in all terrestrial ecosystems worldwide. By implementing practices such as straw returning and protective tillage, farmers can effectively contribute to carbon sequestration and reduce farmland carbon emissions [75,79]. Additionally, enhancing grain yields through the selection of high-yielding, low-carbon varieties and optimizing planting patterns can increase crop production while mitigating carbon emissions from agricultural activities [80]. As the agricultural industry scale continues to expand in the NCP, the emission reduction pressure on grain production will intensify. Under the process of agricultural modernization, reducing agricultural production material inputs and improving utilization rates can effectively reduce carbon emissions and achieve low-carbon agricultural development.

4.4. Limitations of This Study

In this study, we relied on data from the “The National Cost-Benefit Survey for Agricultural Product” for our agricultural input information. However, some of the data encountered were incomplete or missing, necessitating conversion before use. Since reliable carbon emission factors for wheat, maize, and rice inputs in the NCP were not available, we had to rely on data from the Chinese Life Cycle Database. This introduced uncertainties in our carbon emission calculations due to regional differences. Soil carbon sequestration is also a crucial aspect of CF calculations. While practices like straw returning and organic fertilizer application influence soil carbon fixation, there was a lack of measured data on soil carbon sequestration in the NCP [81]. Additionally, there was significant uncertainty when using models to estimate it. Therefore, this study did not consider the impact of soil carbon sequestration on the CFs. In the future, we aim to conduct field monitoring efforts of soil carbon sequestration and identify suitable agricultural input carbon emission factors for the NCP. This would provide more accurate data and support the low-carbon development of crop production in the NCP.

5. Conclusions

This study employed the LCA method and the LMDI model to analyze the changes in the CFs of maize, wheat, and rice and their influencing factors in the NCP from 2013 to 2022. Effective measures for carbon reduction in grain crops in the NCP were proposed. The results indicated that there was a consistent upward trend in the yield and overall production of wheat and maize, while the sown area and total production of rice cultivation remained stable. The rice yield reached its peak in 2018 at 7.91 t hm−2. The CFA of wheat, maize, and rice showed an increasing trend from 2013 to 2022, while the CFY tended to be stable. The CFA and CFY of rice were higher than those of maize and wheat. Fertilizers contributed the most to the carbon input structure, accounting for 48.8%, 48.0%, and 25.9% of the total carbon inputs for wheat, maize, and rice, respectively. The labor effect was a common suppressing factor for the carbon emissions of maize, wheat, and rice in the NCP, while the agricultural structure effect and the economic development effect were common driving factors.
After conducting a thorough analysis of the factors that contribute to the CF, this study suggested that, by enhancing the efficiency of fertilizer and pesticide usage, introducing new crop varieties, improving mechanical operation and irrigation efficiency, and providing policy support, it is possible to effectively reduce the CF of grain crop production in the NCP.
Although the methods used in this study had limitations, the accuracy of CF estimation can be improved in the future by improving statistical data, field observation data, and optimizing carbon emission coefficients. In general, this study provided a basis for achieving energy conservation, emission reduction, and the development of low-carbon agriculture in grain crops in the NCP.

Author Contributions

Conceptualization, T.S., H.L., Z.Z., L.Y. and X.G.; methodology, H.L., R.L. and Z.Z.; software, L.Y. and X.G.; formal analysis, R.L.; investigation, T.S., C.W. and B.G.; resources, H.L., Z.Z. and X.G.; data curation, T.S. and C.W.; writing—original draft, T.S., H.L., C.W. and B.G.; writing—review and editing, T.S., H.L., R.L., L.Y. and X.G.; visualization, H.L., Z.Z. and B.G.; project administration, X.G.; and funding acquisition, T.S. and L.Y. All authors have read and agreed to the published version of the manuscript.

Funding

This research was supported by the Natural Science Foundation of the Shandong Province (grant no. ZR2023QC064), the Agricultural Scientific and Technological Innovation Project of the Shandong Academy of Agricultural Sciences (grant no. CXGC2024A06, CXGC2024F04), the National Key R&D Plan Project (grant no. 2023YFD1902701-2,2021YFD1900190306), the Technical System of Ecological Agriculture of Modern Agricultural Technology System in the Shandong Province (SDAIT-30-01), the Smart Fertilization Project (grant no. 5), and the Key R&D Plan of the Shandong Province (grant no. 2022TZXD0039-3).

Data Availability Statement

The original contributions presented in this study are included in the current article; further inquiries can be directed to the corresponding authors.

Conflicts of Interest

The authors declare that they have no known competing financial interests or personal relationships that could have appeared to influence the work reported in this paper.

References

  1. Collins, M.; Chandler, R.E.; Cox, P.M.; Huthnance, J.M.; Rougier, J.; Stephenson, D.B. Quantifying future climate change. Nat. Clim. Chang. 2012, 2, 403–409. [Google Scholar] [CrossRef]
  2. West, J.J.; Smith, S.J.; Silva, R.A.; Naik, V.; Zhang, Y.; Adelman, Z.; Fry, M.M.; Anenberg, S.; Horowitz, L.W.; Lamarque, J.F. Co-benefits of mitigating global greenhouse gas emissions for future air quality and human health. Nat. Clim. Chang. 2013, 3, 885–889. [Google Scholar] [CrossRef] [PubMed]
  3. Dai, H.; Masui, T. Achieving Carbon Emissions Peak in China by 2030: The Key Options and Economic Impacts. In Post-2020 Climate Action; Fujimori, S., Kainuma, M., Masui, T., Eds.; Springer: Singapore, 2017. [Google Scholar]
  4. Forster, P.; Storelvmo, T.; Armour, K.; Collins, W.; Dufresne, J.L.; Frame, D.; Lunt, D.J.; Mauritsen, T.; Palmer, M.D.; Watanabe, M.; et al. The Earth’s Energy Budget, Climate Feedbacks, and Climate Sensitivity. In Climate Change 2021: The Physical Science Basis. Contribution of Working Group I to the Sixth Assessment Report of the Intergovernmental Panel on Climate Change; Masson-Delmotte, V., Zhai, P., Pirani, A., Connors, S.L., Péan, C., Berger, S., Caud, N., Chen, Y., Goldfarb, L., Gomis, M.I., et al., Eds.; Cambridge University Press: Cambridge, UK; New York, NY, USA, 2021; pp. 923–1054. [Google Scholar]
  5. Vermeulen, S.J.; Campbell, B.M.; Ingram, J.S.I. Climate change and food systems. Annu. Rev. Env. Resour. 2012, 37, 195–222. [Google Scholar] [CrossRef]
  6. Han, H.; Zhong, Z.; Guo, Y.; Xi, F.; Liu, S. Coupling and decoupling effects of agricultural carbon emissions in China and their driving factors. Environ. Sci. Pollut. Res. 2018, 25, 25280–25293. [Google Scholar] [CrossRef] [PubMed]
  7. Wright, L.A.; Kemp, S.; Williams, I. ‘Carbon footprinting’: Towards a universally accepted definition. Carbon Manag. 2011, 2, 61–72. [Google Scholar] [CrossRef]
  8. Gan, Y.; Liang, C.; Hamel, C.; Cutforth, H.; Wang, H. Strategies for reducing the carbon footprint of field crops for semiarid areas. A review. Agron. Sustain. Dev. 2011, 31, 643–656. [Google Scholar] [CrossRef]
  9. Yang, X.; Gao, W.; Zhang, M.; Chen, Y.; Sui, P. Reducing agricultural carbon footprint through diversified crop rotation systems in the North China Plain. J. Clean. Prod. 2014, 76, 131–139. [Google Scholar] [CrossRef]
  10. Cheng, K.; Pan, G.X.; Smith, P.; Luo, T.; Li, L.Q.; Zhang, J.W.; Zhang, X.H.; Han, X.J.; Yan, M. Carbon footprint of China’s crop production-an estimation using agro statistics data over 1993–2007. Agric. Ecosyst. Environ. 2011, 142, 231–237. [Google Scholar] [CrossRef]
  11. Huang, W.; Wu, F.; Han, W.; Li, Q.; Han, Y.; Wang, G.; Feng, L.; Li, X.; Yang, B.; Lei, Y.; et al. Carbon footprint of cotton production in China: Composition, spatiotemporal changes and driving factors. Sci. Total Environ. 2022, 821, 153407. [Google Scholar] [CrossRef]
  12. He, R.; Dong, J.; Zhang, X.; Zheng, F.; Hu, Z. Dynamic Analysis of the Carbon Footprint in Winter Wheat Production Based on Lifecycle Assessment and the LMDI Model: A Case Study of Jiangsu Province in China. Sustainability 2023, 15, 12396. [Google Scholar] [CrossRef]
  13. Duan, H.; Zhang, Y.; Zhao, J.; Bian, X. Carbon footprint analysis of farmland ecosystem in China. J. Soil Water Conserv. 2011, 25, 203–208. (In Chinese) [Google Scholar]
  14. Wang, Z.; Wang, M.; Chen, F. Carbon footprint analysis of crop production in North China Plain. Sci. Agric. Sin. 2015, 48, 83–92. (In Chinese) [Google Scholar]
  15. Hillier, J.; Hawes, C.; Squire, G.; Hilton, A.; Wale, S.; Smith, P. The carbon footprints of food crop production. Int. J. Agric. Sustain. 2009, 7, 107–118. [Google Scholar] [CrossRef]
  16. Zhang, L.; Lei, J.; Zhang, X.L.; Dong, W.; Yang, Y. Changes in carbon dioxide emissions and LMDI-based impact factor decomposition: The Xinjiang Uygur autonomous region as a case. J. Arid Land 2014, 6, 145–155. [Google Scholar] [CrossRef]
  17. National Bureau of Statistics of China (NBSC). China Statistics Yearbook; China Statistics Press: Beijing, China, 2014.
  18. National Bureau of Statistics of China (NBSC). China Statistics Yearbook; China Statistics Press: Beijing, China, 2015.
  19. National Bureau of Statistics of China (NBSC). China Statistics Yearbook; China Statistics Press: Beijing, China, 2016.
  20. National Bureau of Statistics of China (NBSC). China Statistics Yearbook; China Statistics Press: Beijing, China, 2017.
  21. National Bureau of Statistics of China (NBSC). China Statistics Yearbook; China Statistics Press: Beijing, China, 2018.
  22. National Bureau of Statistics of China (NBSC). China Statistics Yearbook; China Statistics Press: Beijing, China, 2019.
  23. National Bureau of Statistics of China (NBSC). China Statistics Yearbook; China Statistics Press: Beijing, China, 2020.
  24. National Bureau of Statistics of China (NBSC). China Statistics Yearbook; China Statistics Press: Beijing, China, 2021.
  25. National Bureau of Statistics of China (NBSC). China Statistics Yearbook; China Statistics Press: Beijing, China, 2022.
  26. National Bureau of Statistics of China (NBSC). China Statistics Yearbook; China Statistics Press: Beijing, China, 2023.
  27. Price Department of National Development and Reform Commission. The National Cost-Benefit Survey for Agricultural Product; China Statistics Press: Beijing, China, 2014.
  28. Price Department of National Development and Reform Commission. The National Cost-Benefit Survey for Agricultural Product; China Statistics Press: Beijing, China, 2015.
  29. Price Department of National Development and Reform Commission. The National Cost-Benefit Survey for Agricultural Product; China Statistics Press: Beijing, China, 2016.
  30. Price Department of National Development and Reform Commission. The National Cost-Benefit Survey for Agricultural Product; China Statistics Press: Beijing, China, 2017.
  31. Price Department of National Development and Reform Commission. The National Cost-Benefit Survey for Agricultural Product; China Statistics Press: Beijing, China, 2018.
  32. Price Department of National Development and Reform Commission. The National Cost-Benefit Survey for Agricultural Product; China Statistics Press: Beijing, China, 2019.
  33. Price Department of National Development and Reform Commission. The National Cost-Benefit Survey for Agricultural Product; China Statistics Press: Beijing, China, 2020.
  34. Price Department of National Development and Reform Commission. The National Cost-Benefit Survey for Agricultural Product; China Statistics Press: Beijing, China, 2021.
  35. Price Department of National Development and Reform Commission. The National Cost-Benefit Survey for Agricultural Product; China Statistics Press: Beijing, China, 2022.
  36. Price Department of National Development and Reform Commission. The National Cost-Benefit Survey for Agricultural Product; China Statistics Press: Beijing, China, 2023.
  37. Editorial Committee of China Price Yearbook. China Price Yearbook; People’s Publishing House: Beijing, China, 2014. [Google Scholar]
  38. Editorial Committee of China Price Yearbook. China Price Yearbook; People’s Publishing House: Beijing, China, 2015. [Google Scholar]
  39. Editorial Committee of China Price Yearbook. China Price Yearbook; People’s Publishing House: Beijing, China, 2016. [Google Scholar]
  40. Editorial Committee of China Price Yearbook. China Price Yearbook; People’s Publishing House: Beijing, China, 2017. [Google Scholar]
  41. Editorial Committee of China Price Yearbook. China Price Yearbook; People’s Publishing House: Beijing, China, 2018. [Google Scholar]
  42. Editorial Committee of China Price Yearbook. China Price Yearbook; People’s Publishing House: Beijing, China, 2019. [Google Scholar]
  43. Editorial Committee of China Price Yearbook. China Price Yearbook; People’s Publishing House: Beijing, China, 2020. [Google Scholar]
  44. Editorial Committee of China Price Yearbook. China Price Yearbook; People’s Publishing House: Beijing, China, 2021. [Google Scholar]
  45. Editorial Committee of China Price Yearbook. China Price Yearbook; People’s Publishing House: Beijing, China, 2022. [Google Scholar]
  46. Editorial Committee of China Price Yearbook. China Price Yearbook; People’s Publishing House: Beijing, China, 2023. [Google Scholar]
  47. Huang, X.; Xu, X.; Wang, Q.; Zhang, L.; Gao, X.; Chen, L. Assessment of Agricultural Carbon Emissions and Their Spatiotemporal Changes in China, 1997–2016. Int. J. Environ. Res. Public Health 2019, 16, 3105. [Google Scholar] [CrossRef]
  48. Wang, C.; Niu, J. Water and Carbon Footprint and Layout Optimization of Major Grain Crops in the Northwest China. Sci. Agric. Sin. 2024, 57, 1137–1152. (In Chinese) [Google Scholar]
  49. Li, W.; Ou, Q.; Chen, Y. Decomposition of China’s CO2 emissions from agriculture utilizing an improved Kaya identity. Environ. Sci. Pollut. Res. Int. 2014, 21, 13000–13006. [Google Scholar] [CrossRef] [PubMed]
  50. Xia, Q.; Liao, M.; Xie, X.; Guo, B.; Lu, X.; Qiu, H. Agricultural carbon emissions in Zhejiang Province, China (2001–2020): Changing trends, influencing factors, and has it achieved synergy with food security and economic development? Environ. Monit. Assess. 2023, 195, 1391. [Google Scholar] [CrossRef]
  51. Qin, X.; Zhang, F.; Liu, C.; Yu, H.; Cao, B.; Tian, S.; Liao, Y.; Siddique, K.H.M. Wheat yield improvements in China: Past trends and future directions. Field Crop Res. 2015, 177, 117–124. [Google Scholar] [CrossRef]
  52. Hu, Y.; Zhu, Y.; Yang, Y.; Zou, J.; Chen, F.; Yin, X. Changes of the planting structure of major food and oil crops in China from 1951 to 2015. J. China Agric. Univ. 2019, 24, 183–196. (In Chinese) [Google Scholar]
  53. Jiang, Y. China’s water scarcity. J. Environ. Manag. 2009, 90, 3185–3196. [Google Scholar] [CrossRef]
  54. Li, Y.; Wu, X. Analysis of ecosystem carbon footprint for three staple crop farmlands in China. Acta Sci. Nat. Univ. Pekin. 2024, 60, 575–584. [Google Scholar]
  55. Chen, X.; Cui, Z.; Fan, M.; Vitousek, P.; Zhao, M.; Ma, W.; Wang, Z.; Zhang, W.; Yan, X.; Yang, J.; et al. Producing more grain with lower environmental costs. Nature 2014, 514, 486–489. [Google Scholar] [CrossRef] [PubMed]
  56. Cheng, K.; Yan, M.; Nayak, D.; Pan, G.X.; Smith, P.; Zheng, J.F.; Zheng, J.W. Carbon footprint of crop production in China: An analysis of National Statistics data. J. Agric. Sci. 2015, 153, 422–431. [Google Scholar] [CrossRef]
  57. Liu, Y.; Yuan, Z.; Guo, L.; Sun, B.; Kong, W.; Tang, S. Carbon footprint of crop production in China from 1993 to 2013 and its spatial distribution. J. Appl. Ecol. 2017, 28, 2577–2587. (In Chinese) [Google Scholar]
  58. Zhang, D.; Shen, J.; Zhang, F.; Li, Y.; Zhang, W. Carbon footprint of grain production in China. Sci. Rep. 2017, 7, 4126. [Google Scholar] [CrossRef] [PubMed]
  59. Snyder, C.S.; Bruulsema, T.W.; Jensen, T.L.; Fixen, P.E. Review of greenhouse gas emissions from crop production systems and fertilizer management effects. Agric. Ecosyst. Environ. 2009, 133, 247–266. [Google Scholar] [CrossRef]
  60. Pathak, H.; Jain, N.; Bhatia, A.; Patel, J.; Aggarwal, P.K. Carbon footprints of Indian food items. Agric. Ecosyst. Environ. 2010, 139, 66–73. [Google Scholar] [CrossRef]
  61. Wang, Q.; Qiu, J.; Yu, J. Impact of farmland characteristics on grain costs and benefits in the North China Plain. Land Use Policy 2019, 80, 142–149. [Google Scholar] [CrossRef]
  62. Cao, K.H.; Birchenall, J.A. Agricultural productivity, structural change, and economic growth in post-reform China. J. Dev. Econ. 2013, 104, 165–180. [Google Scholar] [CrossRef]
  63. Pata, U.K.; Caglar, A.E. Investigating the EKC hypothesis with Renewable Energy Consumption, Human Capital, Globalization and Trade Openness for China: Evidence from Augmented ARDL Approach with a Structural Break. Energy 2021, 216, 119220. [Google Scholar] [CrossRef]
  64. Fan, M.; Shen, J.; Yuan, L.; Jiang, R.; Chen, X.; Davies, W.J.; Zhang, F. Improving crop productivity and resource use efficiency to ensure food security and environmental quality in China. J. Exp. Bot. 2011, 63, 13–24. [Google Scholar] [CrossRef] [PubMed]
  65. Kartal, M.T.; Pata, U.K. Impacts of renewable energy, trade globalization, and technological innovation on environmental development in China: Evidence from various environmental indicators and novel quantile methods. Environ. Dev. 2023, 48, 100923. [Google Scholar] [CrossRef]
  66. Shah, K.K.; Modi, B.; Pandey, H.P.; Subedi, A.; Aryal, G.; Pandey, M.; Shrestha, J. Diversified crop rotation: An approach for sustainable agriculture production. Adv. Agric. 2021, 2021, 8924087. [Google Scholar] [CrossRef]
  67. Smith, P.; Haberl, H.; Popp, A.; Erb, K.; Lauk, C.; Harper, R.; Tubiello, F.N.; de Siqueira Pinto, A.; Jafari, M.; Sohi, S.; et al. How much land-based greenhouse gas mitigation can be achieved without compromising food security and environmental goals? Glob. Chang. Biol. 2013, 19, 2285–2302. [Google Scholar] [CrossRef] [PubMed]
  68. Zhang, F.; Cui, Z.; Chen, X.; Ju, X.; Shen, J.; Chen, Q.; Liu, X.; Zhang, W.; Mi, G.; Fan, M.; et al. Integrated nutrient management for food security and environmental quality in China. Adv. Agron. 2012, 116, 1–40. [Google Scholar]
  69. Xia, L.; Yan, X. Research progress and prospect of greenhouse gas emissions from the life-cycle production of food crops in China. J. Agro-Environ. Sci. 2020, 39, 665–672. (In Chinese) [Google Scholar]
  70. Fan, J.; Guo, D.; Han, L.; Liu, C.; Zhang, C.; Xie, J.; Niu, J.; Yin, L. Spatiotemporal Dynamics of Carbon Footprint of Main Crop Production in China. Int. J. Environ. Res. Public Health 2022, 19, 13896. [Google Scholar] [CrossRef]
  71. Chen, X.; Ma, C.; Zhou, H.; Liu, Y.; Huang, X.; Wang, M.; Cai, Y.; Su, D.; Muneer, M.A.; Guo, M.; et al. Identifying the main crops and key factors determining the carbon footprint of crop production in China, 2001–2018. Resour. Conserv. Recycl. 2021, 172, 105661. [Google Scholar] [CrossRef]
  72. Xia, L.; Ti, C.; Li, B.; Xia, Y.; Yan, X. Greenhouse gas emissions and reactive nitrogen releases during the life-cycles of staple food production in China and their mitigation potential. Sci. Total Environ. 2016, 556, 116–125. [Google Scholar] [CrossRef]
  73. Zhang, W.F.; Dou, Z.X.; He, P.; Ju, X.T.; Powlson, D.; Chadwick, D.; Norse, D.; Lu, Y.L.; Zhang, Y.; Wu, L.; et al. New technologies reduce greenhouse gas emissions from nitrogenous fertilizer in China. Proc. Natl. Acad. Sci. USA 2013, 110, 8375–8380. [Google Scholar] [CrossRef] [PubMed]
  74. Liu, Y.; Cao, H.; Du, C.; Zhang, Z.; Zhou, X.; Yao, C.; Sun, W.; Xiao, Y.; Zhang, Y.; Zhao, Z.; et al. Novel water-saving cultivation system maintains crop yield while reducing environmental costs in North China Plain. Resour. Conserv. Recycl. 2023, 197, 107111. [Google Scholar] [CrossRef]
  75. Nayak, D.; Saetnan, E.; Cheng, K.; Wang, W.; Koslowski, F.; Cheng, Y.F.; Zhu, W.Y.; Wang, J.K.; Liu, J.X.; Moran, D.; et al. Management opportunities to mitigate greenhouse gas emissions from Chinese agriculture. Agric. Ecosyst. Environ. 2015, 209, 108–124. [Google Scholar] [CrossRef]
  76. Tian, P.; Li, D.; Lu, H.; Feng, S.; Nie, Q. Trends, distribution, and impact factors of carbon footprints of main grains production in China. J. Clean. Prod. 2021, 278, 123347. [Google Scholar] [CrossRef]
  77. Zhang, W.; Qiao, Y.; Lakshmanan, P.; Yuan, L.; Liu, J.; Zhong, C.; Chen, X. Combing public-private partnership and large-scale farming increased net ecosystem carbon budget and reduced carbon footprint of maize production. Resour. Conserv. Recycl. 2022, 184, 106411. [Google Scholar] [CrossRef]
  78. Sun, J.; Yang, L.; Wang, X.; Lun, F.; Lu, M.; Sun, X.; Yang, P.; Wu, W.; Liu, J. Workable solutions for sustainably feeding the Chinese population. Resour. Conserv. Recycl. 2024, 205, 107530. [Google Scholar] [CrossRef]
  79. Lal, R. Soil carbon sequestration impacts on global climate change and food security. Science 2004, 304, 1623–1627. [Google Scholar] [CrossRef]
  80. Qian, H.; Zhu, X.; Huang, S.; Linquist, B.; Kuzyakov, Y.; Wassmann, R.; Minamikawa, K.; Martinez-Eixarch, M.; Yan, X.; Zhou, F.; et al. Greenhouse gas emissions and mitigation in rice agriculture. Nat. Rev. Earth Environ. 2023, 4, 716–732. [Google Scholar] [CrossRef]
  81. Lu, F.; Wang, X.; Han, B.; Ouyang, Z.; Duan, X.; Zheng, H.; Miao, H. Soil carbon sequestrations by nitrogen fertilizer application, straw return and no-tillage in China’s cropland. Glob. Chang. Biol. 2009, 15, 281–305. [Google Scholar] [CrossRef]
Figure 1. Location of the five provinces in the North China Plain (location map presented using the ArcGIS Geographic Information System 10.7.2 (Esri, Redlands, CA, USA)).
Agronomy 14 01720 g001
Figure 2. Changes in yields, sown areas, and total production of maize, wheat, and rice in five provinces of the NCP from 2013 to 2022.
Agronomy 14 01720 g002
Figure 3. Changes in the area-scaled carbon footprint of maize, wheat, and rice in five provinces of the NCP from 2013 to 2022.
Agronomy 14 01720 g003
Figure 4. Changes in the yield-scaled carbon footprint of maize, wheat, and rice in five provinces of the NCP from 2013 to 2022.
Agronomy 14 01720 g004
Figure 5. Changes in the carbon input percentage of maize, wheat, and rice in the North China Plain from 2013 to 2022.
Agronomy 14 01720 g005
Figure 6. Changes in the carbon efficiency of maize, wheat, and rice in five provinces of the NCP from 2013 to 2022.
Agronomy 14 01720 g006
Figure 7. Contribution of different influencing factors to changes in the carbon emissions of maize, wheat, and rice in the NCP. ΔCI, ΔPI, ΔSI, ΔEI, and ΔLI reflect the changes in crop carbon emission caused by the carbon efficiency effect, the crop production effect, the agricultural structure effect, the economic development effect, and the labor effect, respectively.
Agronomy 14 01720 g007
Table 1. Carbon emission factor for agricultural inputs.
Agricultural InputEmission Factor
UnitValue
Nitrogen fertilizerkg CO2-eq kg−11.53
Phosphate fertilizerkg CO2-eq kg−11.63
Potassic fertilizerkg CO2-eq kg−10.66
Compound fertilizerkg CO2-eq kg−11.77
Pesticidekg CO2-eq kg−112.5
Electricity for irrigationkg CO2-eq kWh−11.23
Dieselkg CO2-eq kg−10.89
Plastic filmkg CO2-eq kg−122
Seedkg CO2-eq kg−10.58
Laborkg CO2-eq day−10.86
Carbon equivalent coefficients (Chinese Life Cycle Database 0.7, IKE Environmental Technology Co., Ltd., Chengdu, China.).
Table 2. Changes in maize carbon emissions caused by five major influencing factors (unit, 104 t).
YearΔCIΔPIΔSIΔEIΔLIΔCtotal
2013–201453.534.745.78.8−7.2135.5
2014–2015521.2−486.06.960.5−43.359.2
2015–201669.3−54.6−46.020.4−22.2−33.0
2016–2017−177.0565.3−32.9−35.9−58.2261.2
2017–2018−202.0−30.857.9153.3−90.4−112.0
2018–2019−249.3174.1−126.8144.5−61.6−119.1
2019–2020−173.6−15.9130.2231.6−82.389.9
2020–2021−272.3227.1−93.1158.8−34.4−14.0
2021–2022−77.6−117.1132.8118.6−23.633.1
Total−507.8296.874.6860.5−423.3300.8
ΔCI, ΔPI, ΔSI, ΔEI, and ΔLI reflect the changes in maize carbon emissions caused by the carbon efficiency effect, the crop production effect, the agricultural structure effect, the economic development effect, and the labor effect, respectively. ΔCtotal reflects the total effect of the contribution values for each factor.
Table 3. Changes in wheat carbon emissions caused by five major influencing factors (unit, 104 t).
YearΔCIΔPIΔSIΔEIΔLIΔCtotal
2014−56.477.665.612.6−10.389.1
2015−36.831.99.583.5−59.828.3
201661.638.5−63.928.4−30.833.8
2017−3.7300.6−44.3−48.3−78.3126.0
201834.2−275.975.1198.9−117.3−84.9
2019−56.761.8−170.7194.6−83.0−54.0
202031.5−383.7175.8312.6−111.125.0
20213.829.7−125.6214.1−46.475.6
2022−23.6−260.5182.1162.7−32.328.4
Total−46.0−379.9103.61159.1−569.5267.3
ΔCI, ΔPI, ΔSI, ΔEI, and ΔLI reflect the changes in wheat carbon emissions caused by the carbon efficiency effect, the crop production effect, the agricultural structure effect, the economic development effect, and the labor effect, respectively. ΔCtotal reflects the total effect of the contribution values for each factor.
Table 4. Changes in rice carbon emissions caused by five major influencing factors (unit, 104 t).
YearΔCIΔPIΔSIΔEIΔLIΔCtotal
2014−45.930.322.44.3−3.57.6
2015−4.2−18.33.127.7−19.8−11.5
2016−14.822.2−20.59.1−9.9−13.9
201746.9−20.1−13.3−14.5−23.6−24.7
201872.6−106.422.258.8−34.712.5
20192.131.2−53.160.5−25.815.0
2020−3.1−116.055.698.9−35.20.2
202134.1−44.5−39.066.4−14.42.7
2022−18.8−93.754.648.8−9.7−18.8
Total68.9−315.332.1360.0−176.6−30.9
ΔCI, ΔPI, ΔSI, ΔEI, and ΔLI reflect the changes in rice carbon emissions caused by the carbon efficiency effect, the crop production effect, the agricultural structure effect, the economic development effect, and the labor effect, respectively. ΔCtotal reflects the total effect of the contribution values for each factor.
Disclaimer/Publisher’s Note: The statements, opinions and data contained in all publications are solely those of the individual author(s) and contributor(s) and not of MDPI and/or the editor(s). MDPI and/or the editor(s) disclaim responsibility for any injury to people or property resulting from any ideas, methods, instructions or products referred to in the content.

