Article

Effects of Phosphorus and Potassium Supply on Photosynthetic Nitrogen Metabolism, Nitrogen Absorption, and Nitrogen Utilization of Hydroponic Rice

1
Rice Research Institute, Agronomy College, Shenyang Agricultural University, Shenyang 110866, China
2
School of Agriculture, Liaodong University, Dandong 118001, China
*
Author to whom correspondence should be addressed.
Agronomy 2024, 14(8), 1726; https://doi.org/10.3390/agronomy14081726
Submission received: 28 June 2024 / Revised: 23 July 2024 / Accepted: 31 July 2024 / Published: 6 August 2024
(This article belongs to the Section Soil and Plant Nutrition)

Abstract

:
Phosphorus (P) and potassium (K) stress significantly affect the growth, physiological characteristics, and nutrient uptake of rice plants. This study investigated the photosynthetic nitrogen (N) metabolism, N uptake, and N utilization of plants under varied P and K supplies. Two local conventional high-yield rice varieties (Shennong 265 and Liaojing 294) were used. These varieties were subjected to the following hydroponic experimental treatments: HPHK (normal P and K concentrations), HPLK (normal P and 1/20 normal K concentration), LPHK (normal K and 1/20 normal P concentration), and LPLK (1/20 normal P and K concentrations). The results showed that the mesophyll cells had a relatively complete nuclear and chloroplast structures, and the antioxidant enzymes of the plants were significantly reduced under the HPHK treatment. Compared to the LP treatments (LPHK and LPLK), the HPHK treatment was found to have the following potential effects: effectively optimize plant configuration; promote leaf development (Pn, E, Ci, and Tr, chlorophyll, and leaf area index); significantly increase the N-metabolism-related enzyme activity of leaves and roots and the accumulation of N in the plant in the main growth stages; and significantly increase the rice yield and N-related efficiency. In conclusion, the HPHK treatment was found to be beneficial in improving the plant configuration, promoting photosynthetic N metabolism, and increasing grain yield and N-related utilization efficiency.

1. Introduction

Rice is a major global food crop. The rational application of nitrogen (N), phosphorus (P), and potassium (K) can promote an increase in the yield of rice [1]. Optimizing the plant configuration and increasing plant photosynthetic N metabolism, which consequently increases the production of photosynthetic products, are conducive to promoting plant N absorption [2,3]. Additionally, improving the efficiency of N uptake and use is an effective approach to increasing crop yields [4]. A sufficient supply of P and K can promote N accumulation in plants and increase the efficiency of N use [5]. Simultaneously, the effect of P and K on N depends on the concentration of P and K in the environment [6]. Therefore, studying the effects of the P and K supply (sufficient or insufficient) on the photosynthetic N metabolism of rice plants, as well as the N uptake, N utilization, and nutrient solutions of plants, is of great significance for clarifying the specific mechanism by which P and K affect N and for formulating NPK fertilization methods that can maintain plant nutrient homeostasis.
P participates in many physiological, biochemical, and metabolic processes in plants, including photosynthesis, the production of photosynthates, membrane phospholipid synthesis, nutrient absorption, etc. [6,7]. K participates in leaf stomatal movement, osmotic regulation, carbon and N metabolism, protein synthesis, and other physiological metabolic processes, and can increase plant stress resistance [8,9].
Under abiotic stress, the ultrastructure of mesophyll cells is damaged to different degrees. The activities of superoxide dismutase (SOD), peroxidase (POD), and catalase (CAT) as well as malondialdehyde (MDA) content also change correspondingly [10,11]. Therefore, the antioxidant malondialdehyde enzyme activities, MDA content, and ultrastructure of mesophyll cells in plants can reflect the degree of plant stress under different P and K supplies. Compared with a sufficient P supply, a low P supply can damage the ultrastructure of mesophyll cells [12,13]. The application of P can reduce the damage that occurs in the chloroplast membrane system and nucleolus [14]. A low K supply damages the normal function of chloroplasts, and the degree of damage is significantly higher than that induced by a low P supply [15,16]. Additionally, a low P supply significantly increases the SOD, POD, and CAT activity and MDA content in plants [17,18]. A low K supply has been found to significantly increase SOD and CAT activity and MDA content in plant leaves, but was found to correspondingly decrease root-related enzyme activity and MDA content [19]. A sufficient K supply reduces the degree of membrane lipid peroxidation [20].
The P and K supply significantly affects the photosynthetic N metabolism of plants. A lack of P or K reduces the leaf area, chlorophyll content, and PS II activity, inhibits ATP activity, and weakens leaf photosynthesis [15,21,22]. Additionally, combined salt and K stress significantly decreases the activity of NR and GDH and inhibits the N uptake and PS II activity of maize at the seedling stage [23]. Compared with low N and low K supplies, sufficient N and K supplies effectively improve N-metabolizing enzyme activity in the roots and leaves of rice at the seedling stage [24]. Under a low N supply, a suitable P application effectively increases the N metabolic enzyme activity of Tartary buckwheat roots [25].
The P and K supplies also affect the N uptake, N use efficiency, and yield of crops. Suitable P application promotes N accumulation, grain yield, and N uptake efficiency in the later growing period of maize [26,27]. In a wheat–maize–bean intercropping system, P was found to increase the aboveground N accumulation and N uptake efficiency and had a negative effect on the N physiological efficiency [28]. P was also found to increase the peanut and rice yield and the plant N use efficiency [29,30]. The application of K can improve the root dry weight, N and P uptake, and N use efficiency of rice [24,31]. Additionally, the interaction between P and K is conducive to improving rice yield components, with higher accumulation of P and K promoting the rice yield and improving the N use efficiency in the later stage of rice growth [32,33]. In addition, optimal P management can significantly improve the P partial factor productivity and P recovery efficiency of rice [34]. Optimal K management can improve the grain yield and K utilization efficiency of rice [35].
Most of the above studies focused on plant photosynthetic physiology, nutrient uptake at the seedling stage under either P or K stress, plant yield, and N use efficiency under NPK interactions. Few studies have examined the photosynthetic N metabolism mechanism and the N use efficiency of roots, grains, and nutrient solutions of rice under the long-term application of P and K (whole growth period), and their correlations. Therefore, the present study analyzed the causes of different degrees of stress (via the content of antioxidant enzymes and MDA), plant photosynthetic N metabolism (via photosynthetic indices, N-metabolizing enzymes, mesophyll cell ultrastructure, etc.), N uptake, and the utilization of hydroponic Shennong 265 and Liaojing 294 rice under a sufficient or insufficient supply of P and K. The aim was to clarify the effects of P and K on the above-mentioned aspects of N and to provide more comprehensive insights into related physiological mechanisms.

2. Materials and Methods

2.1. Plant Materials and Growth Conditions

Hydroponic experiments were conducted in May 2022 at the Kalima Rice Experiment Station (41°12′ E, 122°23′ E) at Shenyang Agricultural University, Liaoning Province, China. The experimental varieties were Shennong 265 (SN265) and Liaojing 294 (LJ294), conventional high-yielding varieties grown in Liaoning Province, China. The growth period of the two varieties is similar.
The two varieties were cultivated from seed to four-leaf age (35 d after sowing) and were then transplanted into hydroponic pots with a diameter of 30.0 cm. There were two hills per pot and two plants per hill. Seven liters of nutrient solution were added to each pot to ensure the complete immersion of the plant root. The nutrient solution was changed every 10 days, and the hydroponic pots were randomly repositioned to minimize the effects of the position. The pH of the nutrient solution was adjusted to 5.0 daily using HCl (1 M) or NaOH (1 M), and deionized water was added promptly to maintain the total nutrient solution volume in the hydroponic pots. Two weeks before harvest, the nutrient solution in the hydroponic pots was replaced with deionized water of the same volume and pH.

2.2. Experimental Design

Two P supply conditions and two K supply conditions were established: an adequate supply of P and K (HPHK, normal P and K concentrations), a K deficiency treatment (HPLK, normal P and 1/20 of the normal K concentration), a P deficiency treatment (LPHK, normal K and 1/20 of the normal P concentration), and a P and K deficiency treatment (LPLK, 1/20 of the normal P concentration and 1/20 of the normal K concentration).
Aside from the P and K concentrations, the concentrations of other elements were formulated according to those of the International Rice Research Institute (IRRI). The content of other elements in each treatment were as follows: 40 mg/L N, Ca, and Mg; 5.6 mg/L Si; 2 mg/L Fe; 0.5 mg/L Mn; 0.2 mg/L B; 0.05 mg/L Mo; and 0.01 mg/L Zn and Cu.
In this study, three pots were sampled per treatment, per variety, per period, with a total of 192 pots. Each indicator was measured three times for statistical analysis.

2.3. Sampling and Measurements

2.3.1. Determination of the Chlorophyll Components of the Leaves

Six hill plants were sampled at each growth stage (tillering, full-heading, filling, and maturity). The roots were washed with deionized water and the excess water was removed with filter paper. The leaves and roots were rapidly frozen with liquid nitrogen for 5 min and then stored in an ultra-low-temperature refrigerator (MDF-682, Panasonic Co., Ltd., Osaka, Japan) at −80 °C.
The leaves (0.2 g) were weighed at the tillering, full-heading, and filling stages. The veins were cut, and the leaves were placed in a 15 mL centrifuge tube with ethanol (95%, 10 mL) and sealed at room temperature in the dark for 36 h. The chlorophyll a (chla) and chlorophyll b (chlb) contents (mg/g·FW) were calculated. The total chlorophyll content (chl) was calculated from chla + chlb.

2.3.2. Determination of N-Metabolism-Related Enzymes in the Leaves and Roots

The leaf and root tissues (0.1 g) were homogenized in an ice bath by the addition of extract solution (1 mL). The slurry was centrifuged at 8000× g for 10 min at 4 °C and the supernatant was extracted and stored on ice before measurement. The GS, GDH, and GOGAT enzyme activities were determined using a Glutamine Synthetase (GS) Activity Kit, a Glutamate Dehydrogenase (GDH) Activity Kit, and a Glutamate Synthetase (GOGAT) Activity Kit (Solepol Bio-technology Effective Co., Ltd., Beijing, China), respectively. The NR enzyme activity was determined using a Nitrate Reductase (NR) Assay Kit (Regen Biotechnology Co., Ltd., Beijing, China).
One unit of GS enzyme activity was defined as a 0.005 change in absorbance at 540 nm per gram of tissue, per minute, in the reaction system. One unit of GDH enzyme, GOGAT enzyme, and NR enzyme activity was defined as 1 nmol of NADH consumed per gram of tissue per minute.

2.3.3. Determination of the Antioxidant Enzyme Activity and MDA Content of the Leaves and Roots

The leaf and root tissues (0.1 g) were homogenized in an ice bath by the addition of extract solution (1 mL). The slurry was centrifuged at 8000× g for 10 min at 4 °C and the supernatant was extracted and stored on ice prior to measurement. The SOD, POD, and CAT activities, and the MDA content, were determined by the nitroblue tetrazolium (NBT) method, guaiacol method, hydrogen peroxide change rate method, and thiobarbituric acid method, respectively [36].

2.3.4. Determination of the Leaf Area Index and Photosynthetic Indicators

Three hill plants per treatment were selected at the tillering, full-heading, and filling stages. The net photosynthetic rate (Pn), stomatal conductance (E), intercellular CO2 concentration (Ci), and transpiration rate (Tr) of the topmost leaves of the main stem were measured from 8 to 11 a.m. using a LI6400 photosynthometer (Li-Cor, Inc. Lincoln, Nebraska, USA). At the same time, the leaf area index (LAI) of each growth stage was calculated. The formula was as follows:
LAI = Sum of all leaf length × width × 0.75/corresponding land area

2.3.5. Leaf Ultra-Microstructure

At the full-heading stage, the sword leaves (HPHK and LPLK treatments) of the main stem of the plant were selected. After removing the leaf veins, the leaves were cut into 3 mm × 1 mm pieces using a blade and fixed with pre-cooled 2.5% glutaraldehyde fixing solution. The air in the fixing solution was removed and the mixtures were stored at 4 °C. Subsequent operations were performed on the fixed material [34]. The ultrastructure of mesophyll cells was observed and imaged via transmission electron microscopy (Tecnail2-TWIN, Philips, Amsterdam, The Netherlands) [37].

2.3.6. Determination of the N Contents of Different Organs of the Plant and Calculation of N Efficiency

Three hill plants per treatment were selected at the tillering, full-heading, filling and maturity stages. After cleaning the roots, the plants were divided into four parts: the stem sheath, the leaf, the panicle, and the root. Notably, the aboveground parts were only divided into the stem sheath and leaf at the tillering stage. After drying the samples to a constant weight, they were crushed and sieved through an 80-mesh sieve. The sieved and dried samples were weighed (0.5 g) and digested using a sulfuric acid and hydrogen peroxide wet digestion method. The digestion solution was diluted to 100 mL with water and the plant N content was measured using a Kjeldahl N analyzer (Kjeltec8400, Foss, Hilleroed, Danmark) [38].

2.3.7. Calculation of the Grain Yield and N Efficiency

Firstly, three hill plants per treatment were selected at the maturity stage. The plant weight per hill was measured after the grain moisture content was reduced to 14%. Secondly, the actual grain yield was calculated (kg/hm2) according to the occupied area and the plant weight per hill. Finally, the N efficiency was calculated based on the plant N accumulation and the grain yield indicators. The definition and calculation methods for the N efficiency indicators are shown in Table 1.

2.3.8. Measurement of P and K Uptake Rate (NUR) in Nutrient Solution

Water samples (10 mL) were collected every 10 days with three replicates per treatment. Before the nutrient solution was replaced, water samples were transferred to a refrigerator at 4 °C and stored away from light until analysis. Filtered water samples (5 mL) were aspirated and digested using alkaline potassium persulfate digestion [39]. The nitrogen uptake rate (NUR) in the nutrient solution was calculated every 10 days according to the following formula:
NUR (mg/d) = (ONC − RNC) × 7 L/10 d
Here, ONC and RNC represent the initial N content in the nutrient solution and the residual N content in the nutrient solution, respectively.

2.4. Data Analysis

Analysis of variance (ANOVA) was performed using SPSS26.0 statistical software. Origin2021PRO was used for graphing.

3. Results

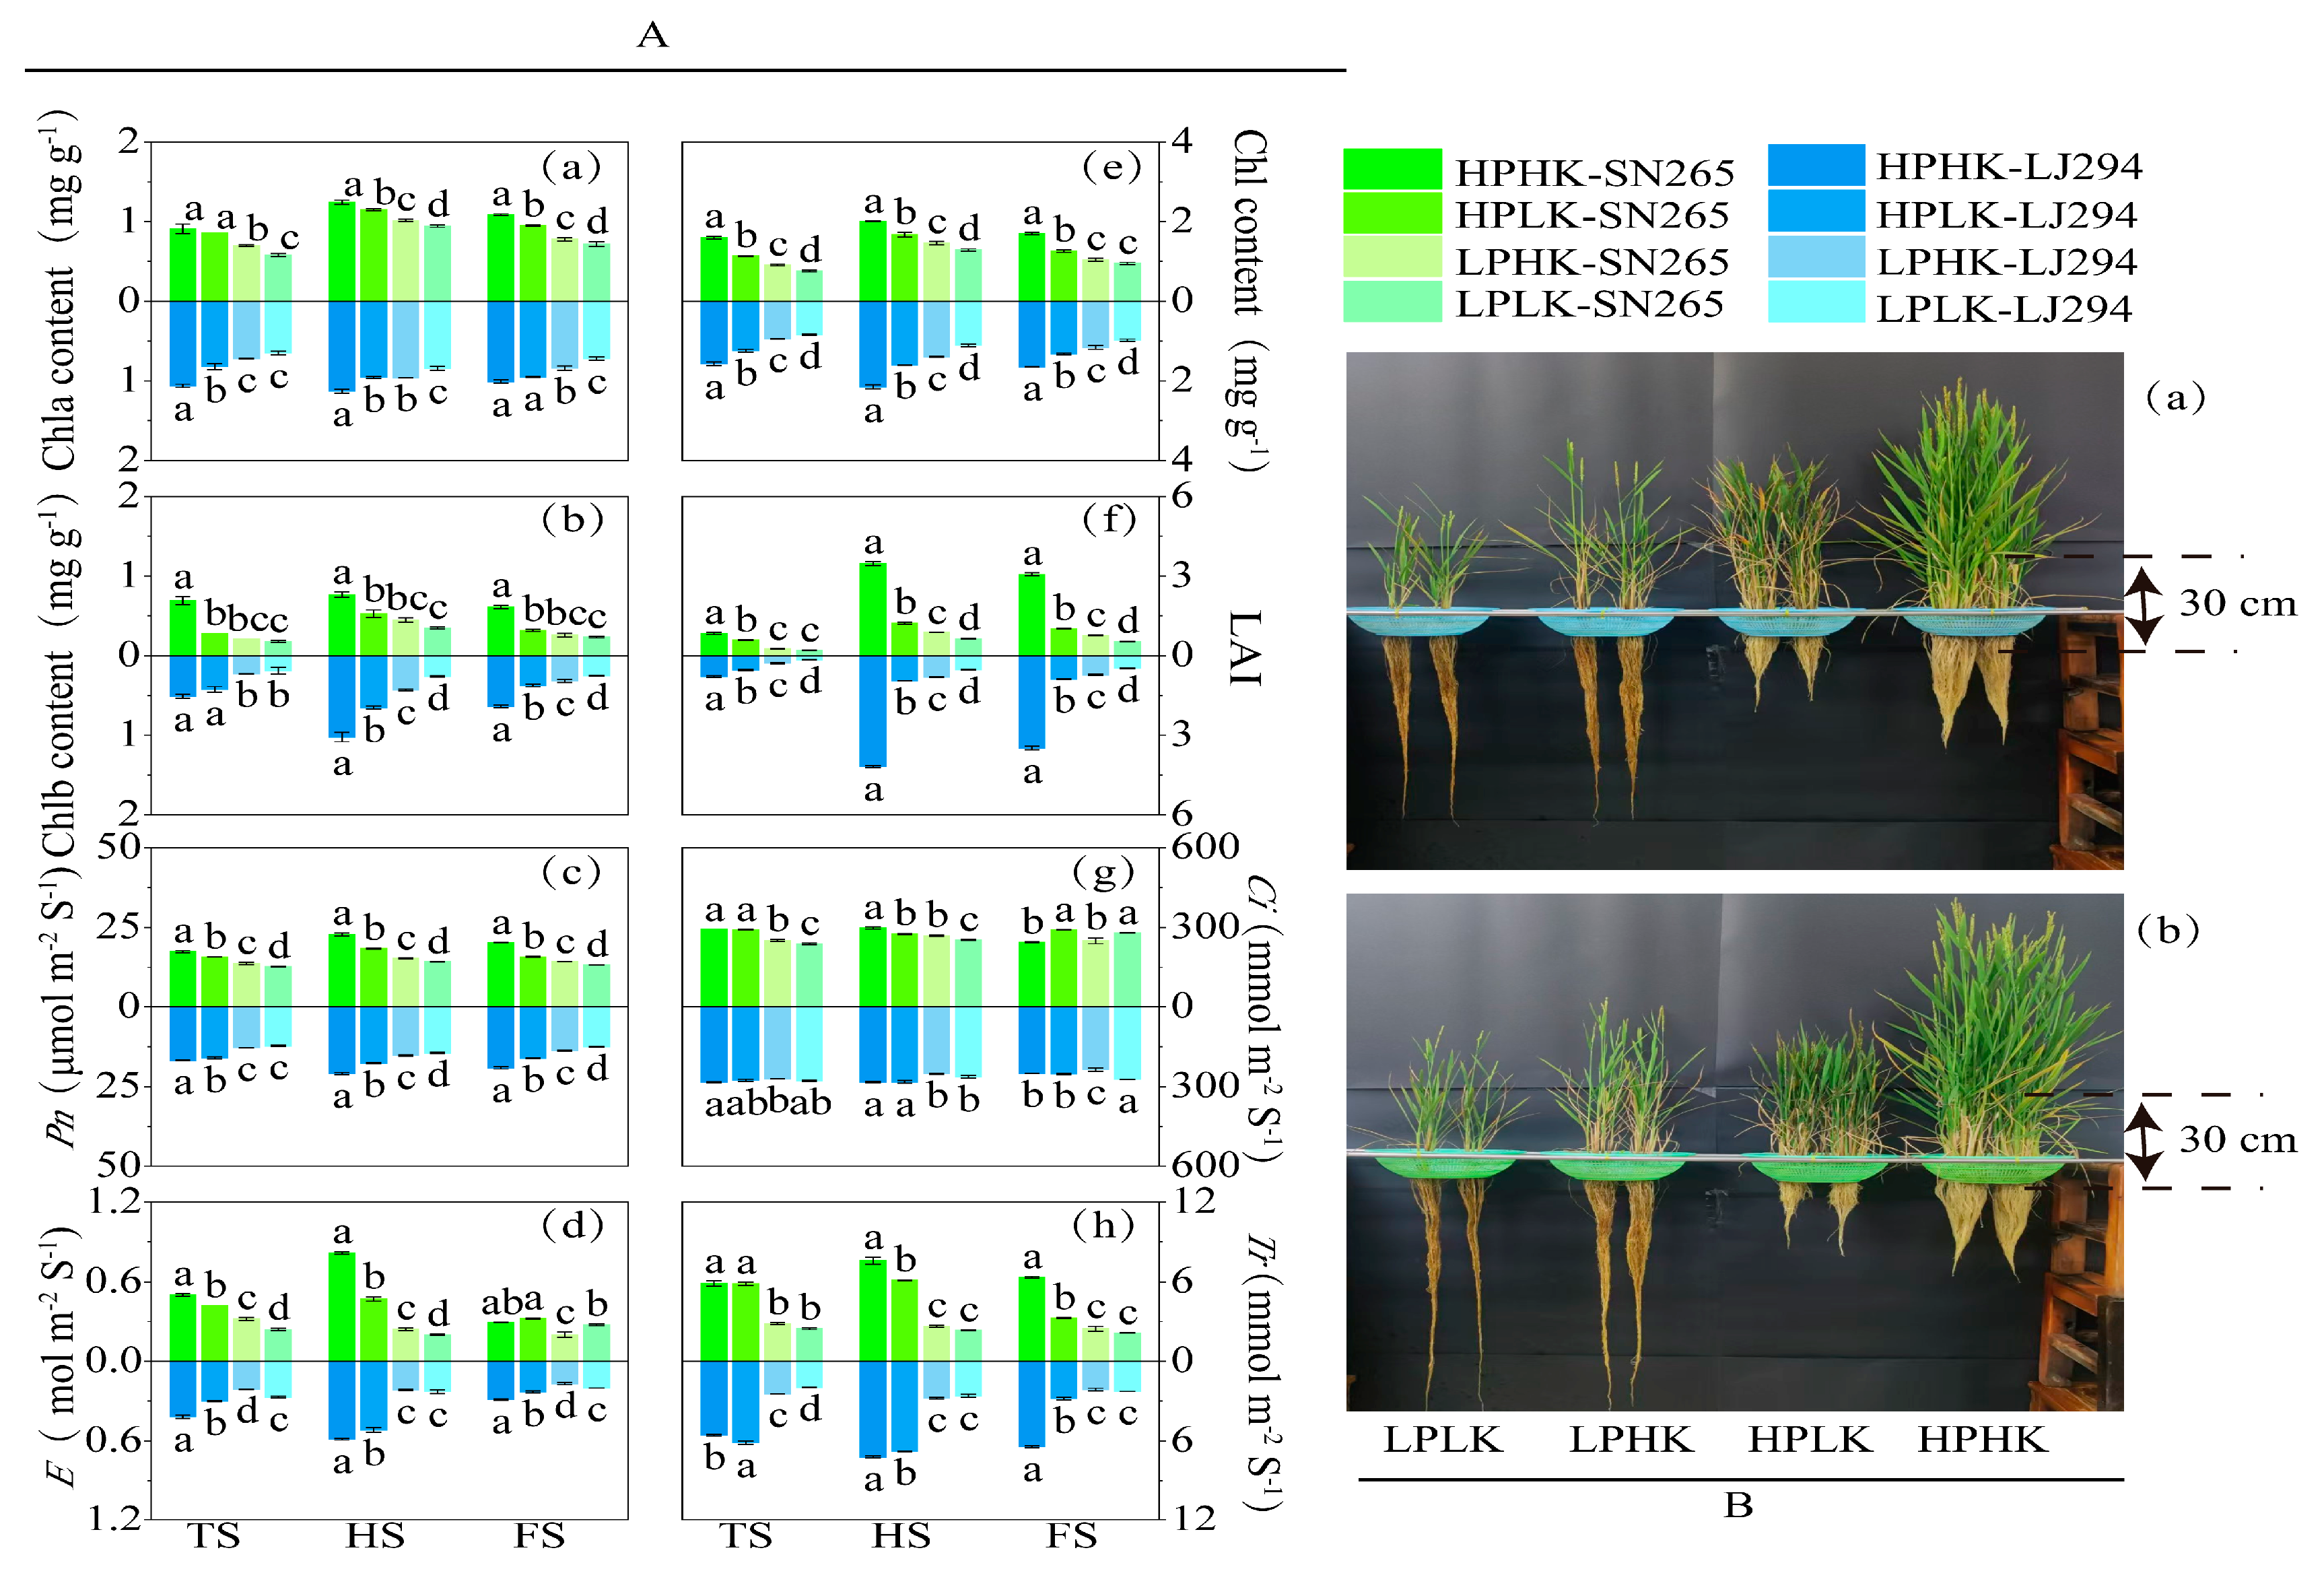
3.1. Leaf Chlorophyll Component, LAI, Photosynthesis, and Plant Morphological Characteristics

As shown in Figure 1, the two varieties had the highest LAI and Chla, Chlb, and Chl contents under the HPHK treatment as compared to the other treatments from the tillering to the filling stage (Figure 1A). The Chla and Chlb contents were significantly higher under the HPHK treatment as compared to the LP treatments (Figure 1A(a,b)); the Chl content and LAI were significantly higher under the HPHK treatment than all other treatments (Figure 1A(e,f)). Compared with the LP treatments, the leaf LAI and Chla, Chlb, and Chl contents were significantly increased by 69.42% to 82.64%, 18.37% to 36.66%, 41.85% to 74.17%, and 27.27% to 52.76%, respectively, in SN265 under the HPHK treatment, and in LJ294 by 63.26% to 87.30%, and 14.97% to 38.84%, 50.21% to 74.40%, and 29.83% to 48.60%, respectively.
The patterns of change in each photosynthetic index were similar between the treatments for both varieties. An adequate P supply significantly increased the Pn and Tr of the leaves of both plant varieties from the tillering to the filling stage; it also increased the E of the leaves of both varieties from tillering to the full-heading stage as compared with the LP treatments (Figure 1A(c,d,h)); meanwhile, the Ci was the highest under the HPHK treatment from the tillering to the full-heading stage (Figure 1A(g)). At the full-heading stage under the HPHK treatment, compared with the LP treatments, the leaf Pn, E, Ci, and Tr were significantly increased by 49.34% to 60.94%, 2.36- to 3.09-fold, 10.81% to 17.68%, and 1.87- to 2.23-fold, respectively, in SN265; and in LJ294, they were increased by 37.72% to 45.03%, 1.58 to 1.72-fold, 7.72% to 12.72%, and 1.60- to 1.77-fold, respectively. Furthermore, the LPHK treatment significantly increased the Pn of leaves of both varieties compared to the LPLK treatment. This indicates that, although an adequate K supply could effectively increase the Pn, K was still much less important for photosynthesis than P.
Additionally, at the full-heading stage, the plant morphological characteristics of the two varieties were essentially the same under the different treatments (Figure 1B(a,b)). The plant growth of the two varieties under the HPHK treatment was significantly better than under the other treatments. There was little difference in plant growth between the two varieties under the LPHK and LPLK treatments, regardless of whether K was in adequate supply. This indicated that the effect of an adequate P supply on plant growth is greater than that of an adequate K supply.

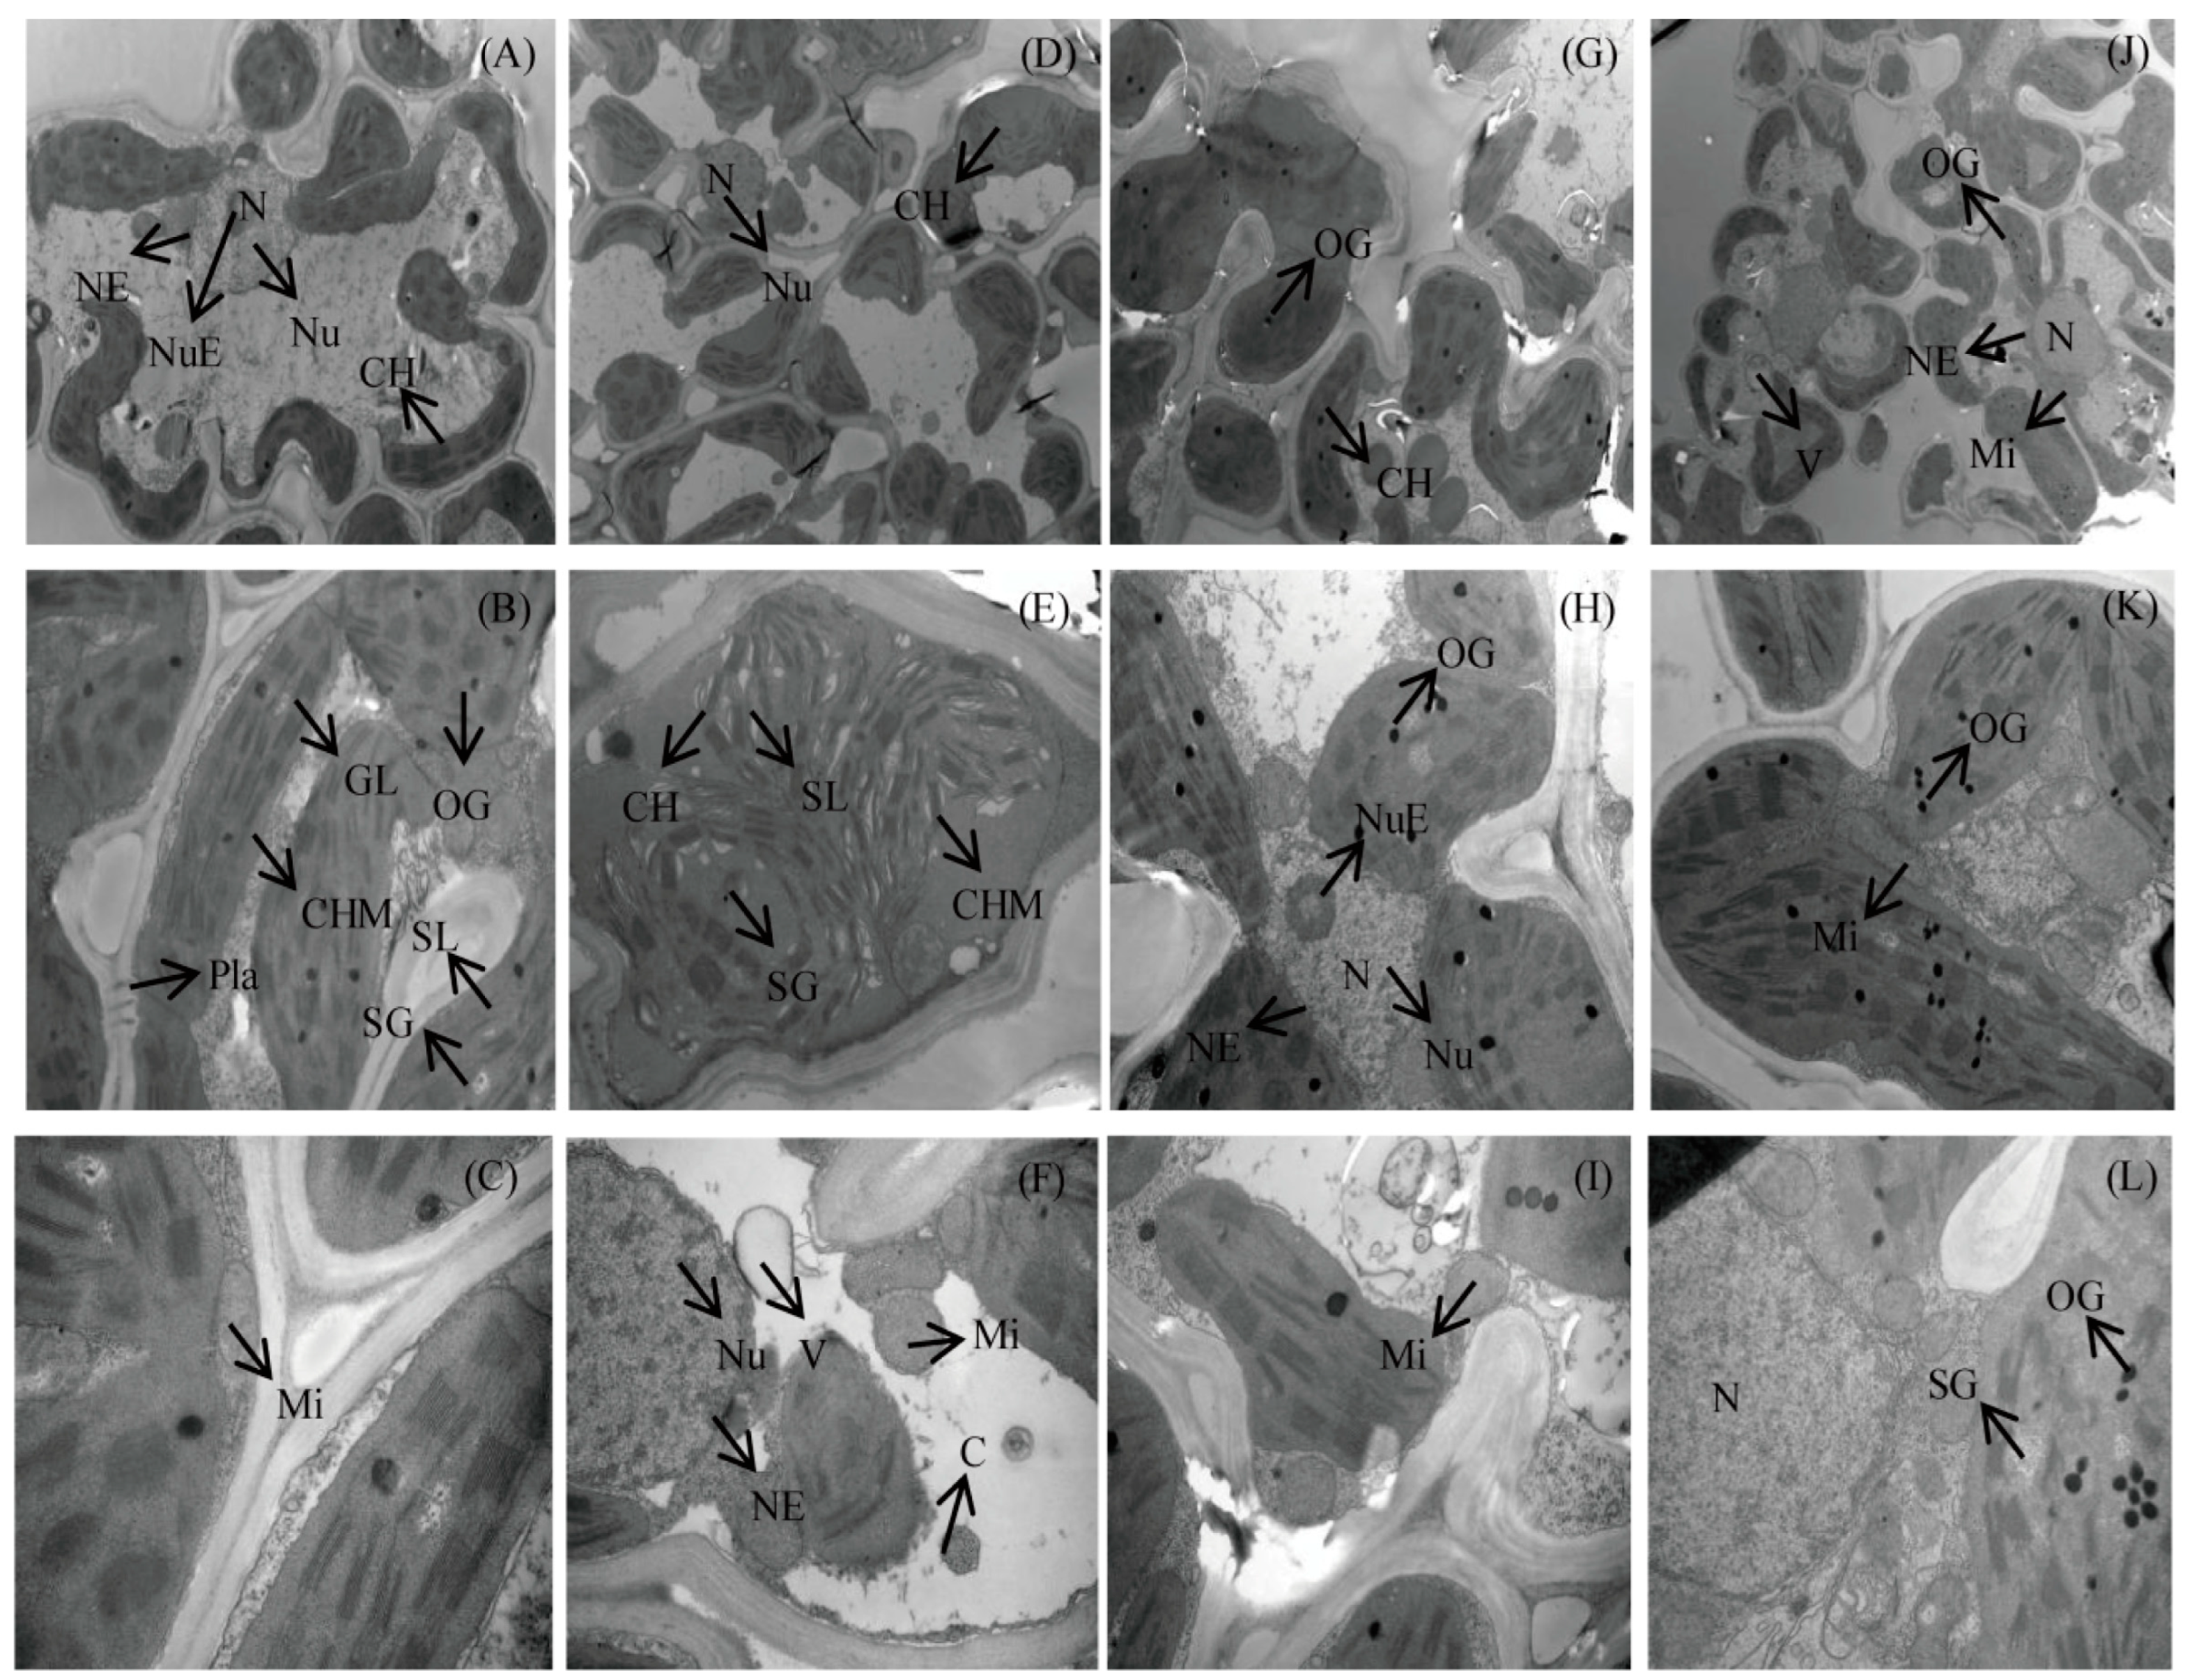
3.2. Ultrastructure of Mesophyll Cells at the Full-Heading Stage

As shown in Figure 2A–F, examination of the ultrastructure of SN265 mesophyll cells under a sufficient supply of P and K revealed a relatively complete cell nucleus, with a clear nuclear membrane and nucleolus and uniform a chromatin distribution. Most of the chloroplasts were long and pike-shaped, and a few chloroplasts were free in the cytosol (Figure 2A). Under a low P and K supply, the nucleolus was absent from the cell nucleus of mesophyll cells and the aggregation of chromatin was observed in the nucleus. Most chloroplasts were deformed and larger in volume (Figure 2D).
There were obvious plasmodesmata between the cell walls under the HPHK treatment. The chloroplast bilayer membrane was structurally complete, and the stromal lamella and granum lamella were clearly arranged, with the overall orientation essentially parallel to the direction of the long axis of the chloroplasts. The chloroplasts contained fewer starch grains and osmiophilic granules (Figure 2B). The chloroplast volume under a low P and low K supply was markedly enlarged, the chloroplast membrane was partially dissolved, the stroma lamella structure was arranged chaotically, and there were more starch grains and fewer osmiophilic granules (Figure 2E).
A small number of mitochondria were present in mesophyll cells under the HPHK and LPLK treatments. Crevices were present between the nuclear membrane and chromatin within the cell nucleus, and some mitochondria had blurred inner ridges under the low P and K supply treatment (Figure 2C,F).
Figure 2G–L show the ultrastructure of the LJ294 chloroplasts. Most of the chloroplasts in the mesophyll cells under a sufficient P and K supply were tightly adherent to the cell wall and showed slight plasma wall separation; there were also a small number of osmiophilic granules in the chloroplasts (Figure 2G). The nucleolus was absent from the cell nucleus, and the nuclear membrane was intact under the low P and low K supply treatments. The cells contained many mitochondria that were markedly deformed. The chloroplasts contained numerous osmiophilic granules (Figure 2J).
Under an adequate P and K supply, mesophyll cells had a more complete cell nucleus with clear nuclear membranes, nucleoli, and uniform chromatin distribution. The osmiophilic granules in the chloroplasts under the HPHK treatment were larger in volume and fewer in number compared to those in the LPLK treatment (Figure 2H). Compared to the HPHK treatment, there were significantly more mitochondria in the mesophyll cells under the LPLK treatment. However, because of the larger volume of chloroplasts, the mitochondria were extruded and significantly deformed (Figure 2K).
Under an adequate P and K supply, fewer mitochondria were present around the chloroplasts, which were oval-shaped, with a well-defined bilayer membrane structure and a smooth outer membrane (Figure 2I). The chloroplasts under the LPLK treatment had numerous osmiophilic granules and fewer starch grains, with localized rupture of the chloroplast membrane and a swollen, loose, indistinct, and distorted arrangement and a disorganized distribution among the stromal lamella (Figure 2L).

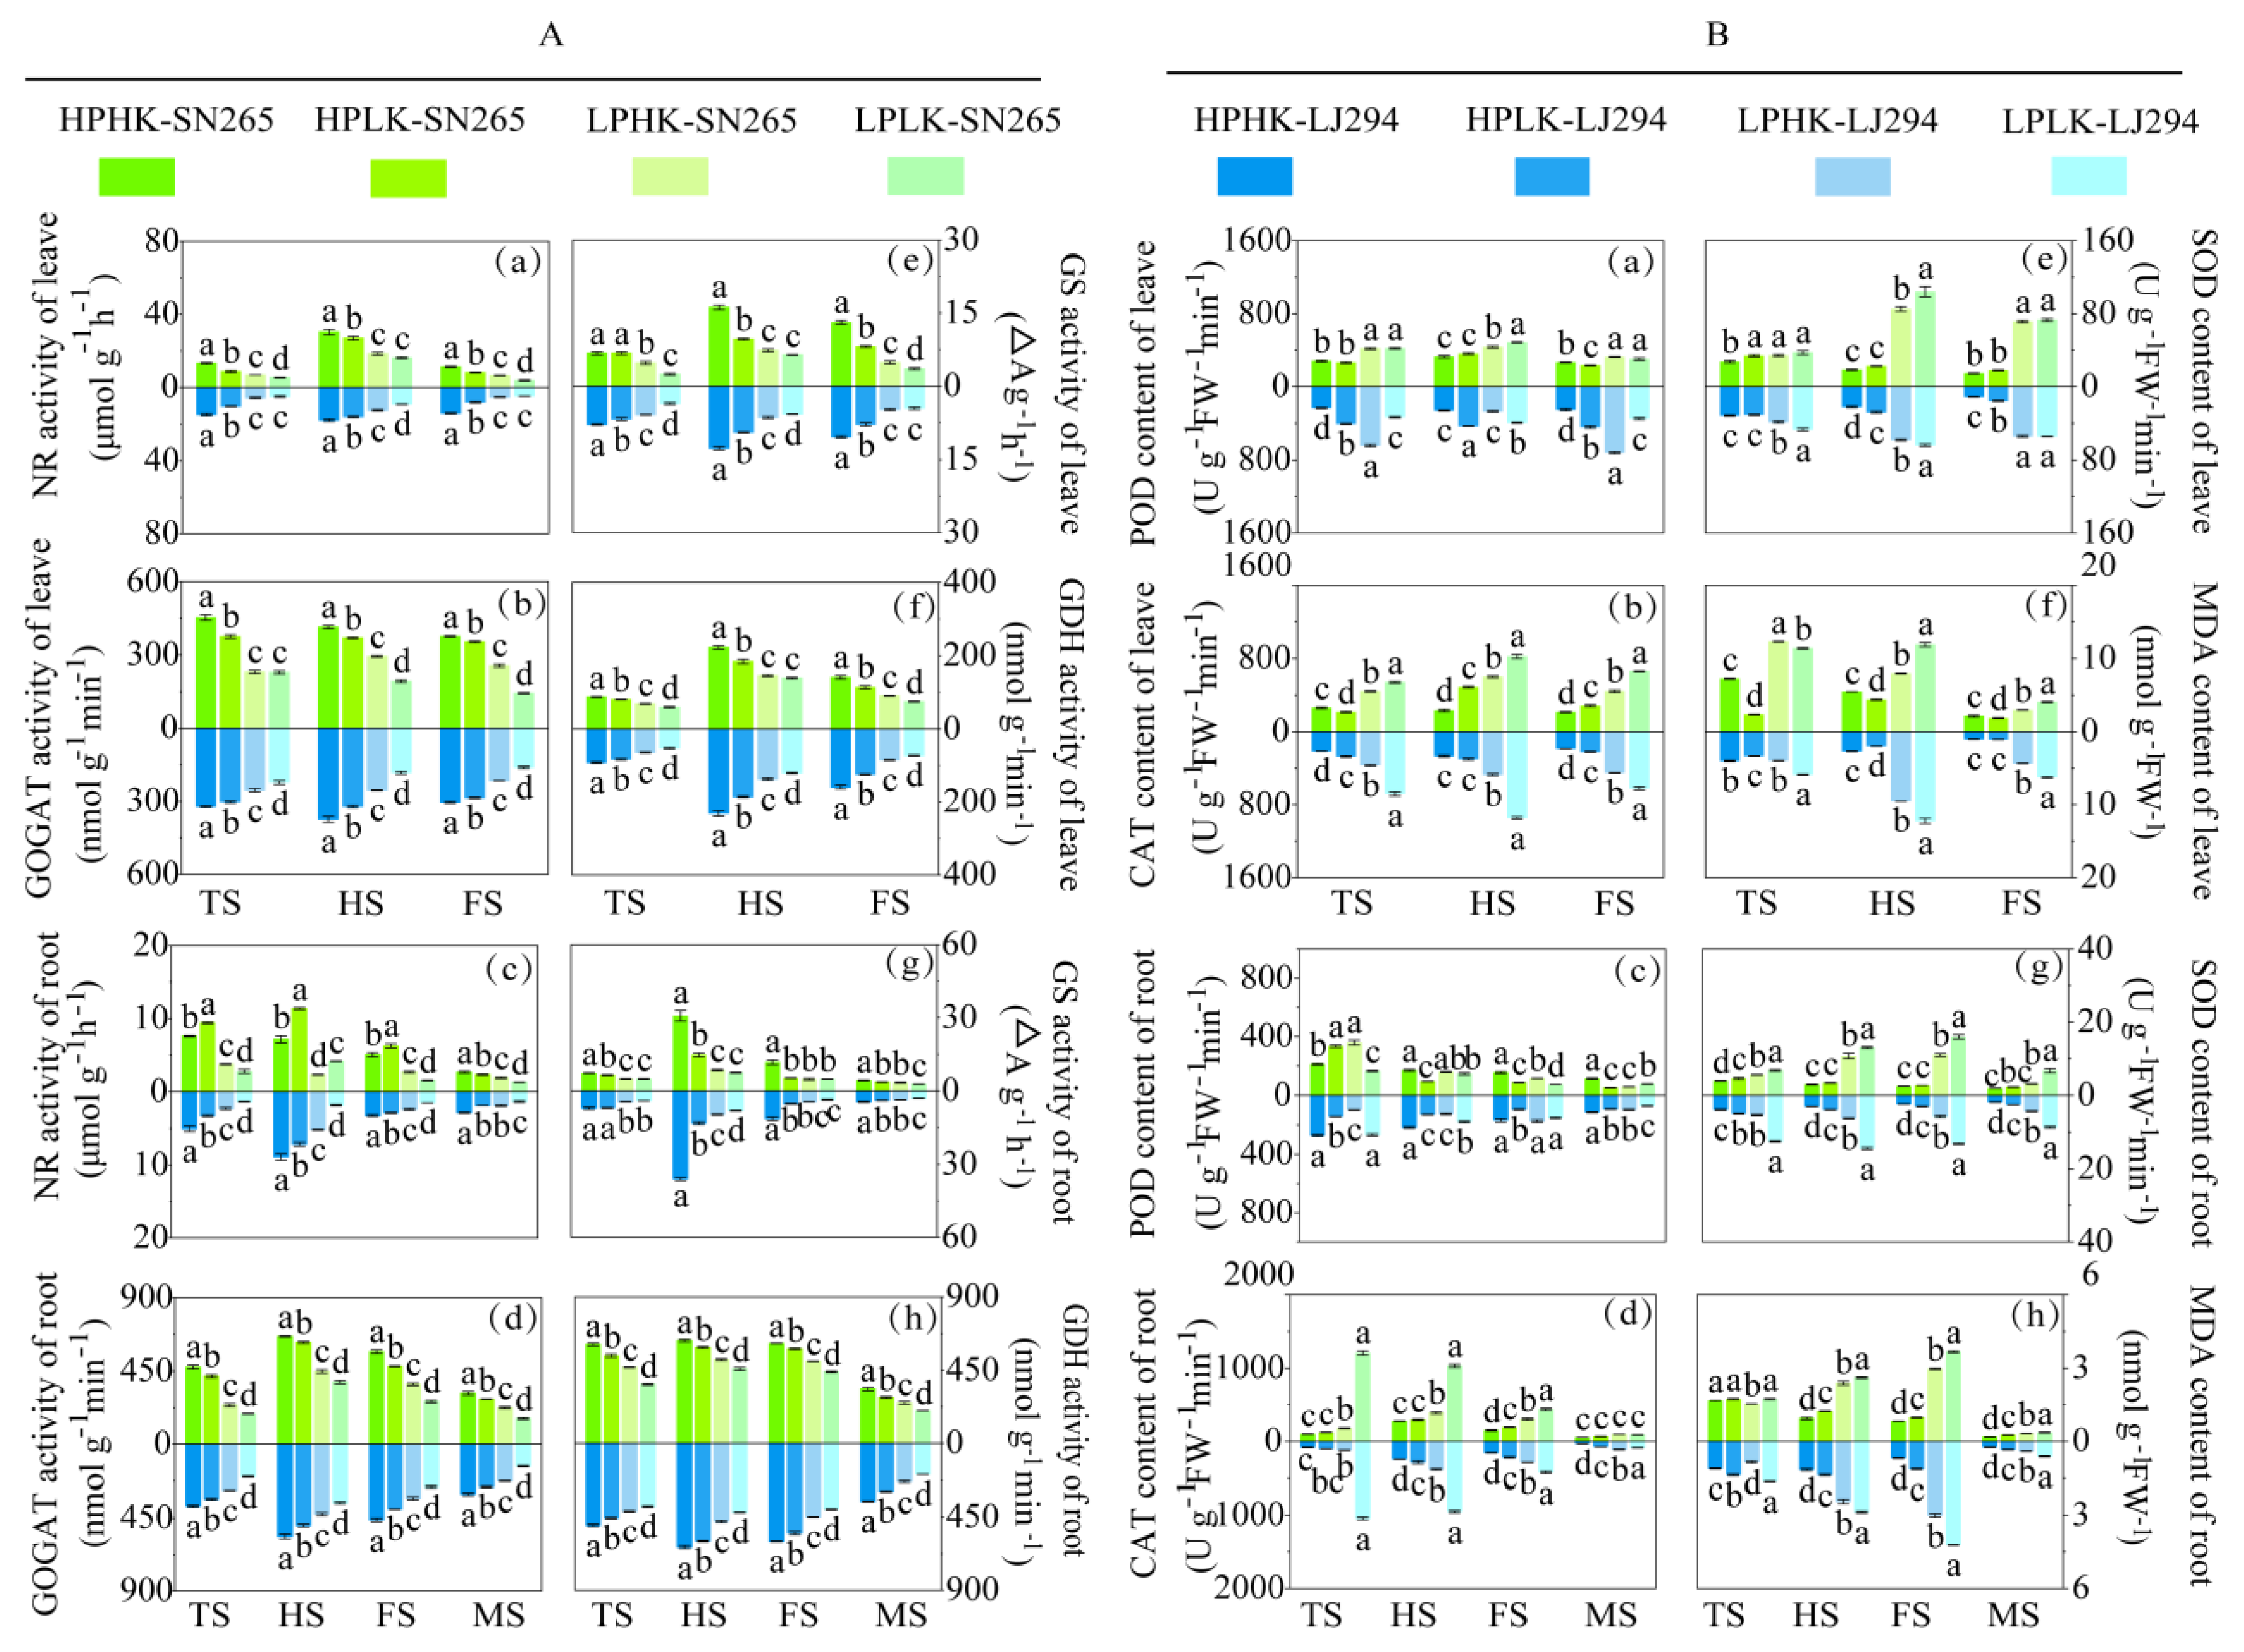
3.3. Leaf and Root Antioxidant Enzyme Activity, MDA Content, and N-Metabolizing Enzyme Activity

As shown in Figure 3A, an adequate P supply significantly increased the NR, GS, GOGAT, and GDH enzyme activities in the leaves of both varieties from the tillering stage to the filling stage, as compared to the LP treatments (Figure 3A(a,b,e,f)). Compared with the LP treatments, an adequate P supply significantly increased the NR enzyme activity from the tillering stage to the filling stage, the GS activity from the tillering stage to the full-heading stage, and the GOGAT and GDH activities from the tillering stage to the maturity stage in the roots of both varieties (Figure 3A(c,d,g,h)). Additionally, the HPHK treatment significantly increased the leaf N-metabolizing enzyme activity and root GS, GOGAT, and GDH activities in both varieties, as compared to the HPLK treatment; this was with the exception of the GS activity of SN265 at the tillering stage. Compared to the LP treatments, the NR, GS, GOGAT, and GDH activities of the leaves of the two varieties under the HPHK treatment were significantly increased by 43.52% to 201.76%, 34.05% to 266.25%, 26.69% to 162.30%, and 26.80% to 119.23%, respectively; additionally, the NR, GOGAT and GDH activities of the roots of the two varieties under the HPHK treatment were significantly increased by 0.35 to 3.86 times, 0.32 to 1.55 times, and 20.71% to 86.00%, respectively.
As shown in Figure 3B, compared to the LP treatments, an adequate P supply significantly reduced the SOD and CAT activities and the MDA content of the leaves and roots from the full-heading stage to the filling stage in both varieties (Figure 3A). Additionally, compared to the LP treatments, the HPHK treatment also significantly reduced the leaf SOD and POD activities at the tillering stage for both varieties. There was no significant similarity between the HPLK and HPHK treatments. The SOD and CAT activities and the MDA content of both varieties under the HPHK treatment were significantly reduced by 62.05% to 82.31%, 43.31% to 71.80%, and 27.58% to 83.88%, respectively, from the full-heading stage to the filling stage, as compared to the LP treatments, respectively (Figure 3B(b,e,f)). Compared to the LP treatments, the root SOD and CAT activities and the MDA content of the two varieties were significantly reduced under the HPHK treatment by 52.21% to 84.25%, 30.28% to 74.27%, and 52.38% to 83.68%, respectively, from the full-heading stage to the filling stage, respectively (Figure 3B(d,g,h)).

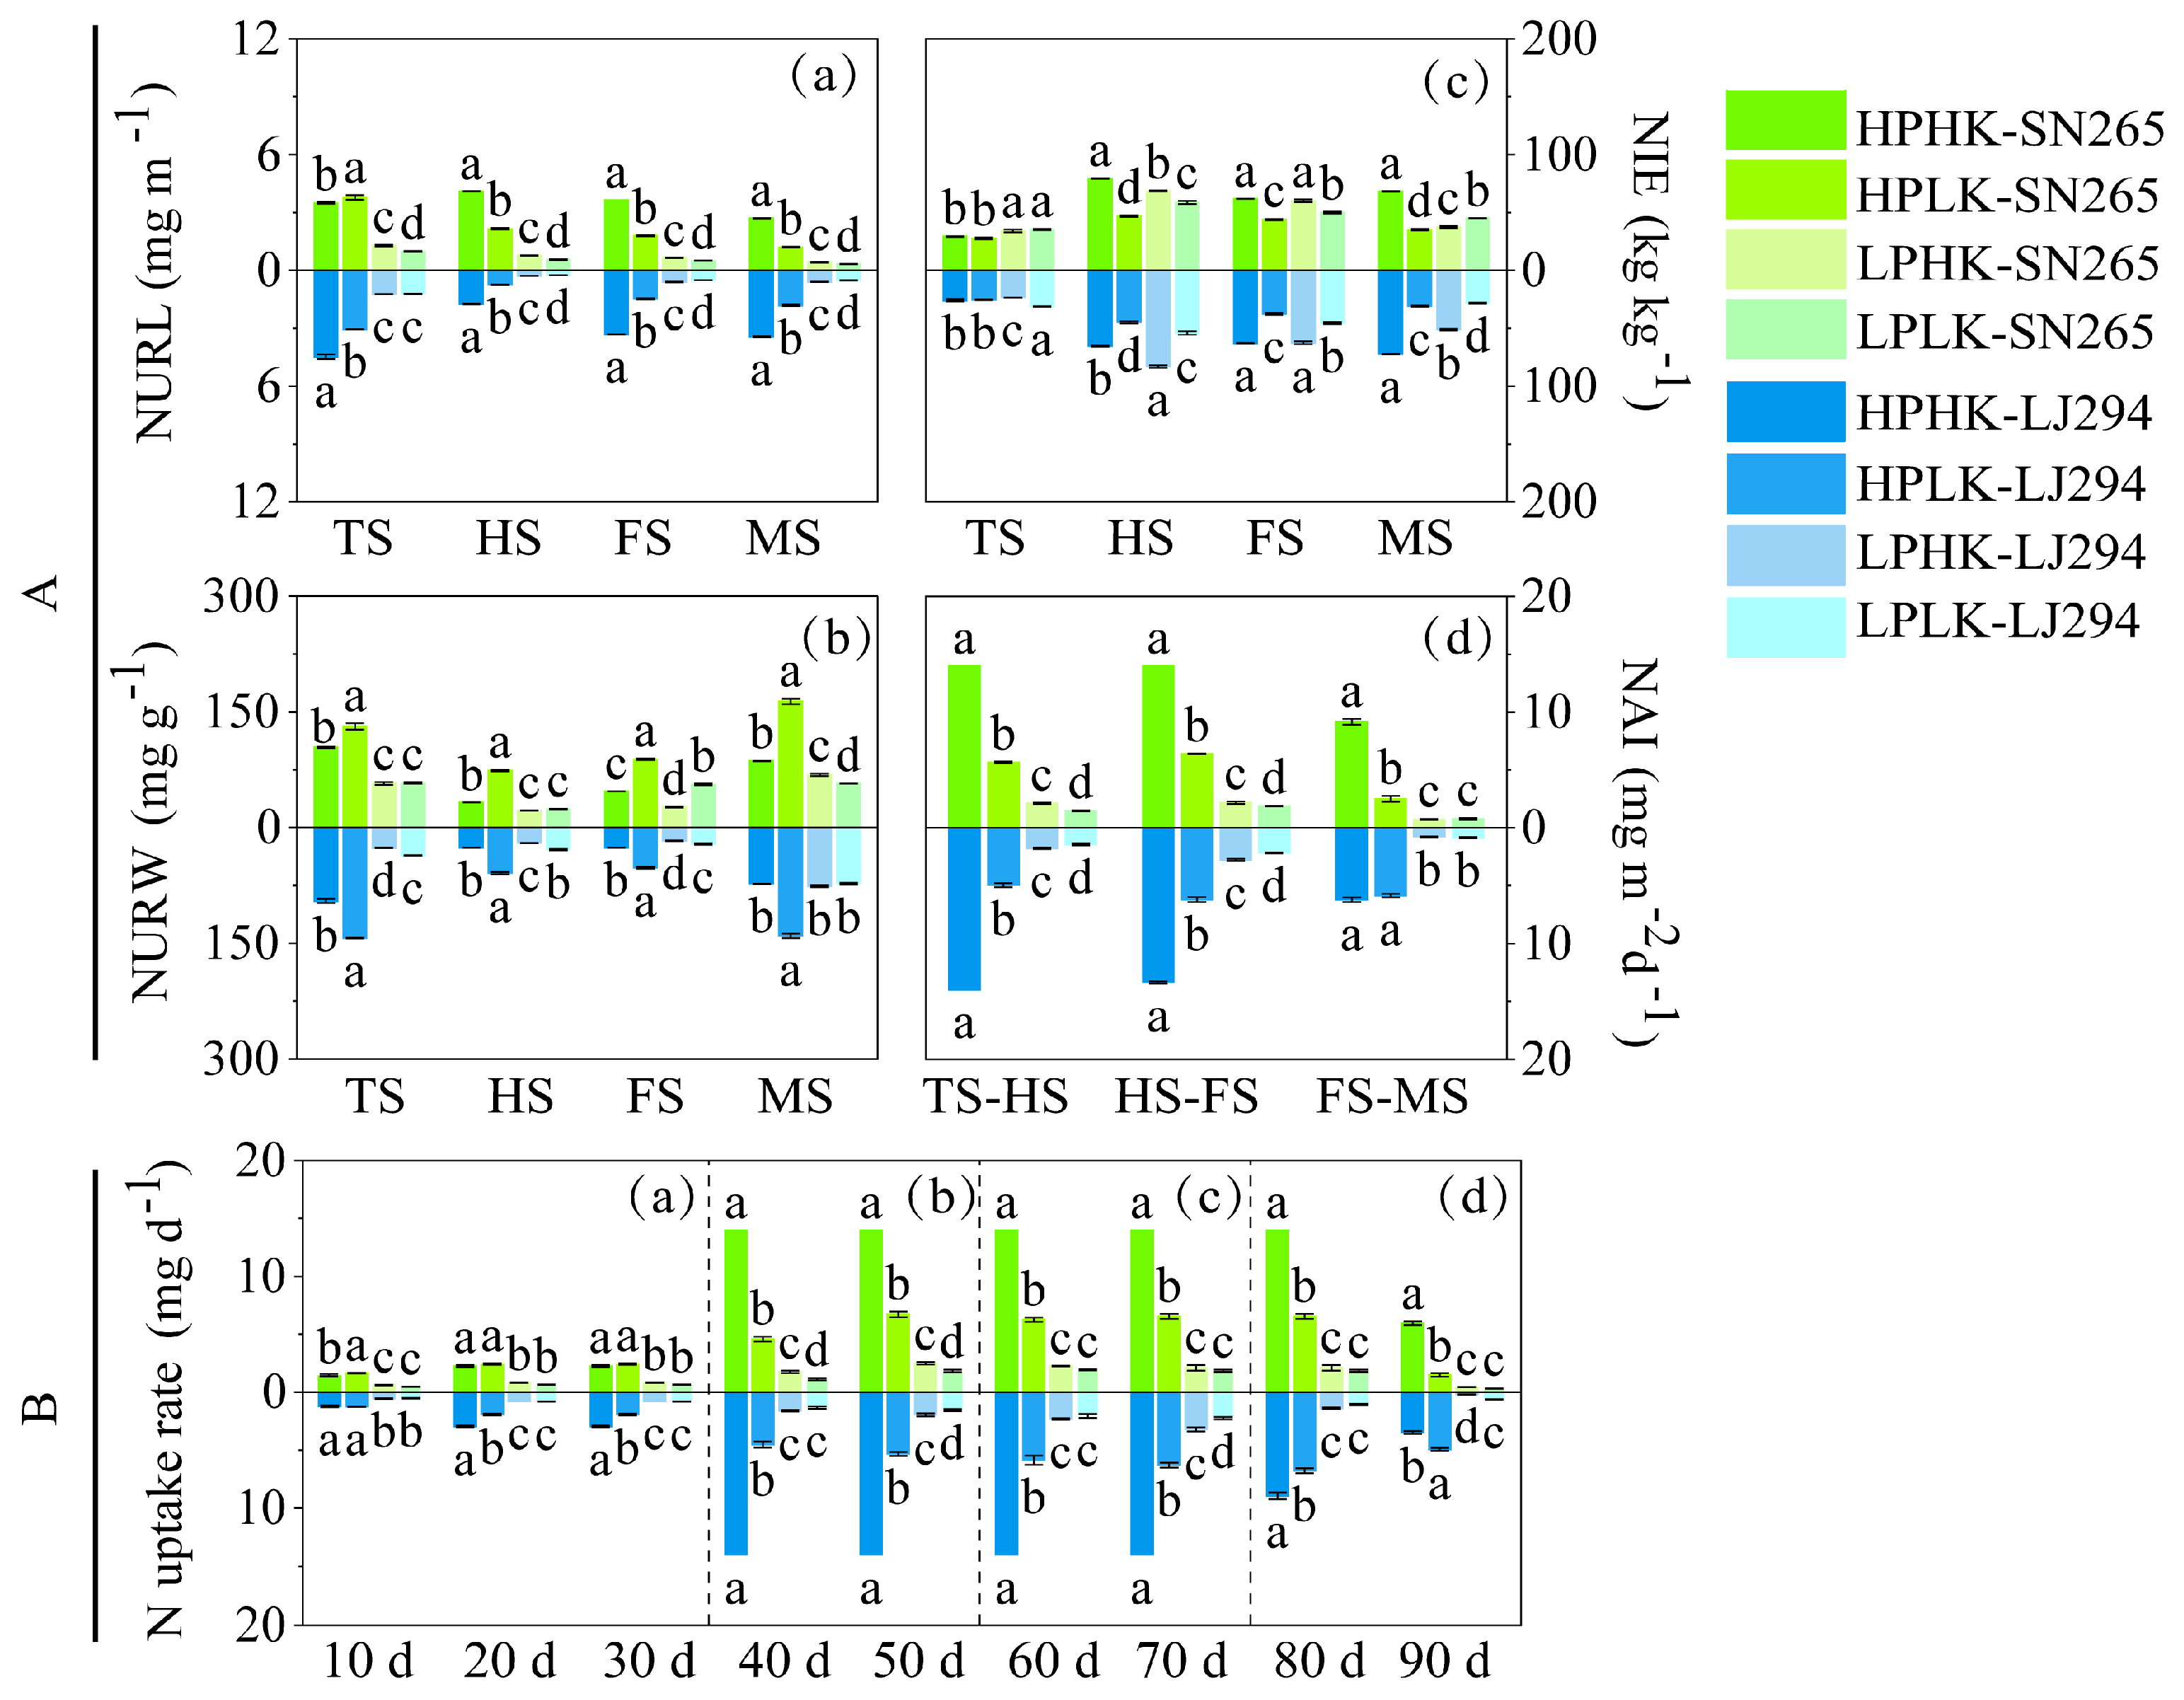
3.4. Content and Accumulation of N in Various Organs

As shown in Figure 4A, the HPHK treatment significantly increased the SNC at the tilling stage and the LNC from the tillering to the full-heading stage in both varieties and significantly decreased the PNC at the maturity stage in both varieties, as compared to the LP treatments. The HPLK treatment significantly increased the SNC at the tillering and filling stages; it also significantly increased the LNC from the tillering to the maturity stage and the PNC from the full-heading stage to the maturity stage in both varieties, as compared to the LP treatments. Additionally, the HPHK treatment significantly decreased the SNC and LNC from the full-heading stage to the maturity stage and the PNC from the tillering to the filling stage, as compared to the HPLK treatment. Compared to the LP treatments, under the HPHK treatment, the SNC of both varieties significantly increased by 23.45% to 48.04% (Figure 4A(a)), the LNC significantly increased by 0.10 to 1.05 times (Figure 4A(b)), and the PNC significantly decreased by 35.40% to 64.45% (Figure 4A(c)). From the tillering stage to the maturity stage, the ANC was greatest under the HPLK treatment and was significantly different from the other treatments at the tillering and full-heading stages (Figure 4A(d)). The RNC peaked in the HPLK treatment from the tillering to the full-heading stage and was significantly different from the LP treatments (Figure 4A(e)). Additionally, there was no significant trend among the HPHK, LPHK, and LPLK treatments.
As shown in Figure 4B, an adequate P supply significantly increased the SNA at the tillering and filling stages (Figure 4B(a)), the LNA from the tillering to the maturity stage (Figure 4B(b)), and the PNA from the full-heading stage to the maturity stage (Figure 4B(c)) in both varieties, as compared to LP. Additionally, the HPHK treatment significantly increased the LNA and PNA from the full-heading stage to the maturity stage in both varieties, as compared to the HPLK treatment. An adequate P supply significantly increased the ANA and TNA in both varieties from the full-heading to the maturity stage, as compared to the LP treatments (Figure 4B(d,f)), with these indices being significantly higher under the HPHK treatment than the HPLK treatment. Furthermore, the RNA of both varieties peaked under the HPHK treatment and was significantly higher than under the other treatments from the full-heading stage to the maturity stage (Figure 4B(c)). These results indicate that, although the HPHK treatment decreased the PNC at the maturity stage, it effectively increased the SNC and LNC of both varieties in the early growth stage. Additionally, the HPHK treatment effectively promoted TNA and N accumulation in various organs of both varieties in the late growth stages.

3.5. Root- and Grain-Yield-Related N Efficiency

As shown in Figure 5A, the NIE of the two varieties increased and then decreased throughout the growth period. The NuRL and NAI gradually decreased, while the NuRW decreased and then increased.
Compared to the LP treatments, an adequate P supply significantly increased the NuRL of the two varieties at all growth stages. Under the HPHK treatment, the NuRL increased by 1.70- to 7.05-fold for SN265 and 2.64- to 6.14-fold for LJ294, while under the HPLK treatment, the increase ranged from 1.75- to 2.84-fold for SN265 and 1.45- to 2.56-fold for LJ294. The value of NuRL was significantly higher under the HPHK treatment compared to the HPLK treatment and was significantly higher under the LPHK treatment compared to the LPLK treatment from the full-heading stage to the maturity stage (Figure 5A(a)). The NuRW of both varieties at all growth stages peaked under the HPLK treatment and was significantly higher than under the other treatments (Figure 5A(b)). Compared to the LP treatments, the HPHK treatment significantly increased the NuRW of SN265 at the main growth stages (tillering, full-heading, and maturity) by 26.17% to 82.56% and increased that of LJ294 at the tillering and filling stages by 0.21 to 2.58 times. The LPHK treatment significantly decreased the NuRW of LJ294 from the tillering to the filling stage compared to the LPLK treatment.
An adequate K supply significantly increased the NIE of both varieties compared to the LK treatments at the full-heading and filling stages. The increase ranged from 20.95% to 69.31% for both varieties under the HPHK treatment and from 16.82% to 85.68% for both varieties under the LPHK treatment. There was no significant trend in the NIE under the HPHK and HPLK treatments (Figure 5A(c)). Additionally, an adequate P supply significantly increased the NAI at all growth stages in both varieties as compared to the LP treatments. The increase ranged from 3.81- to 11.55-fold for both varieties under the HPHK treatment and from 1.24- to 6.35-fold for both varieties under the HPLK treatment (Figure 5A(d)).

3.6. Nitrogen Uptake Rate (NUR) in Water Samples

As shown in Figure 5B, the effects of the different treatments on the NUR in water samples during the two varieties’ entire growth period differed. The NUR in the water samples of both varieties under an adequate P supply was significantly higher than under the LP treatments from days 10 to 30, which corresponds to the transplanting to the tillering stages of the rice plants. In this period, the NUR of SN265 and LJ294 ranged from 1.11 to 2.12 mg·d−1 and 1.01 to 3.18 mg·d−1, respectively, under the HPHK treatment, respectively. Additionally, under the HPHK treatment, the NUR of the two varieties significantly increased by 2.86- to 9.64-fold and 3.93- to 9.47-fold, respectively, compared to the with LP treatments (Figure 5B(a)).
From day 40 to 50 and day 60 to 70, corresponding to the tillering stage to the full-heading stage and the full-heading stage to the filling stage, respectively, the NUR in the water samples of SN265 and LJ294 peaked under the HPHK treatment, both at 14.00 mg·d−1, followed by HPLK; both were significantly higher than under the LP treatments. From day 40 to 50, under the HPHK treatment, the NUR of SN265 and LJ294 significantly increased by 4.62- to 11.39-fold and 4.29- to 9.52-fold, respectively, compared to the LP treatments (Figure 5B(b)). From day 60 to 70, under the HPHK treatment, the NUR of SN265 and LJ294 significantly increased by 5.23- to 6.61-fold and 3.36- to 5.81-fold, respectively, compared to the LP treatments (Figure 5B(c)).
From day 80 to 90, corresponding to the filling to the maturity stage, the NUR values of the water samples of both varieties under an adequate P supply were significantly higher than under the LP treatments. The NUR in the water samples under the HPHK treatment ranged from 5.95 to 12.37 mg·d−1 for SN265 and 3.48 to 8.95 mg·d−1 for LJ294, respectively. Under the HPHK treatment, the NUR values of SN265 and LJ294 were significantly higher than under the LP treatments, by 9.28- to 17.04-fold and 4.39- to 16.32-fold, respectively (Figure 5B(d)).
As shown in Table 2, the grain-yield- and root-related N efficiency of the two varieties differed significantly among the treatments. The order of the grain yield among the treatments was HPHK > HPLK > LPHK > LPK, the grain yield under the HPHK treatment was significantly higher than under the other treatments, and the grain yield under HPLK was significantly higher than under both LP treatments. This indicates that the effect of an adequate P supply on the grain yield was much greater than that of an adequate K supply. The grain yield of the two varieties was significantly increased by 14.30- to 21.20-fold under the HPHK treatment and by 1.77- to 4.16-fold under the HPLK treatment, as compared to under the LP treatments.
An adequate P supply significantly increased the NAE, NUE, and NHI of both varieties compared to the LP treatments. At the same time, the HPHK treatment also significantly increased the NUEb and NPE and significantly decreased the GNR. The HPHK treatment significantly increased the NUEb, NAE, NPE, and NUE of both varieties compared to the HPLK treatment. However, there was no significant trend in the NTE among the treatments. Compared to the other treatments, under the HPHK treatment, the NUEb significantly increased by 27.06% to 93.02% and 33.53% to 124.86% in SN265 and LJ294, respectively; the NAE significantly increased by 4.80- to 19.58-fold and 3.30- to 21.22-fold, respectively; the NPE significantly increased by 1.47- to 1.59-fold and 1.26- to 2.27-fold, respectively; the NUE significantly increased by 1.25- to 7.05-fold and 0.90- to 5.77-fold, respectively; and the GNR significantly decreased by 60.17% to 61.52% and 55.75% to 69.79%, respectively.

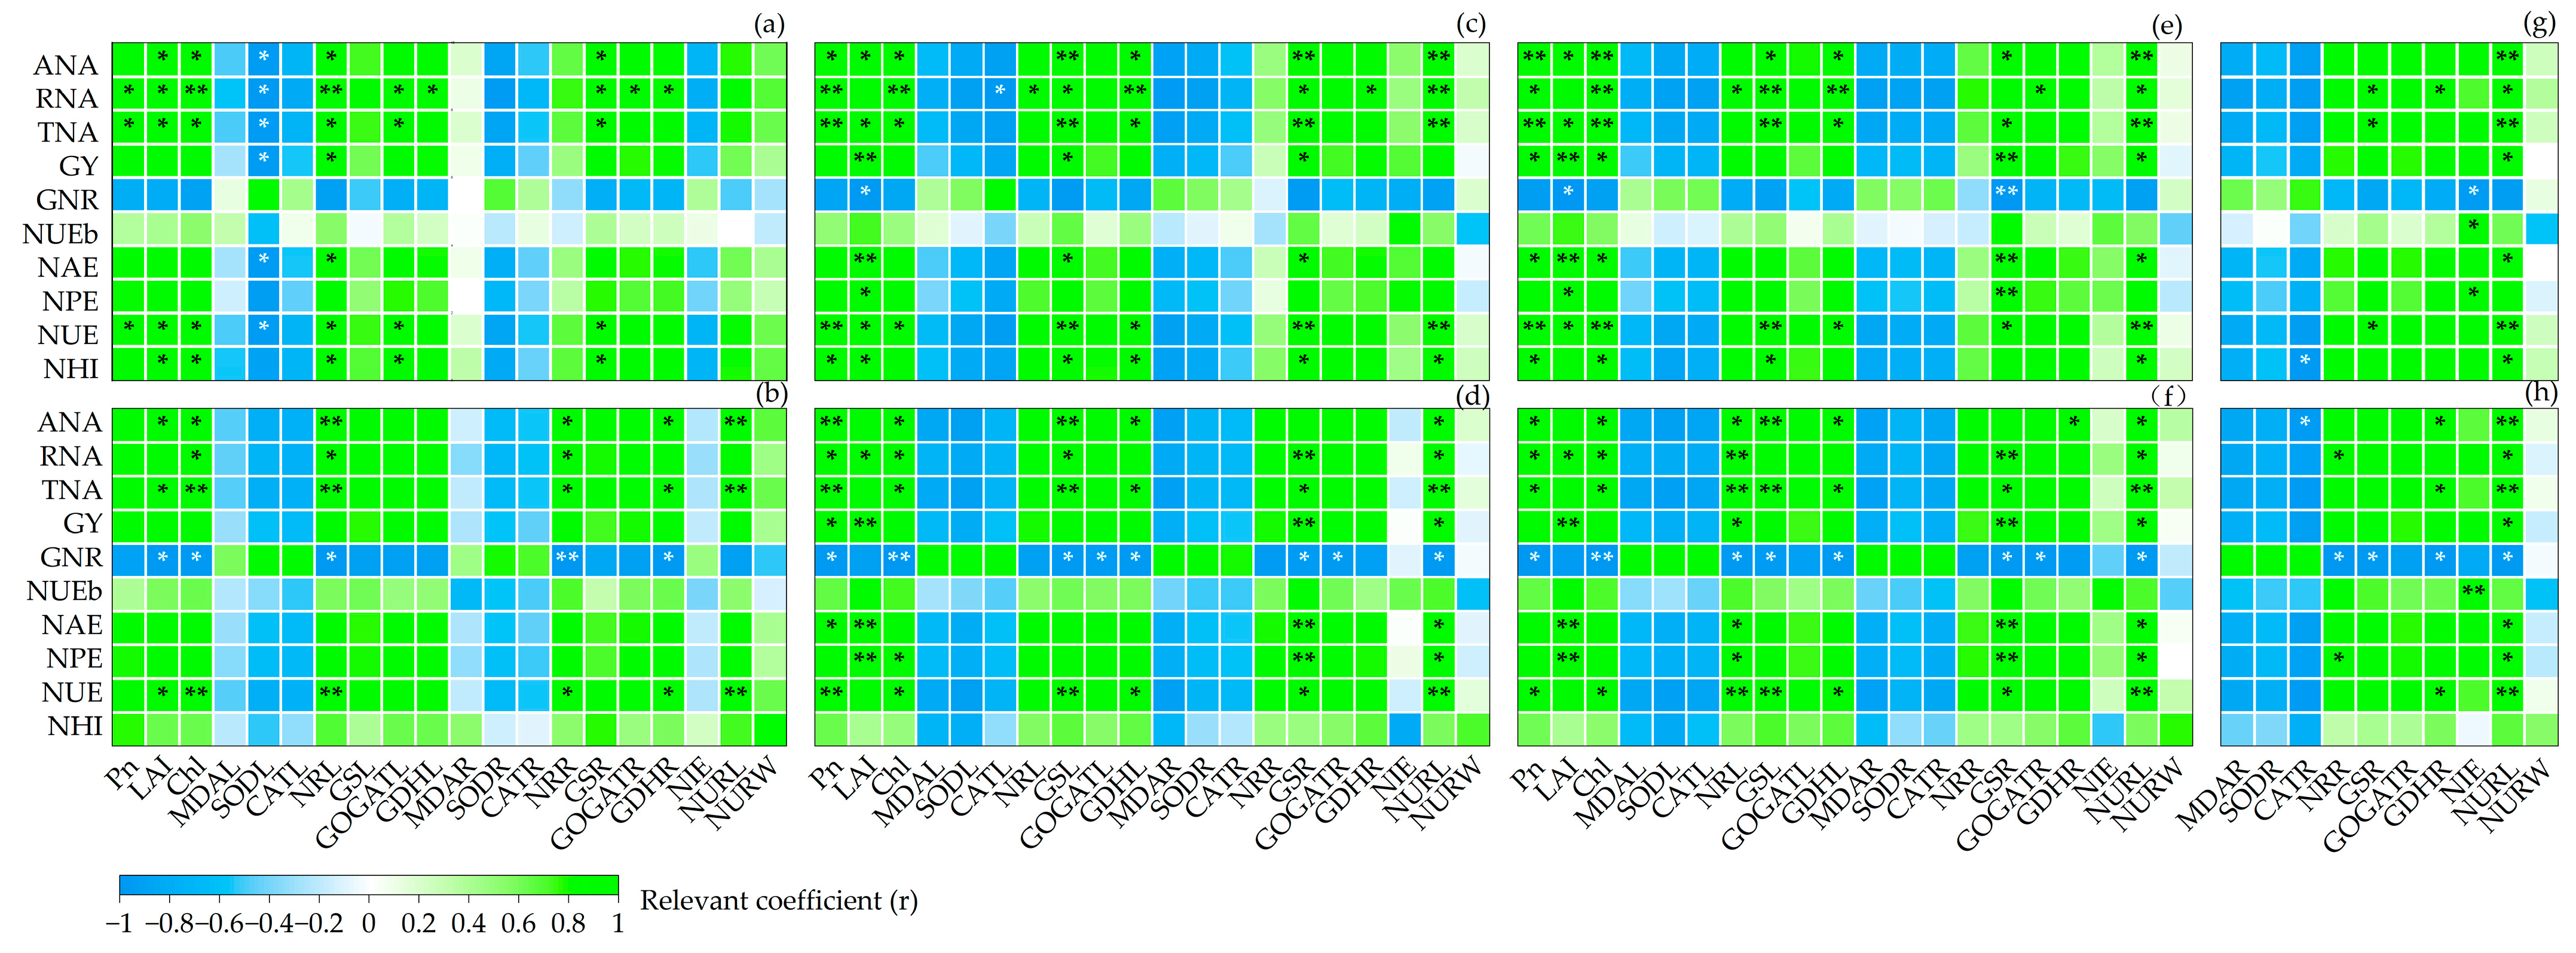
3.7. Correlations between the Indicators

As shown in Figure 6, the ANA, RNA, TNA, GY, NAE, NPE, NUE, and NHI were negatively correlated with the SOD and CAT activities in the roots and leaves of the two varieties and positively correlated with the N-metabolizing enzymes (NR, GS, GOGAT, and GDH) in the leaves and roots at all growth stages. Additionally, the ANA and TNA were significantly or highly significantly positively correlated with the Pn and Chl of the two varieties at the full-heading stage and the filling stage, with the GS activity in the roots of SN265 from the tillering stage to the filling stage and with the NuRL of LJ294 at all growth stages. The RNA was significantly or highly significantly positively correlated with the Chl of the two varieties, with the NR and GDH activities of SN265 leaves and with the NuRL of LJ294 from the full-heading stage to the maturity stage. The NAE and NPE were significantly or highly significantly positively correlated with the LAI of the two varieties from the full-heading stage to the filling stage.

4. Discussion

4.1. The Response Characteristics of Plant Growth and Stress Adaptation to the P and K Supply (Sufficient or Lacking)

Leaf P application was found to significantly increase the SOD, POD, and CAT activities and decrease the MDA content of wheat [40]. In the present study, although an adequate P supply significantly reduced the MDA content of the leaves and roots during the main growth stages, the SOD and CAT activities were also significantly reduced (Figure 3B(b,d–h)). This may have been because, on the one hand, the roles of P and K co-application and single P application on crops are different, and on the other hand, with a sufficient P and K supply, plants were not under stress, resulting in a lower MDA content and correspondingly lower antioxidant enzyme activities. However, under the LP treatments, the leaves and roots of the two varieties showed pronounced stress effects and the content of MDA increased significantly. Accordingly, the SOD and CAT activity significantly increased to adapt to the stressful environment. This is similar to the findings of Li et al. and Hafsi et al. [41,42], who concluded that P deficiency increases the SOD, POD, and CAT activities and K deficiency increases the SOD activity and MDA content of begonia plants.

4.2. The Characteristics of Plant Photosynthetic N Metabolism in Response to the P and K Supply (Sufficient or Lacking)

Good leaf development provides a favorable site for photosynthesis and significantly affects photosynthetic N metabolism. As one of the photosynthetic pigments, chlorophyll is important in studying plant photosynthetic mechanisms [43]. Suitable P application significantly affects the chlorophyll content of crops [44]. The degree of ultrastructural integrity of mesophytic cells, especially the normal development of chloroplasts, affects the photosynthetic rate of crops [45]. Low P can destroy the ultrastructure (chloroplasts, mitochondria, cytoplasm, etc.) of mesophyll cells, resulting in chloroplast ultrastructure disorders (such as chloroplast enlargement) [45,46,47]. P application can also increase the NR and GS activities of lettuce and promote the N metabolism of cucumber and wheat leaves [48,49,50]. Additionally, a low K supply accelerates chloroplast degradation and inhibits chlorophyll fluorescence properties [51]. However, the mechanism underlying the difference in leaf stomatal size and number has not been clarified in this study to provide insight into the relationship between the photosynthetic rate and chlorophyll content.
The suitable application of K can regulate photosynthesis and the photosynthetic pigment content of leaves and reduce the degradation rate of chloroplasts, thus increasing the photosynthetic rate [52,53]. Furthermore, K can significantly improve plant N metabolism enzymes, thus promoting photosynthesis and the assimilation and transport of photosynthetic products [54,55].
In the present study, adequate P supply significantly increased the leaf LAI and chlorophyll a, chlorophyll b, and chlorophyll contents of both cultivars (Figure 1 A(a,b,e,f)). Compared to the LP treatments, the increases in these indices under the HPHK treatment were significantly higher than under the HPLK treatment. Similarly, the plant growth (morphological characteristics) of both varieties peaked under the HPHK treatment. The effect of P on leaf growth was significantly greater than that of K. The ultrastructure of mesophyll cells (represented by nuclei, nuclear membranes, nucleolus, nuclear chromatin, chloroplasts, etc.) was relatively intact under an adequate supply of P and K (Figure 2). The Pn, E, Ci, and Tr values of the two varieties were significantly increased (Figure 1A(c,d,g,h)). Therefore, it was surmised that there may be a synergistic effect between a sufficient P and K supply; this maintains the normal function of photosynthetic organelles (chloroplasts) and reduces the rate of chloroplast degradation from the full-heading stage to the filling stage, thus enhancing the photosynthesis of leaves. Notably, although the integrity of the mesophyllous ultrastructure was better under the HPHK treatment compared to the LPLK treatment in the full-heading stage, some damage was still evident. This may have been because the measurement period was during the late growth stage, when the partial transfer of leaf nutrients to the panicle occurs, resulting in an insufficient leaf nutrient supply. Compared to the LP treatments, an adequate P supply significantly increased the activity of N-metabolizing enzymes (NR, GOGAT, and GDH) in the leaves (Figure 3A(a,b,e,f)) and roots (Figure 3A(c,d,g,h)) of both cultivars during the main growth stages. Simultaneously, compared to the HPLK treatment, an adequate supply of P and K significantly increases the N-metabolizing enzyme (GS, GOGAT, and GDH) activity of the leaves and roots during the main growth period. This indicates that the combined effect of a sufficient P and K supply was significantly greater than that of a sufficient P or sufficient K supply alone. In conclusion, a sufficient supply of P and K promoted leaf development, enhanced N metabolism enzyme activity and plant photosynthesis, and provided the possibility of further promoting the generation, assimilation, and transport of photosynthetic products. However, in order to more clearly identify the physiological and molecular mechanisms involved in the influence of the P and K supply on photosynthetic nitrogen metabolism, the relationship between the P and K supply and the expression of genes related to energy metabolism and photosynthetic nitrogen metabolism in rice plants needs to be further studied.

4.3. The Response Characteristics of Related N Uptake and N Efficiency in the Root–Grain–Nutrient Solution in Response to the P and K Supply (Sufficient or Lacking)

Enhancing plant photosynthetic N metabolism (such as the N metabolic enzymes and photosynthetic rate) promotes plant N uptake and improves N utilization efficiency [56,57]. Suitable P application was found to increase the GS and NR activities of alfalfa and improve plant N and P utilization [58]. K application increases the GS activity of cotton crops, decreases the GDH activity, increases the N content of wheat plants, promotes the N absorption and distribution of cotton plants, and improves the N utilization efficiency of both crops [55,59]. Additionally, NPK interaction promotes plant N uptake by improving the root morphology (root length, dry weight, NuRL, NuRW, and ROA) [60].
In the present study, compared to the LP treatments, an adequate P and K supply significantly increased the primary growth of the NuRL and NuRW in both cultivars (Figure 5A(a,b)). Additionally, an adequate P supply significantly promoted the plant ANA and RNA in the two varieties in the later growth stages (Figure 4B(d,e)) but had little effect on the N content in each organ (Figure 4A(a–e)). This suggests that an adequate P supply can increase the plant N accumulation and root N efficiency (NuRL and NuRW), regardless of a sufficient K supply. Furthermore, the enhancement of photosynthetic N metabolism mainly promoted the ANA and RNA but did not promote the increase in the N content. This may have been because an adequate P supply significantly increased the dry matter accumulation in the late growth period of the plants, and the dry matter accumulation rate did not match the N absorption rate. This resulted in an insignificant response of the plant N content to the different P and K treatments. The effect of a sufficient P supply on the ANA and RNA was not observed (Figure 4B(d,e)).
An increase in the plant N accumulation is conducive to improving the crop yield and N efficiency [61]. Suitable P application can effectively increase the N utilization efficiency and grain yield of maize [62]. Suitable K application significantly affects the wheat grain yield, NPE, and NAE [63]. In the present study, a sufficient P and K supply significantly increased the grain yield (NUEb, NAE, NPE, and NUE) of both varieties (Table 2). Additionally, the plant N accumulation (ANA, RNA, and TNA), grain yield, and N utilization efficiency (NAE, NPE, NUE, and NHI) were positively correlated with the plant N metabolism enzymes at each growth stage (Figure 6). These results indicate that P and K can promote N assimilation and absorption by increasing the activity of N-metabolizing enzymes, thus improving the rice yield and N utilization. Furthermore, the magnitude of the NAI is determined by the plant’s ability to absorb N from the nutrient solution. The HPHK treatment significantly increased the NAI and NUR at each growth stage of the two varieties. This indicates that these parameters were well matched at each stage and the effect of a sufficient P and K supply on N absorption was significantly higher than the effect of the other treatments.
In conclusion, a sufficient supply of P and K significantly reduced stress, enhanced photosynthetic N metabolism, promoted plant N absorption, and improved N efficiency and rice yield. In terms of these aspects, a sufficient supply of P and K (HPHK) maximized the synergistic effect of P and K co-application. In contrast, low P and K supplies highlighted the antagonistic effect of P and K co-application. However, only two conventional high-yield varieties were selected for this study; the responses of high-efficiency and low-efficiency genotypes to P and K were not tested. Additionally, research on the physiological mechanism of photosynthesis (such as energy metabolism, etc.) needs to be further developed. The characteristics of root morphology in response to different P and K supplies should also be a focus of future research.

5. Conclusions

The patterns of all indicators in the two varieties were essentially the same. An adequate supply of P and K reduced the degree of damage to the cell membrane system (expressed as the leaf and root SOD and CAT activities and the MDA content) and maintained a more complete mesophyll cell structure (in terms of the cell nucleus, nuclear membrane, nucleolus, chloroplast, etc.). This, in turn, contributed to the growth of the leaves and an increase in the photosynthetic capacity (expressed as the Chla, Chlb, and Chl contents, and the LAI, Pn, E, Ci, and Tr, etc.). An adequate P and K supply also promoted the plant N uptake (expressed as the aboveground and root N accumulation in the late growth stages) by increasing the leaf and root N-metabolizing enzyme activity (leaf NR, GS, GOGAT, and GDH; root NR, GOGAT, and GDH), which then increased the N utilization efficiency (expressed as the NuRL, NAI, NUR, NUEb, NAE, NPE, and NUE). Additionally, under P deficiency, the magnitude of changes in the plant’s photosynthetic N metabolism, N uptake, grain yield, and N uptake efficiency in the water samples was greater than that under K deficiency, suggesting that the effects of K on N-related indices were smaller. However, to promote the synergistic efficiency of plant P and K in the actual production of rice, it is still necessary to pay attention to the reasonable allocation of P and K.

Author Contributions

Conceptualization, W.Z.; methodology, Y.L. and J.G.; formal analysis, J.G., M.Z., Y.L. and L.C.; investigation, Y.L., L.C. and M.Z.; data curation, Y.L.; resources, W.Z.; Validation, L.C. and M.Z.; writing—original draft preparation, Y.L.; writing—review and editing, Y.L.; supervision, J.G., M.Z. and L.C.; project administration, J.G.; funding acquisition, W.Z. All authors have read and agreed to the published version of the manuscript.

Funding

This research was funded by the National Key R&D Program of China (2023YFD2301603) and LiaoNing Revitalization Talents Program (XLYC2002073). The funder is Wenzhong Zhang.

Data Availability Statement

The original contributions presented in the study are included in the article; further inquiries can be directed to the corresponding author/s.

Acknowledgments

The authors would like to thank Shenyang Agricultural University Kalima Rice Experiment Station for the research support.

Conflicts of Interest

The authors declare no conflicts of interest.

References

  1. Ye, T.; Li, Y.; Zhang, J.; Hou, W.; Zhou, W.; Lu, J.; Xing, Y.; Li, X. Nitrogen, phosphorus, and potassium fertilization affects the flowering time of rice (Oryza sativa L.). Glob. Ecol. Conserv. 2019, 20, e00753. [Google Scholar] [CrossRef]
  2. Yi, J.; Gao, J.; Zhang, W.; Zhao, C.; Wang, Y.; Zhen, X. Differential uptake and utilization of two forms of nitrogen in japonica rice cultivars from north-eastern China. Front. Plant Sci. 2019, 10, 1061. [Google Scholar] [CrossRef]
  3. Zhang, T.; Liu, J.; Zhang, H.; Lian, A.; Gao, F.; Zhang, Z.; Guo, Z. The Impact of Fertilizer Type on Dry Matter, Nitrogen Partitioning, and Yield of Spring Maize with Film-Side Sowing. Agronomy 2023, 13, 2999. [Google Scholar] [CrossRef]
  4. Jing, B.; Shi, W.; Diao, M. Nitrogen application levels based on critical nitrogen absorption regulate processing tomatoes productivity, nitrogen uptake, nitrate distributions, and root growth in Xinjiang, China. J. Arid. Land 2023, 15, 1231–1244. [Google Scholar] [CrossRef]
  5. Du, J.Y.; Ru, M.; Ni, W.Z. Effects of fertilization with reducing nitrogen, controlling phosphorus and stabilizing potassium on rice yield and nutrient accumulation. J. Plant Nutr. Fertil. 2013, 19, 523–533. [Google Scholar]
  6. Bernardi, A.C.D.C.; Carmello, Q.A.D.C.; Carvalho, S.A.D.; Machado, E.C.; Medina, C.L.; Gomes, M.D.M.D.A.; Lima, D.M. Nitrogen, phosphorus and potassium fertilization interactions on the photosynthesis of containerized citrus nursery trees. J. Plant Nutr. 2015, 38, 1902–1912. [Google Scholar] [CrossRef]
  7. Meike, S.; Peter, D.; Hölzl, G. Membrane Remodelling in Phosphorus-Deficient Plants. Annu. Plant Rev. Online 2018, 48, 237–263. [Google Scholar]
  8. Cochrane, T.T.; Cochrane, T.A. The vital role of potassium in the osmotic mechanism of stomata aperture modulation and its link with potassium deficiency. Plant Signal. Behav. 2009, 4, 240–243. [Google Scholar] [CrossRef] [PubMed]
  9. Wang, M.; Zheng, Q.; Shen, Q.; Guo, S. The critical role of potassium in plant stress response. Int. J. Mol. Sci. 2013, 14, 7370–7390. [Google Scholar] [CrossRef]
  10. Wang, S.; Liang, D.; Li, C.; Hao, Y.; Ma, F.; Shu, H. Influence of drought stress on the cellular ultrastructure and antioxidant system in leaves of drought-tolerant and drought-sensitive apple rootstocks. Plant Physiol. Biochem. 2012, 51, 81–89. [Google Scholar] [CrossRef]
  11. Ali, E.; Hussain, S.; Jalal, F.; Khan, M.A.; Imtiaz, M.; Said, F.; Ismail, M.; Khan, S.; Ali, H.; Shah, F.; et al. Salicylic acid-mitigates abiotic stress tolerance via altering defense mechanisms in Brassica napus (L.). Front. Plant Sci. 2023, 14, 1187260. [Google Scholar] [CrossRef]
  12. Zambrosi, F.C.; Mesquita, G.L.; Tanaka, F.A. Assessment of leaf ultrastructure offers insights into mechanisms regulating sugarcane performance under low-phosphorus stress. Acta Physiol. Plant. 2020, 42, 54. [Google Scholar] [CrossRef]
  13. Li, Q.; Sun, J. Microstructure and Ultrastructure in Plant Leaves of Cucumber as Influenced by Phosphorus. In Proceedings of the 2016 ASABE Annual International Meeting, American Society of Agricultural and Biological Engineers, Orlando, FL, USA, 17–20 June 2016; p. 1. [Google Scholar]
  14. Jiang, H.M.; Yang, J.C.; Zhang, J.F. Effects of external phosphorus on the cell ultrastructure and the chlorophyll content of maize under cadmium and zinc stress. Environ. Pollut. 2007, 147, 750–756. [Google Scholar] [CrossRef]
  15. Tang, Z.H.; Zhang, A.J.; Wei, M.; Chen, X.G.; Liu, Z.H.; Li, H.M.; Ding, Y.F. Physiological response to potassium deficiency in three sweet potato (Ipomoea batatas [L.] Lam.) genotypes differing in potassium utilization efficiency. Acta Physiol. Plant. 2015, 37, 184. [Google Scholar] [CrossRef]
  16. Zhao, D.; Oosterhuis, D.M.; Bednarz, C.W. Influence of potassium deficiency on photosynthesis, chlorophyll content, and chloroplast ultrastructure of cotton plants. Photosynthetica 2001, 39, 103–109. [Google Scholar] [CrossRef]
  17. Iqbal, A.; Qiang, D.; Xiangru, W.; Huiping, G.; Hengheng, Z.; Xiling, Z.; Meizhen, S. Phosphorus and carbohydrate metabolism contributes to low phosphorus tolerance in cotton. BMC Plant Biol. 2023, 23, 97. [Google Scholar] [CrossRef]
  18. Zhao, X.; Chen, K.K.; Wang, L.T.; Zhao, L.L.; Wang, P.C. Transcriptome analysis provides insights into the response of Lotus corniculatus roots to low-phosphorus stress. Front. Plant Sci. 2023, 14, 1089380. [Google Scholar] [CrossRef]
  19. Meng, X.; Chen, W.W.; Wang, Y.Y.; Huang, Z.R.; Ye, X.; Chen, L.S.; Yang, L.T. Effects of phosphorus deficiency on the absorption of mineral nutrients, photosynthetic system performance and antioxidant metabolism in Citrus grandis. PLoS ONE 2021, 16, e0246944. [Google Scholar] [CrossRef]
  20. Zahoor, R.; Zhao, W.; Dong, H.; Snider, J.L.; Abid, M.; Iqbal, B.; Zhou, Z. Potassium improves photosynthetic tolerance to and recovery from episodic drought stress in functional leaves of cotton (Gossypium hirsutum L.). Plant Physiol. Biochem. 2017, 119, 21–32. [Google Scholar] [CrossRef]
  21. Qi, D.U.; Zhao, X.H.; Le, X.I.A.; Jiang, C.J.; Wang, X.G.; Yi, H.A.N.; Yu, H.Q. Effects of potassium deficiency on photosynthesis, chloroplast ultrastructure, ROS, and antioxidant activities in maize (Zea mays L.). J. Integr. Agric. 2019, 18, 395–406. [Google Scholar]
  22. Hu, W.; Coomer, T.D.; Loka, D.A.; Oosterhuis, D.M.; Zhou, Z. Potassium deficiency affects the carbon-nitrogen balance in cotton leaves. Plant Physiol. Biochem. 2017, 115, 408–417. [Google Scholar] [CrossRef]
  23. Qu, C.; Liu, C.; Ze, Y.; Gong, X.; Hong, M.; Wang, L.; Hong, F. Inhibition of nitrogen and photosynthetic carbon assimilation of maize seedlings by exposure to a combination of salt stress and potassium-deficient stress. Biol. Trace Elem. Res. 2011, 144, 1159–1174. [Google Scholar] [CrossRef]
  24. Hou, W.; Xue, X.; Li, X.; Khan, M.R.; Yan, J.; Ren, T.; Cong, J.; Lu, J. Interactive effects of nitrogen and potassium on: Grain yield, nitrogen uptake and nitrogen use efficiency of rice in low potassium fertility soil in China. Field Crops Res. 2019, 236, 14–23. [Google Scholar] [CrossRef]
  25. Zhou, Q.; Tang, J.; Liu, C.; Huang, K.; Huang, X. Effects of phosphate fertilizer application on the growth and yield of tartary buckwheat under low-nitrogen condition. Agronomy 2023, 13, 1886. [Google Scholar] [CrossRef]
  26. Rao, D.-Y.; Zhou, F.; Zhou, S.-Y.; Liu, K.; Zi, X.-J.; Yang, Y.-Q.; Wu, B.-Z. Effects of nitrogen application rate and phosphorus fertilizer management on silage maize yield and nutrient utilization. J. South. Agric. 2023, 5, 90–101. [Google Scholar]
  27. Chen, X.-Y.; Liu, P.; Cheng, Y.; Dong, S.-T.; Zhang, J.-W.; Zhao, B.; Ren, B.-Z.; Han, K. The root-layer regulation based on the depth of phosphate fertilizer application of summer maize improves soil nitrogen absorption and utilization. Acta Agron. Sin. 2020, 46, 238–248. [Google Scholar]
  28. Chen, Y.; Zhou, T.; Wang, K.; Cui, Y.; Zhang, C.; Xu, K. Effect of phosphorus on nitrogen use efficiency and soil nitrate content of the wheat/maize/soybean relay-intercropping system. J. Soil Water Conserv. 2014, 28, 191–196+208. [Google Scholar]
  29. Yu, T.-Y.; Li, X.-L.; Lu, Y.; Sun, X.-W.; Zheng, Y.-M.; Wu, Z.-F.; Shen, P.; Wang, C.-B. Effect of phosphorus (P) on nitrogen (N) uptake and utilization in peanut. Acta Agron. Sin. 2019, 45, 912–921. [Google Scholar]
  30. Li, Q.; Chen, X.; Li, Y.; Zhang, X. Effect of different N/P fertilizer application on rice yield and N use efficiency in irrigation area of Ningxia. Chin. J. Agrometeorol. 2010, 31, 379. [Google Scholar]
  31. Kundu, A.; Raha, P.; Dubey, A.N. Impact of source and method of potassium application on dry matter accumulation and partitioning of potassium in rice (Oryza sativa L.). J. Soil Sci. Plant Nutr. 2021, 21, 2252–2263. [Google Scholar] [CrossRef]
  32. Reis, A.F.D.B.; Nascente, A.S.; Almeida, R.E.M.D.; Chagas, A.F. Growth and nutrient contents in lowland rice due to phosphorus and potassium fertilization. Pesqui. Agropecuária Trop. 2018, 48, 98–108. [Google Scholar] [CrossRef]
  33. Sun, Y.; Sun, Y.; Xu, H.; Wang, C.; Yang, Z.; Li, N.; Yan, F.; Li, Y.; Wang, H.; Ma, J. Effects of fertilizer levels on the absorption, translocation, and distribution of phosphorus and potassium in rice cultivars with different nitrogen-use efficiencies. J. Agric. Sci. 2016, 8, 38. [Google Scholar] [CrossRef]
  34. Zhang, B.; Wang, Y.; Liu, H.; Yang, X.; Yuan, P.; Wang, C.; Shi, L. Optimal phosphorus management strategies to enhance crop productivity and soil phosphorus fertility in rapeseed–rice rotation. Chemosphere 2023, 337, 139392. [Google Scholar] [CrossRef]
  35. Sharma, S.; Singh, J. Split application of potassium improves yield and potassium uptake of rice under deficient soils. J. Soil Water Conserv. 2021, 20, 213–220. [Google Scholar] [CrossRef]
  36. Zhang, S.Z.; Hua, B.Z.; Zhang, F. Induction of the activities of antioxidative enzymes and the levels of malondialdehyde in cucumber seedlings as a consequence of Bemisia tabaci (Hemiptera: Aleyrodidae) infestation. Arthropod-Plant Interact. 2008, 2, 209–213. [Google Scholar] [CrossRef]
  37. Zhou, Q.; Jiang, Z.; Zhang, X.; Zhang, T.; Zhu, H.; Cui, B.; Li, Y.; Zhao, F.; Zhao, Z. Leaf anatomy and ultrastructure in senescing ancient tree, Platycladus orientalis L. (Cupressaceae). PeerJ 2019, 7, e6766. [Google Scholar] [CrossRef]
  38. Wang, N.; Fu, F.; Wang, H.; Wang, P.; He, S.; Shao, H.; Ni, Z.; Zhang, X. Effects of irrigation and nitrogen on chlorophyll content, dry matter and nitrogen accumulation in sugar beet (Beta vulgaris L.). Sci. Rep. 2021, 11, 16651. [Google Scholar] [CrossRef]
  39. Teng, Y.; Han, H.; Hao, Z.; Yang, H.; Li, J. Effect of vegetable cropping system on total nitrogen, phosphorus and COD in farmland leachate. Chin. J. Eco-Agric. 2017, 25, 759–768. [Google Scholar]
  40. Lv, X.; Han, J.; Liao, Y.; Liu, Y. Effect of phosphorus and potassium foliage application post-anthesis on grain filling and hormonal changes of wheat. Field Crops Res. 2017, 214, 83–93. [Google Scholar] [CrossRef]
  41. Li, L.; Yang, H.; Ren, W.; Liu, B.; Cheng, D.; Wu, X.; Gong, J.; Peng, L.; Huang, F. Physiological and biochemical characterization of sheepgrass (Leymus chinensis) reveals insights into photosynthetic apparatus coping with low-phosphate stress conditions. J. Plant Biol. 2016, 59, 336–346. [Google Scholar] [CrossRef]
  42. Hafsi, C.; Romero-Puertas, M.C.; del Río, L.A.; Abdelly, C.; Sandalio, L.M. Antioxidative response of Hordeum maritimum L. to potassium deficiency. Acta Physiol. Plant. 2011, 33, 193–202. [Google Scholar] [CrossRef]
  43. Simkin, A.J.; Kapoor, L.; Doss, C.G.P.; Hofmann, T.A.; Lawson, T.; Ramamoorthy, S. The role of photosynthesis related pigments in light harvesting, photoprotection and enhancement of photosynthetic yield in planta. Photosynth. Res. 2022, 152, 23–42. [Google Scholar] [CrossRef]
  44. El-Mejjaouy, Y.; Lahrir, M.; Naciri, R.; Zeroual, Y.; Mercatoris, B.; Dumont, B.; Oukarroum, A. How far can chlorophyll a fluorescence detect phosphorus status in wheat leaves (Triticum durum L.). Environ. Exp. Bot. 2022, 194, 104762. [Google Scholar] [CrossRef]
  45. Ren, B.; Cui, H.; Camberato, J.J.; Dong, S.; Liu, P.; Zhao, B.; Zhang, J. Effects of shading on the photosynthetic characteristics and mesophyll cell ultrastructure of summer maize. Sci. Nat. 2016, 103, 67. [Google Scholar] [CrossRef]
  46. Sutinen, S.; Wallin, G.; Karlsson, P.E.; Skärby, L.; Selldén, G. Cell ultrastructure of needles from saplings of Norway spruce, Picea abies (L) Karst., exposed to ozone and low phosphorus supply in open-top chambers. Chemosphere 1998, 36, 691–696. [Google Scholar]
  47. Henningsen, J.N.; Venturas, M.D.; Quintero, J.M.; Garrido, R.R.; Mühling, K.H.; Fernández, V. Leaf surface features of maize cultivars and response to foliar phosphorus application: Effect of leaf stage and plant phosphorus status. Physiol. Plant. 2023, 175, e14093. [Google Scholar] [CrossRef]
  48. Wang, P.; Yin, Y.P.; Fu, G.Z.; Guo, Y.; Cai, R.G.; Liang, T.B.; Wang, Z.L. Effect of phosphorus on activities of enzymes related to nitrogen metabolism in flag leaves and protein content of wheat grains. J. Plant Nutr. Fertil. 2009, 15, 24–31. [Google Scholar]
  49. Ruiz, J.M.; Romero, L. Nitrogen metabolism and yield response of cucumber (Cucumis sativus L cv Brunex) plants to phosphorus fertilisation. J. Sci. Food Agric. 2000, 80, 2069–2073. [Google Scholar] [CrossRef]
  50. Azcón, R.; Gomez, M.; Tobar, R. Effects of nitrogen source on growth, nutrition, photosynthetic rate and nitrogen metabolism of mycorrhizal and phosphorus-fertilized plants of Lactuca sativa L. New Phytol. 1992, 121, 227–234. [Google Scholar] [CrossRef]
  51. Hu, W.; Lv, X.; Yang, J.; Chen, B.; Zhao, W.; Meng, Y.; Wang, Y.; Zhou, Z.; Oosterhuis, D.M. Effects of potassium deficiency on antioxidant metabolism related to leaf senescence in cotton (Gossypium hirsutum L.). Field Crops Res. 2016, 191, 139–149. [Google Scholar] [CrossRef]
  52. Ju, F.; Pang, J.; Huo, Y.; Zhu, J.; Yu, K.; Sun, L.; Loka, D.; Hu, W.; Zhou, Z.; Wang, S.; et al. Potassium application alleviates the negative effects of salt stress on cotton (Gossypium hirsutum L.) yield by improving the ionic homeostasis, photosynthetic capacity and carbohydrate metabolism of the leaf subtending the cotton boll. Field Crops Res. 2021, 272, 108288. [Google Scholar] [CrossRef]
  53. Pan, Y.; Lu, Z.; Lu, J.; Li, X.; Cong, R.; Ren, T. Effects of low sink demand on leaf photosynthesis under potassium deficiency. Plant Physiol. Biochem. 2017, 113, 110–121. [Google Scholar] [CrossRef] [PubMed]
  54. Zahoor, R.; Dong, H.; Abid, M.; Zhao, W.; Wang, Y.; Zhou, Z. Potassium fertilizer improves drought stress alleviation potential in cotton by enhancing photosynthesis and carbohydrate metabolism. Environ. Exp. Bot. 2017, 137, 73–83. [Google Scholar] [CrossRef]
  55. Ahanger, M.A.; Tittal, M.; Mir, R.A.; Agarwal, R.M. Alleviation of water and osmotic stress-induced changes in nitrogen metabolizing enzymes in Triticum aestivum L. cultivars by potassium. Protoplasma 2017, 254, 1953–1963. [Google Scholar] [CrossRef] [PubMed]
  56. Chen, X.; Guo, P.; Wang, Z.; Liang, J.; Li, G.; He, W.; Zhen, A. Grafting improves growth and nitrogen-use efficiency by enhancing NO3− uptake, photosynthesis, and gene expression of nitrate transporters and nitrogen metabolizing enzymes in watermelon under reduced nitrogen application. Plant Soil 2022, 480, 305–327. [Google Scholar] [CrossRef]
  57. Zhou, H.; Zhao, Q.; He, R.; Zhang, W.; Zhang, H.; Wang, H.; Ao, X.; Yao, X.; Xie, F. Rapid effect of enriched nitrogen on soybean nitrogen uptake, distribution, and assimilation during early flowering stage. J. Soil Sci. Plant Nutr. 2022, 22, 3798–3810. [Google Scholar] [CrossRef]
  58. Yu, T.F.; Liu, X.J.; Hao, F. Effect of phosphate fertilizer application on alfalfa yield, nutritive value and N and P use efficiency. Acta Prataculturae Sin. 2018, 27, 154–163. [Google Scholar]
  59. Chen, P.; Li, L.; Xia, S.; Zhang, R.; Zhang, R.; Zeng, X.M.; Shuai, D.; Liu, Y.; Li, Z.G. Enhancement patterns of potassium on nitrogen transport and functional genes in cotton vary with nitrogen levels. Plant Sci. 2023, 335, 111824. [Google Scholar] [CrossRef] [PubMed]
  60. Du, M.; Zhang, W.; Gao, J.; Liu, M.; Zhou, Y.; He, D.; Zhao, Y.; Liu, S. Improvement of root characteristics due to nitrogen, phosphorus, and potassium interactions increases rice (Oryza sativa L.) yield and nitrogen use efficiency. Agronomy 2021, 12, 23. [Google Scholar] [CrossRef]
  61. Li, Q.; Kong, F.; Wu, Y.; Feng, D.; Jichao, Y. Increasing nitrogen accumulation and reducing nitrogen loss with N-efficient maize cultivars. Plant Prod. Sci. 2020, 23, 260–269. [Google Scholar] [CrossRef]
  62. Fosu-Mensah, B.Y.; Mensah, M. The effect of phosphorus and nitrogen fertilizers on grain yield, nutrient uptake and use efficiency of two maize (Zea mays L.) varieties under rain fed condition on Haplic Lixisol in the forest-savannah transition zone of Ghana. Environ. Syst. Res. 2016, 5, 22. [Google Scholar] [CrossRef]
  63. Qian, C.; Chen, L.; Ma, Q.; Li, C.; Zhu, M.; Zhu, X.; Ding, J.; Guo, W. Effects of phosphorus and potassium fertilizer on grain yield, nutrient uptake and utilization in low-gluten wheat. J. Plant Nutr. Fertil. 2023, 29, 287–299. [Google Scholar]
Figure 1. Chlorophyll content, leaf area index, photosynthesis during the tillering–filling stages, and plant morphological characteristics at the full-heading stage under different the P and K treatments. (A) Chlorophyll a content (a), chlorophyll b content (b), Pn (c), E (d), chlorophyll content (e), LAI (f), Ci (g), and Tr (h). (B). Morphology of SN265 (a) and morphology of LJ294 (b), respectively. TS, HS, and FS represent the tillering stage, the full-heading stage, and the filling stage, respectively. The data above the origin of the Y-axis represent SN265, and the data below represent LJ 294. The treatments were HPHK (adequate supply of P and K), HPLK (adequate supply of P and low K level), LPHK (low P level and adequate supply of K), and LPLK (low P and K levels), respectively. The error lines indicate ± standard deviation; different lowercase letters indicate significant differences among the treatments at the p < 0.05 level.
Agronomy 14 01726 g001
Figure 2. Ultrastructure of mesophyll cells of the two varieties at the full-heading stage of the two varieties under the HPHK and LPLK treatments. (AC) Ultrastructure of SN265 mesophyll cells under the HPHK treatment: 2 μm, 10,000× (A), 1 μm, 20,000× (B), and 500 nm, 40,000× (C). (DF) Ultrastructure of SN265 mesophyll cells under the LPLK treatment: 2 μm, 7000× (D), 1 μm, 20,000× (E), and 500 nm, 30,000× (F). (GI) Ultrastructure of LJ294 mesophyll cells under the HPHK treatment: 2 μm, 10,000× (G), 1 μm, 20,000× (H), and 500 nm, 30,000× (I). (JL) Ultrastructure of LJ294 mesophyll cells under the LPLK treatment: 2 μm, 5000 × (J), 1 μm, 20,000× (K), and 500 nm, 30,000× (L). N—cell nucleus; Nu—chromatin; NE—nuclear membrane; NuE—nucleolus; CH—chloroplast; V—vesicle; OG—osmiophilic granules; Mi—mitochondria; GL—granum lamella; SL—stromal lamella; SG—starch grain; CHM—chloroplast membrane; Pla—plasmodesmata; C—inner ridges in mitochondria.
Agronomy 14 01726 g002
Figure 3. Leaf and root antioxidant enzymes, MDA content and N-metabolism-related enzymes under the different P and K treatments. Leaf N-metabolism-related enzymes (A): leaf NR (a), leaf GOGAT (b), root NR (c), root GOGAT (d), leaf GS (e), leaf GDH (f), root GS (g), and root GDH (h). Leaf and root antioxidant enzymes activities and MDA content (B): leaf POD (a), leaf CAT (b), root POD (c), root CAT (d), leaf SOD (e), leaf MDA (f), root SOD (g), and root MDA (h). TS, HS, FS, and MS represent the tillering stage, the full-heading stage, the filling stage, and the maturity stage, respectively. The data above the origin of the Y-axis represent SN265, and the data below represent LJ 294. The treatments were HPHK (adequate supply of P and K), HPLK (adequate supply of P and low K level), LPHK (low P level and adequate supply of K), and LPLK (low P and K levels), respectively. The error lines indicate ± standard deviation; different lowercase letters indicate significant differences among the treatments at the p < 0.05 level.
Agronomy 14 01726 g003
Figure 4. Contents and accumulation of N in various organs under the different P and K treatments. N content (A): stem sheath N (a), leaf N (b), panicle N (c), aboveground N (d), and root N content (e). N accumulation (B): stem sheath N (a), leaf N (b), panicle N (c), aboveground N (d), root N (e), and plant N accumulation per hill (f). TS, HS, FS, and MS represent the tillering stage, the full-heading stage, the filling stage, and the maturity stage, respectively. The data above the origin of the Y-axis represent SN265, and the data below represent LJ 294. The treatments were HPHK (adequate supply of P and K), HPLK (adequate supply of P and low K level), LPHK (low P level and adequate supply of K), and LPLK (low P and K levels), respectively. The error lines indicate ± standard deviation; different lowercase letters indicate significant differences among the treatments at the p < 0.05 level.
Agronomy 14 01726 g004
Figure 5. Root-related N efficiency and nitrogen uptake rate (NUR) in water samples under the different P and K treatments. Root-related N efficiency (A): NuRL (a), NuRW (b), NIE (c), and NAI (d). NUR (B). Duration: 10 d to 30 d (a), 40 d to 50 d (b), 60 d to 70 d (c), and 80 d to 90 d (d). TS, HS, FS, and MS represent the tillering stage, the full-heading stage, the filling stage, and the maturity stage, respectively. The data above the origin of the Y-axis represent SN265, and the data below represent LJ 294. The treatments were HPHK (adequate supply of P and K), HPLK (adequate supply of P and low K level), LPHK (low P level and adequate supply of K), and LPLK (low P and K levels), respectively. The error lines indicate ± standard deviation; different lowercase letters indicate significant differences among the treatments at the p < 0.05 level.
Agronomy 14 01726 g005
Figure 6. Heat map of the correlations between the grain yield, root and yield-related N efficiency and physiological indices under the different P and K treatments. GY: grain yield, CHl: chlorophyll content, MDAL: leaf MDA content, SODL: leaf SOD activity, CATL: leaf CAT activity, MDAR: root MDA content, SODR: root SOD activity, CATR: root CAT activity, NRL: leaf NR activity, GSL: leaf GS activity, GOGATL: leaf GOGAT activity, GDHL: leaf GDH activity, NRR: root NR activity, GSR: root GS activity, GOGATR: root GOGAT activity, GDHR: root GDH activity. Tillering stage-SN265 (a), tillering stage-LJ294 (b), full-heading stage-SN265 (c), full-heading stage-LJ294 (d), filling stage-SN265 (e), filling stage-LJ294 (f), maturity stage-SN265 (g), and maturity stage-LJ294 (h). ANA, RNA, TNA, GY, GNR, NUEb, NAE, NPE, NUE and NHI under the vertical coordinates are the indicators of N utilization related to grain yield at the maturity stage (* p ≤ 0.05, ** p ≤ 0.01, LSD test).
Agronomy 14 01726 g006
Table 1. Plant N content and N utilization efficiency.
Indicator
Abbreviations
Definition and Calculation MethodUnits
LNCLeaf nitrogen content.%
SNCStem nitrogen content.%
RNCRoot nitrogen content.%
ANCAboveground N content. The ratio of aboveground N accumulation to dry weight.%
PNCPanicle nitrogen content.%
LNALeaf N accumulation. The product of leaf N content and leaf dry weight.mg/hill
SNAStem N accumulation. The product of stem N content and stem dry weight.mg/hill
RNARoot N accumulation. The product of root N content and root dry weight.mg/hill
ANAAboveground N accumulation. The product of aboveground N content and aboveground dry weight.mg/hill
TNAPlant N accumulation. Sum of aboveground and root N accumulation.mg/hill
NAIN absorb intensity. The ratio of the difference in plant N accumulation between adjacent fertility periods to time.mg/(m2·d)
NIEN internal uptake efficiency. Ratio of aboveground dry weight to plant N accumulation.kg/kg
NAEN agronomic efficiency. Ratio of seed yield to N application.kg/kg
NUEN uptake efficiency. The ratio of plant N accumulation to N application.%
NPEN physiological efficiency. Ratio of grain yield to plant N accumulation.kg/kg
GNRN requirements for 100 kg grain; 100-fold ratio of plant N accumulation to grain yield.kg·N/100 kg
NHIN harvest index; 100-fold ratio of seed N to plant N accumulation.%
NTEN translocation rate. Ratio between the difference between the N accumulation of nutrient organs at full-heading and maturity stage and the N accumulation of nutrient organs at full-heading stage.%
NUEbN dry matter production efficiency. The ratio of plant dry weight to N accumulation.kg/kg·N
NuRLRatio of plant N accumulation to total root length.mg/m
NuRWRatio of plant N accumulation to root dry weight.mg/g
Table 2. Effects of the treatments on the yield-related N efficiency of the two varieties.
TreatmentsGNR
(kg ·N/100 kg)
NUEb
(kg/kg ·N)
NAE
(kg/kg)
NPE
(kg/kg)
NUE
(%)
NTE
(%)
NHI
(%)
Grain Yield (kg/hm2)
HPHK385.4 ± 5.3 b79.8 ± 0.7 a16.6 ± 0.1 a26.0 ± 0.4 a64.0 ± 0.3 a22.8 ± 0.4 b62.7 ± 0.2 a4392.5 ± 37.6 a
HPLK1001.4 ± 52.1 a41.3 ± 0.2 d2.9 ± 0.2 d10.0 ± 0.5 b28.5 ± 0.6 b28.7 ± 2.3 a49.8 ± 0.9 b757.4 ± 54.8 b
LPHK967.4 ± 83.3 a52.1 ± 1.1 c1.0 ± 0.1 c10.5 ± 1.0 b9.8 ± 0.2 c19.4 ± 1.7 b39.8 ± 0.6 d273.0 ± 28.4 c
LPLK992.2 ± 63.8 a62.8 ± 0.9 b0.8 ± 0.1 c10.2 ± 0.7 b7.9 ± 0.0 d13.1 ± 1.3 c43.0 ± 0.2 c213.5 ± 13.4 c
HPHK404.8 ± 6.5 c85.9 ± 1.9 a14.7 ± 0.3 a24.7 ± 0.4 a59.6 ± 0.3 a18.9 ± 0.9 ab54.3 ± 0.4 b3899.7 ± 70.4 a
HPLK914.7 ± 18.7 b38.2 ± 0.4 c3.4 ± 0.1 c10.9 ± 0.2 b31.3 ± 0.6 b17.0 ± 0.1 b57.4 ± 1.3 a907.2 ± 30.4 b
LPHK1065.5 ± 38.4 b64.4 ± 0.8 b1.0 ± 0.0 c9.4 ± 0.3 c10.2 ± 0.2 c7.8 ± 0.8 c32.0 ± 0.1 d254.8 ± 9.4 c
LPLK1339.9 ± 105.5 a42.1 ± 1.3 c0.7 ± 0.0 c7.6 ± 0.6 d8.8 ± 0.2 d23.1 ± 3.2 a46.7 ± 1.1 c175.7 ± 11.0 c
The four treatments were HPHK (10 mg/L P and 40 mg/L K), HPLK (10 mg/L P and 2 mg/L K), LPHK (0.5 mg/L P and 40 mg/L K), and LPLK (0.5 mg/L P and 2 mg/L K), respectively. The data above the dotted line represent SN265, and the data below represent LJ 294. The error bars represent ± standard deviation. Different lowercase letters indicate statistical significance at the p < 0.05 level (least significant difference test).
Disclaimer/Publisher’s Note: The statements, opinions and data contained in all publications are solely those of the individual author(s) and contributor(s) and not of MDPI and/or the editor(s). MDPI and/or the editor(s) disclaim responsibility for any injury to people or property resulting from any ideas, methods, instructions or products referred to in the content.

