Article

Study on the Diversity of Bacterial Communities in the Rhizosphere Soils of Different Wild Celery Species in Jilin Province

1
College of Horticulture, Jilin Agricultural University, Changchun 130118, China
2
College of Biological and Agricultural Engineering, Jilin University, Changchun 130025, China
*
Author to whom correspondence should be addressed.
Agronomy 2024, 14(8), 1735; https://doi.org/10.3390/agronomy14081735 (registering DOI)
Submission received: 29 June 2024 / Revised: 26 July 2024 / Accepted: 1 August 2024 / Published: 7 August 2024
(This article belongs to the Section Soil and Plant Nutrition)

Abstract

:
The bacterial communities in the rhizosphere soil of plants facilitate the cycling of nutrient elements in the rhizosphere and regulate soil fertility. By analyzing the microecological structure of rhizosphere soil surrounding wild celery, we can provide a basis for the bionic cultivation of wild celery. In this experiment, rhizosphere soil samples from various wild celery varieties in Jilin Province were used as test materials, and high-throughput sequencing was employed to analyze and compare the rhizosphere bacterial community structures of these samples. After screening and removing chimeric sequences, a total of 1,020,108 high-quality sequences were obtained. Species classification results revealed that these bacteria encompassed 60 phyla, 183 classes, 431 orders, 702 families, and 1619 genera. There were certain differences in the composition and structure of bacterial communities among different rhizosphere soil samples. According to the richness indices, the performance order among samples was Tonghua water celery > Linjiang large-leaf celery > Linjiang old mountain celery > Tonghua large-leaf celery > Jiangyuan large-leaf celery > Tonghua old mountain celery > Linjiang water celery > artificially cultivated wild large-leaf celery > Huadian large-leaf celery > Huadian small-leaf celery > Dongfeng water celery > Jiangyuan old mountain celery. Among all bacterial communities, Pseudomonadota (37.79–22.48%) had the highest relative abundance across different regions, followed by Acidobacteriota (17.97–13.51%). RDA analysis indicated that soil pH, available phosphorus, available potassium, and alkali-hydrolyzable nitrogen in the celery rhizosphere were the primary factors influencing changes in bacterial communities. Based on the experimental analysis, it was demonstrated that there were differences in rhizosphere soil bacterial community diversity and composition among Tonghua large-leaf celery, Linjiang large-leaf celery, Jiangyuan large-leaf celery, Huadian large-leaf celery, Tonghua old mountain celery, Linjiang old mountain celery, Jiangyuan old mountain celery, Tonghua water celery, Linjiang water celery, Dongfeng water celery, Huadian small-leaf celery, and artificially cultivated wild large-leaf celery in Jilin Province.

1. Introduction

Wild vegetables are extremely precious wild plant resources in China. Most wild vegetables are “medicine and food homologous” plants. Their roots, stems, leaves, flowers, or fruits can be used as both food and medicine [1]. Jilin Province is located in the central part of Northeast China. The mountainous area is vast, the landform is complex, and the climate change is large. Therefore, the wild vegetable resources are extremely rich. Wild celery is rich in protein, fat, crude fiber, carotenoids, vitamins, and other nutrients [2] and rich in a variety of specific components, such as flavonoids, coumarin, total phenols, and so on [3]. In addition to its edible value, its extract can also be used in chemical and pharmaceutical fields [4]. With the gradual deepening of people’s understanding of the advantages of wild celery, the demand for it has gradually increased.
Plants provide energy in the form of carbon-rich rhizodeposits, alter soil pH values, and reduce competition with beneficial bacteria by selecting those that contribute to their growth and survival. To address the numerous challenges faced in sustainable crop production, there is a need for a better understanding of the functional diversity of microbial communities colonizing the plant rhizosphere. Microbial interactions in the rhizosphere may include those with bacteria that are highly influenced by root exudates and located close to adjacent soil. Rhizosphere bacterial communities also promote plant growth by producing plant hormones and provide protection to plants [5].
In this experiment, high-throughput sequencing technology was employed to analyze the bacterial communities in the rhizosphere soil samples of various celery species, including Tonghua large-leaf celery, Linjiang large-leaf celery, Jiangyuan large-leaf celery, Huadian large-leaf celery, Tonghua old mountain celery, Linjiang old mountain celery, Jiangyuan old mountain celery, Tonghua water celery, Linjiang water celery, Dongfeng water celery, and Huadian small-leaf celery, as well as artificially cultivated wild large-leaf celery, all from Jilin Province. Soil microorganisms play an important role in regulating soil formation, organic matter decomposition, nutrient cycling, and other biochemical processes, which is helpful for maintaining soil health and productivity [6,7]. High-throughput sequencing technology is the most widely used sequencing technology in the study of microbial diversity. It has the advantages of high throughput, low cost, and high accuracy. It can not only quickly analyze the diversity of complex microbial communities but also detect low abundance and uncultured microorganisms [8,9,10]. Through this technology, we can understand the bacterial community structure and species composition of different species of wild celery rhizosphere soil in different regions and systematically compare their community composition and structural differences, which is helpful to clarify the microecological environment of celery rhizosphere soil and provide reference for the subsequent bionic cultivation of wild celery.
This experiment employs high-throughput sequencing methods to systematically investigate the bacterial community structure and species composition in the rhizosphere soil of various wild celery species under different soil conditions in Jilin Province. It also aims to systematically compare the differences in their community composition and structure. This research will contribute to elucidating the microecological environment of the rhizosphere soil of wild celery, thereby providing theoretical references for subsequent bionic cultivation practices.

2. Materials and Methods

2.1. Test Materials

The test materials were Tonghua large-leaf celery (T1), Linjiang large-leaf celery (T2), Jiangyuan large-leaf celery (T3), Huadian large-leaf celery (T5), Tonghua old mountain celery (L1), Linjiang old mountain celery (L2), Jiangyuan old mountain celery (L3), Tonghua water celery (S1), Linjiang water celery (S2), Dongfeng water celery (S4), and Huadian small-leaf celery (D5) from Jilin Province, Baishan City, Jiangyuan District and provided by Hongtai Mountain Wild Vegetable Co., Ltd., Hongtai, Jilin Province, China. A total of 12 samples of the rhizosphere soil of artificially planted wild large-leaf celery (CK) were collected, as shown in Figure 1, which displays the geographical maps of various sample plots.

2.2. Overview of the Study Area

By combining methods of literature review and field investigations, concentrated distribution areas of wild celery were selected based on different altitudes in five cities and counties in Jilin Province, including Tonghua City, Linjiang City, Jiangyuan District, Dongfeng County, and Huadian City (Table 1). Natural habitat surveys of wild celery were conducted under conditions such as no rainfall within three days before and after the survey sites. The artificially cultivated wild celery was provided by Hongtai Wild Vegetable Company Limited in Jiangyuan District.

2.3. Test Method

2.3.1. Sampling

Using the five-point sampling method, first, the midpoint of the diagonal is identified as the central sampling point. Then, four points are selected on the diagonal, each an equal distance from the central sampling point, to serve as the sample points [11]. First, dig down approximately 10 cm at the sampling point to remove the topsoil. Then, using a sampler, collect soil from around the celery roots within a 5–15 cm radius, ensuring that the roots remain as intact as possible. Thoroughly shake off the soil from the periphery of the roots, mix the collected soil sample, pass it through a 2 mm sieve, and place it in a self-sealing bag [12]. Store the soil samples were at −80 °C for subsequent DNA extraction for microbial high-throughput sequencing.

2.3.2. Determination of Soil Physical and Chemical Indicators

Referring to the method of Baoshidan [13] to determine soil physicochemical indicators, the available potassium content in soil was measured by flame photometry; the available phosphorus content was determined using sodium bicarbonate extraction; the available nitrogen content was measured by the alkaline hydrolysis diffusion method; and the pH and electrical conductivity were measured using potentiometric methods.
Flame photometry method for determining soil available potassium content: The primary instruments required for this method include a flame photometer, oscillator, balance, Erlenmeyer flask, funnel, filter paper, etc. The reagents used are 1 mol/L neutral NH4OAC solution (as the extractor to extract available potassium from soil) and a K standard solution (used to construct a standard curve to determine the potassium ion concentration in the soil extract from the flame photometer readings). Take a certain amount of air-dried soil sample (passed through a 1 mm sieve) and add an appropriate amount of 1 mol/L neutral NH4OAC solution. Shake for 30 min to allow the available potassium to dissolve completely. Filter the extract through dry filter paper to remove soil particles and other impurities. Measure both the filtered extract and a series of K standard solutions on the flame photometer, recording the readings on the galvanometer. Plot a standard curve with the galvanometer readings on the y-axis and potassium ion concentrations on the x-axis. From the standard curve, determine the corresponding potassium ion concentration for the sample reading and calculate the available potassium content in the soil.
Sodium bicarbonate extraction method for determining soil available phosphorus content: The instruments required for this method include an oscillator, spectrophotometer, balance, Erlenmeyer flask, funnel, filter paper, etc. The reagents used are 0.5 mol/L NaHCO3 extractant (pH 8.5), phosphorus-free activated charcoal powder, and molybdate-antimony color reagent. Place a certain amount of air-dried soil sample in an Erlenmeyer flask and add an appropriate amount of 0.5 mol/L NaHCO3 extractant. Shake well to mix. Place the flask on an oscillator and shake at 180 r/min and 25 °C for 30 min to allow the available phosphorus to dissolve completely. Filter the extract through phosphorus-free filter paper to remove soil particles and other impurities. Pipette a certain volume of the filtered extract into a colorimetric tube, add molybdate–antimony color reagent, shake well, and allow to stand for 30 min for complete reaction. Measure the absorbance of the resulting phosphomolybdenum blue at 700 nm using a spectrophotometer or photoelectric colorimeter. Using a standard curve (prepared in advance with standard solutions of known phosphorus concentrations) and the absorbance value of the sample, calculate the available phosphorus content in the soil.
Alkali diffusion method for determining alkali-hydrolyzable nitrogen content: A certain amount of air-dried soil sample and ferrous sulfate are weighed and evenly spread in the outer chamber of the diffusion dish, taking care to prevent soil particles from flying into the inner chamber. A boric acid-indicator solution is added to the inner chamber of the diffusion dish. Subsequently, an alkaline glue is applied evenly around the edge of the outer chamber. A ground glass cover is placed on top and rotated several times to ensure complete adhesion. One side of the cover is then slightly lifted to create a narrow slit. Through this slit, a sodium hydroxide solution is quickly added to the outer chamber. The cover is immediately replaced, and the dish is gently rotated to ensure that the alkaline solution covers all the soil. The cover is secured with a rubber band. The diffusion dish is then placed horizontally in a thermostatic oven for 24 h to allow for the alkali diffusion process. After 24 h, the dish is removed, and the absorbent solution in the inner chamber is titrated with a standard hydrochloric acid solution. The endpoint of the titration is indicated by a sudden color change from blue to a faint red, and the volume of hydrochloric acid used is recorded. A blank test is also performed to correct for reagent and titration errors, following the same procedure but without adding the soil sample.
Potential method for measuring pH: Select a pH meter equipped with temperature compensation functionality and outfit it with a glass electrode and a saturated calomel electrode. Immerse the glass bulb of the glass electrode in water for a specified period of time and then dry it off with filter paper. Utilize standard buffer solutions to calibrate the pH meter, ensuring the instrument’s accuracy. Insert the calibrated electrodes into the solution to be tested, gently agitate the solution to ensure full contact between the electrodes and the solution, and then wait for the reading to stabilize before recording the pH value.
Potential method for measuring conductivity: Select an appropriate conductivity meter and equip it with a suitable conductivity cell and electrodes. Utilize a standard potassium chloride (KCl) solution to calibrate the conductivity meter, ensuring the instrument’s accuracy. Pour the solution to be tested into the conductivity cell, follow the operating instructions of the conductivity meter to perform the measurement, and record the conductivity value.

2.3.3. Determination of Soil Microbial Community

Firstly, soil microbial DNA was extracted. The CTAB method (Take a small amount of experimental material and grind it into a fine powder using liquid nitrogen. Add an appropriate amount of 2% CTAB extraction buffer to the ground material and gently stir it. Place the mixture in a 65 °C water bath or incubator, shaking gently at intervals to facilitate cell lysis and DNA release. After cooling, add chloroform–isoamyl alcohol and vigorously shake to denature and precipitate impurities such as proteins and polysaccharides. Separate the supernatant from the precipitate by centrifugation. Add isopropanol or ethanol to the supernatant to precipitate the DNA. Wash the DNA precipitate with ethanol to remove residual CTAB and other impurities, and then dry the DNA. Finally, dissolve the DNA in an appropriate buffer solution, and further purification or analysis may be performed.) was selected to extract the total DNA of microbial group samples from different sources, and the quality of DNA extraction was detected by agarose gel electrophoresis. At the same time, DNA was quantified by ultraviolet spectrophotometer. After the total DNA of the sample was extracted, the V3-V4 variable region of the bacterial 16S DNA gene was amplified by PCR using primers 341F (5′-CCTACGGNGNGGWGCAG-3′) and 805R (5′-GACTACHVG GGT AATCTA ATCC-3′). Ultrapure water was used throughout the DNA extraction process to exclude the possibility of false-positive PCR results as negative controls. PCR test used 25 μL reaction system: 12.5 μL Phusion Hot start flex 2× master mix, 2.5 μL Forward Primer, 2.5 μL Reverse Primer, 50 ng DNA, ddH2O to 25 μL. Reaction parameters: predenaturation at 98 °C for 5 min; denaturation at 98 °C for 10 s, annealing at 54 °C for 30 s, extension at 72 °C for 45 s, 35 cycles; 72 °C extension for 10 min. PCR amplification products were detected by 2% agarose gel electrophoresis. PCR products were purified by AMPure XT beads (Beckman Coulter Genomics, Danvers, MA, USA) and quantified by Qubit (Invitrogen, Carlsbad, CA, USA).

2.4. Sample Data Processing and Analysis

The double-ended data obtained by high-throughput sequencing were spliced and filtered, and the primer sequence and balanced base sequence of RawData were removed by cutadapt (v1.9) software. Using FLASH (v1.2.8) software, each pair of paired-end reads was spliced into a longer tag according to the overlap region. When splicing, the window default is 100 bp. After splicing, sequences with a length of less than 100 bp are removed, and chimeric sequences are removed by Vsearch (v2.3.4) software. R-3.4.4 (VennDiagram) was used for OTU cluster analysis, and then R-3.4.4 software (ggplot) was used for single sample composition analysis, including Chao, Shannon, Simpson index, etc. According to the relative abundance of species, the species composition histogram analysis was performed using R-3.4.4 (ggplot2) software. RDA analysis was performed based on R-3.4.4 (vegan). To investigate the variability of microbial community structures and their potential environmental drivers, we employed Principal Coordinate Analysis (PCoA) to visualize the distances between communities and combined this with redundancy analysis (RDA) to reflect the relationships between sample distributions and environmental factors.
Data analysis was performed using SPSS Statistics 26 software, ANOVA by univariate Duncan, and significance at the p < 0.05 level.

3. Results

3.1. Determination of Soil Physical Ochemical Properties

The table (Table 2) presents data on basic physicochemical properties such as soil pH, available phosphorus, available potassium, alkali-hydrolyzable nitrogen content, and electrical conductivity.
The results of the soil physicochemical property determination revealed that the pH of the artificially cultivated large-leaf celery was significantly lower than that of other wild samples, while its available phosphorus, available potassium, alkali-hydrolyzable nitrogen, and electrical conductivity were significantly higher. Comparing the four regional wild large-leaf celery samples, Tonghua’s large-leaf celery had the highest available potassium content at 18.59 mg/kg, Jiangyuan’s had the highest pH and available phosphorus content at 6.83 and 17.83 mg/kg, respectively, and Linjiang’s had the highest alkali-hydrolyzable nitrogen and electrical conductivity at 23.34 mg/kg and 868.5 MS/cm, respectively.
Among the three wild old mountain celery samples, Tonghua’s had the highest available potassium content at 17.80 mg/kg, Linjiang’s had the highest available phosphorus and alkali-hydrolyzable nitrogen content at 17.37 mg/kg and 20.37 mg/kg, respectively, and Jiangyuan’s had the highest electrical conductivity at 787.00 MS/cm.
Comparing the soil physicochemical factors of the three wild water celery samples, Tonghua’s water celery had the highest available potassium and alkali-hydrolyzable nitrogen content at 18.40 mg/kg and 11.96 mg/kg, respectively, Linjiang’s had the highest electrical conductivity at 273.67 MS/cm, and Dongfeng’s had the highest available phosphorus content at 15.07 mg/kg.

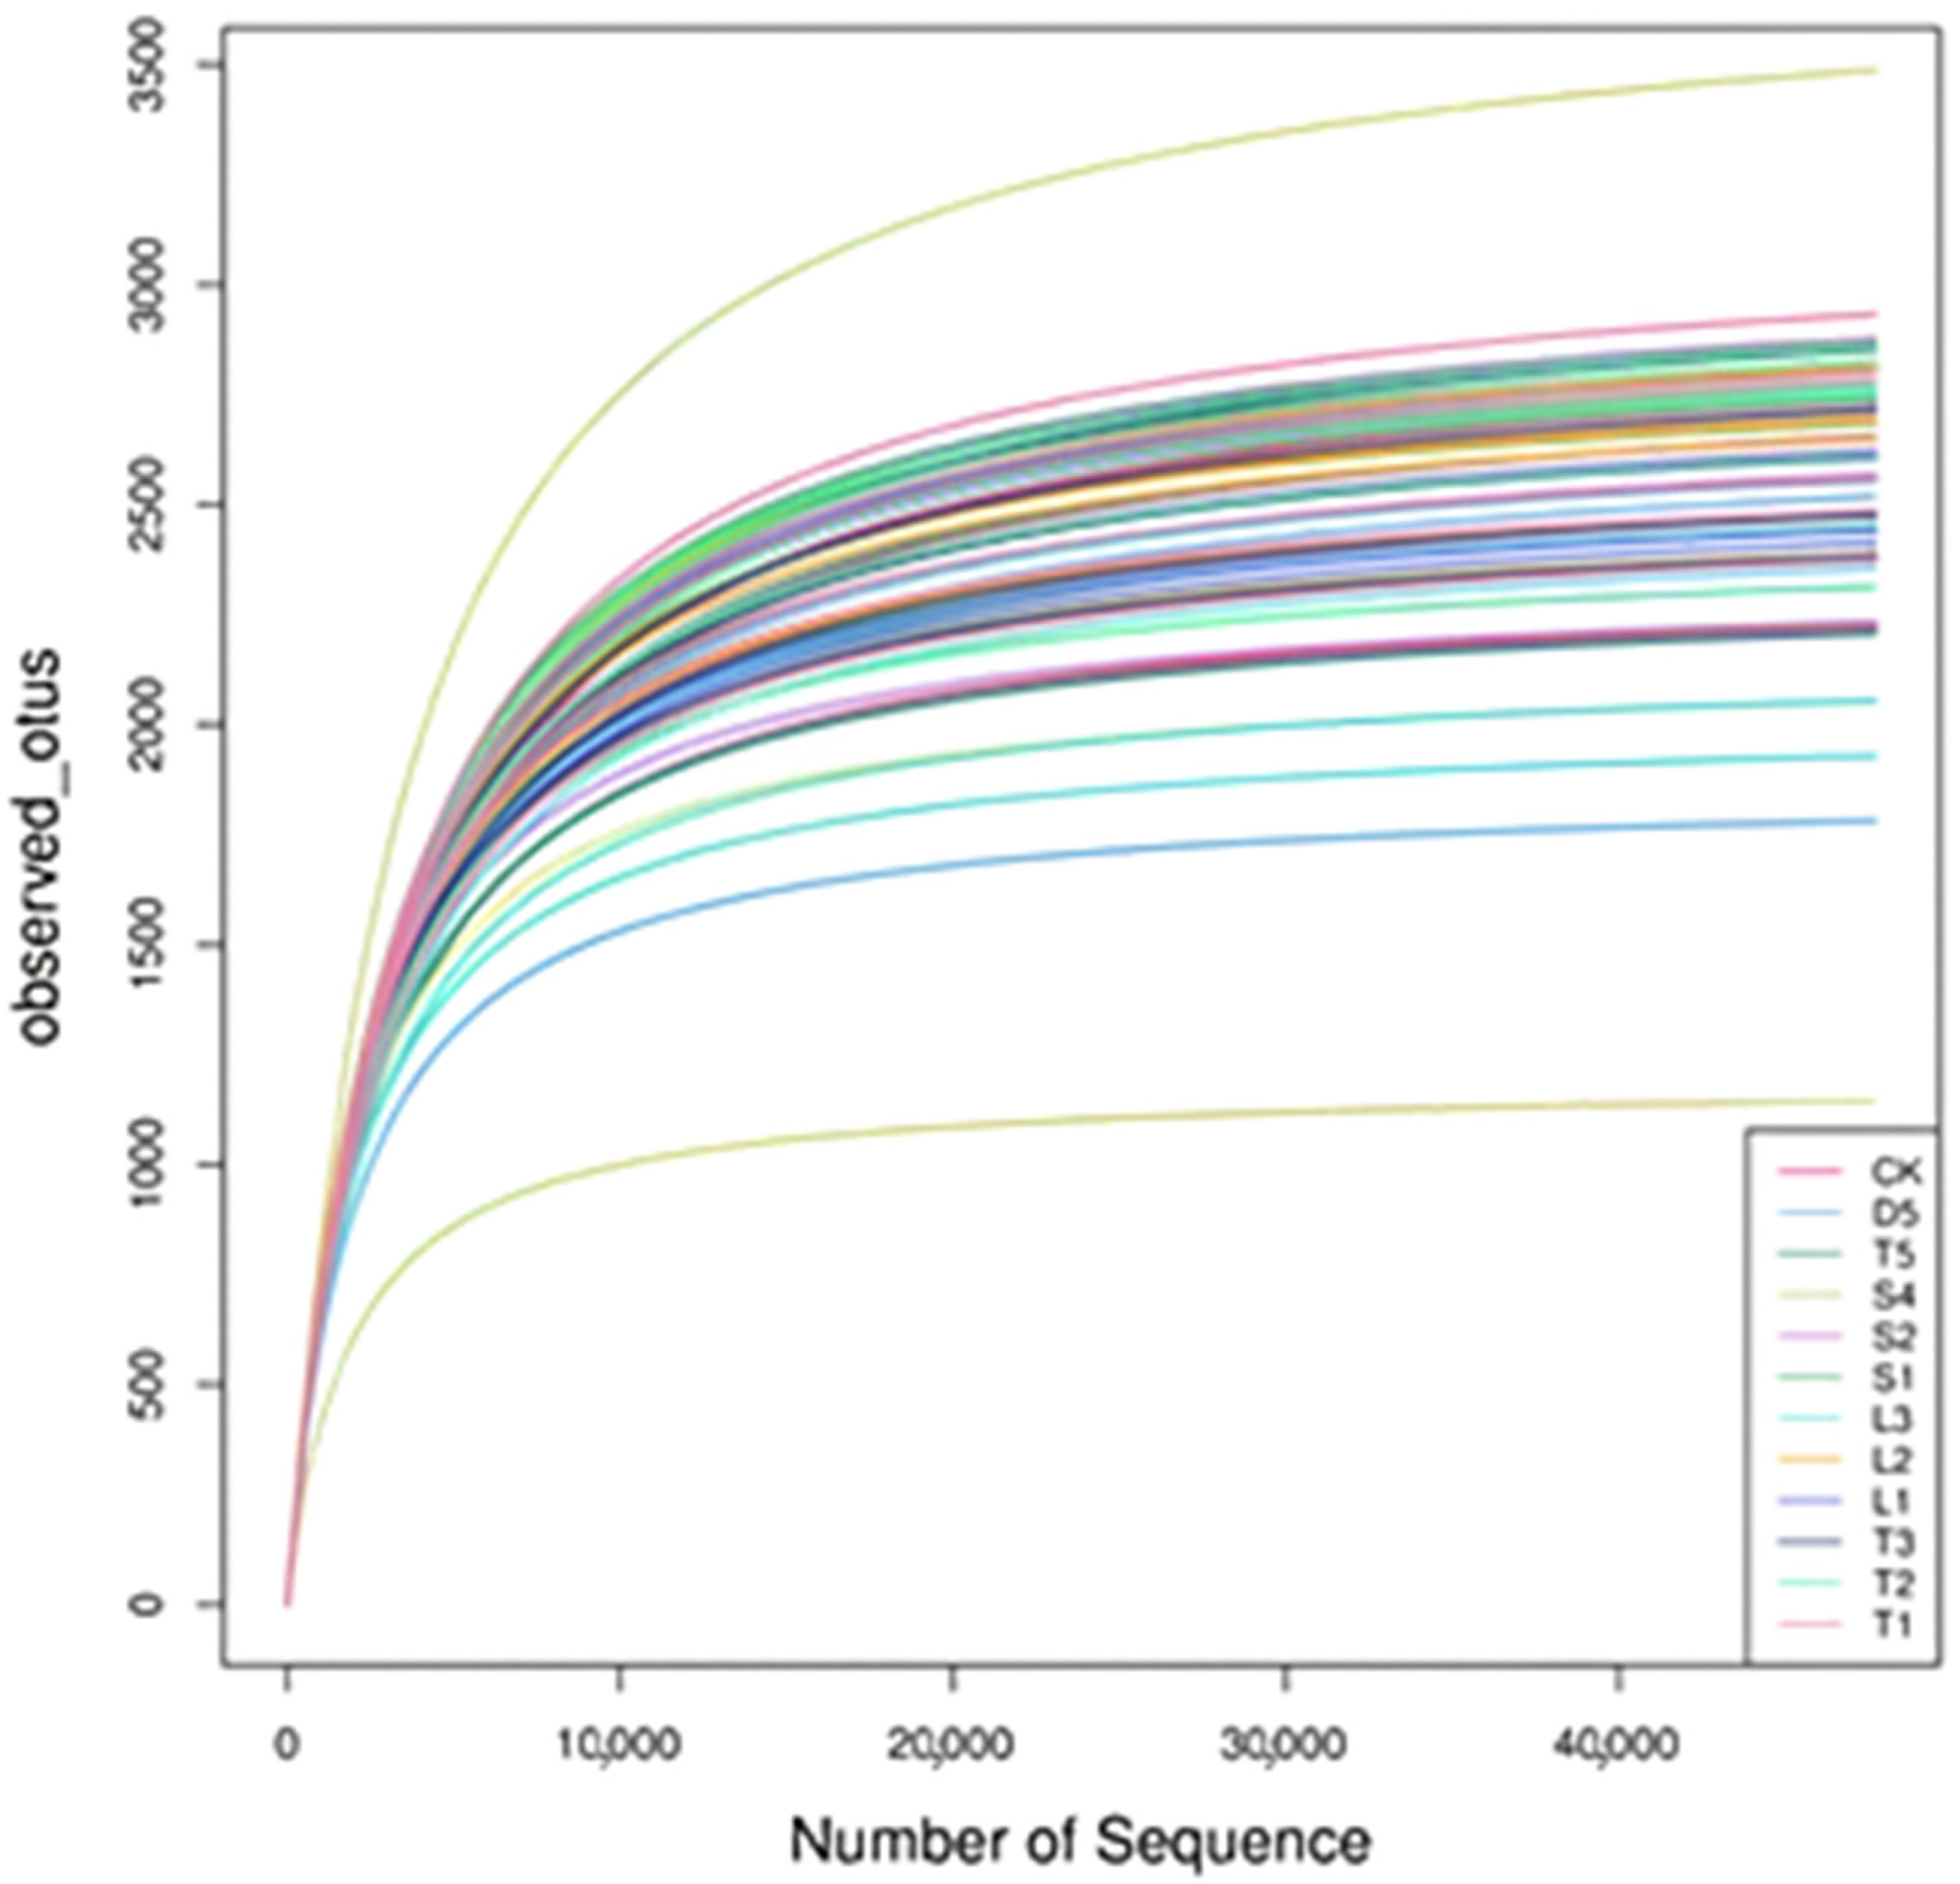
3.2. Analysis of Sequencing Data of Soil Samples

A total of 1,020,108 optimized sequences were obtained from all samples after sequencing. Based on the data processing results, Usearch software (2023) was used to cluster reads at a similarity level of 97.0% to obtain OTUs and make the dilution curves of each sample, as shown in Figure 2. The graph shows that the curves of the various samples tend to flatten out, with the L2 soil sample exhibiting a steeper slope compared to the other soil samples in the respective groups.

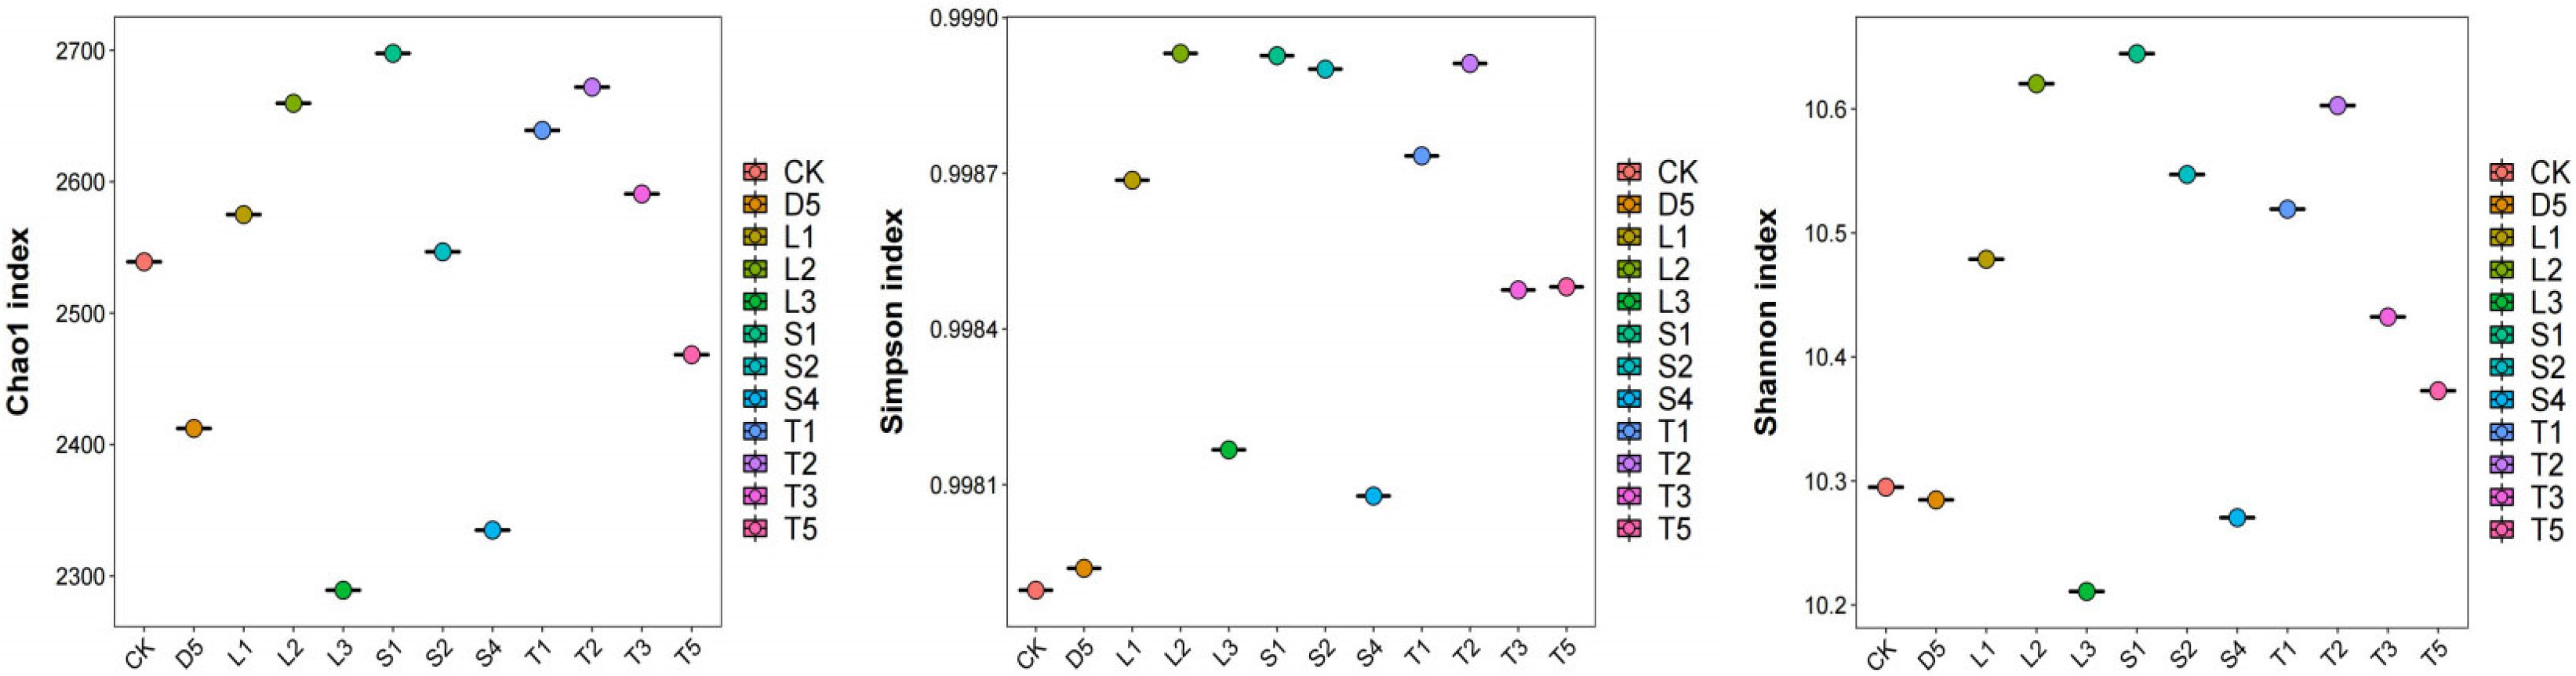
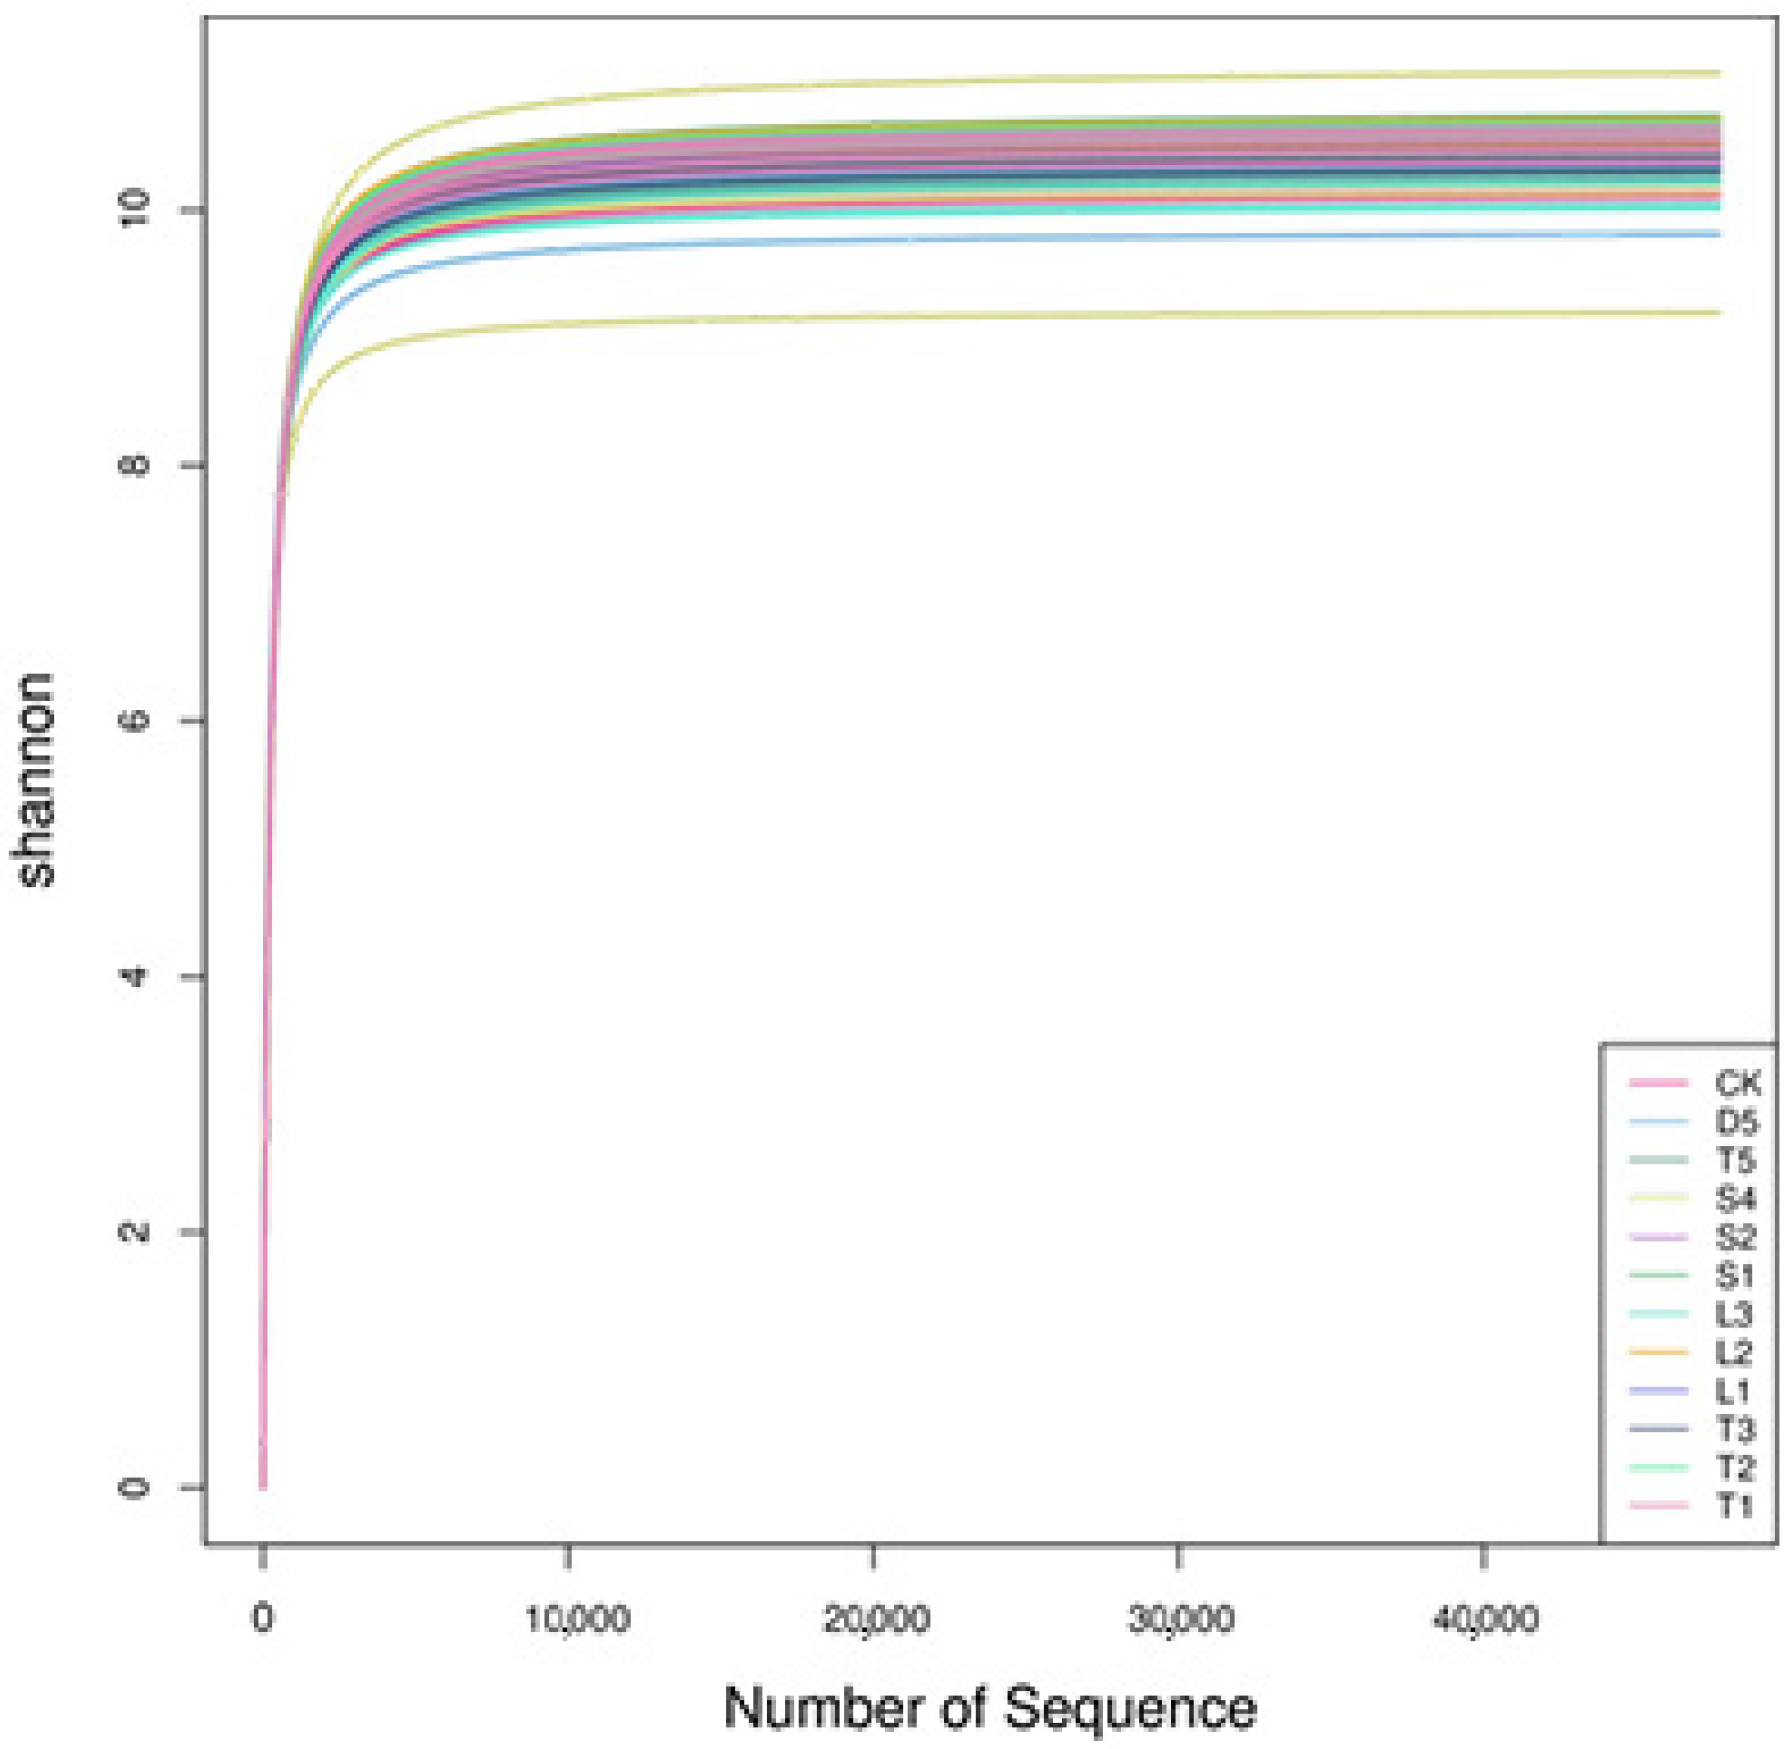
3.3. Alpha Diversity Analysis of Microbial Community

Alpha diversity analysis was used to evaluate the richness and diversity of bacterial communities in different wild celery species [14]. The Chao1 index was the species abundance index, the Shannon index was used to evaluate the species evenness, and the Simpson index was used to represent the species diversity. The greater the Shannon index, the higher the species diversity, and the Simpson index was the opposite [15]. Figure 3 shows that there are differences in the abundance and diversity of microbial flora in the rhizosphere soil of different celery species. There are significant differences in alpha diversity and species richness of soil bacterial communities among groups. The Chao index shows that the order of performance among samples is S1 > T2 > L2 > T1 > T3 > L1 > S2 > CK > T5 > D5 > S4 > L3. It can indicate the order of species richness, from which we can derive the sequence of bacterial community richness in various wild ecological environments. This allows us to understand how the abundance of bacterial species varies across different natural habitats. From the perspective of the Shannon index, the order of performance among samples is S1 > L2 > T2 > S2 > T1 > L1 > T3 > T5 > CK > D5 > S4 > L3. By the data (Figure 3), we can obtain the order of species evenness, which indicates the sequence of bacterial community evenness in different wild ecological environments. This means we can understand how uniformly distributed the bacterial species are within each of these wild habitats.
According to Figure 4, the bacterial Shannon index of the soil samples tended to be stable (Figure 4), indicating that the bacterial diversity of the samples was no longer changed by increasing the sequencing amount of soil bacteria. The sparse curve tends to reach a saturated platform, indicating that the microbial population of the sample is large enough.

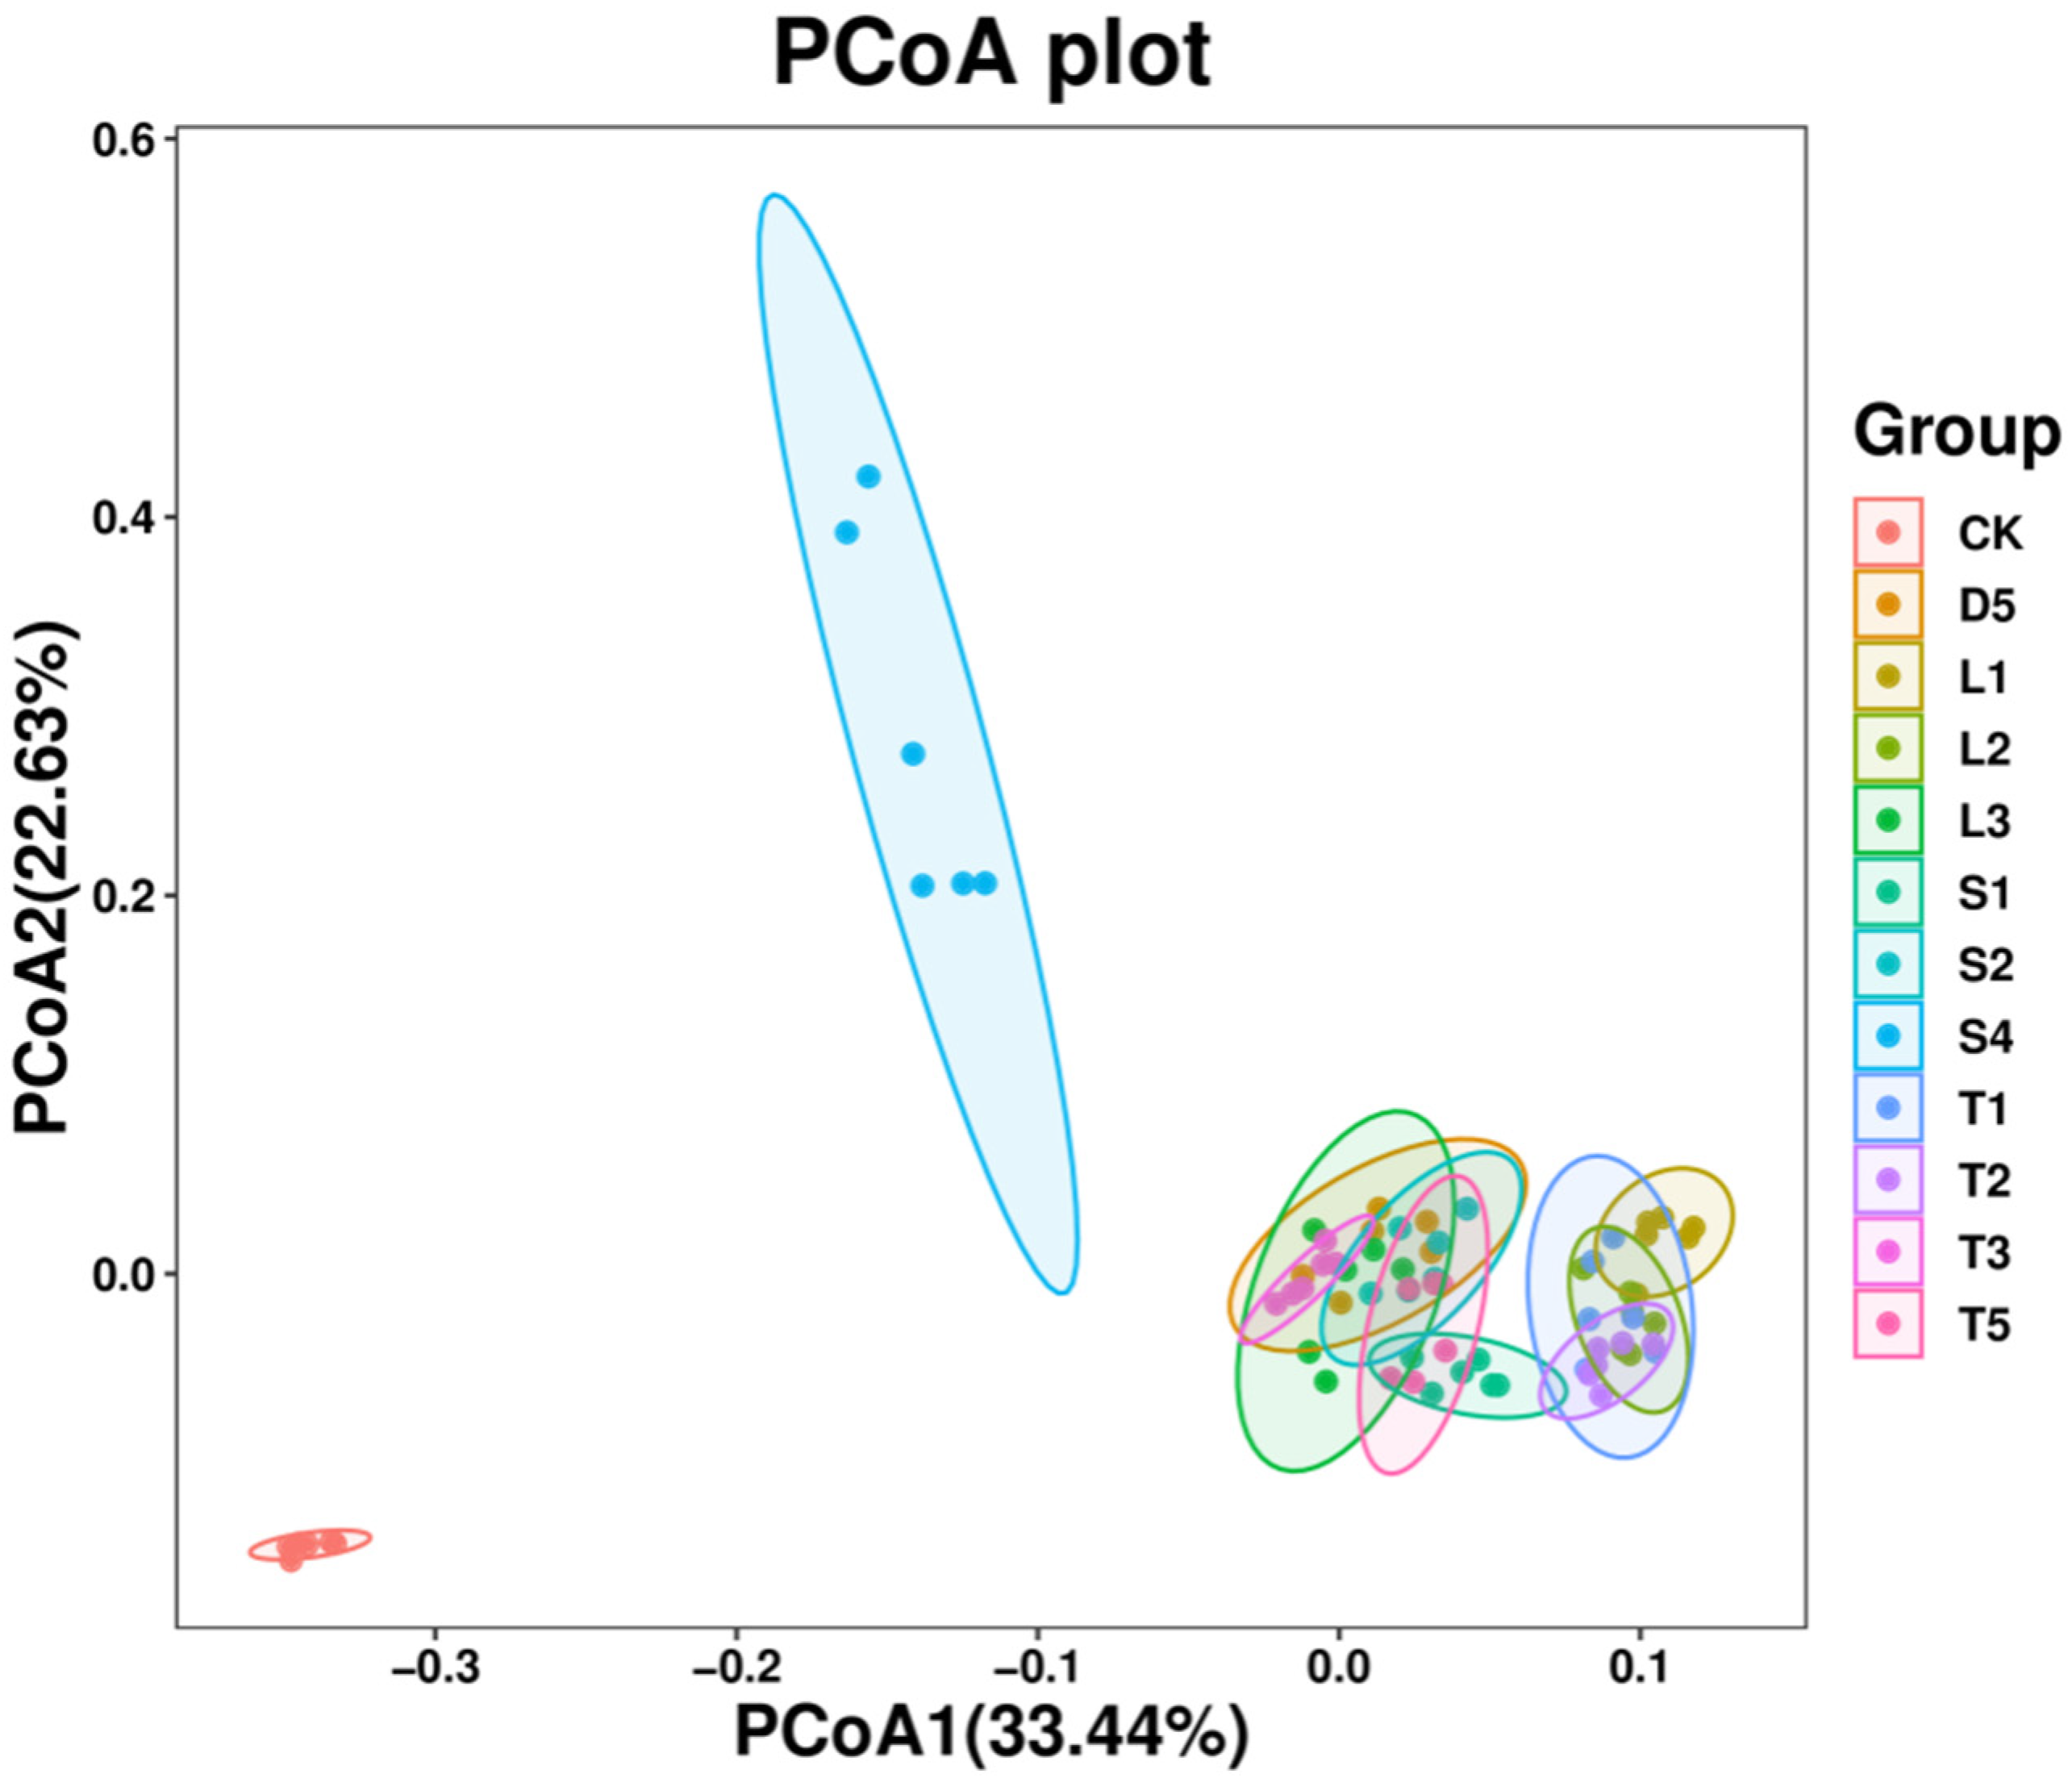
3.4. Beta Diversity Analysis of Microbial Community

Community Diversity Analysis

“Beta diversity analysis” refers to the investigation of species differences among different environmental communities [16], aiming to analyze the changes in species composition across temporal and spatial scales. Principal Coordinate Analysis (PCoA) is a dimensionality reduction and ordination method that extracts the most significant elements and structures from multidimensional data. As shown in Figure 5, the contribution rate of PCoA1 was 33.44%, and the contribution rate of PCoA2 was 22.63%. D5, T5, L3, T3, S2, S1, T2, L2, T1, and L1 groups were significantly separated from S4 and CK groups on the PCoA map. At the same time, the distance between D5 and T5 groups was similar, the distance between L3 and T3 groups was similar, the distance between T1 and L1 groups was similar, and the distance between T2 and L2 groups was similar. This shows that the microbial community structure of the celery rhizosphere soil of different species in the same area is similar, and the microbial community structure of celery rhizosphere soil in different areas is different. The intra-group distance of the S4 group was large, indicating that the intra-group difference in the sample was large (Figure 5). In the samples of the same region, the bacterial community showed aggregation, while the bacterial community structure in different regions was different.

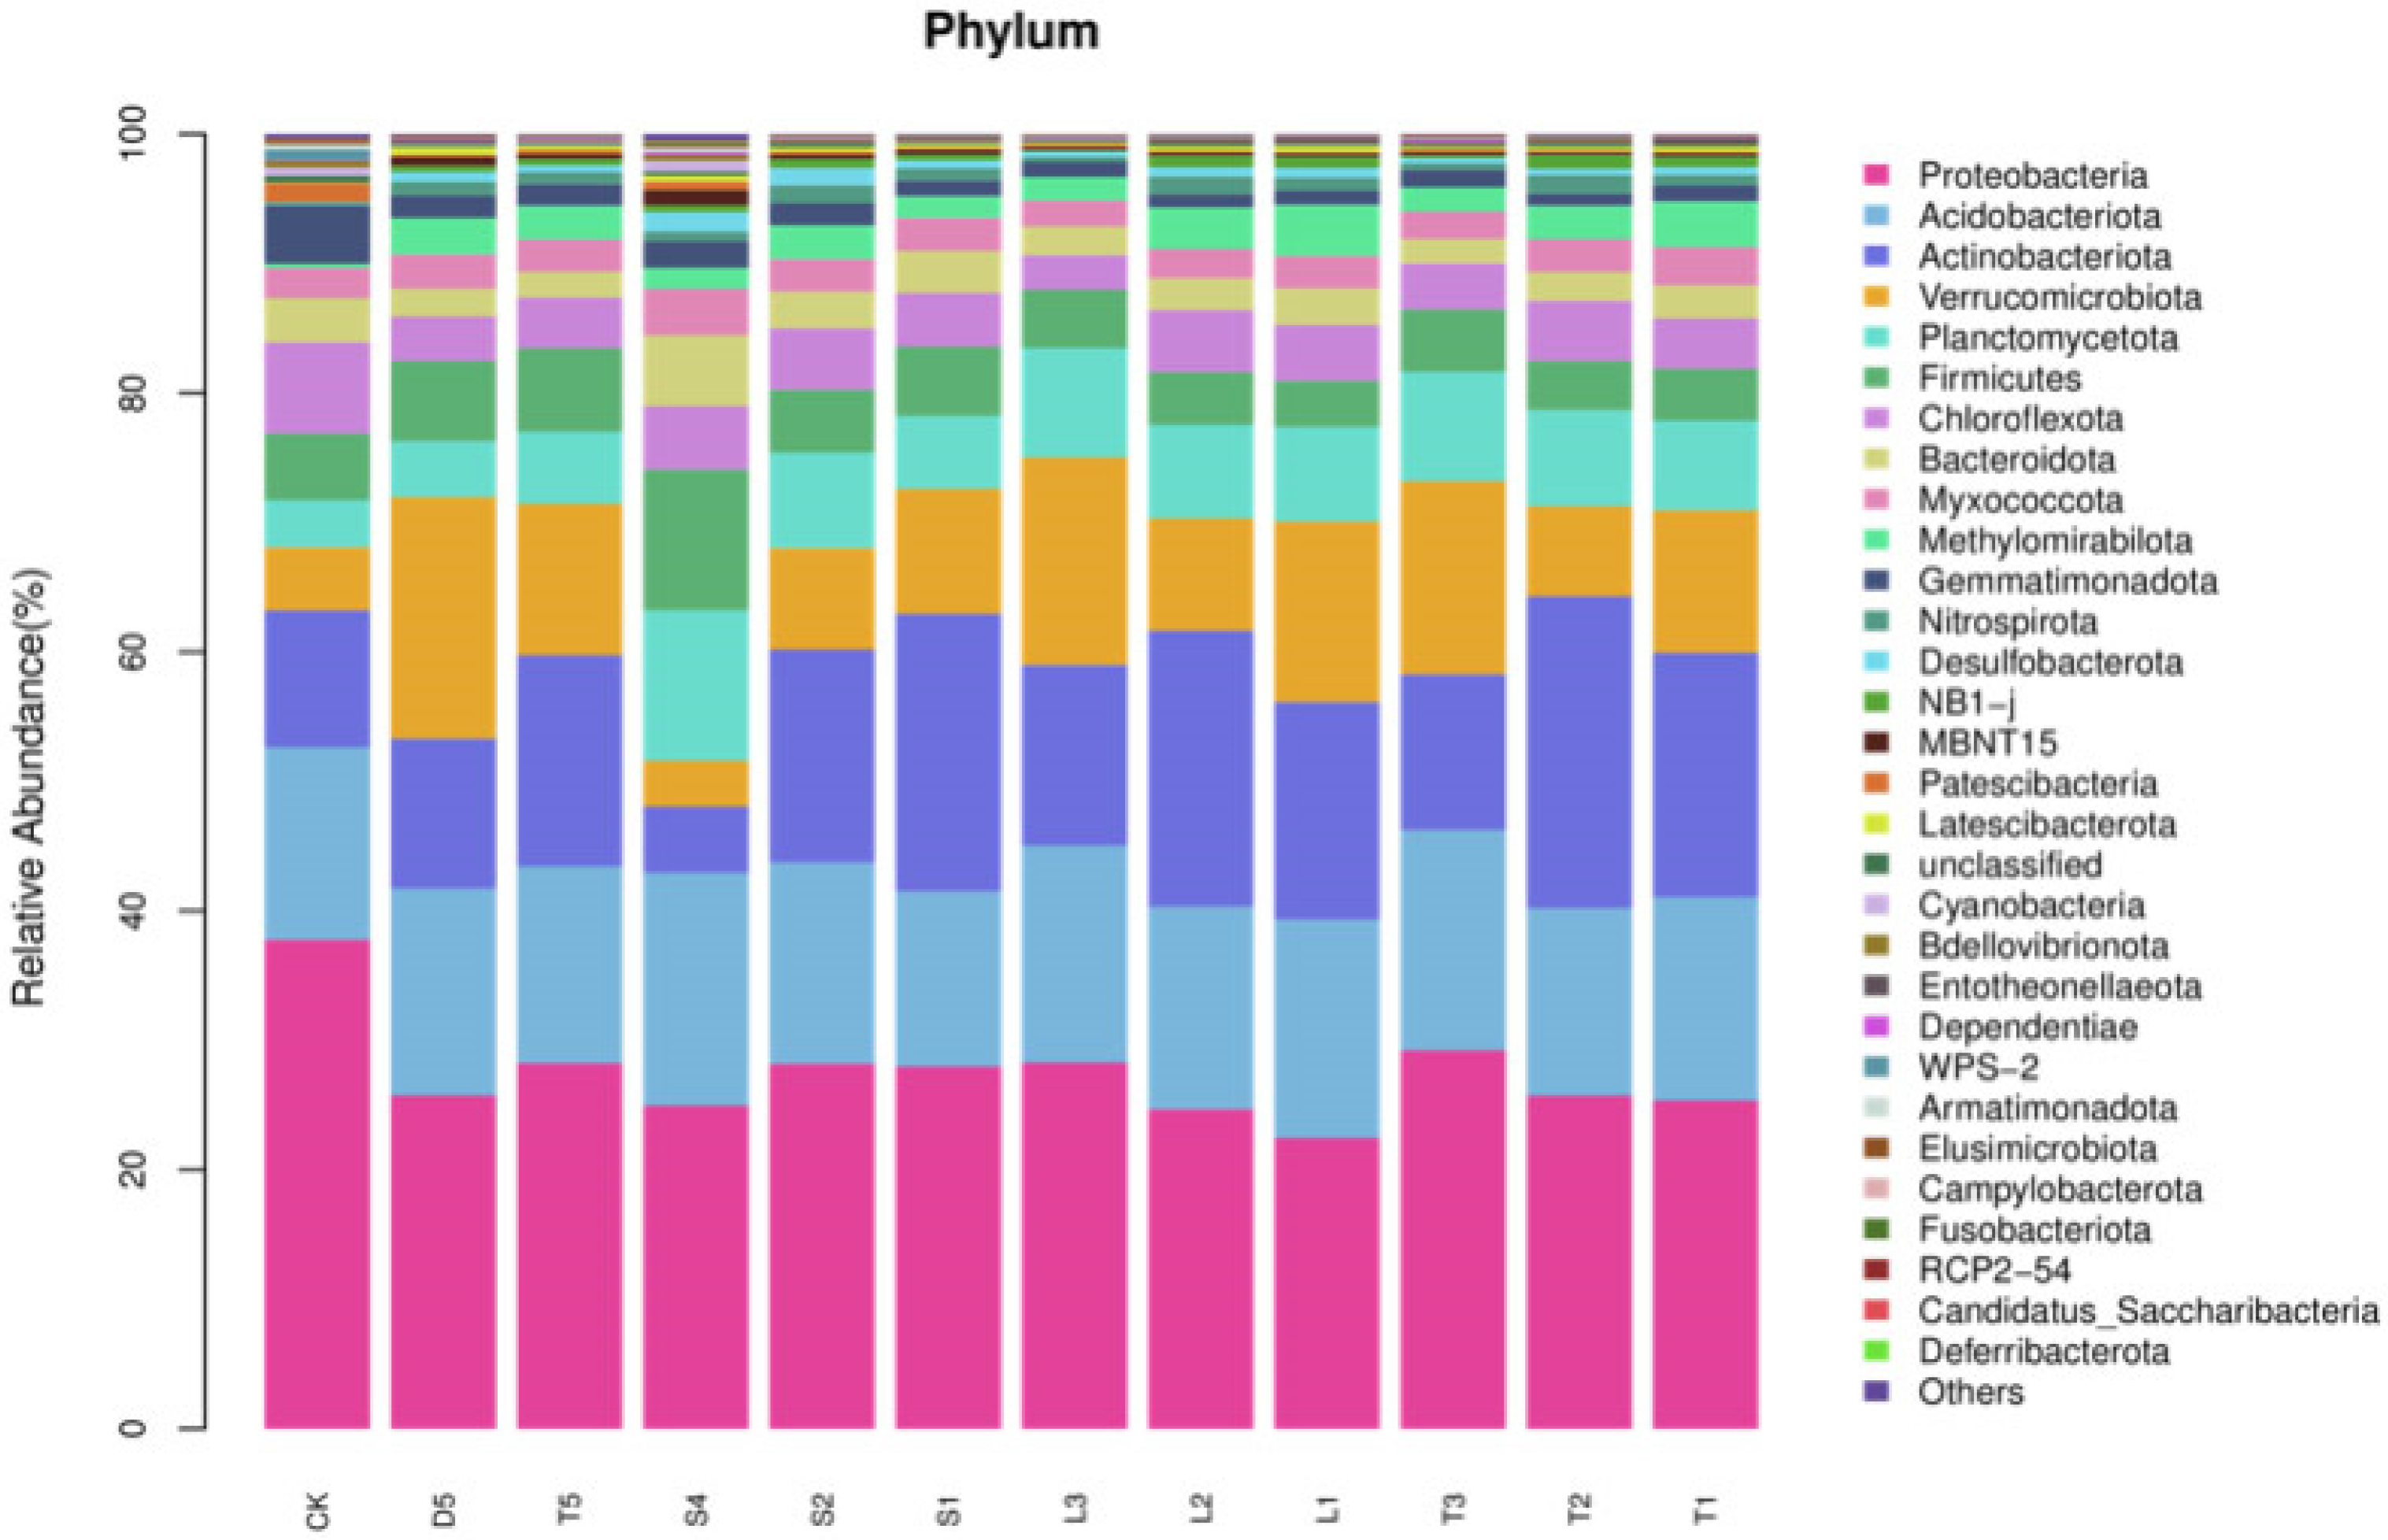
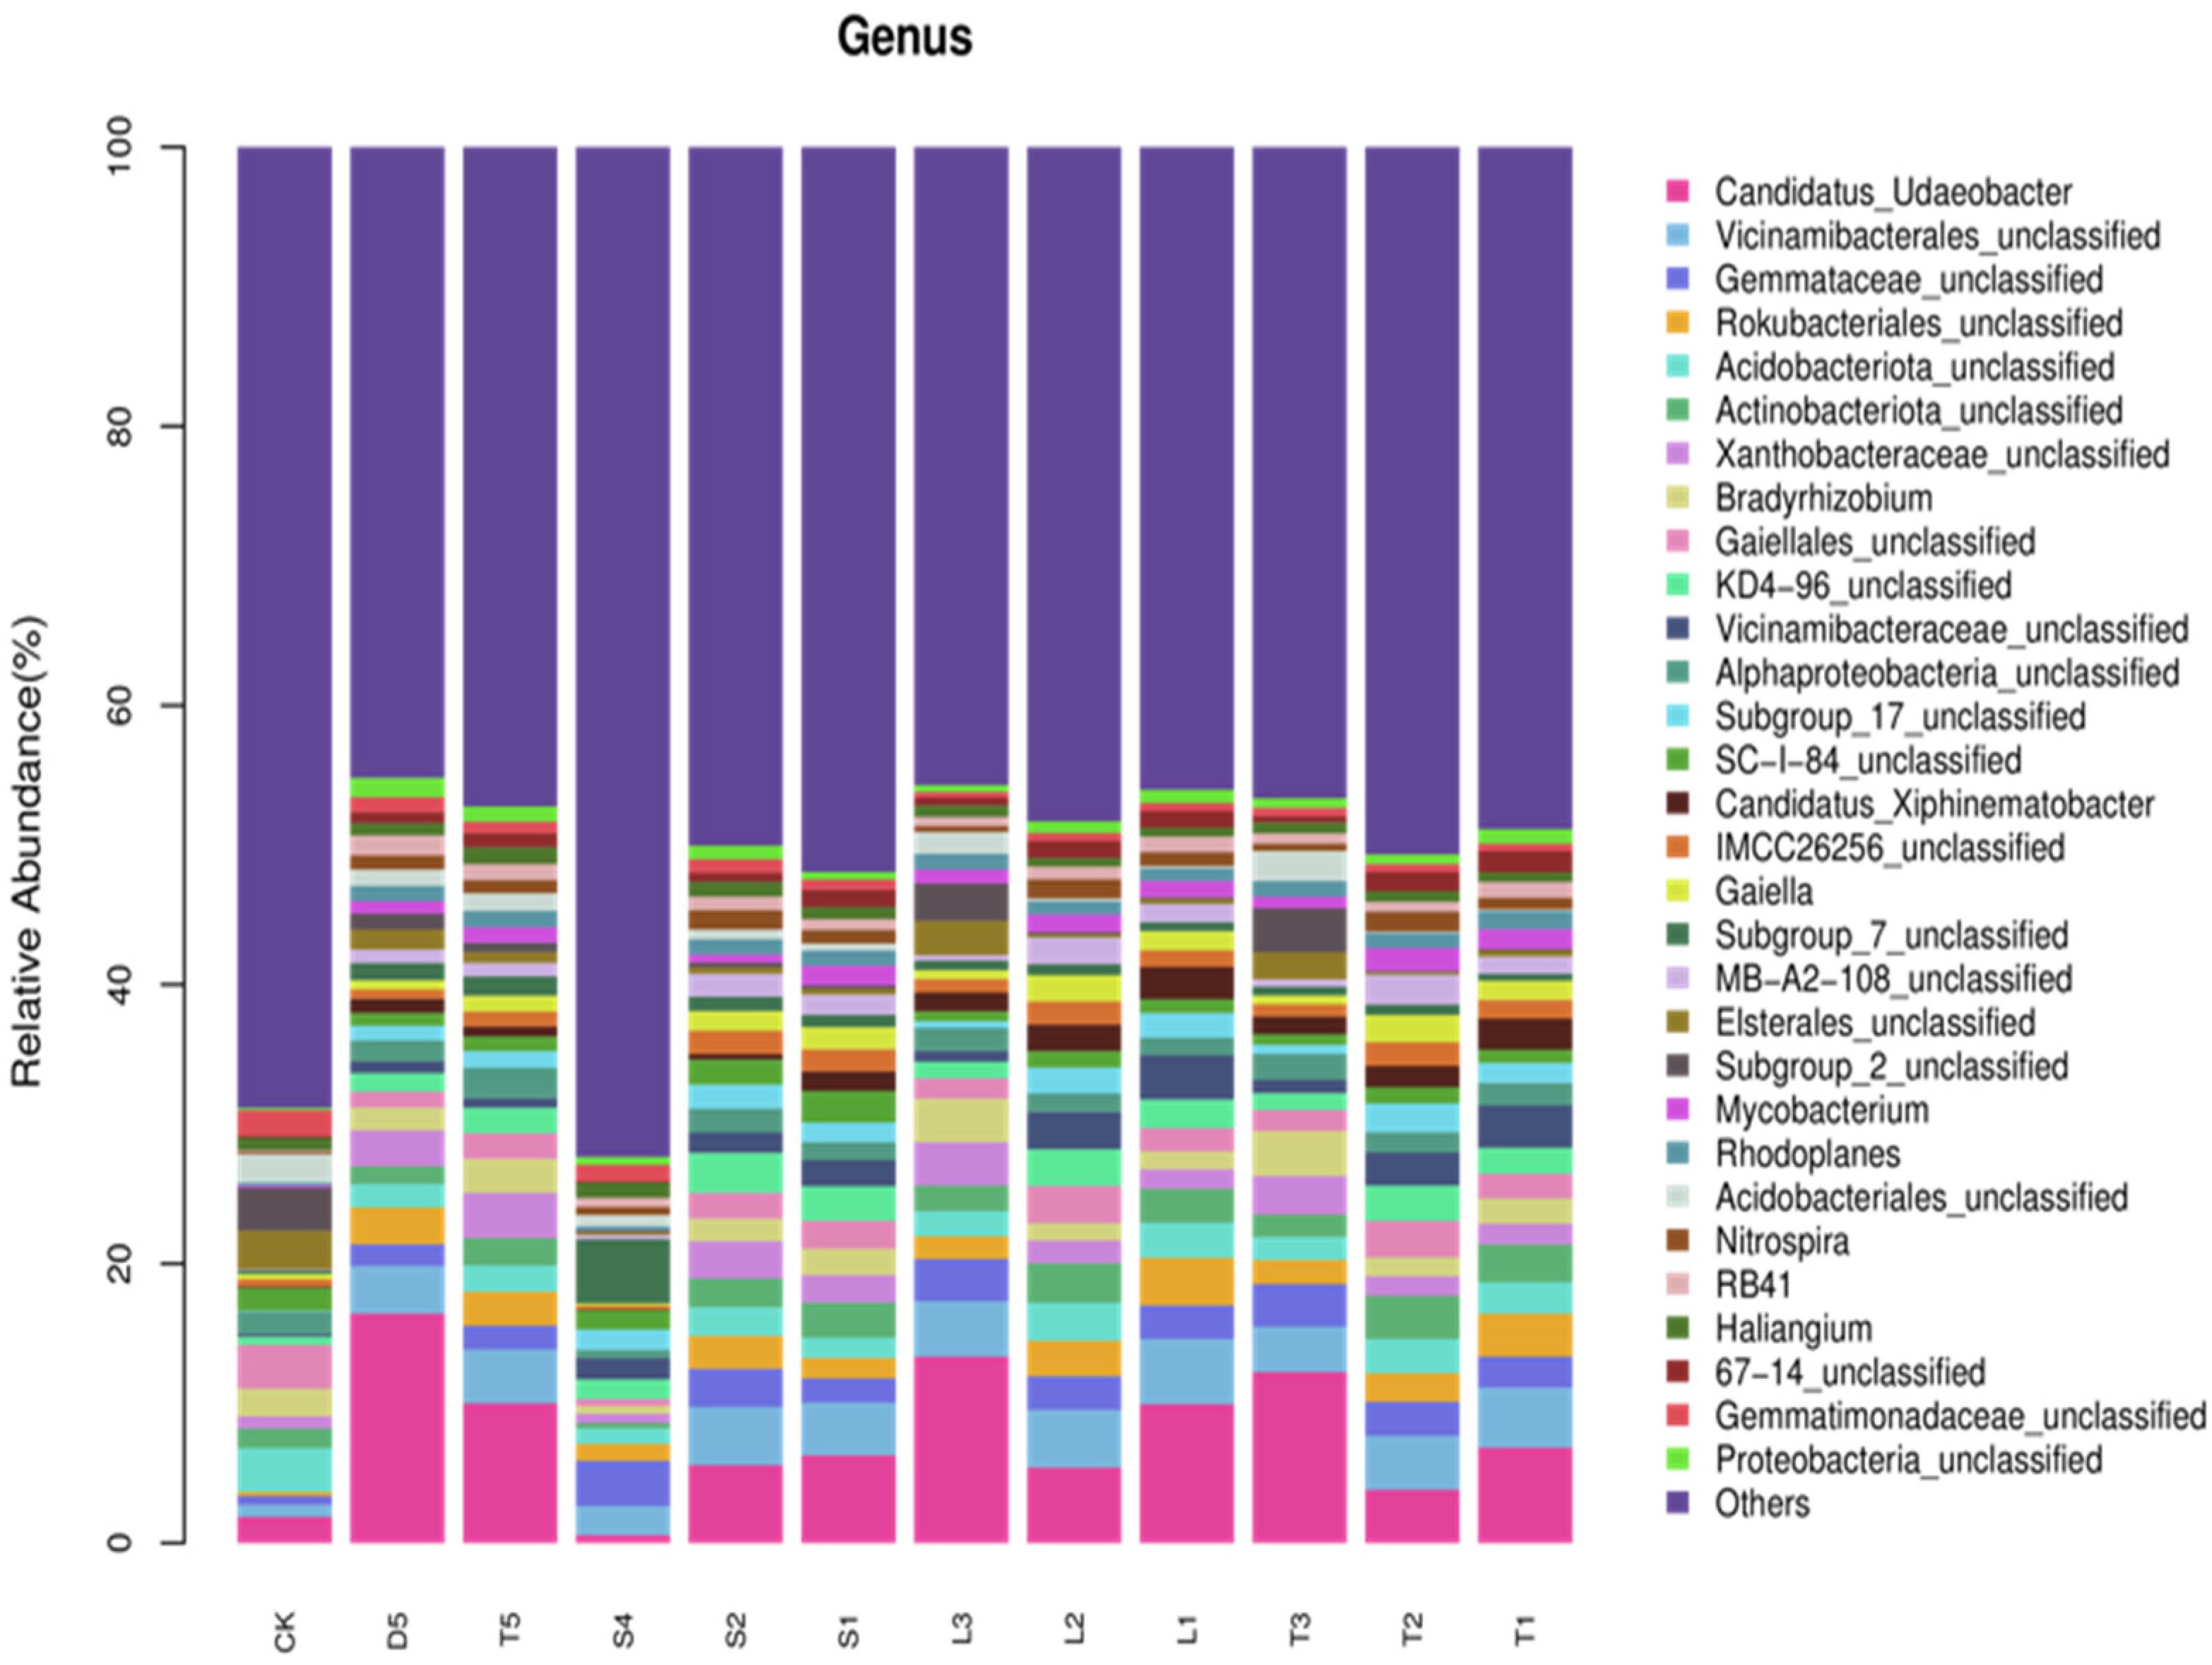
3.5. Analysis of Soil Bacterial Community Structure

According to the results of soil microbial genomic DNA sequence taxonomic analysis, the bacterial species belong to 60 phyla, 183 classes, 431 orders, 702 families, and 1619 genera, as shown in Figure 6. At the phylum level a total of 16 dominant bacterial phyla (>1%) were detected across 12 treatments of wild celery soils from different regions. These include Pseudomonadota (37.79–22.48%), Acidobacteriota (17.97–13.51%), Actinobacteriota (24.09–5.14%), Verrucomicrobiota (18.65–3.52%), Planctomycetota (11.62–3.69%), Bacillota (10.84–3.54%), Chloroflexi (7.03–2.65%), Bacteroidota (5.48–1.91%), Myxococcota (3.59–2.02%), Methylomirabilota (NC10, 3.52–0.32%), Gemmatimonadota (4.48–0.93%), Nitrospirota (1.42–0.16%), Desulfobacterota (1.50–0.12%), Euryarchaeota (NB1-j, 1.08–0.01%), MBNT15 (1.15–0.03%), and Patescibacteriota (1.41–0.10%). The relative abundances of other phyla are relatively low, with these dominant phyla accounting for over 90% of the total bacterial community (Figure 5).
Despite similarities in the bacterial taxa at the phylum level among treatments, significant differences in relative abundances were observed. Pseudomonadota exhibited the highest relative abundance across treatments, with the highest in CK (37.79%) and the lowest in L1 (22.48%), ranging from 24.69% to 29.25% in other treatments, in the order of CK > T3 > L3 > S2 > T5 > S1 > D5 > T2 > T1 > S4 > L2 > L1. Acidobacteriota showed the highest abundance in S4 (17.97%) and the lowest in S1 (13.51%), in the order of S4 > T3 > L1 > L3 > D5 > T1 > L2 > S2 > T5 > CK > T2 > S1. Actinobacteriota peaked in T2 (24.09%) and was lowest in S4 (5.14%), following the order T2 > S1 > L2 > T1 > L1 > S2 > T5 > L3 > T3 > D5 > CK > S4. Verrucomicrobiota had the highest proportion in D5 (18.65%) and the lowest in S4 (3.52%), in the order D5 > L3 > T3 > L1 > T5 > T1 > S1 > L2 > S2 > CK > S4. Planctomycetota was most abundant in S4 (11.62%) and least abundant in CK (3.69%), with the order S4 > L3 > T3 > T2 > S2 > L1 > L2 > T1 > S1 > T5 > D5 > CK. Bacillota was highest in S4 (10.84%) and lowest in L1 (3.54%), in the order S4 > T5 > D5 > S1 > CK > S2 > T3 > L3 > L2 > T1 > T2 > L1. Chloroflexi peaked in CK (7.03%) and was lowest in L3 (2.65%), with the order CK > S4 > L2 > S2 > T2 > L1 > S1 > T5 > T1 > T3 > D5 > L3. Bacteroidota had the highest abundance in S4 (5.48%) and the lowest in T3 (1.91%), in the order T3 > CK > S1 > S2 > L1 > T1 > L2 > T2 > L3 > D5 > T5 > T3. Myxococcota peaked in S4 (3.59%) and was lowest in L3 (2.02%), with the order S4 > T1 > D5 > T2 > S1 > T5 > L1 > S2.
It can be seen from Figure 7 that, at the genus level, Candidatus, Vicinamibacterales, Gemmataceae, Rokubacteriales, Xanthobacteraceae, Nitrospira, and Vicinamibacteraceae were the dominant genera in the root soil (T1) of Tonghua celery. Candidatusudaeobacter, Vicinamibacterales, Gemmataceae, Rokubacteriales, Xanthobacteraceae, Nitrospira, and Vicinamibacteraceae were dominant in the root soil (T2) of Linjiang celery; Candidatusudaeobacter, Vicinamibacterales, Gemmataceae, Rokubacteriales, Xanthobacteraceae, Nitrospira, and Vicinamibacteraceae were dominant genera in the root soil (T3) of Linjiang celery; Candidatusudaeobacter, Vicinamibacterales, Gemmataceae, Rokubacteriales, Xanthobacteraceae, Nitrospira, and Vicinamibacteraceae were the dominant genera; candidatusudaeobacter, Vicinamibacterales, Gemmataceae, Rokubacteriales, Xanthobacteraceae, Nitrospira, and Vicinamibacteraceae were dominant in the root soil (L1). Candidatusudaeobacter, Vicinamibacterales, Gemmataceae, Rokubacteriales, Xanthobacteraceae, Nitrospira, and Vicinamibacteraceae were dominant in the root soil (L2). Candidatusudaeobacter, Vicinamibacterales, Gemmataceae, Rokubacteriales, Xanthobacteraceae, Nitrospira, and Bacteroides were dominant in the root soil (L3). Candidatusudaeobacter, Vicinamibacterales, Gemmataceae, Rokubacteriales, Xanthobacteraeae, Nitrospira, and Vicinamibacteraeae were dominant in the root soil (S1). Candidatus, Vicinamibacterales, Gemmataceae, Rokubacteriales, Xanthobacteraceae, Nitrospira, and Vicinamibacteraceae were dominant in the root soil (S2). Vicinamibacterales, Gemmataceae, Rokubacteriales, Nitrospira, and Vicinamibacteraceae were dominant in the root soil (S4); candidatusudaeobacter, Vicinamibacterales, Gemmataceae, Rokubacteriales, Xant hobacteraceae, Nitrospira, and Vicinamibacteraceae were dominant in the root soil (D5) (Figure 7).

3.6. Environmental Factor Analysis

Redundancy analysis (RDA) is a PCA analysis of environmental factor constraints, reflecting the relationship between sample distribution and environmental factors [17]. PCA analysis can reflect the relationship between samples, environmental factors, and species or between the three or two on the basis of considering the influence of environmental factors on samples [18]. Figure 8 shows the cumulative contribution rate of bacterial RDA (RDA1 33.93%; RDA2 21.09%). Vicinamibacteraceae, Nitrospira, Rokubacteriales, Vicinamibacterales, and Gemmataceae were positively correlated with PH. Acidobacteriales, Bradyrhizobium, Candidatus_Udaeobacter, Rokubacteriales, Vici-namibacterales, and Gemmataceae were positively correlated with alkali-hydrolyzable nitrogen.

4. Discussion

The root system is the link between a plant and the soil. A healthy soil environment can promote the development of roots and promote the growth of plants [19]. The sequencing results of bacterial communities in the rhizosphere soil of different wild celery species were significantly different. The Shannon index and Simpson index can reflect the species diversity in microorganisms. From the perspective of the Shannon index, the S1 sample was the highest, and the S4 sample was the lowest. PCoA analysis showed that there were differences in microbial community structure in the rhizosphere soil of different celery species, and there were great differences in the S4 group, D5; T5 group, L3; T3 group, S2; S1 group, T2; L2 group, T1; and L1 group. The more similar the microbial composition structure, the smaller the difference.
According to the species classification, the bacterial species belong to 60 phyla, 183 classes, 431 orders, 702 families, and 1619 genera. From the analysis of bacterial community structure, the most dominant bacterial communities in the rhizosphere soil of different wild celery species in Jilin Province are Pseudomonadota and Acidobacteriota, followed by Actinobacteria, which is basically consistent with the previous research results on the rhizosphere bacteria of Alisma orientalis [20] and Panax notoginseng [21] in different regions at the phylum level, indicating that these bacteria may be the common dominant bacteria of rhizosphere microorganisms. Pseudomonadota, as the dominant phylum in the wild rhizosphere bacterial community, can decompose organic matter, nitrate, and ammonium salts and promote the absorption and utilization of nitrogen by plants. At the same time, Pseudomonas from Pseudomonadota has also been shown to dissolve phosphate and produce siderophores and IAA biotin to promote plant growth [22]. Acidobacteriota play an important role in soil ecosystems by decomposing plant residue polymers, participating in the iron cycle and the metabolism of single-carbon compounds [23]. Among them, Pseudomonadota is the main phylum of bacteria, which is basically consistent with the research results of Jangid et al. [24] and Liu et al. [25] on the soil bacteria of farmland crops. Actinomycetes belong to prokaryotes. They are mostly saprophytic bacteria, which can decompose the animal and plant remains in the soil quickly and transform them into nutrients that are beneficial to plant growth and development, promoting the material cycle of nitrogen [26].
Soil microbial activity can accurately reflect changes in soil quality, as many biochemical reactions involve soil microorganisms and are closely related to energy conversion in the soil [27]. The results indicate that the richness and diversity of bacterial communities in the rhizosphere soil of wild celery roots are higher than those of artificially cultivated celery roots. Among them, the alpha index of S4 is slightly lower, indicating a lower richness and diversity of bacterial communities in the rhizosphere soil, while T1 exhibits the highest richness and diversity. Huang Weimin [28] found through research that after transplanting wild Rehmannia glutinosa into greenhouse facilities, the bacterial community structure in the rhizosphere soil deteriorated gradually, demonstrating that the bacterial community structure in wild plant rhizosphere soil is superior to that in artificially cultivated roots. This experimental study found that 16 bacterial phyla, including Pseudomonadota, Acidobacteriota, Actinobacteria, and Verrucomicrobia, are dominant in celery rhizosphere soil. At the genus level, the bacterial flora in wild celery rhizosphere soil is significantly higher than that in artificially cultivated celery rhizosphere soil, with significant differences. Studies have shown that Candidatus_Udaeobacter, a genus rich in populations, can utilize limited carbon sources for metabolic activities and lyse antibiotic-producing flora to avoid the harmful effects of antibiotics [29]. Xanthobacteraceae can accumulate at the roots through the increase in pathogens, enhancing plant disease resistance [30]. Gaiellales can influence the synthesis of neutral phosphatase, directly affecting the decomposition, transformation, and bioavailability of organic phosphorus in the soil [31]. Nitrospira maintains the balance of nitrogen in the soil [32], while Gemmataceae, found mainly in freshwater and terrestrial environments, decomposes organic matter, increasing soil chemical nutrients. Gemmatimonadaceae can enhance soil nutrients and perform nitrogen fixation and potassium solubilization [5]. The rhizosphere soil of wild celery provides excellent conditions for the proliferation of soil bacteria, promoting the richness and diversity of bacterial colonies. It can be seen that the relative abundance of beneficial bacteria in the bacterial colonies of wild celery rhizosphere soil is significantly higher than that in artificially cultivated celery rhizosphere soil. However, further research is needed to understand the mechanisms of action of these beneficial bacteria.
Changes in soil physicochemical properties across different habitats exert a certain influence on the community structure of soil microbial bacterial flora. According to RDA analysis, the pH, available phosphorus, available potassium, and alkali-hydrolyzable nitrogen in celery rhizosphere soil are the main factors driving changes in bacterial communities. Gaiellales and Acidobacteriota positively correlate with soil pH; Gemmatimonadaceae and Gaiellales positively correlate with available phosphorus; Gemmatimonadaceae and Acidobacteriota positively correlate with available potassium; Acidobacteriales and Bradyrhizobium positively correlate with alkali-hydrolyzable nitrogen. Although soil electrical conductivity has a relatively minor impact on the bacterial community structure in celery rhizosphere soil, it still positively correlates with Elsterales and Gemmatimonadaceae. Studies have indicated that soil pH is an important factor influencing soil bacterial communities [33]. Similarly, the content of available phosphorus, available potassium, and alkali-hydrolyzable nitrogen in the soil can also significantly impact the soil microbial flora structure [34].

5. Conclusions

The results of 16 S rRNA sequencing showed that the composition and structure of bacterial community in rhizosphere soil samples of different wild celery species in Jilin Province were different. This study on the diversity of microbial structure in celery root soil sampled from six regions showed that the microbial flora of celery root soil was rich, belonging to 61 phyla, 185 classes, 432 orders, 703 families, and 1620 genera. Pseudomonadota, Acidobacteriota, Actinobacteriota, and Verrucomicrobiota are the four absolute dominant phyla of bacteria. The relative abundance of Pseudomonadota was the highest in different regions, followed by 16 main bacterial phyla such as Acidobacteriota, which proved that the root soil of wild celery in six regions had rich bacterial diversity. Available phosphorus, available potassium, alkali-hydrolyzable nitrogen, electrical conductivity, and pH were correlated with the soil microbial community structure of wild celery roots, among which available phosphorus and electrical conductivity had the most significant effects. In this experiment, the microbial community analysis of soil samples from the rhizosphere of different wild celery in Jilin Province was carried out to understand the bacterial community structure and species composition of different wild celery rhizosphere soils, and the differences in community composition and structure were systematically compared. It is helpful to clarify the microecological environment of wild celery rhizosphere soil and provide theoretical reference for subsequent bionic cultivation.

Author Contributions

Conceptualization, S.C.; writing—original draft, Y.Z. (Yan Zou); resources, C.Z.; project administration, S.L.; supervision, Y.Y.; visualization, J.J.; writing—review and editing, Y.Z. (Yue Zou); methodology, J.Q. All authors have read and agreed to the published version of the manuscript.

Funding

This work was supported by the Science-Technology Development Plan Project of Jilin Province (20220202098N C), the Fundamental Research Foundation for the Central Universities.

Data Availability Statement

The original contributions presented in this study are included in the article. Further inquiries can be directed to the corresponding authors.

Conflicts of Interest

The authors declare that the research was conducted in the absence of any commercial or financial relationships that could be construed as potential conflicts of interest.

References

  1. Wang, Y.; Pan, B.; Hui, Y.; Xv, Z.; Chi, X.; Li, M.; Yu, Y.; Sun, C.; Hou, L. Study and Prospect of Wild Vegetable Resources in Jilin Province. Chang. Veg. 2024, 22–25. [Google Scholar]
  2. Tan, S.; Chou, L.; Duan, O.; Jia, M.; Liu, Y.; Xiong, A. Effects of sodium hypochlorite treatment on soluble sugar content and related gene expression in celery seedlings. Acta Physiol. Sin. 2022, 58, 165–172. [Google Scholar]
  3. Ren, R.; Zhang, C.; Cao, X. Effects of microbial fertilizer on growth, yield and quality of celery. J. Jilin Agric. Univ. 2023, 1–9. [Google Scholar]
  4. Lu, X.; Feng, Z.; Jia, J.; Liang, J.; Zhao, W.; Bai, Y. Effects of continuous cropping on microbial community structure and diversity in celery rhizosphere soil. Acta Agri. Biotechnol. 2023, 31, 2466–2476. [Google Scholar]
  5. Xu, Y.; Chen, Z.; Li, X.; Tan, J.; Liu, F.; Wu, J. The mechanism of promoting rhizosphere nutrient turnover for arbuscular mycorrhizal fungi attributes to recruited functional bacterial assembly. Mol. Ecol. 2023, 32, 2335–2350. [Google Scholar] [CrossRef] [PubMed]
  6. Yang, W.; Ji, Z.; Wu, A.; He, D.; Rensing, C.; Chen, Y.; Chen, C.; Wu, H.; Muneer, M.A.; Wu, L. Inconsistent responses of soil bacterial and fungal community’s diversity and network to magnesium fertilization in tea (Camellia sinensis) plantation soils. Appl. Soil Ecol. 2023, 191, 105055. [Google Scholar] [CrossRef]
  7. Bahram, M.; Hildebrand, F.; Forslund, S.K.; Anderson, J.L.; Soudzilovskaia, N.A.; Bodegom, P.M.; Bengtsson-Palme, J.; Anslan, S.; Coelho, L.P.; Harend, H.; et al. Structure and function of the global topsoil microbiome. Nature 2018, 560, 233–237. [Google Scholar] [CrossRef] [PubMed]
  8. Yue, X.; Zhang, H.; Chen, W.; Xu, W.; Guo, M. Detection of fungal community changes during wheat storage by high-throughput se-quencing technology. Food Sci. 2020, 41, 109–115. [Google Scholar]
  9. Nilsson, R.H.; Anslan, S.; Bahram, M.; Wurzbacher, C.; Baldrian, P.; Tedersoo, L. Mycobiome diversity: High-throughput sequencing and identification of fungi. Nat. Rev. Microbiol. 2019, 17, 95–109. [Google Scholar] [CrossRef]
  10. Xing, H.-Q.; Ma, J.-C.; Xu, B.-L.; Zhang, S.-W.; Wang, L.; Cao, L.; Yang, X.-M. Mycobiota of maize seeds revealed by rDNA-ITS sequence analysis of samples with varying storage times. Microbiologyopen 2018, 7, e00609. [Google Scholar] [CrossRef]
  11. Lv, J.; Li, C.; Yang, Z.; Liu, P.; Lu, M.; Ren, Y.; Tian, K.; Zhao, X.; Chen, Z. Response of soil microbial community to land use change in Napahai Plateau wetland. Soil Bull. 2023, 54, 682–694. [Google Scholar]
  12. Li, Q.; Wang, M.; Liu, H. Diversity and difference of microbial community structure in rapeseed rhizosphere soil at different stages. N. Hortic. 2023, 72–80. [Google Scholar]
  13. Bao, S. Agrochemical Analysis of Soil Mushrooms; China Agricultural Press: Beijing, China, 2005. [Google Scholar]
  14. Xu, Y.; Niu, J.; Chen, L.; Wang, S.; Dong, Z.; Wang, Z. Study on microbial changes in rhizosphere soil of cultivated Atractylodes lancea based on high-throughput sequencing technology. J. Crops 2022, 38, 221–228. [Google Scholar]
  15. Zhang, D.; Zhao, J.; Xie, S.; Hu, F.; Wu, Q.; Zhou, X. Analysis of microbial diversity in maize based on high-throughput sequencing. Acta Food Sin. 2023, 23, 305–314. [Google Scholar] [CrossRef]
  16. Ren, Y.; Han, C.; Yang, H.; Wei, B.; Cao, S.; Qian, Y.; Tang, Y. Study on soil microbial diversity of five urban landscape plants. Soil 2021, 53, 746–754. [Google Scholar]
  17. Zhang, J.; Xue, J.; Li, H.; Chai, X.; Zhao, S.; Li, L.; Zhang, S.; Jia, L.; Zhang, J.; Wang, G. Response of microbial community structure and diversity in wheat rhizosphere to water stress. J. Irrig. Drain. 2022, 41, 41–50. [Google Scholar]
  18. Deng, D.; Deng, T.; Zhou, Y.; Wang, J.; Yang, L. Soil microbial diversity and its response to soil physical and chemical properties in different banana varieties. J. Trop. Crops 2019, 40, 1858–1864. [Google Scholar]
  19. Xu, H.; Xue, Y.; Ding, H.; Qi, H.; Li, T.; Mao, W.; Cheng, S. Microbial Community Structure and Diversity of Peach Rhizosphere Soil in Dif-ferent Regions. China Fruit Veg. 2024, 44, 72–79. [Google Scholar]
  20. Wei, C.; Gu, W.; Tian, R.; Xu, F.; Han, Y.; Ji, Y.; Li, T.; Zhu, Y.; Lang, P.; Wu, W. Comparative analysis of the structure and function of rhizosphere microbiome of the Chinese medicinal herb Alisma in different regions. Arch. Microbiol. 2022, 204, 448. [Google Scholar] [CrossRef]
  21. Kui, L.; Chen, B.; Chen, J.; Sharifi, R.; Dong, Y.; Zhang, Z.; Miao, J. A Comparative Analysis on the Structure and Function of the Panax notoginseng Rhizosphere Microbiome. Front. Microbiol. 2021, 12, 673512. [Google Scholar] [CrossRef]
  22. Fischer, S.E.; Fischer, S.I.; Magris, S.; Mori, G.B. Isolation and characterization of bacteria from the rhizosphere of wheat. World J. Microbiol. Biotechnol. 2007, 23, 895–903. [Google Scholar] [CrossRef]
  23. Wang, G.; Liu, J.; Yu, Z. Research progress on ecology of soil acidobacter bacteria. Biotechnol. Bull. 2016, 32, 14–20. [Google Scholar]
  24. Jangid, K.; Williams, M.A.; Franzluebbers, A.J.; Sanderlin, J.S.; Reeves, J.H.; Jenkins, M.B.; Endale, D.M.; Coleman, D.C.; Whitman, W.B. Relative impacts of land-use, management intensity and fertilization upon soil microbial community structure in agricultural systems. Soil Biol. Biochem. 2008, 40, 2843–2853. [Google Scholar] [CrossRef]
  25. Liu, X.; Li, Z.; Liu, R.; Li, L.; Wang, W. Changes of bacterial community structure in rhizosphere soil of soybean at different growth stages. Guangxi Plant 2018, 38, 1363–1370. [Google Scholar]
  26. Bokulich, N.A.; Subramanian, S.; Faith, J.J.; Gevers, D.; Gordon, J.I.; Knight, R.; Mills, D.A.; Caporaso, J.G. Quality filtering greatly improves diversity estimates for Yili amplicon sequencing. Nat. Method 2013, 10, 57–59. [Google Scholar] [CrossRef]
  27. Li, Y.; Song, D.; Liang, S.; Dang, P.; Qin, X.; Liao, Y.; Siddique, K.H. Effects of No-tillage and Stubble on Soil Microbial Biomass Carbon, Nitrogen, and Enzyme Activities. Acta Ecol. Sin. 2009, 29, 5508–5515. [Google Scholar]
  28. Huang, W. Changes in Rhizosphere Microbial Flora and Screening of Key Microorganisms under Continuous Cropping of Wild Rehmannia Glutinosa. Master’s Thesis, Fujian Agriculture and Forestry University, Fuzhou, China, 2018. [Google Scholar]
  29. Zhang, Q.; Wang, C.; Sun, Z.; Li, S.; Liang, Y. Research Progress on Factors Influencing Soil Microbial Biomass and Diversity. North. Hortic. 2022, 116–121. [Google Scholar]
  30. Berendsen, R.L.; Vismans, G.; Yu, K.; Song, Y.; de Jonge, R.; Burgman, W.P.; Burmølle, M.; Herschend, J.; Bakker, P.A.H.M.; Pieterse, C.M.J. Disease-induced assemblage of a plant-beneficial bacterial consortium. ISME J. 2018, 12, 1496–1507. [Google Scholar] [CrossRef]
  31. Chen, C. The Effects of Different Crop Rotation Patterns on Soil Aggregate Distribution, Microbial Diversity, and Crop Yield. Master’s Thesis, Henan Agricultural University, Zhengzhou, China, 2023. [Google Scholar]
  32. Gong, Z. Study on Soil Fertility Status and Nutrient Distribution Characteristics of Panax Notoginseng Plants in Different Production Areas. Master’s Thesis, Huazhong Agricultural University, Wuhan, China, 2014; pp. 26–60. [Google Scholar]
  33. Zhu, J. Study on the Mechanism of Accumulation of Active Ingredients in Different Developmental Stages of Gastrodia Elata. Master’s Thesis, Minzu University of China, Beijing, China, 2024. [Google Scholar]
  34. Qu, A. Characteristics of Soil Properties and Soil Quality Evaluation under Different Planted Forests in Stony Mountainous Areas of North China. Master’s Thesis, Henan Agricultural University, Zhengzhou, China, 2023. [Google Scholar]
Figure 1. The layout of different sample plots demonstrating the geographical map of sampling sites.
Agronomy 14 01735 g001
Figure 2. Sample dilution curve. Reads were clustered using Usearch software to obtain OTUs, and the dilution curve of each sample was drawn to reflect the rationality of sequencing data amount. When the curve tended to be flat, the amount of sequencing data was gradually reasonable, proving that the amount of sequencing data was saturated. The slope indicates the size of genetic richness.
Agronomy 14 01735 g002
Figure 3. Alpha diversity of wild celery root soils in different regions. The Chao1 index represents the species richness; the Shannon index represents evenness; the Simpson index represents diversity.
Agronomy 14 01735 g003
Figure 4. Shannon exponential curve. The bacterial Shannon index of soil samples tends to stabilize, indicating that the bacterial quantity in the samples is sufficiently large and approaching saturation.
Agronomy 14 01735 g004
Figure 5. Shannon exponential curve. PCoA ranks the best eigenvalue based on the distance matrix. In the results, different colors represent different groups. The closer the sample distance is, the more similar the microbial composition structure between the samples, the less the difference.
Agronomy 14 01735 g005
Figure 6. Composition of bacterial colonies in celery soil at gate level. The relative abundance of each sample/group is displayed in different forms. The bar chart is presented in the form of stacked bar graphs for a more intuitive comparison of sample abundance. In each level, we can intuitively see the expression of the dominant species and the changing trend in different treatments.
Agronomy 14 01735 g006
Figure 7. Species abundance clustering at the soil genus level in celery roots. The middle horizontal axis is the sample name/group, and the vertical axis represents the relative abundance of a classification; different colors correspond to different species at the same level. The bar chart can show the composition of each sample/group with the high expression species and also observe the species composition, expression, and expression trends between groups.
Agronomy 14 01735 g007
Figure 8. RDA analysis of soil bacterial community distribution and environmental factors in celery roots. Each point in the sample plot represents a sample, and the closer the distance between the two points is, the higher the community structure similarity between the two samples. Arrows represent different influencing factors, respectively. When the angle between influencing factors (between factors and samples) is acute, the two factors are positively correlated, and the blunt angle is negative. The longer the radiation, the greater the effect of this factor. The location of the sample projection point on the arrow approximately represents the numerical size of that factor in the corresponding sample.
Agronomy 14 01735 g008
Table 1. The data in this table exhibit the latitude, longitude, altitude, sunshine duration, annual average temperature, annual average rainfall, frost-free period, and canopy density of the survey locations.
Survey LocationSurvey AbbreviationLatitude (Degree)Longitude (Degree)Elevation (M)Sunshine Hour (h)Average Annual Temperature (°C)Average Annual Rainfall (mm)Frost-
Free Period (Days)
Canopy Density
Tonghua CityTonghuaN125.75E41.68320–6707.615.5 °C8701450.7
Linjiang CityLinjiang N126.90E41.80550–7358.214 °C8001800.8
Jiangyuan DistrictJiangyuanN126.59E42.06630–8408.114.5 °C8801400.7
Dongfeng CountyDongfengN125.53E42.68300–4457.584.6 °C5901400.3
Huadian CityHuadianN126.75E42.98320–7807.813.7 °C7481250.6
Table 2. Soil physicochemical property determination.
SamplepHAvailable Phosphorus
(mg/kg)
Available Nitrogen
(mg/kg)
Electric Conductivity
(MS/cm)
Tonghua Large-leaf Celery6.27 ± 0.03 b16.47 ± 0.38 bc17.93 ± 0.26 d852.50 ± 17.50 bc
Linjiang Large-leaf Celery6.83 ± 0.14 a17.83 ± 0.09 b20.65 ± 0.48 c830.00 ± 13.23 c
Jiangyuan Large-leaf Celery6.12 ± 0.14 bc15.52 ± 0.20 c23.34 ± 0.83 b868.50 ± 5.29 b
Huadian Large-leaf Celery5.92 ± 0.03 c8.09 ± 0.04 d15.63 ± 0.37 e411.50 ± 5.77 d
Artificially Cultivated Large-leaf Celery5.64 ± 0.18 d179.13 ± 1.51 a186.70 ± 1.96 a1560.00 ± 11.46 a
Tonghua Water Celery6.37 ± 0.42 a13.37 ± 0.08 c11.96 ± 0.90 b269.33 ± 8.14 b
Linjiang Water Celery6.62 ± 0.27 a12.69 ± 0.13 c10.47 ± 0.27 b273.67 ± 13.65 b
Dongfeng Water Celery6.37 ± 0.17 a15.07 ± 0.05 b6.10 ± 1.30 c229.00 ± 3.77 c
Tonghua Old Mountain Celery6.88 ± 0.09 a15.7 ± 0.10 c18.12 ± 0.21 c785.17 ± 9.28 bc
Linjiang Old Mountain Celery6.78 ± 0.03 a17.37 ± 0.13 b20.37 ± 0.51 b770.00 ± 6.61 c
Jiangyuan Old Mountain Celery5.68 ± 0.04 b15.22 ± 0.12 c19.71 ± 0.34 b787.00 ± 7.55 b
Huadian Small-leaf Celery5.96 ± 0.027.96 ± 0.1113.60 ± 1.19426.67 ± 10.41
Disclaimer/Publisher’s Note: The statements, opinions and data contained in all publications are solely those of the individual author(s) and contributor(s) and not of MDPI and/or the editor(s). MDPI and/or the editor(s) disclaim responsibility for any injury to people or property resulting from any ideas, methods, instructions or products referred to in the content.

