Article

Dynamic Evaluation and Risk Projection of Heat Exposure Based on Disaster Events for Single-Season Rice along the Middle and Lower Reaches of the Yangtze River, China

1
Collaborative Innovation Center on Forecast and Evaluation of Meteorological Disasters, Nanjing University of Information Science & Technology, Nanjing 210044, China
2
State Key Laboratory of Severe Weather, Chinese Academy of Meteorological Sciences, Beijing 100081, China
3
National Meteorological Center, Beijing 100081, China
4
Department of Atmospheric Science, School of Environmental Studies, China University of Geosciences, Wuhan 430074, China
*
Author to whom correspondence should be addressed.
Agronomy 2024, 14(8), 1737; https://doi.org/10.3390/agronomy14081737 (registering DOI)
Submission received: 14 July 2024 / Revised: 2 August 2024 / Accepted: 5 August 2024 / Published: 7 August 2024
(This article belongs to the Section Farming Sustainability)

Abstract

:
Along with climate warming, extreme heat events have become more frequent, severe, and seriously threaten rice production. Precisely evaluating rice heat levels based on heat duration and a cumulative intensity index dominated by temperature and humidity is of great merit to effectively assess regional heat risk and minimize the deleterious impact of rice heat along the middle and lower reaches of the Yangtze River (MLRYR). This study quantified the response mechanism of daytime heat accumulation, night-time temperature, and relative humidity to disaster-causing intensity in three categories of single-season rice heat (dry, medium, and wet conditions) using Fisher discriminant analysis to obtain the Heat Comprehensive Intensity Index daily (HCIId). It is indicated that relative humidity exhibited a negative contribution under dry heat, i.e., heat disaster-causing intensity increased with decreasing relative humidity, with the opposite being true for medium and wet heat. The Kappa coefficient, combined with heat duration and cumulative HCIId, was implemented to determine classification thresholds for different disaster levels (mild, moderate, and severe) to construct heat evaluation levels. Afterwards, spatiotemporal changes in heat risk for single-season rice through the periods of 1986–2005, 2046–2065 and 2080–2099 under SSP2-4.5 and SSP5-8.5 were evaluated using climate scenario datasets and heat evaluation levels carefully constructed. Regional risk projection explicitly revealed that future risk would reach its maximum at booting and flowering, followed by the tillering stage, and its minimum at filling. The future heat risk for single-season rice significantly increased under SSP5-8.5 than SSP2-4.5 in MLRYR. The higher risk would be highlighted in eastern Hubei, eastern Hunan, most of Jiangxi, and northern Anhui. As time goes on, the heat risk for single-season rice in eastern Jiangsu and southern Zhejiang will progressively shift from low to mid-high by the end of the twenty-first century. Understanding the potential risk of heat exposure at different growth stages can help decision-makers guide the implementation of targeted measures to address climate change. The proposed methodology also provides the possibility of assessing other crops exposure to heat stress or other extreme events.

1. Introduction

Compared with 1961–1990, the global average near-surface temperature has risen by 0.8 °C over the past 30 years. Climate change, mainly characterized by climate warming, has had and will continue to impact global agriculture significantly [1,2]. Process-based crop models indicate that each degree Celsius increase in global average temperature, without CO2 fertilization and adaptation measures, will reduce global yields of major food crops by 19.7%, including a 3.2% reduction in rice [3]. Rice (Oryza sativa L.) is the primary source of sustenance for over 50% of the world’s population and is widely cultivated in China [4], Sudan, Laos, and India [5,6]. High rice growing proportions generally concentrate along the tropics and subtropics, potentially susceptible to extreme heat events during the rice growing season. In the middle and lower reaches of the Yangtze River (MLRYR), the typical rice-growing areas of China, there have been numerous instances of long-lived (≥6 days) heat waves for rice after the annual plum rain season in the late 1990s [7,8]. The risk of rice production suffers from heat stress with increasing frequency and intensity in MLRYR [9,10], where substantial losses were caused by the 2003 heat disaster alone, including a 5.18 million-ton reduction and more than USD 1.5 billion [11]. Reductions in rice in MLRYR will significantly affect national food security and socio-economic development.
The global night-time temperature has been rising rapidly over the past 50 years, at 1.4 times the rate of daytime temperature. The severity and spatial coverage of compound day-night heat waves (CohotES) show significant increasing trends [12,13], especially in MLRYR [14]. An anomalous anticyclone in MLRYR, persisting through day and night, is a prerequisite for the occurrence of CohotES [15]. Such circulation systems result in extremely high temperature during the day through reduced cloud cover and increased solar radiation. Simultaneously, intensified southerlies transport additional water vapor toward and therefore suppress radiative cooling at night. Rice growth is sensitive to increased night-time temperatures when experiencing heat stress. Artificially controlled experiments highlighted that the rice yield was reduced by over 10% on average while the night-time temperature increased to 30~32 °C [16,17,18]. Excessively high daytime or night-time temperatures will threaten the region’s high and stable rice production [19,20].
Heat stress leads to rice yield reductions, as shown by inhibited pollen germination, spikelet sterility, reduced grain weights, and a shorter grain-filling stage [21,22,23,24]. Different effects, such as accelerated night-time respiration, enhanced following daytime photosynthetic activity, and increased biomass production, were observed through exposure to higher night-time temperatures [25,26], although disagreement existed [16,27]. In contrast, night-time warming negatively affects rice yields in temperate and subtropical regions but has a positive effect at high latitudes [28]. Relative humidity is supposed to be an essential factor influencing heat damage intensity in rice yield. When temperatures rose above 36 °C during flowering, higher humidity increased spikelet sterility by affecting pollination [29,30]. However, in some dry climate regions with high rice production (such as New South Wales and southern Iran), there was no significant increase in spikelet sterility even at an extreme temperature of 40 °C [31]. The response of high or low humidity is often overlooked in occurrence trends in rice heat [32], exacerbating uncertainty in crop yield predictions.
The temperature exceeding the critical threshold value is a direct cause of heat disaster. In this process, the intensity of heat stress is closely coupled with relative humidity and night-time temperature. Generally, two simulation methods, process-based crop models and statistical models, are the main means to explore the mechanism of how temperature and humidity conditions and their interaction impact the hazard intensity of heat exposure [33]. Process-based crop models such as DASST-CERES [34], WOFOST [35], and ORYZA2000 [36] usually require considerable model parameters and input data. Furthermore, their simulation accuracy is limited by data quality and regional scale, and extreme heat stress also adds uncertainty to the simulation [37,38,39]. Owing to their advantages of simple calculation methods and easy access to data and input parameters, empirical models based on statistical models are widely used to achieve the simulation of the intensity and hazard degree of rice heat [4,40]. Currently, the existing indicators of the intensity of rice heat based on statistical models are mainly the maximum temperature, the number of heat days, the heat accumulation, and other disaster-causing factors related to temperature. These indicators explain how extreme heat affects the extent of rice damage but are under-considered and non-dynamic, thus are exaggerated or underestimated to assess actual disasters.
As evidenced by greenhouse gas concentrations, global warming is likely to aggravate rice heat risk. The characteristics of heat exposure, both past [10,41,42] and future [4,39,43], have received ongoing attention. Based on statistical methods, agro-disaster representations integrating disaster records and meteorological data [41] can be explored to reveal the relationship between disaster-causing factors and damage degrees. The mechanism of how temperature-humidity coupling conditions affect rice under heat exposure is still ambiguous and needs to be deeply explored. In this study, we used single-season rice as the study subject to clarify the methodology for dynamic evaluation and analyze the potential risk of heat exposure in MLRYR. Furthermore, the concepts of dry heat and wet heat were introduced to explore whether there is an opposite response mechanism. The main objectives are: (1) to establish day-by-day comprehensive intensity indexes of heat disaster dominated by temperature and humidity; (2) to consider the cumulative heat hazard effects and further construct catastrophe-grade indicators of heat disaster; and (3) to predict the potential risk of heat exposure at different growth stages under future climate scenarios at the grid scale, which provides the scientific basis and technical support for dynamic discrimination and future evaluation of heat exposure to single-season rice in MLRYR.

2. Materials and Methods

2.1. Study Region

The study region is situated in MLRYR (Southeast China), ranging between 24 and 35° N latitude and 109 and 123° E longitude, and consists of Hubei (HB), Hunan (HN), Anhui (AH), Jiangxi (JX), Jiangsu (JS), and Zhejiang (ZJ) Provinces (Figure 1). Under the control of a subtropical monsoon climate, the MLRYR is characterized by hot and rainy summers and cold and dry winters. The annual mean temperature is approximately 14~20 °C. Average annual precipitation ranges from 1000 to 1400 mm, with 40~60% occurring from June to August. The dominant rice cropping systems are double-cropped and single-cropped systems, including three types of rice (double-season early, double-season late, and single-season rice). However, planting structure adjustment and workforce shortages have led to a significant increase in the planting area of single-season rice in MLRYR, accounting for approximately 73% of the rice cultivated area by 2020.

2.2. Data Description

Meteorological data for the study region from 1971 to 2020 were obtained from the National Meteorological Information Center, China Meteorological Administration (NMIC, CMA). After excluding the stations with a data missing rate greater than 5% and alpine stations, 468 meteorological stations were used in this study (Figure 1). For sites with missing data on individual dates in individual years, the missing values were replaced by the average data of neighboring sites in the same period. The dataset, including daily maximum temperature (Tmax), daily minimum temperature (Tmin, night-time temperature), and daily mean relative humidity (RH), was used to explore the representation form of heat intensity indexes.
Single-season phenology data included the average date of seeding, tillering, booting, flowering, filling, and ripening during 1981–2010 and were obtained from 58 agro-meteorological stations in the study region (Figure 1). Average dates were interpolated to the corresponding 468 meteorological stations using the Inverse Distance Weighted (IDW) method.
Historical disaster data of single-season rice heat in MLRYR, including the occurrence/end time, location, and disaster description, could be recorded in the Yearbook of Meteorological Disasters in China [44] and the China Meteorological Disasters Book (JS, ZJ, AH, JX, HB, and HN) [45]. The dataset, re-analyzed by conditions triggering rice heat, could be collected to construct historical disaster samples.
Climate scenario data (i.e., daily maximum/minimum near-surface air temperature and daily near-surface relative humidity (RH)) were downloaded from the NASA Earth Exchange Global Daily Downscaled Projections (NEX-GDDP, https://portal.nccs.nasa.gov/datashare/nexgddp_cmip6/ (accessed on 1 February 2024)) dataset conducted from four models under Phase 6 of the Climate Model Intercomparison Project (CMIP6, Table 1). The dataset was produced using a daily variant of the monthly bias correction/spatial disaggregation (BCSD) method with a horizontal resolution of 0.25° × 0.25° [46]. This variant method could use information derived from the comparison to adjust future climate projections to be more consistent with the historical climate records. Consistent with the Fifth Assessment Report of the IPCC [47], the historical experiment under two scenarios (SSP2-4.5 and SSP5-8.5) from 1986 to 2005 was selected to represent the current climate state (historical baseline), as well as two future periods of 2046–2065 and 2080–2099, representing the mid- and end of the twenty-first century, respectively. Then, the origin maximum temperature (Tmax) and minimum temperature (Tmin) in Kelvin were converted to equivalent temperatures in degrees Celsius. An ensemble of them was obtained by arithmetic averaging the projections from four climate models. This method was more valid in resolving the possible biases in the individual model, which was always applied in the analysis of future climate scenarios [48,49].

2.3. Data Description

Documentary evidence of historical agro-disaster events can provide disaster information for relevant studies. Destruction evidence and methodology data can be coupled to explore the disaster weather conditions that can trigger crop damage [41,50]. Given extensive cognition and high sensitivity to extreme temperatures on rice plants, Tmax can better guide the conditions of heat damage occurrence than the mean state. Here, the Tmax values of each historical disaster record were first rechecked according to the heat critical thresholds for single-season rice, which identified the exact occurrence/end time of hot weather. Meteorological data (i.e., Tmax, Tmin, and RH) during the re-identified hot weather process, integrating affected growth stage, location, and occurrence/final time, were extracted to construct heat and non-heat datasets on historical disaster processes. Then, daily-scale samples based on the above two types of sample sets were separated to determine whether or not they were disaster-causing to propose an expression of daily heat intensity evaluation.

2.3.1. Samples of Rice Heat Process

It is widely accepted that the heat stress process is defined according to the threshold of average temperature at 30 °C or Tmax at 35 °C for more than 3 consecutive days throughout the productive phase [9,39,43]. To some extent, there must be several uncertainties and errors in assessing heat stress intensity using the same indicator because of the neglect of crop heat tolerance, which varies with rice growth. However, the latest research has addressed this limit and formulated applicable critical thresholds at different growth stages for single-season rice exposure to heat stress at this regional scale [51]. The various thresholds of heat occurrence were set to 36 °C at tillering, 35 °C at booting, 35 °C at flowering, and 38 °C at filling in this study. A detailed description of the determination of the four growth stages mentioned above as crucial phenology phases for heat exposure can be found in M. Jiang [51]. Among all recorded historical disasters, rice heat samples of hot weather processes with continuous days ≥3 d were counted by the given critical threshold and divided into the corresponding growth stages. Disaster descriptions identified rice heat levels as mild, moderate, and severe. Keywords such as “disaster-affected” and “adverse effects” referred to mild heat. Moderate heat was described as “heat forcing ripening”, “obvious effects” or “disaster-destroyed”. The severe level caused “serious yield reduction” and “crop extinction”. Each heat sample was marked with a disaster level. Non-heat samples were constructed by a collection of Tmax, Tmin, and RH before/after 5 d corresponding to heat samples to better identify rice heat exposure. Excluding samples spanning growth stages for heat and non-heat samples, 80% of heat samples were randomly selected to establish the heat evaluation level for single-season rice, with 20% of independent samples reserved for verification (Table 2).

2.3.2. Daily Heat-Affected (H-d) and Non-Heat-Affected (NH-d) Samples

Our work was built on the hypothesis that the climatic conditions of heat samples could pose a disaster-causing risk at any moment, with no disaster-causing risk in non-heat samples. Thus, daily heat-affected (H-d) and non-heat-affected (NH-d) sample sets were constructed from heat and non-heat samples. For easy application and comparison in subsequent studies, daytime heat accumulation (Tcum) was calculated as the cumulative temperatures for which Tmax exceeded the relative critical threshold of heat occurrence. The same calculation was applied to constructed samples and climate scenario data. According to temperature/humidity experiments in artificial climate boxes [29,30,52], RHs of 80~90% or 45~60% were generally set for high- or low-humidity environments. Thus, H-d and NH-d samples were further divided into three categories with RH ≤ 60%, 60% < RH < 80%, and RH ≥ 80% labeled as dry, medium, and wet heat samples, respectively. So far, daily samples with H-d/NH-d × 3 RHs × 4 growth stages have been utilized to compare the difference between the disaster and non-disaster weather conditions to acquire the critical values of heat characteristics.

2.4. Construction of Heat Evaluation Level

In tackling classification challenges with two or more distinct categories, this study employed Fisher discriminant analysis and the Kappa coefficient, methodologies frequently harnessed in preceding investigations [53,54]. Upon the implementation of Fisher discriminant analysis, the critical line between H-d and NH-d samples was obtained to explore the mechanism of how temperature-humidity coupling conditions (Tcum, Tmin, and RH) affected single-season rice. The equation of the critical line was used to obtain the Heat Comprehensive Intensity Index daily (HCIId). Then, the Kappa coefficient was implemented to determine classification thresholds for different disaster levels (mild, moderate, and severe), thereby constructing catastrophe-grade indicators of heat disaster for single-season rice at different growth stages.

2.4.1. Fisher Discriminant Analysis

Fisher discriminant analysis is a mathematical tool for constructing a categorical discriminant function based on maximizing the ratio of interclass variance to intraclass variance for the classification of known samples. The center of mass of each category is determined from the known category samples, and then the category belonging to an unknown sample point is judged based on its distance to the center of mass of each category. With H-d (1) and NH-d (0) as dependent variables, the critical line was established with Tcum, RH, and Tmin as independent variables. The formula is as follows:
I c = c 1 Tcum + c 2 RH + c 3 Tmin +   c 0
where c 1 , c 2 and c 3 are discriminant coefficients, c 0 is a constant, and I c is the midpoint of the center of mass between H-d and NH-d sample sets. The obtained critical line maximizes the classification of H-d and NH-d samples. This process was implemented using the “Classification” module of SPSS 16.0 (International Business Machines Corporation, Armonk, NY, USA).
If the center of mass on H-d/NH-d samples falls above/below the critical line, it indicates that there is a non-disaster state below the critical line and a disaster-causing state above it. The sample point above the critical line is farther away from the critical line, which means that the more severe the sample heat, the higher the disaster-causing probability. After the conversion of the critical line equation, HCIId is expressed as:
HCIId = c 1 Tcum + c 2 RH + c 3 Tmin   + c 0 I c
HCIId = 0 is determined as the critical value of disaster-causing. HCIId ≤ 0 is identified as a non-disaster, while HCIId > 0 is identified as a disaster. Then, we focused on the duration (HCIId > 0) subjected to heat disaster processes and HCIId accumulation during the duration, two important components to reveal the heat disaster level within hot weather events. The duration and cumulative HCIId of each heat sample were calculated for subsequent research.

2.4.2. Kappa Coefficient

The Kappa coefficient is a metric for testing whether the model predictions are consistent with the actual classification results. The calculation of the Kappa coefficient is based on the confusion matrix and takes values ranging from −1 to 1, usually greater than 0. The evaluation standard is 0.0 < Kappa ≤ 0.2 (light), 0.2 < Kappa ≤ 0.4 (fair), 0.4 < Kappa ≤ 0.6 (moderate), 0.6 < Kappa ≤ 0.8 (substantial), and 0.8 < Kappa ≤ 1.0 (almost perfect), respectively. Here, samples of mild (A), moderate (B), and severe (C) rice heat were set as three categories of events. Using the duration and HCIId accumulation as the identification factors, the sample size recognized as mild (a), moderate (b), and severe (c) disasters, as well as the number of samples correctly recognized as mild (Aa), moderate (Bb), and severe (Cc) disasters under different test thresholds, were counted for the Kappa coefficient and Overall Accuracy (OA). Given the imbalance of disaster sample sizes between different categories, the Kappa coefficient was implemented as the main evaluation index to determine classification thresholds, with OA as an auxiliary evaluation index.
Kappa = P 0   P e 1   P e
P 0 = A a +   B b   +   C C A + B + C
P e = A   ×   a + B   ×   b + C   ×   c ( A + B + C )   ×   ( A + B + C )
where P 0 is the accuracy classification score (i.e., OA), and P e is the desired accuracy classification score. A greater Kappa indicates better classification performance. The test threshold corresponding to the maximum Kappa coefficient was determined to be the optimal classification threshold. If the maximum Kappa coefficient corresponded to multiple consecutive test thresholds, the optimal threshold was taken as the average of all those thresholds. The lower test threshold was selected if the maximum Kappa coefficient corresponds to two neighboring test thresholds. The computation of classification performance ( Kappa and OA) was completed by using the “cohen_kappa_score” and “accuracy_score” functions of “sklearn.metrics” package in Python 3.9 (Python Software Foundation, Amsterdam, Netherlands).

2.5. Projection Analysis of Rice Heat Risk

The risk analysis of rice heat refers to the probability or recurrence of heat exposure at a specific time within a given region. As a fuzzy mathematical set-value method for samples, information diffusion allows for optimizing fuzzy sample information to offset the information deficiency [55], which is always used in probability analysis of limited samples. To detect risk variations of heat exposure in the region, the Heat Risk Index (HRI) was developed by a weighted summation of disaster levels (mild, moderate, and severe) and the risk probability of their occurrence, calculated as follows:
HRI = i = 1 n p i Q i
where n is the number of disaster levels. p i is the weight of intensity in level i , and the weights of mild, moderate, and severe heat were 1, 2, and 3, respectively. Q i is the risk probability of disaster occurrence in level i . In this study, the risk probability of heat occurrence at each level was first estimated by applying information diffusion to the sequence of heat occurrence frequencies, calculated based on the evaluation level established previously. Afterward, HRIs for single-season rice at different growth stages were compared and analyzed through the periods of 1986–2005, 2046–2065, and 2080–2099 under SSP2-4.5 and SSP5-8.5. HRIs at the grid scale were computed programmatically in Python 3.9 and mapped in ArcGIS 10.4.1 (Environmental Systems Research Institute, Inc, RedLands, CA, USA).

3. Results

3.1. Quantification of Daily-Scale Heat Intensity

There were differences in the discrimination performance of the critical lines at different growth stages (Table 3). Given the significant difference in the quantity of H-d and NH-d samples under the wet heat condition at filling, the critical line for effective identification could not be obtained. Hence, wet heat samples combined with medium samples jointly identified the unique critical line. The discrimination accuracy of overall samples was higher than 75%, while that of NH-d and H-d samples ranged from 69.7% to 100% and from 78.4% to 100%, respectively. Tmin was detected as having no significance under dry heat at tillering and wet heat at booting for single-season rice, and RH was not significant under medium/wet heat at filling. Notably, RH variations tended to perform opposite effects under dry and wet heat conditions. As RH decreased and Tmin increased under dry heat conditions, the probability of a heat disaster increased. In contrast, the probability of a heat disaster increased when RH and Tmin increased under wet heat conditions.
Considering the coupled response mechanism of temperature and humidity, the disaster-causing capacity at different growth stages for single-season rice can be effectively identified by Fisher Discriminant Analysis. Then, HCIId at i d for quantifying the intensity of exposure to single-season rice heat at tillering (j = 1), booting (j = 2), flowering (j = 3), and filling (j = 4) was developed by transforming the equation for the critical lines (as shown in Formula (7)). Meanwhile, a positive/negative coefficient implied that the increase/decrease in disaster-causing factors made a positive contribution to the intensity of heat exposure.
HCIId =    0.658 Tcum i 0.121 RH i + 6.981          R H 60 , j = 1 0.427 Tcum i + 0.021 RH i + 0.059 Tmin i 2.597    60 < R H < 80 ,   j = 1 0.758 Tcum i + 0.016 RH i + 0.080 Tmin i 2.795     R H 80 ,   j = 1 0.625 Tcum i 0.071 RH i + 0.330 Tmin i 5.466     R H 60 ,   j = 2 0.554 Tcum i + 0.032 RH i + 0.146 Tmin i 6.144    60 < R H < 80 ,   j = 2      0.738 Tcum i + 0.060 RH i 4.344           R H 80 ,   j = 2 0.653 Tcum i 0.014 RH i   + 0.119 Tmin i 3.164     R H 60 ,   j = 3 0.572 Tcum i + 0.018 RH i + 0.171 Tmin i 6.115     60 < R H < 80 ,   j = 3   0.627 Tcum i + 0.037 RH i + 0.137 Tmin i 6.156     R H 80 ,   j = 3 0.569 Tcum i 0.013 RH i + 0.062 Tmin i 0.857     R H 60 ,   j = 4     0.539 Tcum i + 0.035 Tmin i 0.117          R H > 60 ,   j = 4

3.2. Evaluation of Rice Heat Level

3.2.1. Characteristics of Historical Heat Process

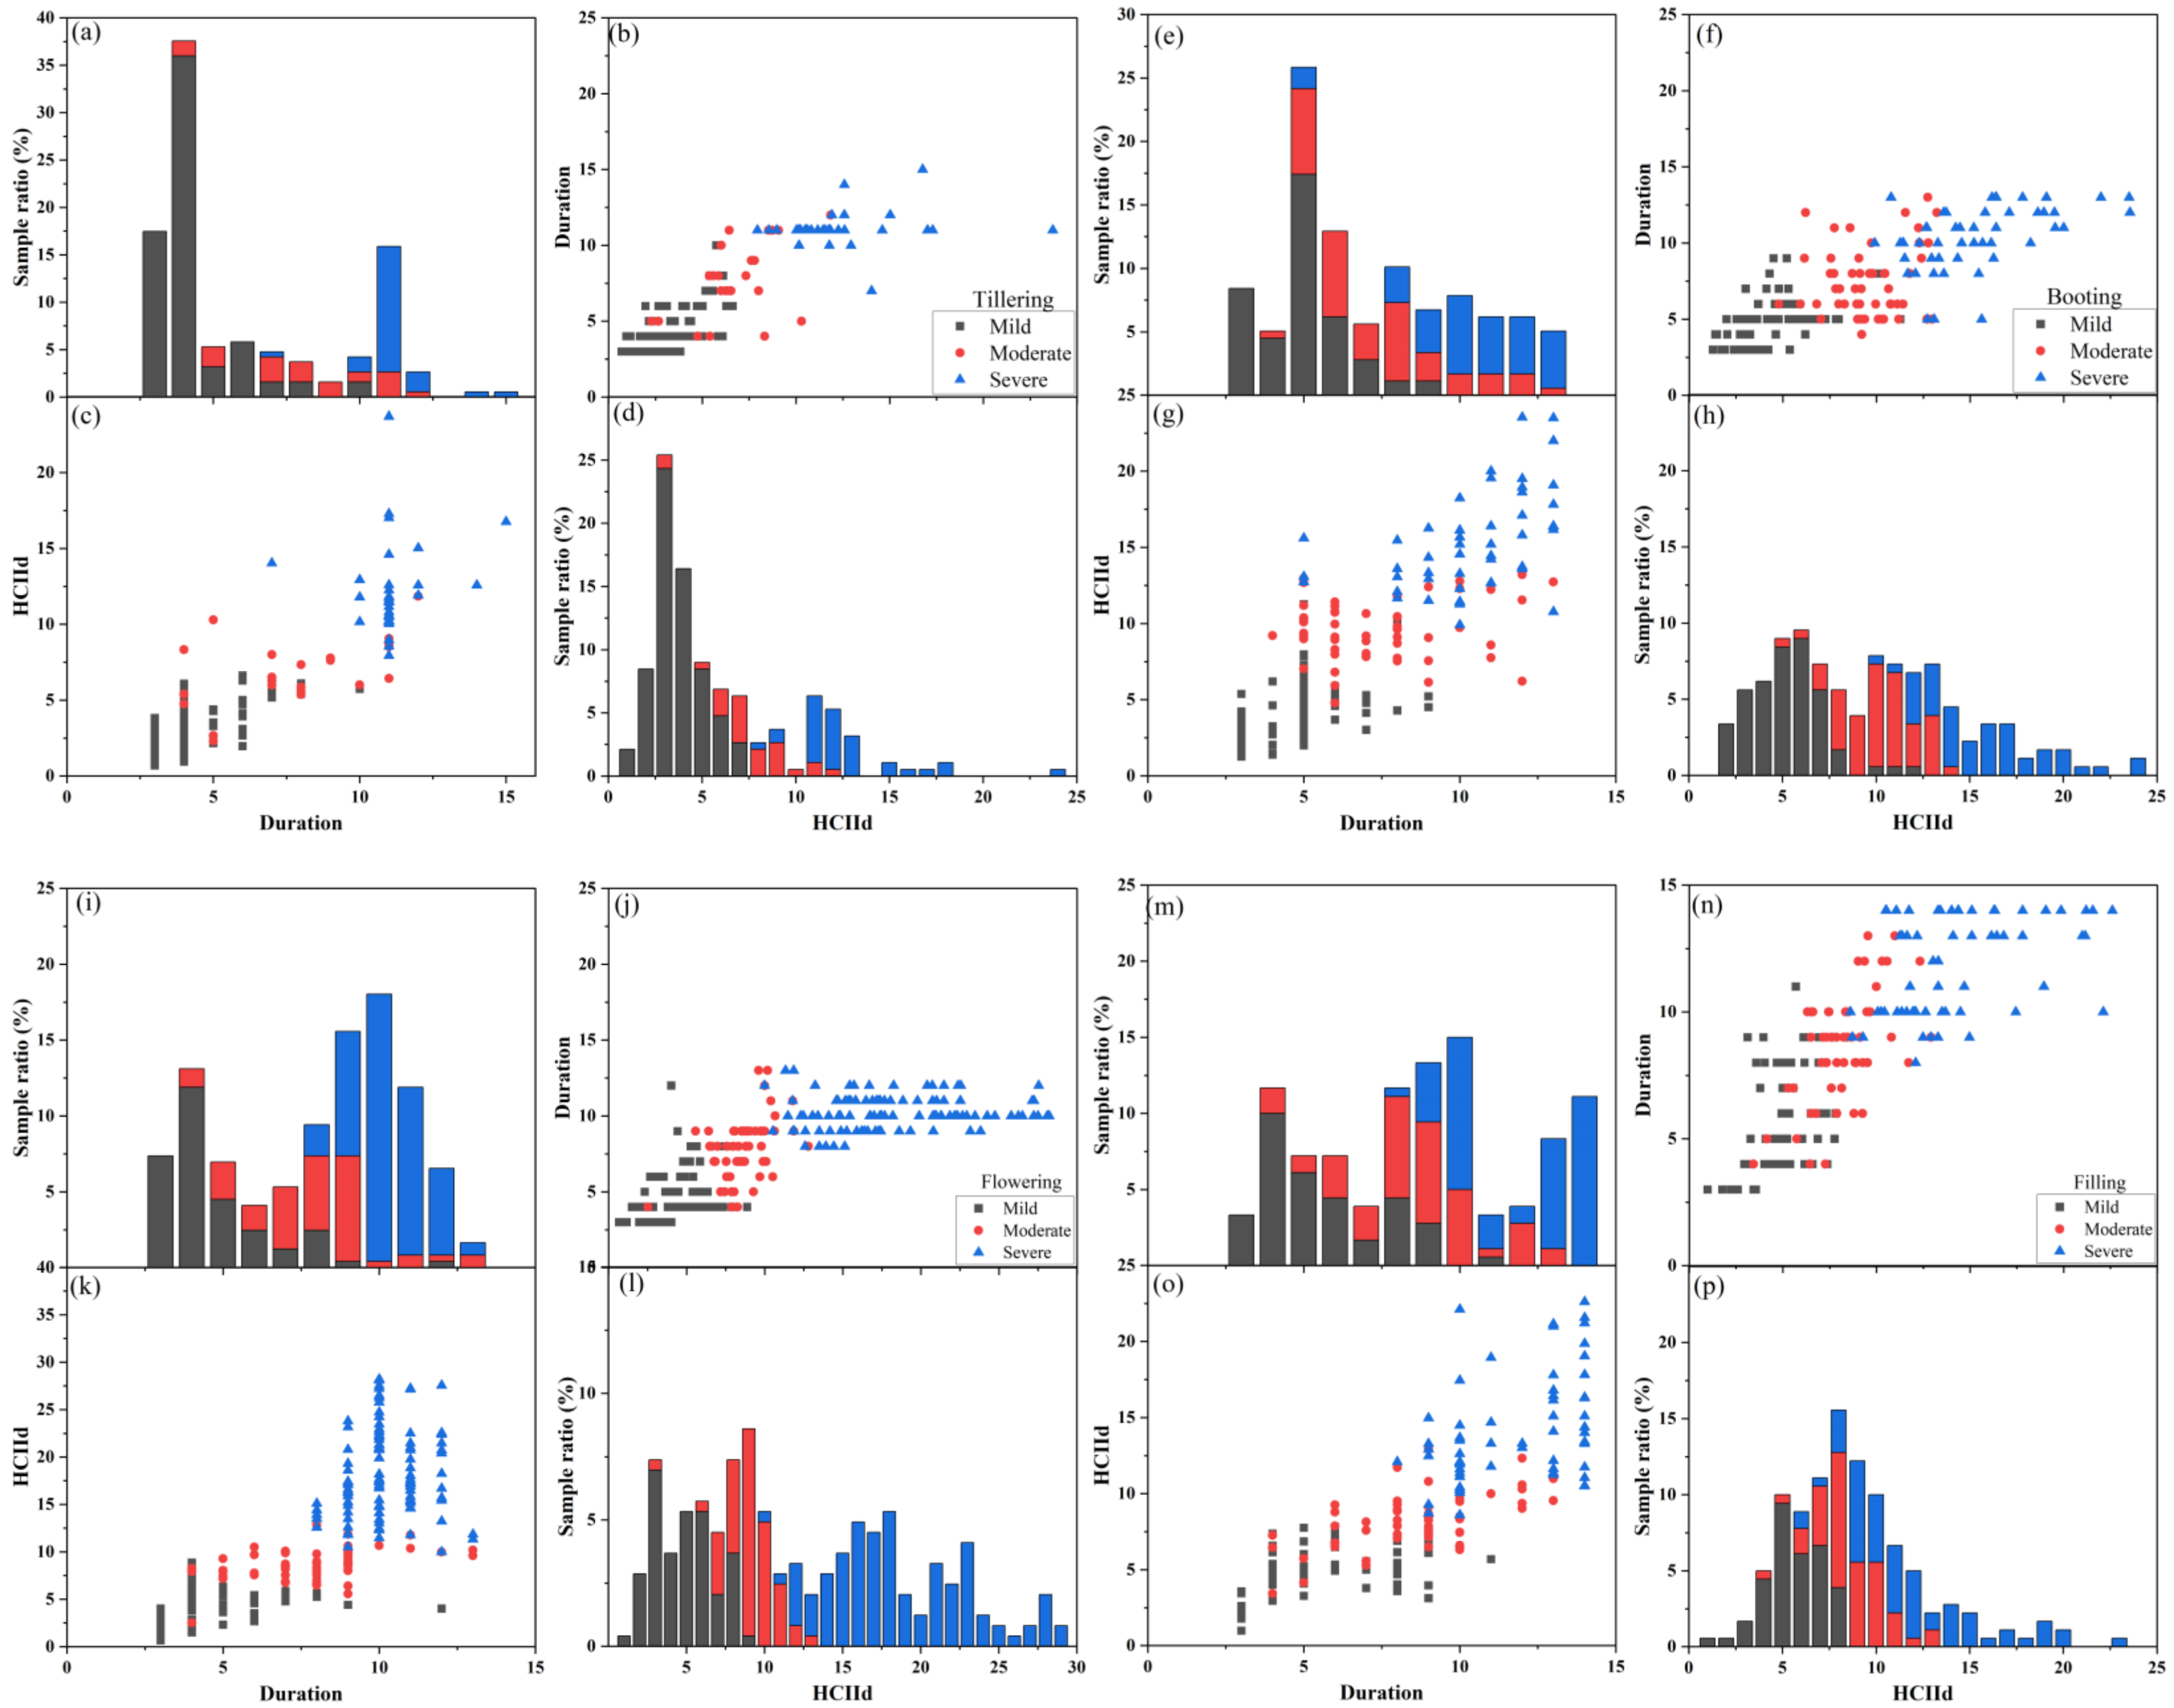
The heat duration of heat samples was rechecked based on the constructed HCIId index, and the cumulative HCIId value was calculated during the heat duration. There were differences in the distribution characteristics of durations and cumulative HCIIds of historical heat processes categorized as mild, moderate, and severe disasters (Figure 2). For hot weather duration at tillering, mild ones lasted 3~10 d with HCIId between 0.6~6.7; moderate ones lasted 4~12 d, with HCIId from 2.2 to 11.9; and severe ones lasted 7~14 d, with process-accumulated HCIId greater than 7.9. Relative to the booting and flowering stages, as the most sensitive phases to heat stress, mild rice heat both tended to occur for 3~9 consecutive days, which achieved approximately HCIId values of 0.8~11.3 and 0.6~8.9, while moderate disaster duration was generally distributed in 4~13 d, with HCIId between 4.7~13.3 and 2.5~12.8, respectively. And hot weather persisting for 4~13 d with HCIId greater than 9.9 might produce severe rice heat formation. In comparison, mild rice heat was relatively long between 3 and 11 d at filling, whereas process-accumulated HCIIds of moderate and severe disaster samples were more significant than 3.4 and 8.6, respectively.

3.2.2. Catastrophe Grade Indicators of Heat Disaster

The dynamic identification of rice heat disaster levels merely using a single weather factor tended to have lower simulation performance. Here, we combined heat duration with process-accumulated HCIId into one indicator as the trigger for the dynamic representation of quantitative and qualitative changes in the accumulation of multiple disaster-causing factors. First, the Kappa coefficient was utilized to classify heat duration at different disaster levels per growth stage of single-season rice by setting mild, moderate, and severe samples as three categories of events. The test interval for heat durations was from the minimum to the maximum value of heat sample sets in steps of 1 d. Table 4 provides insight into the classification performance regarding the durations of different heat levels. The highest Kappa coefficients at tillering, booting, flowering, and filling successively were 0.753, 0.532, 0.647, and 0.564, with OAs ranging from 0.691 to 0.876, demonstrating that the classification performance of different heat levels was relatively satisfactory. Not only at booting did hot weather persist for 3~5 d and 6~8 d induced mild and moderate rice heat, but also at flowering. There were slight extensions for heat durations at tillering and filling, with the 3~6 d and 7~9 d heat duration probably emerging as mild and moderate heat damage, respectively. Furthermore, heat durations of severe disasters at different growth stages for single-season rice mostly exceeded 9 d. So far, classification thresholds obtained for heat duration as an identifying factor can be used to recognize different disaster levels of single-season rice preliminarily.
Process-accumulated HCIId is a time-dynamic function evaluating rice exposure to heat stress according to disaster duration based on historical rice heat representation. The cumulative HCIId in the nine sample sets, combined with the given heat durations and the rice heat level, was calibrated to construct the catastrophe-grade indicators of heat disaster at each growth stage. Then, the minimum cumulative HCIIds of various mild sample sets were designated as the trigger threshold for the initial occurrence of heat disasters. Initial cumulative HCIIds of 0.6 at tillering, 0.8 at booting, 0.6 at flowering, and 0.9 at filling were selected, and catastrophe thresholds for the different ranges of heat durations in different disaster levels (mild, moderate, and severe) determined by optimal Kappa coefficients were described separately as shown in Table 5. Except for 3~6 d hot weather at tillering and filling with a Kappa coefficient of 0.586 and 0.406, respectively, the classification performances for the remaining sample sets were significantly consistent with a Kappa coefficient greater than 0.6 (substantial consistency). Relative to a single disaster-causing indicator (heat duration, Table 4), OA values at each growth stage revealed significant advances on account of the consideration of double identification factors. Taking the flowering stage as an example, rice was subjected to hot weather for 3~5 d (mild), 6~8 d (moderate) and > 8 d (severe) as the classification thresholds, and the accuracy of recognizing samples with different heat levels was approximately 77.9%. However, process-accumulated HCIIds were used as the identification factor to classify the samples of various durations (3~5 d, 6~8 d and >8 d) with identification accuracies of 91.0~96.9%, which indicated better evaluation performance.
For rice heat with a similar duration, the impact of rice heat intensity was directly determined by the HCIId of hot weather events. Taking the flowering stage as an example, the optimal thresholds to distinguish the mild, moderate, and severe levels are described in Table 5. Hot weather lasting for 3~5 d with cumulative HCIId of 0.6~7.4 may be identified as mild rice heat, while process-accumulated HCIId over 7.4 will induce moderate disaster to rice. Moreover, a 3~5 d duration of heat exposure at flowering will not cause a severe disaster to single-season rice. Similarly, mild, moderate, and severe rice heat for 6~8 d and ≥9 d will appear within process-accumulated HCIId of 0.6~6.15, 6.15~11.55, >11.55, and 0.6~5.0, 5.0~11.0, >11.0, respectively. In the actual evaluation of heat disaster levels for single-season rice at different growth stages, the dynamic catastrophe-grade indicators obtained from heat duration and cumulative HCIId can be referred to, as shown in Table 6.

3.2.3. Indicator Verification by Independent Heat Samples

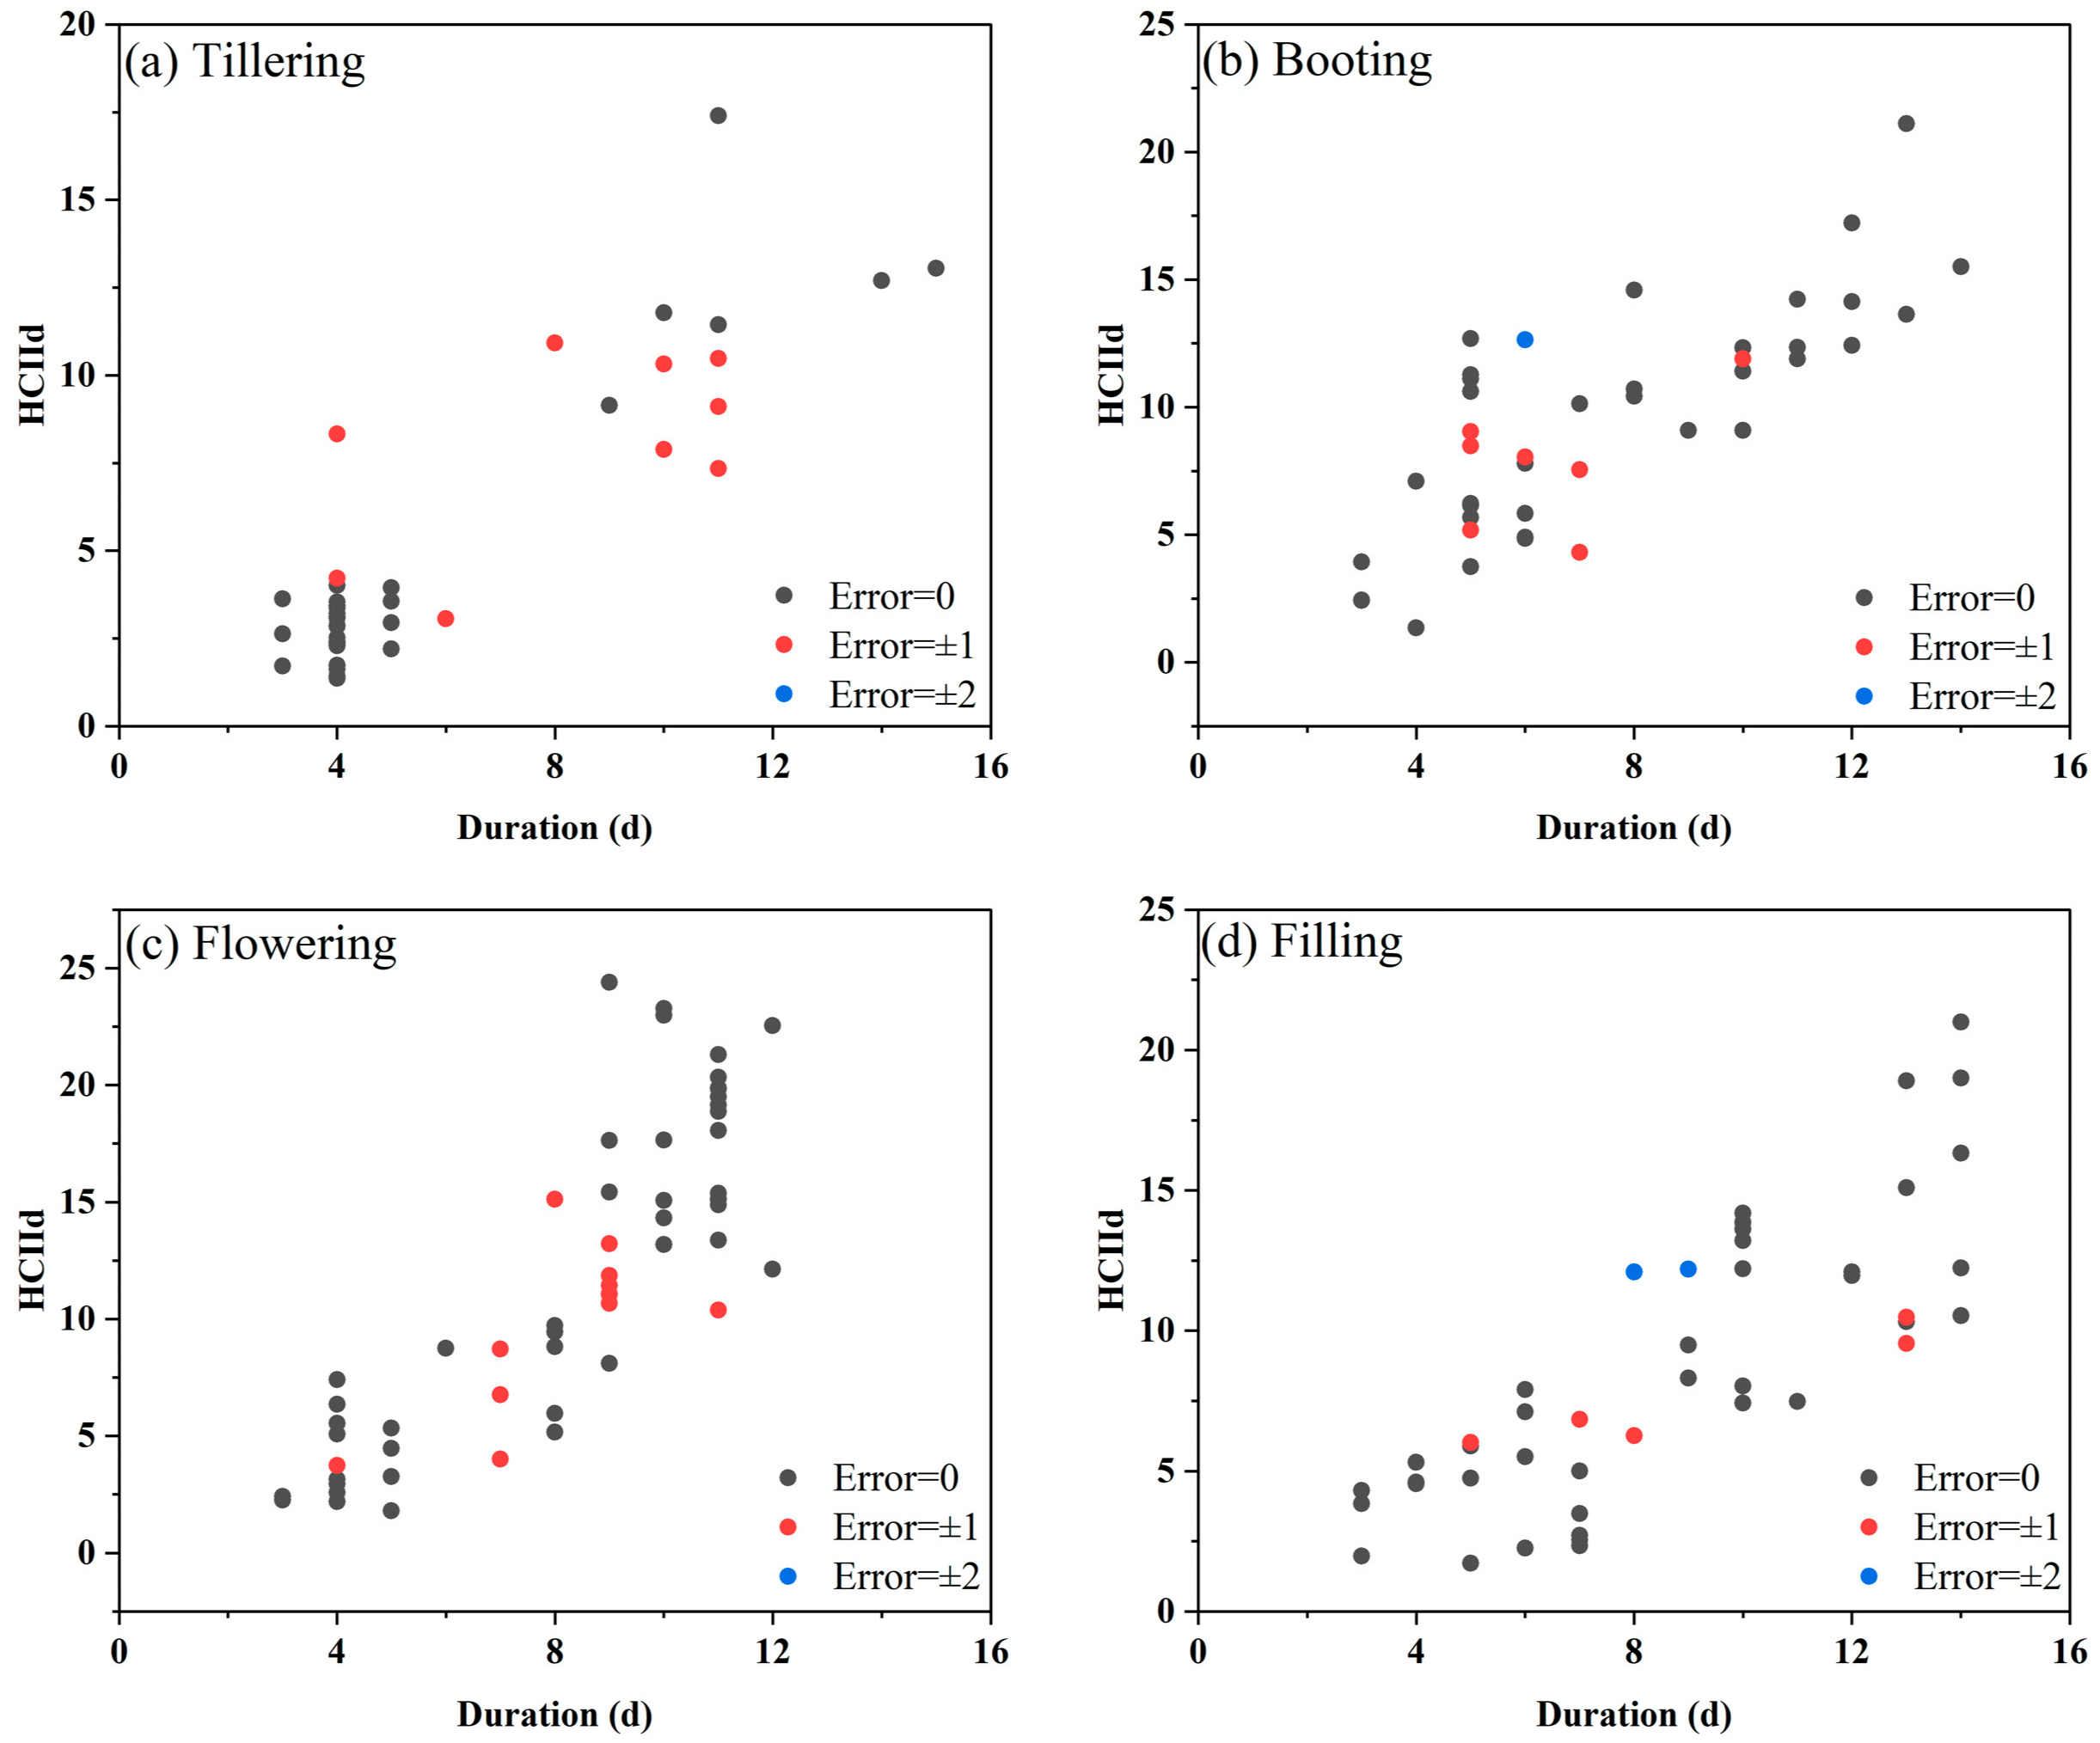
The reserved 20% of heat samples at different growth stages were employed to identify and validate the constructed heat evaluation level for single-season rice (Figure 3). To facilitate the comparison and description, mild, moderate, and severe levels were recorded as 1, 2, and 3, respectively. The identification error was obtained by subtracting the historical description grade from the indicator-based grade. The identification error = 0 was completely consistent, ±1 for substantial agreement, and ±2 for two levels of difference. Among 46 heat samples at tillering, 80.4% were completely consistent with the exact grade, and 19.6% were substantially in agreement (Figure 3a). The verification results of 35 independent samples at booting and 47 independent samples at flowering were completely consistent, accounting for 81.4% and 79.7% of the reserved rice heat, respectively (Figure 3b,c). The constructed grade indicators at tilling had the best evaluation performance, with 84.4% of the samples being completely consistent and 11.1% of the samples being in substantial agreement (Figure 3d). The verification accuracy (Error = 0) of catastrophe-grade indicators of heat disaster for single-season rice was 81.3%, which was an ideal performance.

3.3. Risk Projection for Single-Season Rice Heat

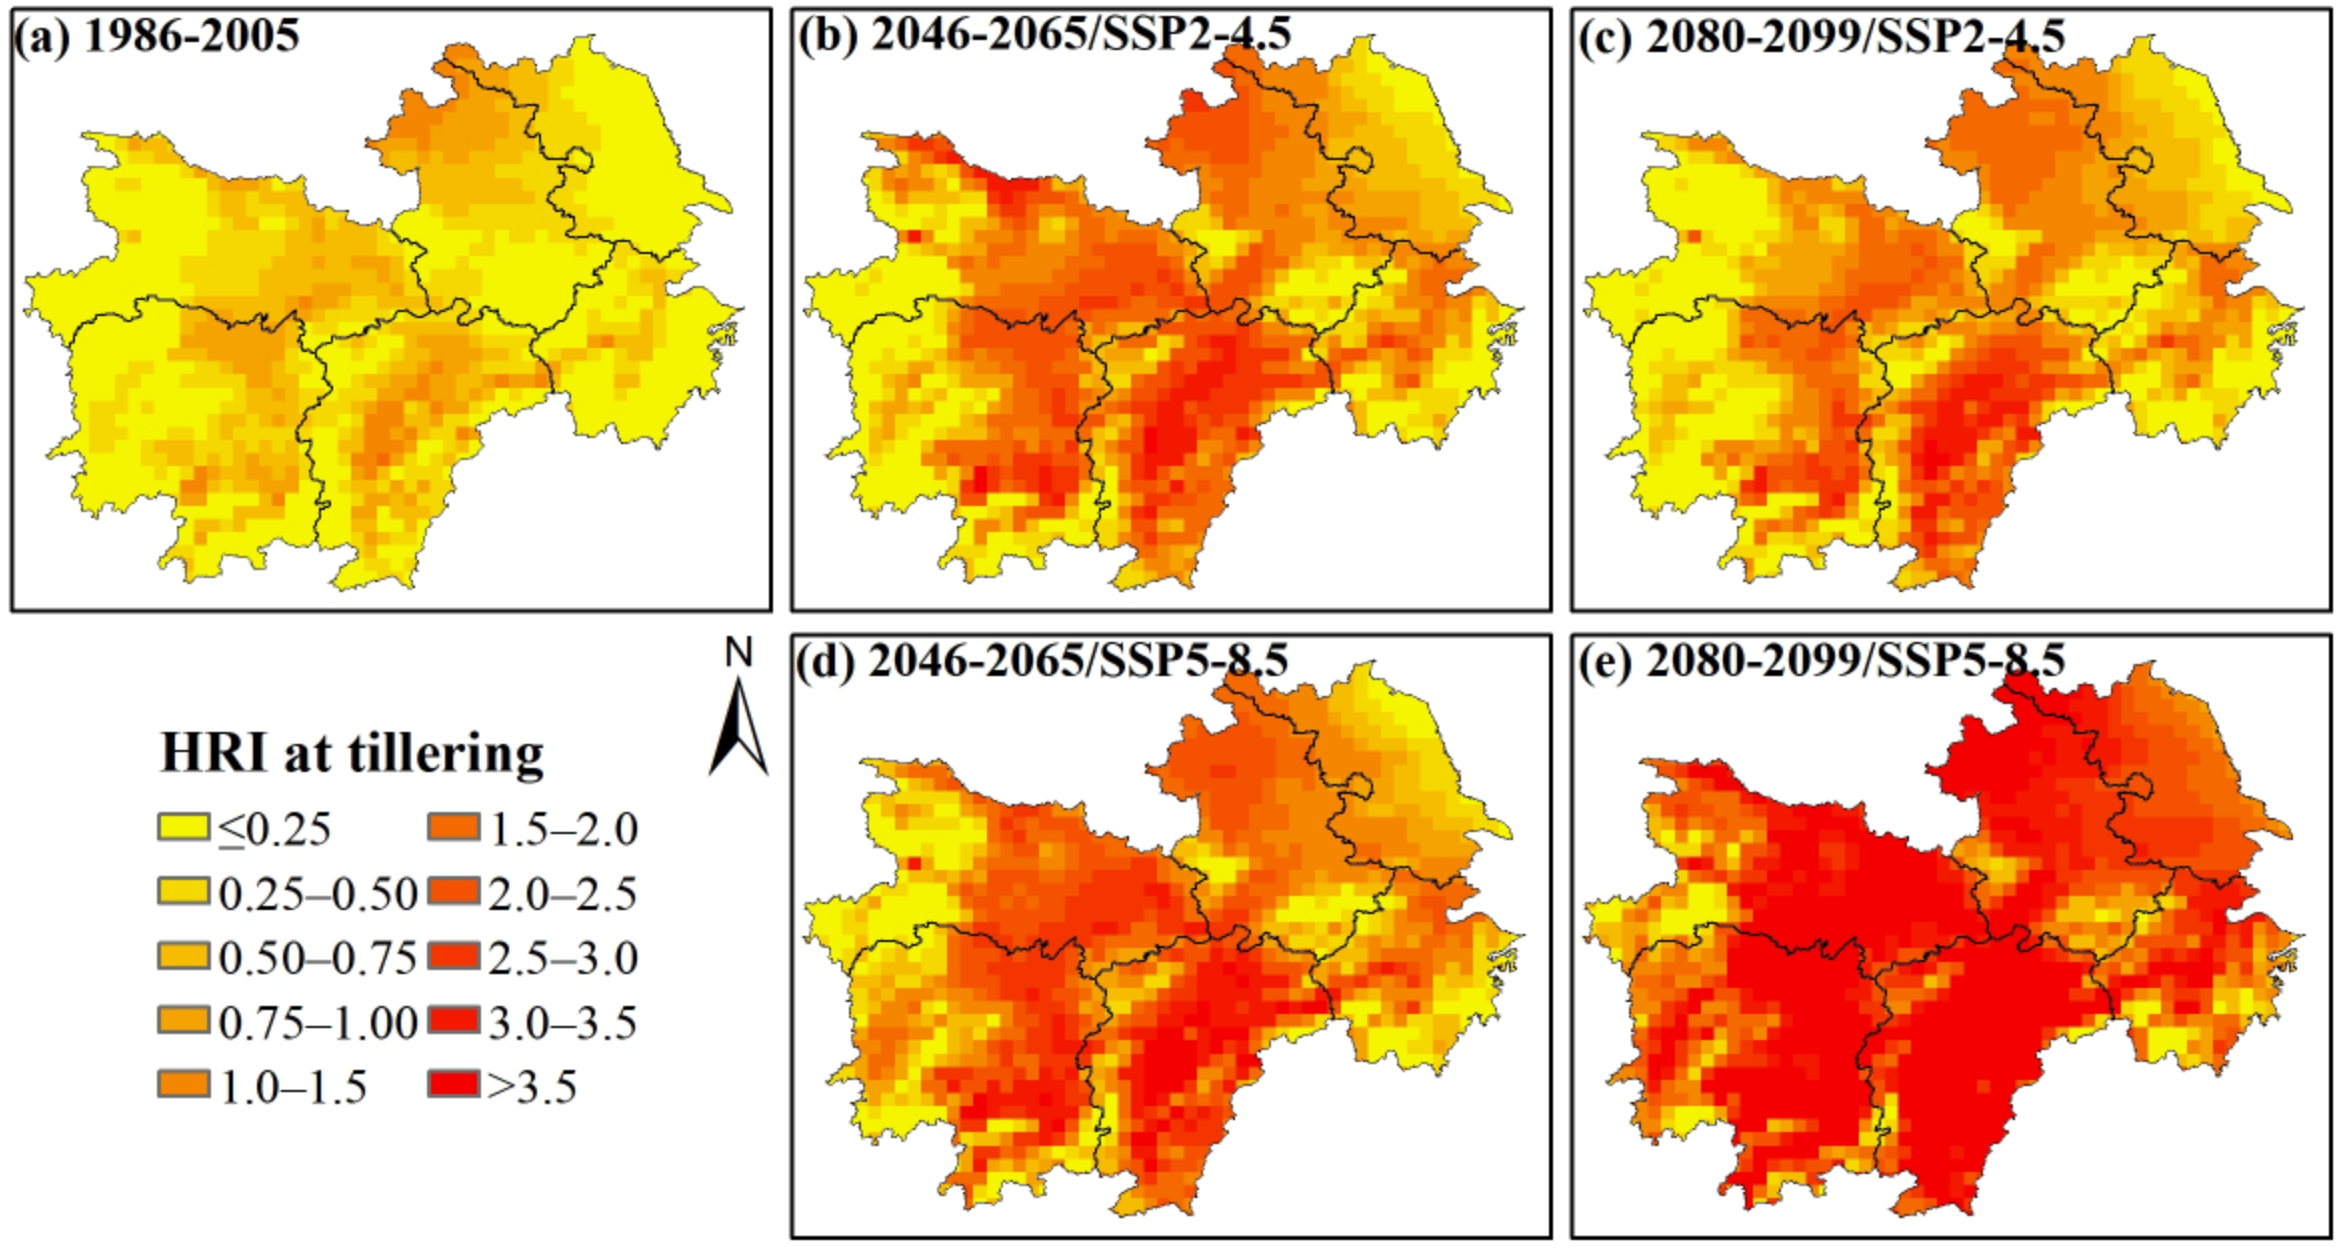
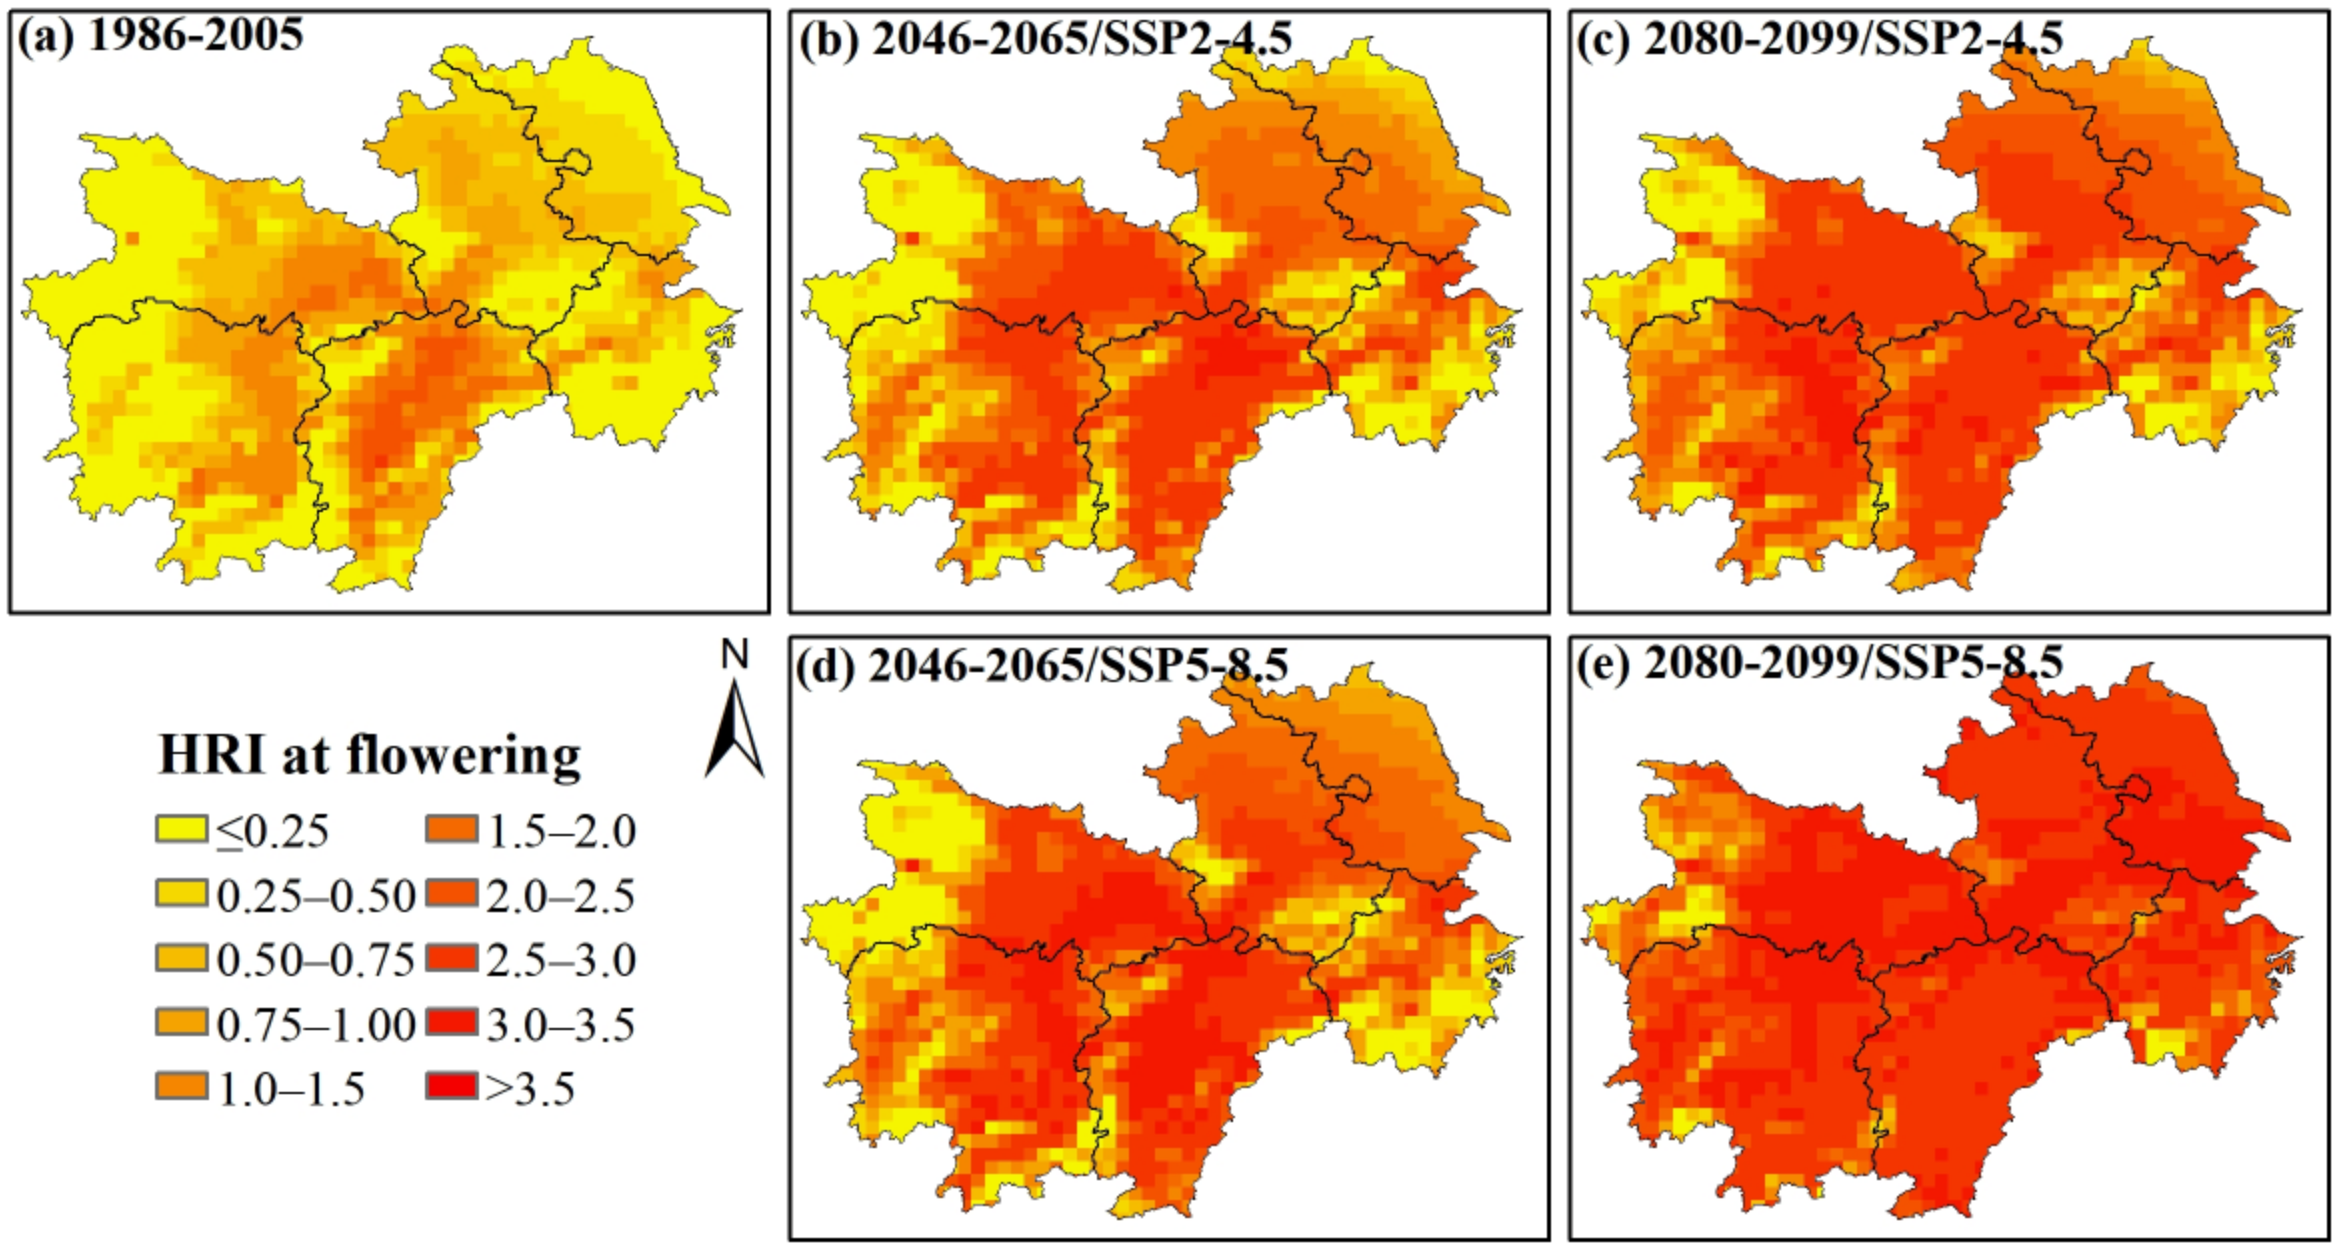
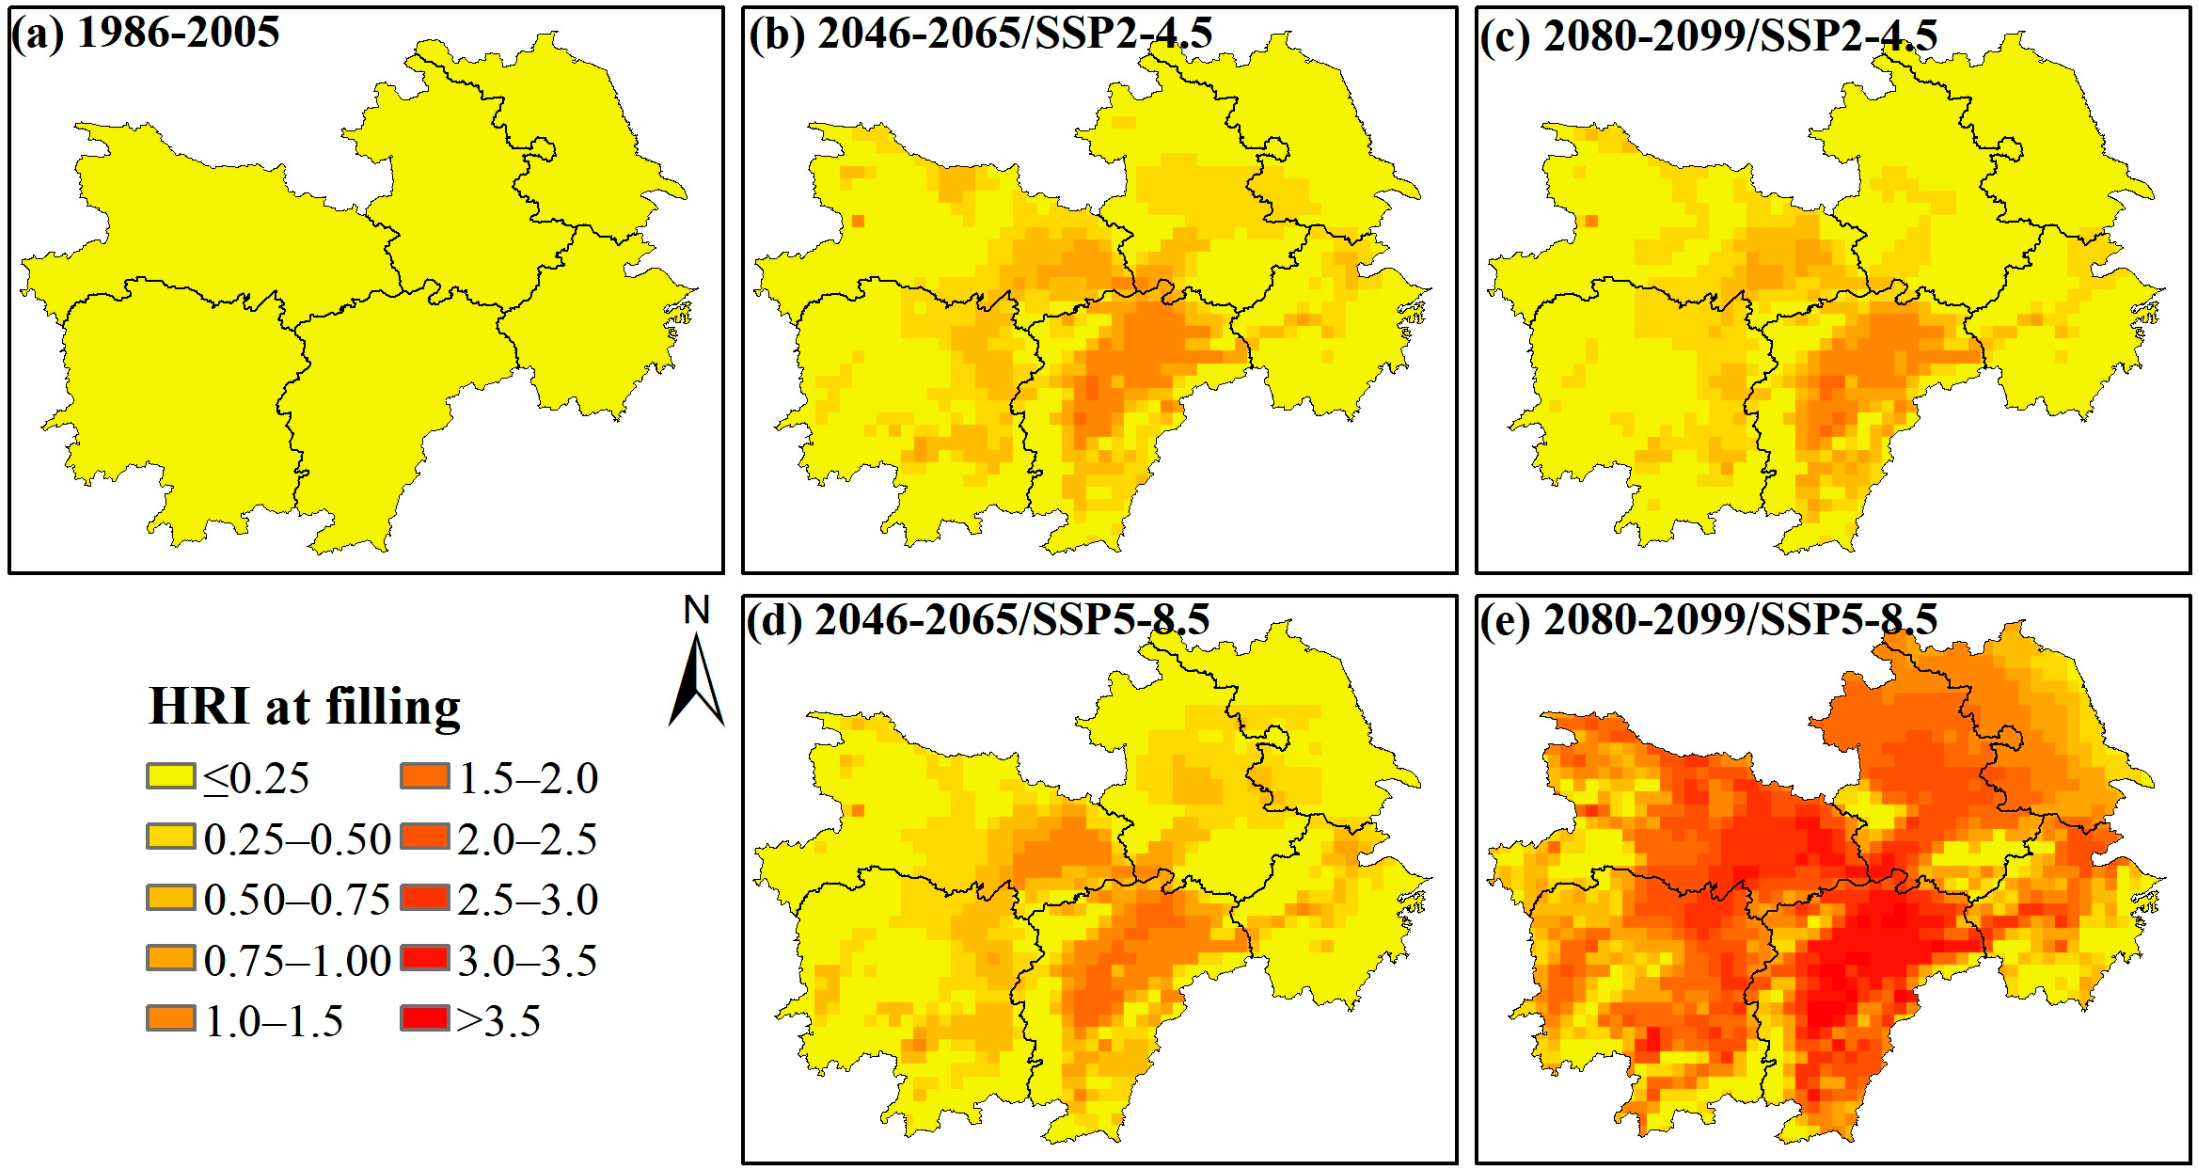
Here, we explored the heat risk index (HRI) of single-season rice across the region for three different periods (historical baseline: 1986–2005, mid-twenty-first century: 2046–2065, and end of the twenty-first century: 2080–2099), integrating the heat catastrophe-grade indicators and climate scenario data. The temporal-spatial characteristics differences were substantially obvious and varied with rice growth. In terms of the rice heat risk at tillering (Figure 4), HRIs at most grids (1986–2005) were generally less than 1.5, with slight advances in eastern Hubei, eastern Hunan, central Jiangxi, and northern Anhui. Relative to 2046–2065, a modest decrease was detected at the regional scale during 2080–2099 under SSP2-4.5, yet the overall intensity and scope of heat risk were significantly increased in contrast with those from 1986 to 2005 (HRIs ranging from 2.5 to 3.5). Under SSP5-8.5, high-risk areas (HRIs exceeding 2.5) were mainly concentrated in the central part of the study region (i.e., eastern Hubei, eastern Hunan, central Jiangxi, northern Anhui, and central Zhejiang), whereas it was expected that heat risk at tillering for single-season rice would increase significantly over time. The occurrence range and spatial distribution of RHIs at booting exhibited consistent characteristics compared with those at flowering over the study period (Figure 5 and Figure 6). As shown, high-risk zones at booting and flowering presented a general agreement with the tillering stage at the end of the twenty-first century under SSP5-8.5, but the intensity and extent of future heat risk were greater at booting and flowering. Likewise, a similar enlargement of projected HRIs occurred through the period of 2080–2099 relative to 2046–2065 under SSPs. The risk of extreme heat exposure per grid at filling, as described in Figure 7, was relatively low (all HRIs < 0.25) during 1986–2005. The HRIs in the central parts for 2046–2065 and 2080–2099 under SSP2-4.5 as well as 2046–2065 under SSP5-8.5 illustrated an upward trend compared to baseline risk. Up to the end of the twenty-first century under SSP5-8.5, heat risk across MLRYR increased sharply, with high RHIs (ranging from 2.0 to 3.8) mainly in eastern Hubei, northeast Hunan, central Anhui, and most parts of Jiangxi. Especially in eastern Jiangsu and southern Zhejiang, heat risk would progressively shift from low to mid-high, which was observed in the first three growth stages. Overall, except for the western and eastern parts of the study area, most MLRYR were hot spots prone to heat stress with the highest frequency and highest potential to single-season rice.

4. Discussion

4.1. Utilization of Rice Heat Evaluation Level

Extremely hot weather is expected to occur more frequently in the future than before, leading to a sharp decrease in rice yield in particular [56]. The underestimation of heat exposure would overestimate future rice production, thus affecting global food security [38]. However, previous reports on rice heat evaluation primarily focused on the changes in the daytime temperature [39,43,57], which ignored the disaster-causing intensity in response to fluctuating relative humidity and increasing night-time temperature. Generally, in MLRYR, daytime heat waves incorporating night-time high temperature (CohotES) appeared simultaneously, which resulted in abnormal heat exposure lasting until night. Even worse, it attacked crucial phenology phases for single-season rice across the study region. As proposed in the extensive statements [58,59], increased night-time temperature had a more significant effect on grain yield formation than daytime temperature because a higher night-time temperature (>25 °C) at filling would promote the dark respiration rate and thus reduce grain weight. Our results solved the above issues and proposed one statistical method that would be capable of dynamically evaluating heat levels. To some extent, this method avoids the shortcomings of most process-based crop models that cannot capture the effect of extreme heat events [60]. Additionally, the concepts of dry heat and wet heat were introduced by the relative humidity of 60% and 80% as the divisional boundary. Historical heat samples with relative humidity between 60% and 80% were denoted as a relatively suitable state (medium heat), which was mentioned as the optimum relative humidity for rice cultivation in the previous research [61]. These statements proved the justifiability of sample classification and the viability of exploring how to affect heat intensity through different combinations of temperature and humidity.
Historical agro-disaster representations, Fisher discriminant analysis, and Kappa coefficient were selected in this work to gain rice heat intensity substantially influenced by daytime heat accumulation, relative humidity, and night-time temperature over a hot weather process to construct a heat evaluation level cooperatively expressed as heat duration and process-accumulated HCIId. Compared with wet heat, relative humidity confirmed the opposite effect on disaster-causing intensity under dry heat. When relative humidity was less than 60% (dry heat), the disaster-causing probability of rice heat became more significant with increasing daytime temperatures and decreasing relative humidity. For one reason, high temperature and low humidity would tend to cause a higher vapor pressure deficit and drive faster transpiration rates, leading to water reduction in the plant [1]. The degree of plant exposure to water stress was enhanced to a great extent, exacerbating heat exposure to plant physiological functions. Although increased transpiration can reduce rice canopy temperature [29,30,31,62], this kind of compensation effect was still offset by the adverse effects of heat stress and plant water loss. Secondly, the decrease in the mucus of the pistil stigma under high temperature and low humidity made it another reason for rice disaster aggravation because pollination and fertilization significantly impacted by reducing the number of stigma pollen and the germination rate of pollen [30]. For a relative humidity of more than 80% (wet heat), the disaster-causing probability of rice heat became more significant with increasing temperature and relative humidity. It was reported that almost complete grain sterility was induced by a relative humidity of 85~90% under heat stress (35 °C day/30 °C night) during post-anthesis [63]. Otherwise, panicle temperature under humid conditions can exceed air temperature by 4 °C [64], exacerbating the rice heat level. By virtue of increased panicle and canopy temperature under wet heat, the grain filling rate of rice slowed down, eventually increasing the proportion of chalky kernels and depressing the total grain number [65,66]. Similar to wet heat, relative humidity under medium heat (60~80%) for different stages of rice development acquired a positive response mechanism. Generally, it was accepted that increased humidity (>60%) under heat exposure could lead to a decreased breathing rate, which reduced the cooling effect on spikelet temperature and ultimately exacerbated rice heat risk [32].
Night-time temperature had a positive contribution to rice heat stress under three types of heat exposure (Formula (7)), implying that disaster-causing intensity increased with increasing night-time temperature, which is consistent with previous findings that higher night-time temperatures significantly reduced rice yield [16,67,68,69]. High night-time temperatures would cause more severe yield losses than high daytime temperatures [16,70]. This might be related to the variety of rice. For example, Shi et al. [71] reported the opposite conclusion for high night-time temperatures due to the dynamic compensation of a higher grain-filling rate and a shortened grain-filling duration. Simultaneously, high temperature at night aggravated the formation of chalky grains, which seriously affected rice quality [72,73]. It was worth noting that night-time temperature had no significance in the construction of the critical line for dry heat at tillering. The main reason for the result might be the insignificant increase in night-time temperature in MLRYR. On the other hand, anomalously high night-time temperatures tended to occur under humid atmospheric conditions, whereas relatively low humidity was prone to high daytime temperatures without sustained heat into the night [74,75].
Given the existing statements and discrimination performance regarding disaster-causing factors in the heat response mechanism, it was reflected that HCIId directed by daytime heat accumulation, relative humidity, and night-time temperature could exhibit availability as a measure of heat intensity for single-season rice in MLRYR. The comprehensive index, based on instantaneous and accessible meteorological predictors, had important application value for predicting the intensity, scope, and loss of heat disasters in advance, as well as disaster prevention and mitigation. Moreover, catastrophe-grade indicators of heat disaster, based on heat duration and cumulative HCIId, could be an easily applied tool in the dynamic assessment of disaster-causing intensity, revealing that with a similar HCIId, longer duration caused relatively severe impacts of heat damage compared to shorter duration. The reserved 20% of independent samples were conducted to validate the evaluation performance. The verification accuracies (Error = 0, Figure 3) were 80.4% at tillering, 81.4% at booting, 79.7% at flowering, and 84.4% at tilling, respectively. It was evident that the evaluation indicators proposed in this study were robust and reliable in identifying heat exposure levels at crucial phenology phases in MLRYR. Of course, rice production is susceptible to various climatic disasters, i.e., continuous rainfall, rainstorms, drought, and some biological factors such as pests and pathogens. Long-term hot weather tends to induce drought. These variables can cause an inevitable bias in the identification results of disaster grades.

4.2. Explanation of Variable Heat Risk Projection

Along with global warming, risk assessment is the basis for protection against extreme heat stress and planting management. HRI was able to combine different levels of heat intensity and heat occurrence probability into one index to quantify regional heat risk. Given limited disaster samples for disaster probability analysis., conventional distribution functions such as Normal, Beta, Gamma, Generalized Extreme Value and Lognormal make it hard to satisfy distribution fitting [76]. Thus, it is necessary to choose a distribution fitting method with low sample size requirements to replace conventional distribution functions. Information diffusion is for set-valued optimization of sample values, thereby making up for insufficient sample information and effectively extracting and spreading small sequence sample information to the entire evaluation sequence. This method has been proven and applied in disaster risk assessment [41,77]. It is also acceptable to choose other existing approaches if sufficient data are available, such as copula functions, bivariable and multivariate probabilistic estimates, for longer data series would benefit the distribution fitting of variables [78].
As observed in existing facts, high risk was mainly found in eastern Hubei, eastern Hunan, and central Jiangxi, with low risk located in the coastal areas of Jiangsu and Zhejiang [49]. By virtue of the stronger Western Pacific monsoon than inland, frequent summer precipitation could lead to significant cooling effects in the low-risk zone, limiting the continuity of extreme heat events. The above conclusions were generally consistent with the results of 1986–2005 in our work, with some inevitable differences due to various statistical periods and heat evaluation indicators. In terms of heat risk assessment in the future, previous research reported that heat exposure to single-season rice would be more obvious with increased intensity [42,57,79], especially in the central part of MLRYR [4,80]. Risk projection characteristics would be likely to vary with different growth stages. The period of the significant increase in projected heat risk would correspond to the period from booting to milk maturity. Furthermore, the risk intensity of heat exposure would be greater at the end of the twenty-first century as the radiative forcing increased [49]. In our present work, rice heat under two SSPs from tillering to flowering was more serious in the central part of MLRYR, as heat risk increased significantly over time. The exception was the filling stage, where rice risk would reach an analogous enhancement from 2080 to 2099 under SSP5-8.5. The period of booting and flowering for single-season rice, as higher risk stages, corresponded well with the temporal distribution of hot weather, resulting in a severe rice heat level in such regions. For the decision-making department and management, the projected results of heat exposure would be the references for future adaptive options to reduce regional heat disaster risk. It was worth noting that the manifestation of heat risk might diverge significantly according to regional conditions and the specific rice varieties cultivated. Although the constructed risk index for rice heat might not have the best application in some specific regions, these thresholds could be practical in regions with the same latitude and with similar rice varieties. Of course, the application of such a risk index should be further explored in other climatic regions, as well as optimizing the regionalization of finer indices down to provinces.

4.3. Uncertainties and Limitations

Although the future heat risk to single-season rice is expected to intensify significantly in MLRYR, there are still areas of concern that need to be focused on at different growth stages and research periods. Therefore, it is necessary to carry out corresponding prevention and management measures for the potential characteristics of heat risk during different occurrence phases [52,81]. Several potential adaptation strategies, such as appropriately optimizing the planting layout for single-season rice, adjusting the optimal sowing period, and strengthening the maturity mix, can be effective approaches to mitigate future heat stress. Moreover, two evaluation methods of daily-scale heat intensity and heat-process catastrophe grade created for single-season rice in our present study performed well in this region. It is suggested as a new tool for assessing the impact of regional extreme climate change on crop production, and after debugging and verification, can be widely applied in other regions that attract akin analysis. However, given some assumptions in our present work, some uncertainties and limitations should be highlighted. First, the robustness of the heat evaluation level is based on the accuracy of the initial construction of heat and non-heat samples for single-season rice at different growth stages. It is accepted that the use of historical disaster representation to artificially construct sample sets could be subjectivity-based, which causes inevitable default bias. In the near future, we could conduct field experiments under different temperature–humidity conditions to verify the reliability of heat evaluation levels at the region scale at a unique phenological phase. Furthermore, the disaster grade of rice heat exposure is susceptible to pests and pathogens, cultivation management practices, and drought. High temperature combined with drought can cause more severe heat. Generally, dry heat is conducive to reproducing drought-loving pests such as aphids, while wet heat is prone to sheath blight. Meanwhile, several meteorological factors, i.e., sunshine, rainfall, wind speed, and CO2 that might aggravate or alleviate rice heat were not taken into account in the construction of the comprehensive intensity index due to unclear impact mechanisms yet. It may be generally recognized that climate warming will accelerate crop growth and shorten future phenological phases [82]. It is estimated that a 1 °C warming will shorten the flowering time of rice by 4 d [60,83]. Especially in heat events at flowering and filling, an accelerated grain filling rate may lead to crop premature aging and high temperature forced ripening. The variability of high temperature (shortened phenology and forced ripening) was not taken into account in estimating the heat risk under future climate scenarios, with a particular bias in the prediction results. Another source of uncertainty came from unreliable climate projection models. In addition, the combination effects of heat exposure in more than one stage will cause more yield losses [68,84]. However, the mechanism of combined heat exposure in multiple stages still needs further exploration.

5. Conclusions

As a major rice-producing area in China, the production level of the MLRYR is particularly sensitive to extreme heat events. However, existing assessment tools (crop models and statistical models) are unable to accurately quantify the effect of heat exposure due to their own uncertainties or incomplete consideration of the disaster-causing factors. Our study determined the influence of temperature and humidity variations on the in-tensity of heat stress by exploring various occurrence conditions between H-d and NH-d samples based on Fisher discriminant analysis. Our findings reveal that under dry heat conditions (RH ≤ 60%), the probability of heat disaster-causing increased with the increase in Tcum, Tmin, and the decrease in RH. In the context of medium and wet heat conditions (RH > 60%), the probability of heat disaster-causing increased with the increase in Tcum, Tmin, and RH. Then, the composite intensity index and catastrophe-grade indicators for rice heat were constructed with ideal performance to analyze the potential risk of heat exposure at different growth stages for single-season rice in MLRYR under future climate scenarios. The projection results of HRI explicitly revealed that future heat risk would reach its maximum at booting and flowering, followed by the tillering stage, and its minimum at filling. The increasing characteristics of rice heat risk would be more obvious under SSP5-8.5 rather than SSP2-4.5. Eastern Hubei, eastern Hunan, most of Jiangxi, and northern Anhui were hot spots prone to heat exposure. Overall, single-season rice would experience more serious exposure to heat stress in the future due to climate warming. The findings in our study can better assist in the avoidance of rice heat risk to address climate change and ensure rice production security, thus making it more regionally practical and applicable.

Author Contributions

Conceptualization, M.J. and Z.H.; methodology, M.J., Z.H. and M.L.; validation: Z.H., F.Z. and R.K.; formal analysis, M.L. and Q.M.; software, M.J. and Q.M.; data curation, M.J. and L.Z.; visualization, M.J. and R.K.; writing—original draft preparation, M.J. and Z.H.; writing—review and editing, M.J., F.Z. and L.Z.; supervision, Z.H., L.Z. and F.Z.; funding acquisition, Z.H. All authors have read and agreed to the published version of the manuscript.

Funding

This study is supported by the Science and Technology Development Foundation of the Chinese Academy of Meteorological Sciences (2023KJ024) and the Basic Research Fund of Chinese Academy of Meteorological Sciences (2024Z001).

Data Availability Statement

The raw data supporting the conclusions of this article will be made available by the authors on request.

Conflicts of Interest

The authors declare no conflicts of interest.

References

  1. Lobell, D.B.; Hammer, G.L.; McLean, G.; Messina, C.; Roberts, M.J.; Schlenker, W. The critical role of extreme heat for maize production in the United States. Nat. Clim. Chang. 2013, 3, 497–501. [Google Scholar] [CrossRef]
  2. Morice, C.P.; Kennedy, J.J.; Rayner, N.A.; Winn, J.P.; Hogan, E.; Killick, R.E.; Dunn, R.J.H.; Osborn, T.J.; Jones, P.D.; Simpson, I.R. An updated assessment of near-surface temperature change From 1850: The HadCRUT5 data set. J. Geophys. Res. Atmos. 2021, 126, e2019JD032361. [Google Scholar] [CrossRef]
  3. Zhao, C.; Liu, B.; Piao, S.; Wang, X.; Lobell, D.B.; Huang, Y.; Huang, M.; Yao, Y.; Bassu, S.; Ciais, P.; et al. Temperature increase reduces global yields of major crops in four independent estimates. Proc. Natl. Acad. Sci. USA 2017, 114, 9326–9331. [Google Scholar] [CrossRef]
  4. Zhang, L.; Yang, B.; Li, S.; Hou, Y.; Huang, D. Potential rice exposure to heat stress along the Yangtze River in China under RCP8.5 scenario. Agric. For. Meteorol. 2018, 248, 185–196. [Google Scholar] [CrossRef]
  5. Ishimaru, T.; Seefong, X.; Nallathambid, J.; Rajendrand, S. Quantifying rice spikelet sterility in potential heat-vulnerable regions Field surveys in Laos and southern India. Field Crop. Res. 2016, 190, 3–9. [Google Scholar] [CrossRef]
  6. Wassmann, R.; Jagadish, S.V.K.; Sumfleth, K.; Ismail, A.; Redona, E.; Serraj, R.; Singh, R.K.; Howell, G.; Pathak, H. Regional vulnerability of climate change impacts on Asian rice production and scope for adaptation. Adv. Agron. 2009, 102, 59–122. [Google Scholar]
  7. You, Q.; Jiang, Z.; Kong, L.; Wu, Z.; Bao, Y.; Kang, S.; Pepin, N. A comparison of heat wave climatologies and trends in China based on multiple definitions. Clim. Dyn. 2016, 48, 3975–3989. [Google Scholar] [CrossRef]
  8. Li, N.; Xiao, Z.; Zhao, L. A recent increase in long-lived heatwaves in China under the joint influence of south Asia and western north Pacific subtropical highs. J. Clim. 2021, 38, 7167–7179. [Google Scholar] [CrossRef]
  9. Tao, F.; Zhang, S.; Zhang, Z. Changes in rice disasters across China in recent decades and the meteorological and agronomic causes. Reg. Environ. Chang. 2012, 13, 743–759. [Google Scholar] [CrossRef]
  10. Wang, P.; Zhang, Z.; Chen, Y.; Wei, X.; Feng, B.; Tao, F. How much yield loss has been caused by extreme temperature stress to the irrigated rice production in China? Clim. Chang. 2015, 134, 635–650. [Google Scholar] [CrossRef]
  11. Laborte, A.; Nelson, A.; Jagadish, K.; Aunario, K.J.; Sparks, A.; Ye, C.-R.; Redoña, E. Rice feels the heat. Rice Today 2012, 11, 30–31. [Google Scholar]
  12. Chen, Y.; Li, Y. An Inter-comparison of three heat wave types in China during 1961–2010: Observed basic features and linear trends. Sci. Rep. 2017, 7, 45619. [Google Scholar] [CrossRef]
  13. Chen, Y.; Zhai, P. Revisiting summertime hot extremes in China during 1961–2015: Overlooked compound extremes and significant changes. Geophys. Res. Lett. 2017, 44, 5096–5103. [Google Scholar] [CrossRef]
  14. Li, R.-X.; Sun, J.-Q. Interdecadal variability of the large-scale extreme hot event frequency over the middle and lower reaches of the Yangtze River basin and its related atmospheric patterns. Atmos. Ocean. Sci. Lett. 2017, 11, 63–70. [Google Scholar] [CrossRef]
  15. Li, Y.; Ding, Y.; Liu, Y. Mechanisms for regional compound hot extremes in the mid-lower reaches of the Yangtze River. Int. J. Climatol. 2020, 41, 1292–1304. [Google Scholar] [CrossRef]
  16. Mohammed, A.R.; Tarpley, L. High night-time temperatures affect rice productivity through altered pollen germination and spikelet fertility. Agric. For. Meteorol. 2009, 149, 999–1008. [Google Scholar] [CrossRef]
  17. Mohammed, A.R.; Tarpley, L. Impact of high night-time temperature on respiration, membrane stability, antioxidant capacity, and yield of rice plants. Crop Sci. 2009, 49, 313–322. [Google Scholar] [CrossRef]
  18. Nagarajan, S.; Jagadish, S.V.K.; Prasad, A.S.H.; Thomar, A.K.; Anand, A.; Pal, M.; Agarwal, P.K. Local climate affects growth, yield and grain quality of aromatic and non-aromatic rice in northwestern India. Agric. Ecosyst. Environ. 2010, 138, 274–281. [Google Scholar] [CrossRef]
  19. Coast, O.; Ellis, R.H.; Murdoch, A.J.; Quiñones, C.; Jagadish, K.S.V. High night temperature induces contrasting responses for spikelet fertility, spikelet tissue temperature, flowering characteristics and grain quality in rice. Funct. Plant Biol. 2015, 42, 149–161. [Google Scholar] [CrossRef]
  20. García, G.A.; Dreccer, M.F.; Miralles, D.J.; Serrago, R.A. High night temperatures during grain number determination reduce wheat and barley grain yield: A field study. Glob. Chang. Biol. 2015, 21, 4153–4164. [Google Scholar] [CrossRef]
  21. Reynolds, M.P.; Quilligan, E.; Aggarwal, P.K.; Bansal, K.C.; Cavalieri, A.J.; Chapman, S.C.; Chapotin, S.M.; Datta, S.K.; Duveiller, E.; Gill, K.S.; et al. An integrated approach to maintaining cereal productivity under climate change. Glob. Food Secur. 2016, 8, 9–18. [Google Scholar] [CrossRef]
  22. Lawas, L.M.F.; Shi, W.; Yoshimoto, M.; Hasegawa, T.; Hincha, D.K.; Zuther, E.; Jagadish, S.V.K. Combined drought and heat stress impact during flowering and grain filling in contrasting rice cultivars grown under field conditions. Field Crops Res. 2018, 229, 66–77. [Google Scholar] [CrossRef]
  23. Jagadish, S.V.; Muthurajan, R.; Oane, R.; Wheeler, T.R.; Heuer, S.; Bennett, J.; Craufurd, P.Q. Physiological and proteomic approaches to address heat tolerance during anthesis in rice (Oryza sativa L.). J. Exp. Bot. 2010, 61, 143–156. [Google Scholar] [CrossRef] [PubMed]
  24. Chen, J.; Xu, Y.; Fei, K.; Wang, R.; He, J.; Fu, L.; Shao, S.; Li, K.; Zhu, K.; Zhang, W.; et al. Physiological mechanism underlying the effect of high temperature during anthesis on spikelet-opening of photo-thermo-sensitive genic male sterile rice lines. Sci. Rep. 2020, 10, 2210. [Google Scholar] [CrossRef] [PubMed]
  25. Kanno, K.; Mae, T.; Makino, A. High night temperature stimulates photosynthesis, biomass production and growth during the vegetative stage of rice plants. Soil Sci. Plant Nutr. 2009, 55, 124–131. [Google Scholar] [CrossRef]
  26. Sadok, W.; Jagadish, S.V.K. The Hidden Costs of Night-time Warming on Yields. Trends Plant Sci. 2020, 25, 644–651. [Google Scholar] [CrossRef] [PubMed]
  27. Peraudeau, S.; Roques, S.; Quiñones, C.O.; Fabre, D.; Van Rie, J.; Ouwerkerk, P.B.F.; Jagadish, K.S.V.; Dingkuhn, M.; Lafarge, T. Increase in night temperature in rice enhances respiration rate without significant impact on biomass accumulation. Field Crops Res. 2015, 171, 67–78. [Google Scholar] [CrossRef]
  28. Zhang, Y.; Lou, Y.; Zhu, H.; Zhao, S. Impacts of night warming on rice growth, physiological properties and yield components. Chin. J. Agrometeorol. 2017, 38, 88–95. Available online: http://journals.caass.org.cn/zgnyqx/CN/Y2017/V38/I02/88/ (accessed on 1 February 2024).
  29. Yan, C.; Ding, Y.; Wang, Q.; Liu, Z.; Li, G.; Muhammad, I.; Wang, S. The impact of relative humidity, genotypes and fertilizer application rates on panicle, leaf temperature, fertility and seed setting of rice. J. Agric. Sci. 2010, 148, 329–339. [Google Scholar] [CrossRef]
  30. Weerakoon, W.M.W.; Maruyama, A.; Ohba, K. Impact of humidity on temperature-induced grain sterility in rice (Oryza sativa L). J. Agron. Crop Sci. 2008, 194, 135–140. [Google Scholar] [CrossRef]
  31. Matsui, T.; Kobayasi, K.; Yoshimoto, M.; Hasegawa, T. Stability of rice pollination in the field under hot and dry conditions in the Riverina region of New South Wales, Australia. Plant Prod. Sci. 2007, 10, 57–63. [Google Scholar] [CrossRef]
  32. Rehmani, M.I.A.; Ding, C.; Li, G.; Ata-Ul-Karim, S.T.; Hadifa, A.; Bashir, M.A.; Hashem, M.; Alamri, S.; Al-Zubair, F.; Ding, Y. Vulnerability of rice production to temperature extremes during rice reproductive stage in Yangtze River Valley, China. J. King Saud Univ. Sci. 2021, 33, 101599. [Google Scholar] [CrossRef]
  33. Lobell, D.B.; Asseng, S. Comparing estimates of climate change impacts from process-based and statistical crop models. Environ. Res. Lett. 2017, 12, 15001. Available online: http://iopscience.iop.org/1748-9326/12/1/015001/ (accessed on 1 February 2024). [CrossRef]
  34. Singh, P.K.; Singh, K.K.; Rathore, L.S.; Baxla, A.K.; Bhan, S.C. Rice (Oryza sativa L.) yield gap using the CERES-rice model of climate variability for different agroclimatic zones of India. Res. Commun. 2016, 111, 405–413. [Google Scholar]
  35. Zhou, G.; Liu, X.; Liu, M. Assimilating remote sensing phenological information into the WOFOST model for rice growth simulation. Remote Sens. 2019, 11, 268. [Google Scholar] [CrossRef]
  36. Li, T.; Raman, A.K.; Marcaida, M.; Kumar, A.; Angeles, O.; Radanielson, A.M. Simulation of genotype performances across a larger number of environments for rice breeding using ORYZA2000. Field Crops Res. 2013, 149, 312–321. [Google Scholar] [CrossRef]
  37. Schewe, J.; Gosling, S.N.; Reyer, C.; Zhao, F.; Ciais, P.; Elliott, J.; Francois, L.; Huber, V.; Lotze, H.K.; Seneviratne, S.I.; et al. State-of-the-art global models underestimate impacts from climate extremes. Nat. Commun. 2019, 10, 1005. [Google Scholar] [CrossRef] [PubMed]
  38. Sun, Q.; Zhao, Y.; Zhang, Y.; Che, X.; Yang, Z.; Song, Y.; Zheng, X. Improvement of the CERES-Rice model using controlled experiments and a Meta-analysis. Theor. Appl. Climatol. 2020, 141, 1271–1284. [Google Scholar] [CrossRef]
  39. Sun, Q.; Zhao, Y.; Zhang, Y.; Chen, S.; Ying, Q.; Lv, Z.; Che, X.; Wang, D. Heat stress may cause a significant reduction of rice yield in China under future climate scenarios. Sci. Total Environ. 2022, 818, 151746. [Google Scholar] [CrossRef]
  40. Guo, A.; He, L.; Han, L.; Zhang, L. Construction of heat damage intensity index of early rice and its climate risk assessment. J. Nat. Disaster 2018, 27, 96–106. [Google Scholar]
  41. Yang, J.; Huo, Z.; Li, X.; Wang, P.; Wu, D. Hot weather event-based characteristics of double-early rice heat risk: A study of Jiangxi province, South China. Ecol. Indic. 2020, 113, 106148. [Google Scholar] [CrossRef]
  42. Huang, J.; Zhang, F.; Xue, Y.; Lin, J. Recent changes of rice heat stress in Jiangxi province, southeast China. Int. J. Biometeorol. 2016, 61, 623–633. [Google Scholar] [CrossRef] [PubMed]
  43. Teixeira, E.I.; Fischer, G.; van Velthuizen, H.; Walter, C.; Ewert, F. Global hot-spots of heat stress on agricultural crops due to climate change. Agric. For. Meteorol. 2013, 170, 206–215. [Google Scholar] [CrossRef]
  44. China Meteorological Administration. China Meteorological Disaster Yearbook; Meteorological Press: Beijing, China, 2004. [Google Scholar]
  45. Chen, S.X.; Wen, K.G. China Meteorological Disasters Book (Jiangsu, Zhejiang, Anhui, Jiangxi, Hubei and Hunan Provinces); Meteorogogical Press: Beijing, China, 2006. [Google Scholar]
  46. Thrasher, B.; Wang, W.; Michaelis, A.; Melton, F.; Lee, T.; Nemani, R. NASA global daily downscaled projections, CMIP6. Sci. Data 2022, 9, 262. [Google Scholar] [CrossRef]
  47. IPCC. Climate Change 2013: The Physical Science Basis. Contribution of Working Group I to the Fifth Assessment Report of the Intergovernmental Panel on Climate Change; UK, and New York, NY, USA, 2013; Volume in Press. Available online: https://www.ipcc.ch/report/ar5/wg1/ (accessed on 1 February 2024).
  48. Xu, H.; Zhang, G. Comparison of relative and absolute heatwaves in eastern China: Observations, simulations and future projections. Atmosphere 2022, 13, 649. [Google Scholar] [CrossRef]
  49. Zhu, S.; Wang, W.; Ding, Y.; Liu, G. Spatiotemporal variation of future heat damage of rice in the Middle and Lower Reaches of the Yangtze River using CMIP6 projections. Trans. Chin. Soc. Agric. Eng. 2023, 39, 113–122. [Google Scholar] [CrossRef]
  50. Wu, X.; Wang, P.; Huo, Z.; Wu, D.; Yang, J. Crop Drought Identification Index for winter wheat based on evapotranspiration in the Huang-Huai-Hai Plain, China. Agric. Ecosyst. Environ. 2018, 263, 18–30. [Google Scholar] [CrossRef]
  51. Jiang, M.; Huo, Z.; Zhang, L.; Kong, R.; Li, M.; Mi, Q. Characteristic Identification of Heat Exposure Based on Disaster Events for Single-Season Rice along the Middle and Lower Reaches of the Yangtze River, China. Agronomy 2023, 13, 2574. [Google Scholar] [CrossRef]
  52. Shah, F.; Huang, J.; Cui, K.; Nie, L.; Shah, T.; Chen, C.; Wang, K. Impact of high-temperature stress on rice plant and its traits related to tolerance. J. Agric. Sci. 2011, 149, 545–556. [Google Scholar] [CrossRef]
  53. Lopez-Granados, F.; Pena-Barragan, J.M.; Jurado-Exposito, M.; Francisco-Fernandez, M. Multispectral classification of grass weeds and wheat (Triticum durum) using linear and nonparametric functional discriminant analysis and neural networks. Weed Res. 2008, 48, 28–37. [Google Scholar] [CrossRef]
  54. Prabhakar, M.; Gopinath, K.A.; Reddy, A.G.K.; Thirupathi, M.; Rao, C.S. Mapping hailstorm damaged crop area using multispectral satellite data. Egypt. J. Remote Sens. Space Sci. 2019, 22, 73–79. [Google Scholar] [CrossRef]
  55. Huang, C. Information diffusion techniques and small sample problem. Int. J. Inf. Technol. Decis. Mak. 2002, 1, 229–249. [Google Scholar] [CrossRef]
  56. Rezaei, E.E.; Webber, H.; Gaiser, T.; Naab, J.; Ewert, F. Heat stress in cereals: Mechanisms and modelling. Eur. J. Agron. 2015, 64, 98–113. [Google Scholar] [CrossRef]
  57. Zhang, Z.; Chen, Y.; Wang, C.; Wang, P.; Tao, F. Future extreme temperature and its impact on rice yield in China. Int. J. Climatol. 2017, 37, 4814–4827. [Google Scholar] [CrossRef]
  58. Cheng, W.; Sakai, H.; Yagi, K.; Hasegawa, T. Interactions of elevated [CO2] and night temperature on rice growth and yield. Agric. For. Meteorol. 2009, 149, 51–58. [Google Scholar] [CrossRef]
  59. Laza, M.R.C.; Sakai, H.; Cheng, W.; Tokida, T.; Peng, S.; Hasegawa, T. Differential response of rice plants to high night temperatures imposed at varying developmental phases. Agric. For. Meteorol. 2015, 209–210, 69–77. [Google Scholar] [CrossRef]
  60. Gourdji, S.M.; Sibley, A.M.; Lobell, D.B. Global crop exposure to critical high temperatures in the reproductive period: Historical trends and future projections. Environ. Res. Lett. 2013, 8, 024041. [Google Scholar] [CrossRef]
  61. Rathnayake, W.M.U.K.; De Silva, R.P.; Dayawansa, N.D.K. Assessment of the suitability of temperature and relative humidity for rice cultivation in rainfed lowland paddy fields in Kurunegala district. Trop. Agric. Res. 2016, 27, 370–388. [Google Scholar] [CrossRef]
  62. Wassmann, R.; Dobermann, A. Climate change adaptation through rice production in regions with high poverty levels. J. SAT Agric. Res. 2007, 4, 1–24. [Google Scholar]
  63. Abeysiriwardena, D.S.; Ohba, K.; Maruyama, A. Influence of temperature and relative humidity on grain sterility in rice. J. Natl. Sci. Found. Sri Lanka 2002, 30, 33–41. [Google Scholar] [CrossRef]
  64. Tian, X.; Matsui, T.; Li, S.; Yoshimoto, M. Heat induced floret sterility of hybrid rice (Oryza sativa L.) cultivars under humid and low wind conditions in the field of Jianghan Basin, China. Plant Prod. Sci. 2010, 13, 243–251. [Google Scholar] [CrossRef]
  65. Lobell, D.B.; Gourdji, S.M. The influence of climate change on global crop productivity. Plant Physiol. 2012, 160, 1686–1697. [Google Scholar] [CrossRef]
  66. Nelson, J.C.; Lyman, N.B.; Jagadish, K.S.V.; Nalley, L.L.; Dixon, B.L.; Siebenmorgen, T. Neglecting rice milling yield and quality underestimates economic losses from high-temperature stress. PLoS ONE 2013, 8, e72157. [Google Scholar] [CrossRef]
  67. Ambardekar, A.A.; Siebenmorgen, T.J.; Counce, P.A.; Lanning, S.B.; Mauromoustakos, A. Impact of field-scale night-time air temperatures during kernel development on rice milling quality. Field Crops Res. 2011, 122, 179–185. [Google Scholar] [CrossRef]
  68. Jagadish, S.V.; Murty, M.V.; Quick, W.P. Rice responses to rising temperatures-challenges, perspectives and future directions. Plant Cell Environ. 2015, 38, 1686–1698. [Google Scholar] [CrossRef]
  69. Xu, J.; Henry, A.; Sreenivasulu, N. Rice yield formation under high day and night temperatures-A prerequisite to ensure future food security. Plant Cell Environ. 2020, 43, 1595–1608. [Google Scholar] [CrossRef]
  70. Su, Q.; Rohila, J.S.; Ranganathan, S.; Karthikeyan, R. Rice yield and quality in response to daytime and night-time temperature increase-A meta-analysis perspective. Sci. Total Environ. 2023, 898, 165256. [Google Scholar] [CrossRef]
  71. Shi, W.; Yin, X.; Struik, P.C.; Solis, C.; Xie, F.; Schmidt, R.C.; Huang, M.; Zou, Y.; Ye, C.; Jagadish, S.V.K. High day- and night-time temperatures affect grain growth dynamics in contrasting rice genotypes. J. Exp. Bot. 2017, 68, 5233–5245. [Google Scholar] [CrossRef]
  72. Counce, P.A.; Bryant, R.J.; Bergman, J.; Bautista, R.C. Rice milling quality, grain dimensions, and starch branching as affected by high night temperatures. Cereal Chem. 2005, 82, 645–648. [Google Scholar] [CrossRef]
  73. Zhao, X.; Fitzgerald, M. Climate change: Implications for the yield of edible rice. PLoS ONE 2013, 8, e66218. [Google Scholar] [CrossRef]
  74. Chen, R.; Lu, R. Dry tropical nights and wet extreme heat in Beijing: Atypical configurations between high temperature and humidity. Mon. Weather Rev. 2014, 142, 1792–1802. [Google Scholar] [CrossRef]
  75. Thomas, N.P.; Bosilovich, M.G.; Marquardt Collow, A.B.; Koster, R.D.; Schubert, S.D.; Dezfuli, A.; Mahanama, S.P. Mechanisms associated with daytime and night-time heat waves over the contiguous United States. J. Appl. Meteorol. Climatol. 2020, 59, 1865–1882. [Google Scholar] [CrossRef]
  76. Zhang, S.; Tao, F.; Zhang, Z. Changes in extreme temperatures and their impacts on rice yields in southern China from 1981 to 2009. Field Crops Res. 2016, 189, 43–50. [Google Scholar] [CrossRef]
  77. Hao, L.; Zhang, X.; Liu, S. Risk assessment to China’s agricultural drought disaster in county unit. Nat. Hazards 2012, 61, 785–801. [Google Scholar] [CrossRef]
  78. Zhang, L.; Yang, B.; Guo, A.; Huang, D.; Huo, Z. Multivariate probabilistic estimates of heat stress for rice across China. Stoch. Environ. Res. Risk Assess. 2018, 32, 3137–3150. [Google Scholar] [CrossRef]
  79. Chen, Y.; Zhang, Z.; Tao, F. Impacts of climate change and climate extremes on major crops productivity in China at a global warming of 1.5 °C & 2.0 °C. Earth Syst. Dyn. 2018, 9, 543–562. [Google Scholar] [CrossRef]
  80. Xiong, W.; Feng, L.; Ju, H.; Yang, D. Possible impacts of high temperatures on China’s rice yield under climate change. Adv. Earth Sci. 2016, 31, 515–528. [Google Scholar]
  81. Julia, C.; Dingkuhn, M. Predicting temperature induced sterility of rice spikelets requires simulation of crop-generated microclimate. Eur. J. Agron. 2013, 49, 50–60. [Google Scholar] [CrossRef]
  82. Kim, J.; Shon, J.; Lee, C.K.; Yang, W.; Yoon, Y.; Yang, W.-H.; Kim, Y.-G.; Lee, B.-W. Relationship between grain filling duration and leaf senescence of temperate rice under high temperature. Field Crop. Res. 2011, 122, 207–213. [Google Scholar] [CrossRef]
  83. Estrella, N.; Sparks, T.H.; Menzel, A. Trends and temperature response in the phenology of crops in Germany. Glob. Chang. Biol. 2007, 13, 1737–1747. [Google Scholar] [CrossRef]
  84. Cheabu, S.; Moung-Ngam, P.; Arikit, S.; Vanavichit, A.; Malumpong, C. Effects of Heat Stress at Vegetative and Reproductive Stages on Spikelet Fertility. Rice Sci. 2018, 25, 218–226. [Google Scholar] [CrossRef]
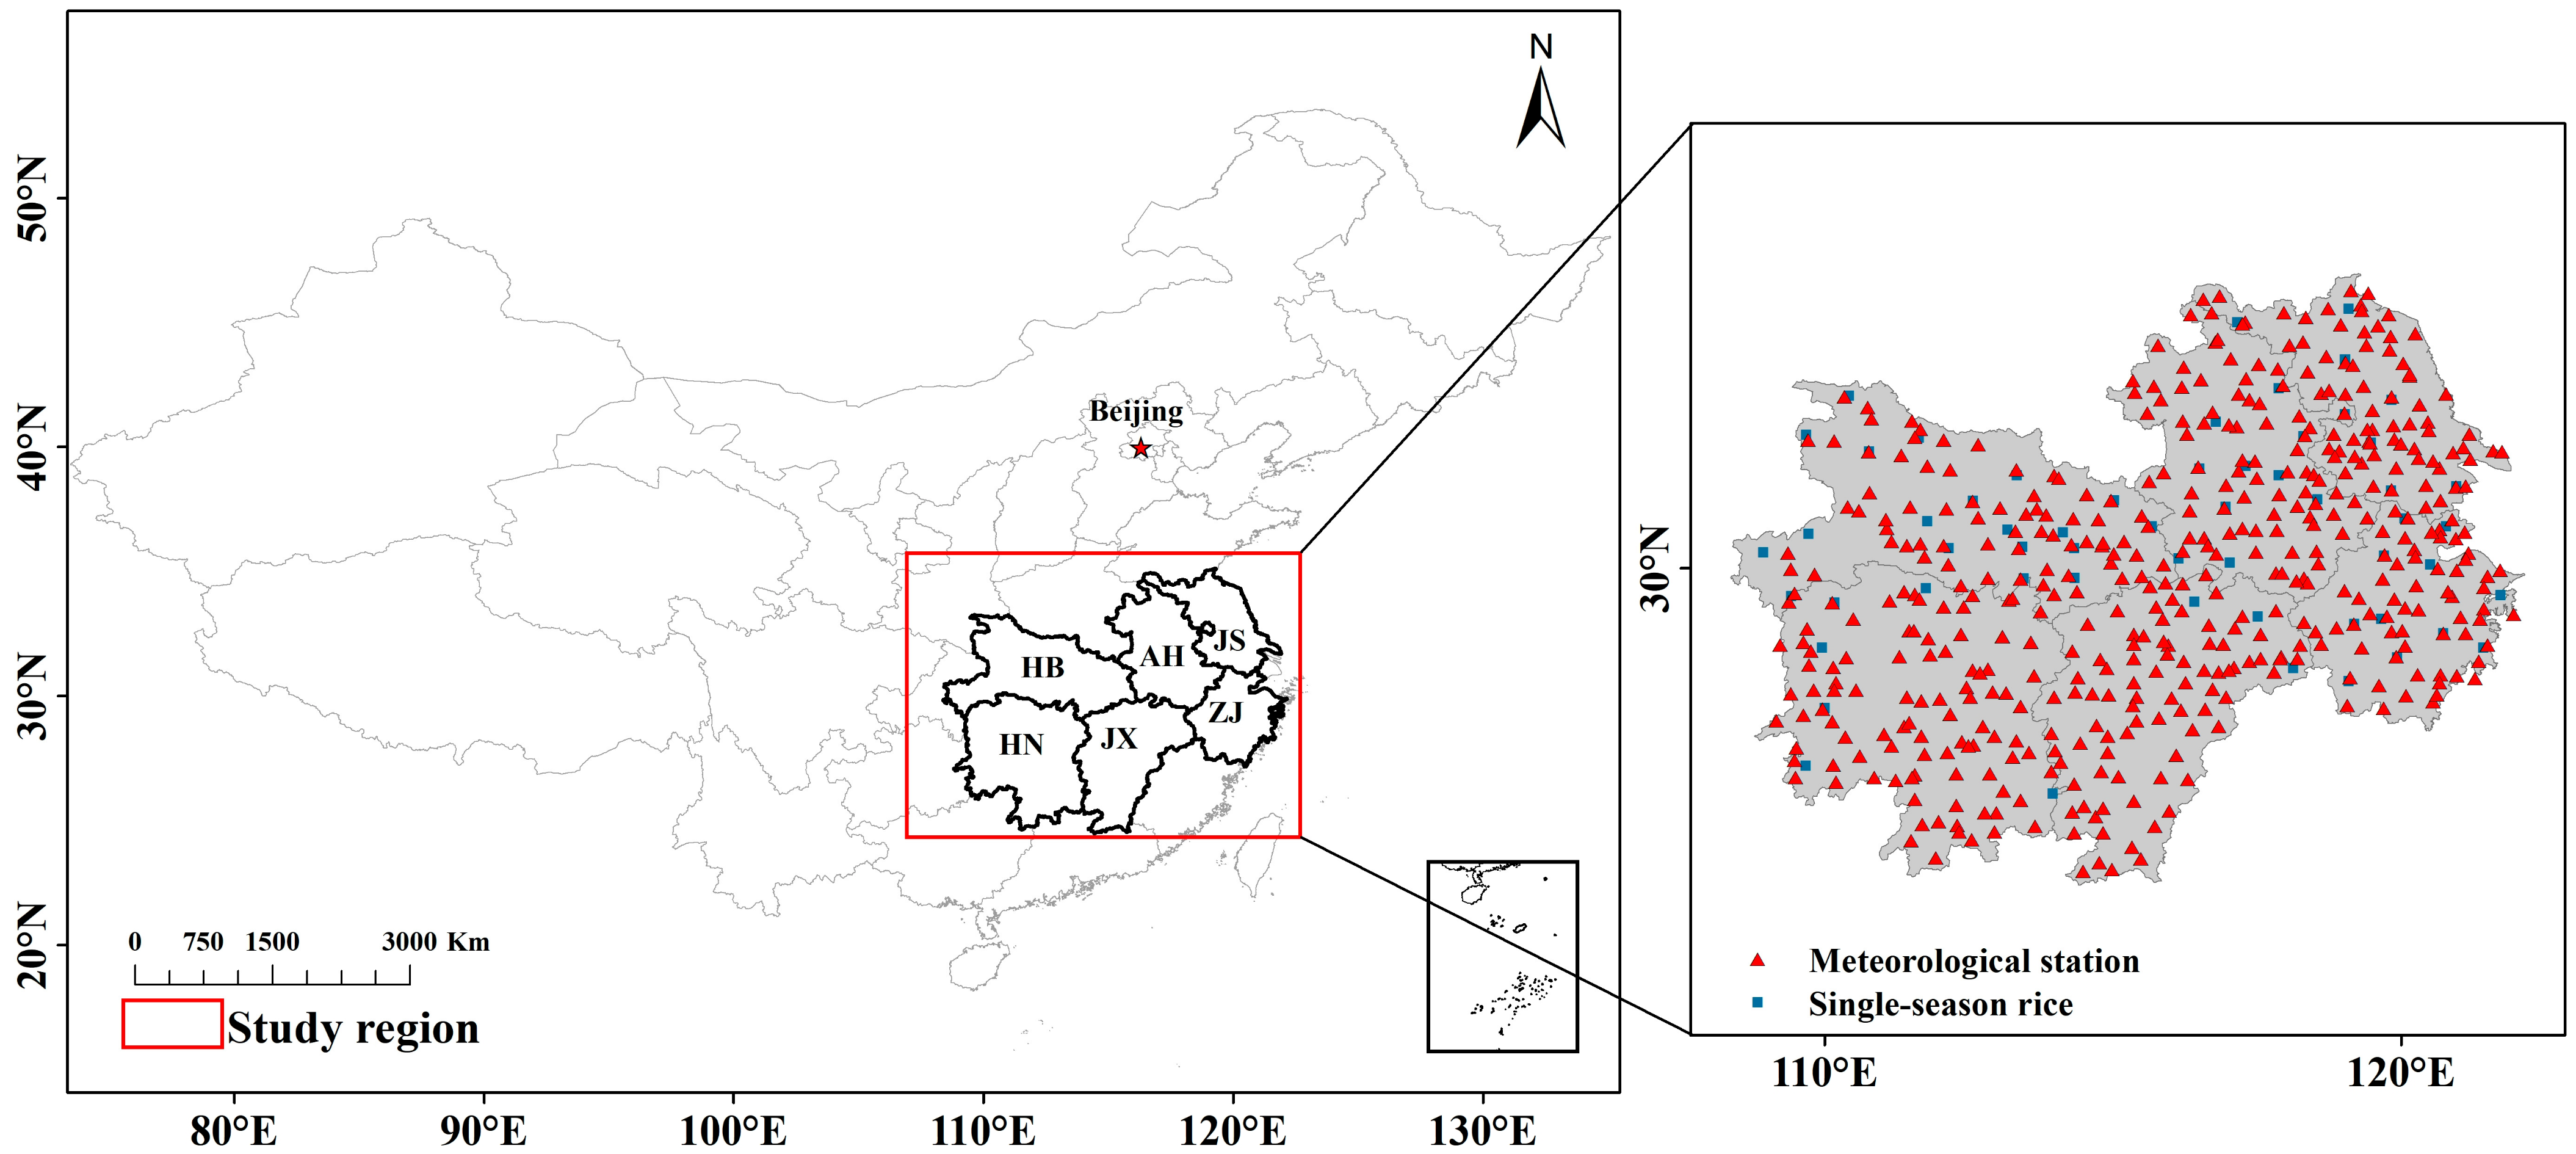
Figure 1. Location of study region and distribution of meteorological/agro-meteorological stations for single-season rice.
Agronomy 14 01737 g001
Figure 2. Distribution of duration and cumulative HCIId of heat disaster process in different grades of heat samples for single-season rice. (ad), (eh), (il) and (mp) are tillering, booting, flowering and filling stages, respectively. Black, red, and blue columns indicate mild, moderate, and severe disasters, respectively.
Agronomy 14 01737 g002
Figure 3. Validation of catastrophe-grade indicators of heat disaster. (ad) indicate the identification error at tillering, booting, flowering and filling, respectively. The identification error = 0 indicates completely consistent, ±1 for substantial agreement, and ±2 for two levels of difference.
Agronomy 14 01737 g003
Figure 4. Spatial distribution of risk index of heat disaster at tillering for single-season rice. (a) represent 1986–2005; (b,c) represent 2046–2065 and 2080–2099 under SSP2-4.5, respectively; (d,e) represent 2046–2065 and 2080–2099 under SSP5-8.5, respectively.
Agronomy 14 01737 g004
Figure 5. Spatial distribution of risk index of heat disaster at booting for single-season rice. (a) represent 1986–2005; (b,c) represent 2046–2065 and 2080–2099 under SSP2-4.5, respectively; (d,e) represent 2046–2065 and 2080–2099 under SSP5-8.5, respectively.
Agronomy 14 01737 g005
Figure 6. Spatial distribution of risk index of heat disaster at flowering for single-season rice. (a) represent 1986–2005; (b,c) represent 2046–2065 and 2080–2099 under SSP2-4.5, respectively; (d,e) represent 2046–2065 and 2080–2099 under SSP5-8.5, respectively.
Agronomy 14 01737 g006
Figure 7. Spatial distribution of heat risk index of heat disaster at filling for single-season rice. (a) represent 1986–2005; (b,c) represent 2046–2065 and 2080–2099 under SSP2-4.5, respectively; (d,e) represent 2046–2065 and 2080–2099 under SSP5-8.5, respectively.
Agronomy 14 01737 g007
Table 1. Information on CMIP6 models applied in this study.
ModelInstitutions and States
CanESM5Canadian Centre for Climate Modelling and Analysis, Canada
FGOALS-g3Institute of Atmospheric Physics, Chinese Academy of Sciences, China
MRI-ESM2-0Meteorological Research Institute, Japan
NorESM2-LMNorESM Climate Modeling Consortium, Norway
Table 2. Statistics of heat and non-heat samples of heat disaster process (construction sample/verification sample).
Growth StageSample ClassificationMildModerateSevereTotal Sample Size
TilleringHeat127/3127/735/8235
Non-heat 415
BootingHeat74/1855/1349/12221
Non-heat 335
FloweringHeat74/1857/14109/27299
Non-heat 498
FillingHeat60/1855/1265/16226
Non-heat 369
Table 3. Fisher critical line and discrimination performance at different growth stages. (Accuracy represents the proportion of correctly retrieved samples to all NH-d and H-d samples; the titles NH-d and H-d indicate the number of correctly retrieved samples/corresponding accuracy.).
Growth StageCategoryCritical LineAccuracyNH-dH-d
TilleringDry 0.385 = 0.658 Tcum     0.121 RH + 6.596 92.7%36/85.7%104/95.4%
Medium 0.008 = 0.427 Tcum + 0.021 RH + 0.059 Tmin     2.605 82.2%760/69.7%1491/93.8%
Wet 0.529 = 0.758 Tcum + 0.016 RH + 0.080 Tmin     2.266 80.6%711/75.4%359/93.4%
BootingDry 0.864 = 0.625 Tcum     0.071 RH + 0.330 Tmin     6.330 98.8%74/100%159/98.3%
Medium 0.204 = 0.554 Tcum + 0.032 RH + 0.146 Tmin     6.348 75.1%796/69.9%1569/78.0%
Wet 0.464 = 0.738 Tcum + 0.060 RH     3.920 88.7%390/83.8%202/100%
FloweringDry 0.210 = 0.653 Tcum   0.014 RH + 0.119 Tmin   2.954 92.3%54/100%438/91.4%
Medium 0.345 = 0.572 Tcum + 0.018 RH + 0.171 Tmin   6.460 83.0%901/81.8%1893/83.6%
Wet 0.536 = 0.627 Tcum + 0.037 RH + 0.137 Tmin     5.620 82.0%1036/77.6%345/99.0%
FillingDry 0.373 = 0.569 Tcum     0.013 RH + 0.062 Tmin     0.484 79.1%297/79.4%139/78.4%
Medium/wet 0.254 = 0.539 Tcum + 0.035 Tmin + 0.137 87.0%1118/76.0%1250/100%
Table 4. Distribution of duration of heat disaster process in different grades of heat samples.
Growth
Stage
Test
Threshold
Mild/ModerateModerate/SevereClassification Performance
Optimal
Range
Optimal ThresholdOptimal
Range
Optimal ThresholdKappaOA
Tillering[3,15]-6-90.7530.876
Booting[3,14]-5-80.5320.691
Flowering[3,13]-5-80.6470.779
Filling[3,14]-6-90.5640.711
Table 5. Identified thresholds of cumulative HCIId for different grades of heat samples under different durations.
Growth
Stage
DurationTest
Threshold
Mild/ModerateModerate/SevereClassification Performance
Optimal
Range
Optimal ThresholdOptimal RangeOptimal ThresholdKappaOA
Tillering3~6 d[0.6,10.3][6.7,8.3]7.5--0.5860.968
7~9 d[5.1,14.1]-6.2[8.1,14.0]10.050.6270.789
≥10 d[5.7,23.6][5.8,6.0]5.9[9.1,10.0]9.550.8490.943
Booting3~5 d[0.8,15.7][8.0,8.9]8.45-12.70.8460.924
6~8 d[3.0,15.5]-5.9[10.8,11.1]10.950.8720.922
≥9 d[4.5,23.6][5.3,6.1]5.7[9.8,9.9]9.80.6620.877
Flowering3~5 d[0.6,9.3]-7.4--0.6480.910
6~8 d[2.6,15.2][5.9,6.4]6.15[10.6,12.5]11.550.8440.913
≥9 d[4.0,28.3][4.5,5.5]5.0[10.7,11.3]11.00.9030.969
Filling3~6 d[0.9–9.3][5.4,5.5]5.4--0.4060.731
7~9 d[3.1,15.0]-7.0[11.8,12.0]11.90.8070.885
≥10 d[5.6,25.4][5.7,6.3]6.010.0-0.8320.937
Table 6. Catastrophe-grade indicators of heat disaster at different growth stages.
Growth StageDurationMildModerateSevere
Tillering3~6 d[0.6,7.5]>7.5-
7~9 d[0.6,6.2](6.2,10.05]>10.05
≥10 d[0.6,5.9](5.9,9.55]>9.55
Booting3~5 d[0.8,8.45](8.45,12.7]>12.7
6~8 d[0.8,5.9](5.9,10.95]>10.95
≥9 d[0.8,5.7](5.7,9.8]>9.8
Flowering3~5 d[0.6,7.4]>7.4-
6~8 d[0.6,6.15](6.15,11.55]>11.55
≥9 d[0.6,5.0](5.0,11.0]>11.0
Filling3~6 d[0.9,5.4]>5.4-
7~9 d[0.6,7.0](7.0,11.9]>11.9
≥10 d[0.6,6.0](6.0,10.0]>10.0
Disclaimer/Publisher’s Note: The statements, opinions and data contained in all publications are solely those of the individual author(s) and contributor(s) and not of MDPI and/or the editor(s). MDPI and/or the editor(s) disclaim responsibility for any injury to people or property resulting from any ideas, methods, instructions or products referred to in the content.