Abstract
In Northeast China’s black soil rice cropping area, nitrogen (N) application is lower than in the south, yet excessive N fertilizer use persists, particularly in base fertilizers. This study aimed to assess the impact of reduced N and increased planting density on rice yields and photosynthetic matter production. From 2019 to 2020, a field split-plot experiment was conducted with two N rates (conventional N, CN: 120 kg ha−1 and reduced basal N, RN: 108 kg ha−1) and two planting densities (D1: 33.3 × 10⁴ hills ha−1 and D2: 27.8 × 10⁴ hills ha−1) using the rice varieties Kongyu131 (KY131) and Kendao24 (KD24). The results showed that RN increased the effective panicle formation rate but decreased the tiller numbers, dry matter accumulation, stems/sheaths transport capacity, leaf photosynthetic capacity, and yield by 2.67% compared to CN. D1 significantly boosted the dry matter accumulation, stems/sheaths transport, effective panicles, grains per square meter, and yield by 8.26% compared to D2. Interaction analysis revealed that RN under D2 conditions reduced the effective panicle percentage, harvest index, filled grain number, leaf area index (LAI), crop growth rate (CGR), and net assimilation rate (NAR) but increased the seed setting rate and 1000-grain weight. Under D1, RN reduced the LAI, CGR, and NAR at the tillering and heading stages but increased the NAR post-heading. Compared to CND2, RND1 increased the biomass, stems/sheaths transport, LAI, CGR, NAR, seed setting rate, 1000-grain weight, panicle numbers, and filled grains per square meter, compensating for the lower harvest index and effective panicle rate, achieving a 5.36% yield increase. KD24 outperformed KY131 in yield improvement. In summary, using 108 kg ha−1 with a planting density of 33.3 × 10⁴ hills ha−1 promotes tillering, enhances photosynthetic substance production stems/sheaths dry matter transport, and increases rice yields.
1. Introduction
Rice (Oryza sativa L.) is an essential staple food crop in China, with a growing area of 29 million hectares in 2023, amounting to 24.3 percent of the total growing area, producing 28 million tons, accounting for 1/5 of the total Chinese grain output (https://www.stats.gov.cn/sj/, (accessed on 20 May 2024)). In prior studies, a rice yield improvement was found to rely on an increased yield per unit area primarily, and the increased N application or planting density increased the unit yield and production efficiency. However, in practice, growers often increase the planting density and N fertilizer and use excessive irrigation to increase the unit yield [1]. This has produced several problems, including increased production costs, environmental pollution, and resource waste, substantially impacting the sustainable development of agriculture.
Nitrogen (N), the most in-demand nutrient for crops, is essential for photosynthesis and canopy area expansion, improving the aboveground dry matter accumulation and leaf photosynthetic capacity, promoting the transport to grains, and increasing yields [2,3]. A reasonable use of N can regulate the green holding time of leaves [4], delay chlorophyll degradation [5], increase dry matter accumulation [6], promote nutrient transfer, and increase the yield [7,8]. Excessive N application is increasingly common as growers pursue high yields. High N can enhance the tiller number in the early stages, but competition for nutrients, light, and assimilates leads to the death of tillers [9]. Excessive N application inhibits the plant’s growth and development, reduces the panicle rate and grain yield [10], and causes extensive waste and environmental problems [11,12,13]. Conversely, N deficiency restricts photosynthetic matter production in leaves, limits grain development, and decreases the effective panicles and grains per panicle [14,15]. Therefore, only a scientific and reasonable application of N fertilizer can optimize the growth of individual plants. This will coordinate growth conflicts between individuals and populations, allowing for increased rice production and sustainable development in China [16].
Planting density is an essential agronomic measure that influences the crop yield per unit area. Prior studies have demonstrated that increasing planting density can improve resource utilization efficiency [17,18], promote dry matter accumulation [19], enhance effective panicles per unit area [20], and increase the harvest index, biomass, and yield [21]. Additionally, this approach will decrease the number of tillers per plant, grain number per panicle, and grain weight [22,23]. When the planting density increases past a threshold, plant growth and development are inhibited, lodging risk increases [24,25], and the yield decreases with elevated planting density [26,27]. Similar studies have demonstrated that the increase in planting density promotes the growth of main stem and internode elongation, inhibits the growth of tillers, changes the canopy structure, and intensifies competition for nutrients, light, and resources [28]. Correspondingly, a high planting density can reduce the photosynthesis of lower canopy leaves [29,30], accelerate the early senescence of lower leaves, and reduce the biomass, seed setting rate, and yield per plant [31].
Prior studies indicated that N reduction is an effective way to overcome excessive N in production, but it caused a decrease in crop yields [32]. Based on N reduction, increasing the planting density can compensate for fewer tillers produced by N reduction, ensuring a stable or increased yield [33,34,35]. Currently, most studies on N and planting density interaction focus on dryland crops, and N reduction encompasses nitrogen application reduction during the entire crop growth period. Therefore, the interaction between N and planting density is required to stabilize or increase rice yields in the colder regions of China, which is critical to optimize rice yields and photosynthetic matter production. Notably, the effect of the interaction between reduced N and increased transplanting density on yield formation has not been systematically investigated.
Therefore, the objectives of the present study were to (1) compare the differences in tillering and photosynthetic matter production characteristics of rice populations under the interaction of N and density; (2) characterize the yield difference between rice populations under the interaction of N and density; (3) identify methods to increase the yield via interactions between N reduction and increased density. The research results will offer theoretical and technical support for high-yield and efficient rice cultivation.
2. Materials and Methods
2.1. Summary of the Study Region
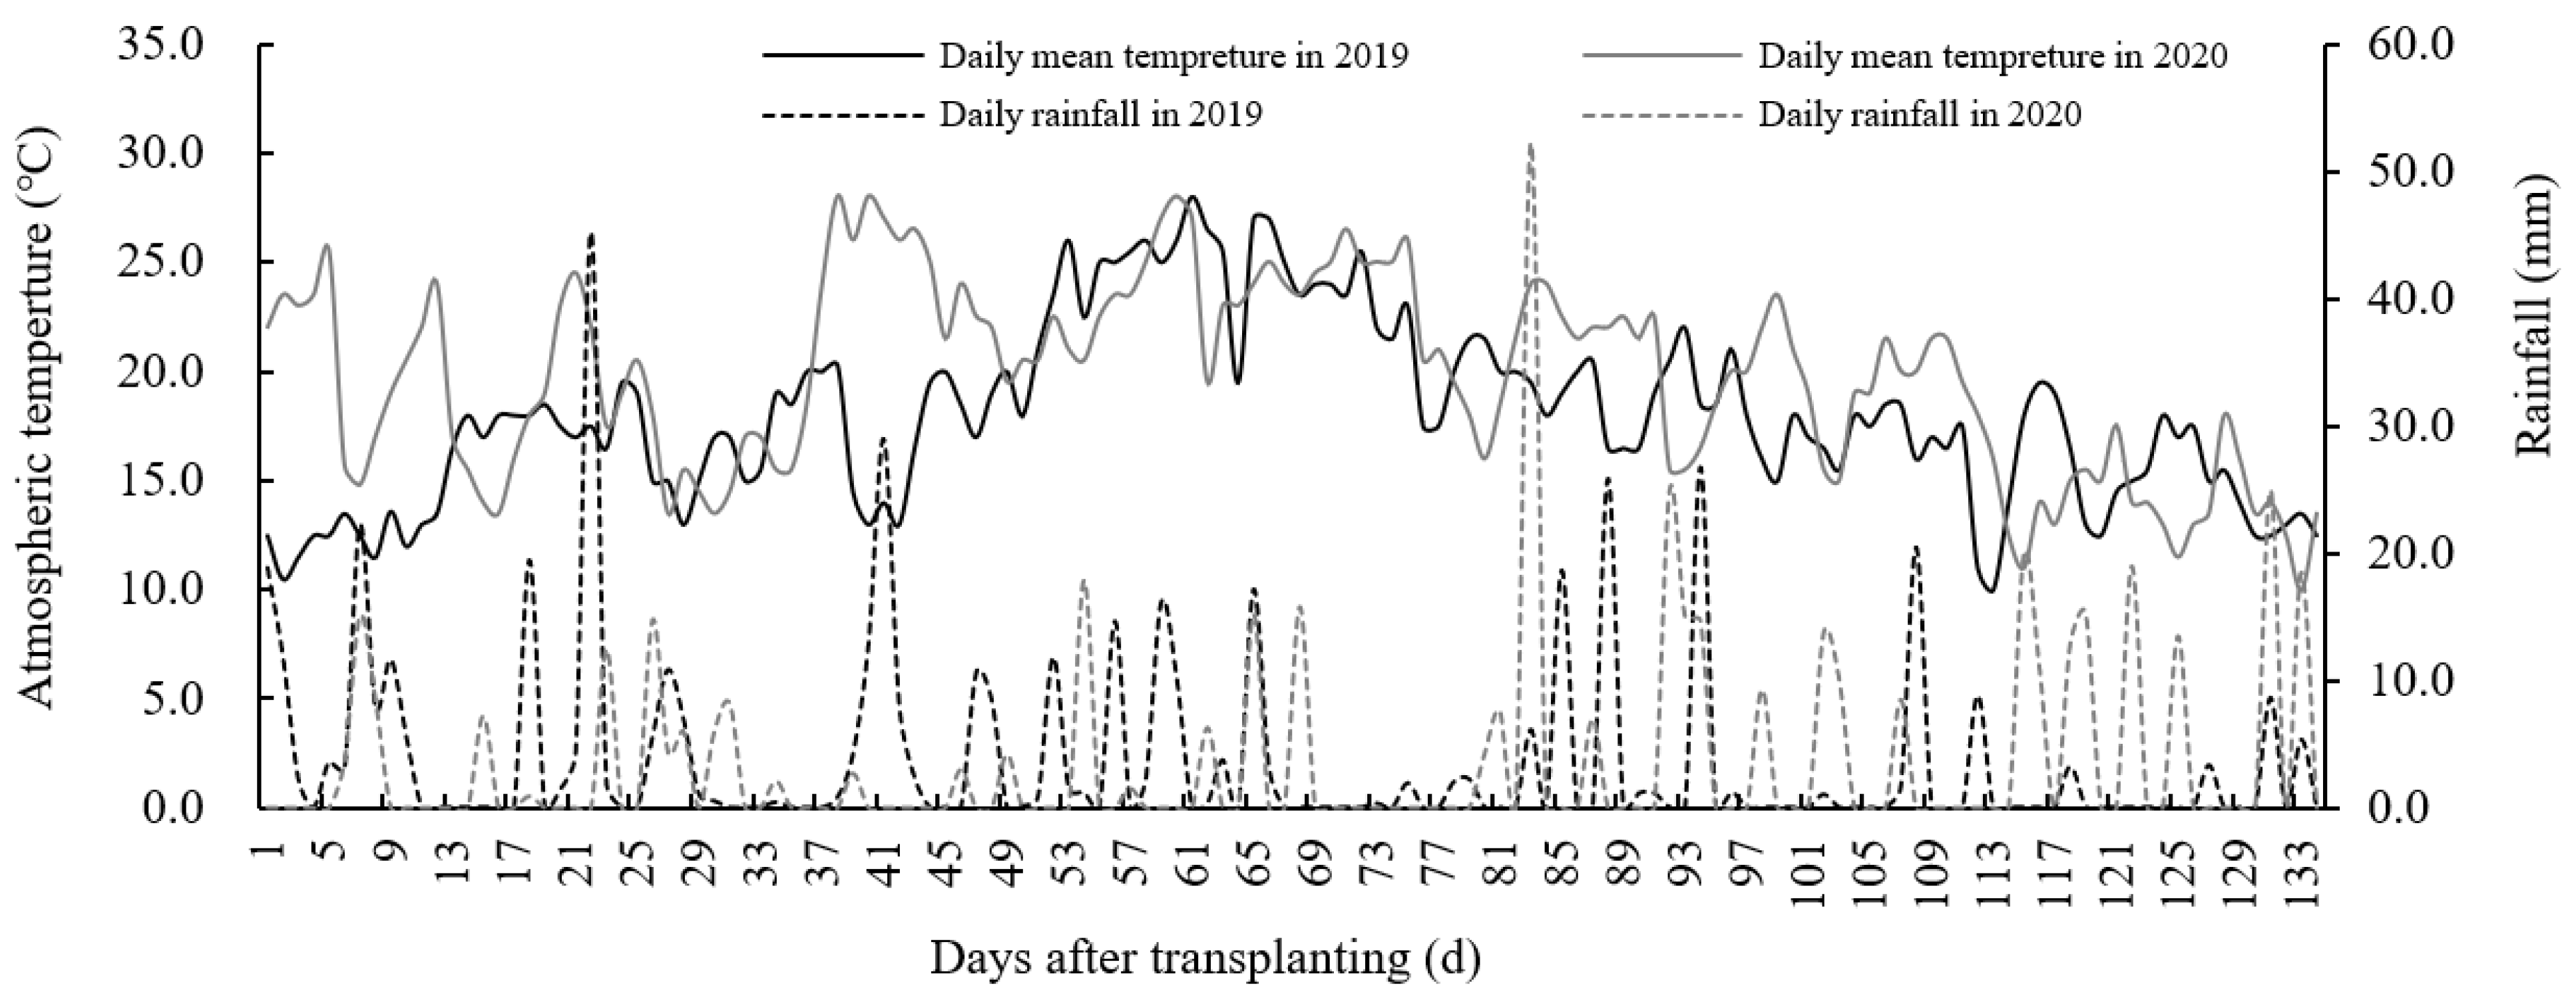
This experiment was performed from 2019 to 2020 at the Heilongjiang Academy of Land Reclamation Sciences, located at Jianan Experimental Farm (130°48′ E, 46°35′ N), Jiamusi City, Heilongjiang Province, China. This was selected as it is typically a single rice area characterized by a temperate continental monsoon climate. The soil contained organic matter levels of 47.59 g kg−1, alkali-hydrolyzable N of 189.72 mg kg−1, available phosphorus of 34.66 mg kg−1, available potassium of 152.14 mg kg−1, and a pH of 6.79 in the 0–20 cm topsoil layer (2-year average). The climate data were measured at a meteorological station located within 300 m of the experimental site. The average rainfall and active accumulated temperature over two years were 470.3 mm and 2531.2 °C, respectively (Figure 1).

Figure 1.
Daily rainfall and average air temperature during the entire growth duration from 2019 to 2020. This was conducted at the Jianan Experimental Farm, Qianjin District, Jiamusi City, Heilongjiang Province, Northeast China (130°48′ E, 46°35′ N) for two consecutive years.
2.2. Experimental Design and Crop Management
A three-way sub-subplot experiment consisting of three replicates was designed, with the main plot assessing the variety, including KY131 (main stem11-leaf) and KD24 (main stem12-leaf). Two N rates, conventional N (CN) and basal N reduction (RN) with 120 kg ha−1 and 108 kg ha−1, respectively, were utilized as subplots. Two planting densities, D1 with 33.3 × 10⁴ hills ha−1 (hill spacing of 25 cm × 12 cm) and D2 with 27.8 × 10⁴ hills ha−1 (hill spacing of 30 cm × 12 cm), were used as the sub-subplot, and both were in six-row plots. For each variety, two N rates and two planting densities produced four combinations: CND1, CND2, RND1, and RND2, where CND1 and RND1 had an area of 12.0 m2, while CND2 and RND2 occupied an area of 14.4 m2. All plots were separated by PVC boards and irrigated.
Blanket seedlings were grown in hard plastic seedling trays (60 cm × 30 cm) on 19 April 2019, and 20 April 2020. The bud seed application of KY131 and KD 24 was 100 g (the water content of the germinated seeds was approximately 30%, and the root length was below 2 mm) per tray. The transplanting leaf age was 3.3–3.5 leaves. Artificial simulation of mechanical transplanting was performed on May 25 in both 2019 and 2020. Row spacing was determined using an iron frame, and plant spacing was determined using a red rope fastened to a white rope. The number of seedlings per hill in D1 and D2 was established as four plants (the points with less than four seedlings caused by dead seedlings or missed transplanting; manual replanting was carried out within five days after transplantation).
N fertilizer (urea) was manually and evenly spread during three stages. CN: 48 kg ha−1 as base fertilizer, 36 kg ha−1 at around 4.5 leaf age, and 36 kg ha−1 at the young ear differentiation stage (KY131 and KD24 were applied at approximately 9.5 leaf age and 10.5 leaf age, respectively); RN: 36 kg ha−1 as base fertilizer, 36 kg ha−1 at around 4.5 leaf age, and 36 kg ha−1 at the young ear differentiation stage. P2O5 and K2O were administered for all treatments at rates of 46 kg ha−1 and 90 kg ha−1, respectively. The P fertilizer arose from calcium superphosphate, applied 100% as a base fertilizer once a year. The K fertilizer came from potassium chloride, administered as 45 kg ha−1 as the base fertilizer and 45 kg ha−1 at the young ear differentiation stage (application period mirrored N). Herbicides were sprayed on day one and 40–45 days after transplanting to control weeds. Disease control agents were sprayed 50–55 days and 65–70 days after transplanting to control sheath blight and rice blast disease, respectively. The rice was irrigated in a shallow water layer (2–3 cm) when transplanting to the end of the effective tillering stage (KY131 and KD24 at leaf ages of 7.1–7.5 and 8.1–8.5, respectively). From the end of the effective tillering stage to the panicle stage, drainage occurred to control ineffective tillering. After that, the shallow water layer was flooded, and drainage was conducted seven days before harvest.
2.3. Leaf Age of Main Stem and Number of Tillers
After greening, ten rice plants with the same growth were selected from each plot. The leaf age of the odd-numbered leaf on the main stem was identified using a red metal paint pen, and the marking stopped after the flag leaves of the main stem were unfolded to determine the timing of field sampling, fertilization, and drying. The tiller number investigations were performed on the seventh day after turning green and concluded when the number of tillers stabilized. This was utilized to assess the tiller dynamics and compute the effective panicle (the fully filled grain number ≥10 grains) formation rate of the stems and tillers, yield, and yield composition.
The panicle formation rate of stems and tillers (%) = [effective panicles per square meter at maturity/maximum tillers per square meter at peak tillering stage] × 100.
2.4. Dry Matter Transport and Photosynthetic Characteristics
The tiller numbers of 30 consecutive hills in each plot were randomly chosen to assess the number of tillers in each plot at the full tillering stage (KY131 and KD24 on the 36th and 41st days following transplantation, respectively), full heading stage (heading accounted for 80% of total tillers), wax ripening stage (KY131 and KD24 on the 25th and 28th days following full heading, respectively), and maturity (KY131 and KD24 on the 50th and 53rd days following full heading, respectively). The average number of tillers and effective panicles per hill were determined based on the transplanting density. According to the average, five representative rice plants at the same growth stage were chosen in each plot to characterize the morphologies of rice leaves, stems/sheaths, and panicles. The leaf area was measured using the 200 cm2 grid fresh weight method to calculate the leaf area index [36]. The dry weight of each rice part was obtained after being dried at 105 °C for 30 min and baked at 80 °C for 72 h. The formula for determining the relevant indicators is as follows [37,38,39]:
where W is the fresh weight of green leaves per square meter (g m2), S is the known square area (0.02 m2), and M0 is the fresh weight of green leaves under the S area (g); T1 and T2 represent the days after transplanting of the two measurements, and S1 and S2 represent the leaf area (m−2) measured at T1 and T2, respectively. W1 and W2 represent the shoot dry weights (g m−2) measured at T1 and T2, respectively.
Dry matter output of the stems/sheaths (DMO) (g m−2) = dry weight of stems/sheaths at heading stage − dry weight of stems/sheaths at wax maturity.
Dry matter export rate of the stems/sheaths (DMER) (%) = [(dry weight of stems/sheaths at heading stage − dry weight of stems/sheaths at wax maturity)/dry weight of stems/sheaths at heading stage] × 100.
The dry matter conversion rate of the stems/sheaths (DMCR) (%) = [(dry weight of stems/sheaths at heading stage − dry weight of stems/sheaths at wax ripening stage)/grain dry weight at mature stage] × 100.
LAR = (W × S)/M0.
CGR (g m−2 d−1)) = (M2 − Ml)/(T2 − T1).
NAR (g m−2 d−1) = [(lnS2 − lnS1)/(S2 − S1)] [(M2 − M1)/(T2 − T1)].
2.5. SPAD Values and Photosynthetic Parameters
The SPAD values of the leaves were measured using a SPAD-502 chlorophyll meter (MinoltaCamem Company of Japan, Tokyo, Japan) at the peak tillering, full heading, and wax ripening stages. Four hills were randomly chosen in each plot, and the expanded leaves of five main stems were measured, in which the sixth, seventh, and eighth leaves of the main stem of KY131 and the seventh, eighth, and ninth leaves of the main stem of KD24 were evaluated at the peak tillering stage. At the full heading and wax ripening stages, the SPAD values of the upper three green leaves on the main stem of two varieties were evaluated at a distance of 2/3 from the base of the leaves, and the mean value represented the measurement result. The net photosynthetic rate (Pn) was assessed from 09:00 a.m. to 12:00 p.m. using a LI-6400 portable photosynthetic measurement system (LI-COR, Lincoln, NE, USA) [38]. The seventh unfolded leaf of the KY131 main stem and the eighth unfolded leaf of the KD24 main stem were measured at the full tillering stage, and the Pn of flag leaves of the two varieties at the full heading and wax ripening stages.
2.6. Yield and Yield Components
The yield of each plot was assessed in 2 m2 sections, and the yield per hectare was converted to 14.5% standard moisture (the national water content standard of Japonica rice) for data analysis. Five hills were chosen in each plot based on the average effective panicle number per hill calculated in Section 2.4. The plant height, panicle length, internode length, and yield components were evaluated following shade drying [36].
2.7. Data Compilation and Analysis
Data were compiled and analyzed using Microsoft Excel 2019 (USA) and DPS 9.01 software (China), respectively [40]. Three-way sub-subplot experiment statistical analysis was conducted using DPS9.01. Duncan’s method was selected to perform variance analysis on the average values of two years of data. The significant differences in the interaction between the main plot, subplot, sub-subplot, and treatment were evaluated, and multiple comparison results of the N application rate and planting density interaction treatments under each variety were obtained. In addition, we also used DPS9.01 software to conduct a multivariate analysis of the year, variety, N application rate, and planting density. The interaction differences between the year and variety, N application rate, and planting density were obtained, respectively.
2.8. Language Editing
The language was edited using ZhiyunV8.4 software.
3. Results
3.1. Dynamic Characteristics of Leaf Age of Main Stem and Tillering in Rice
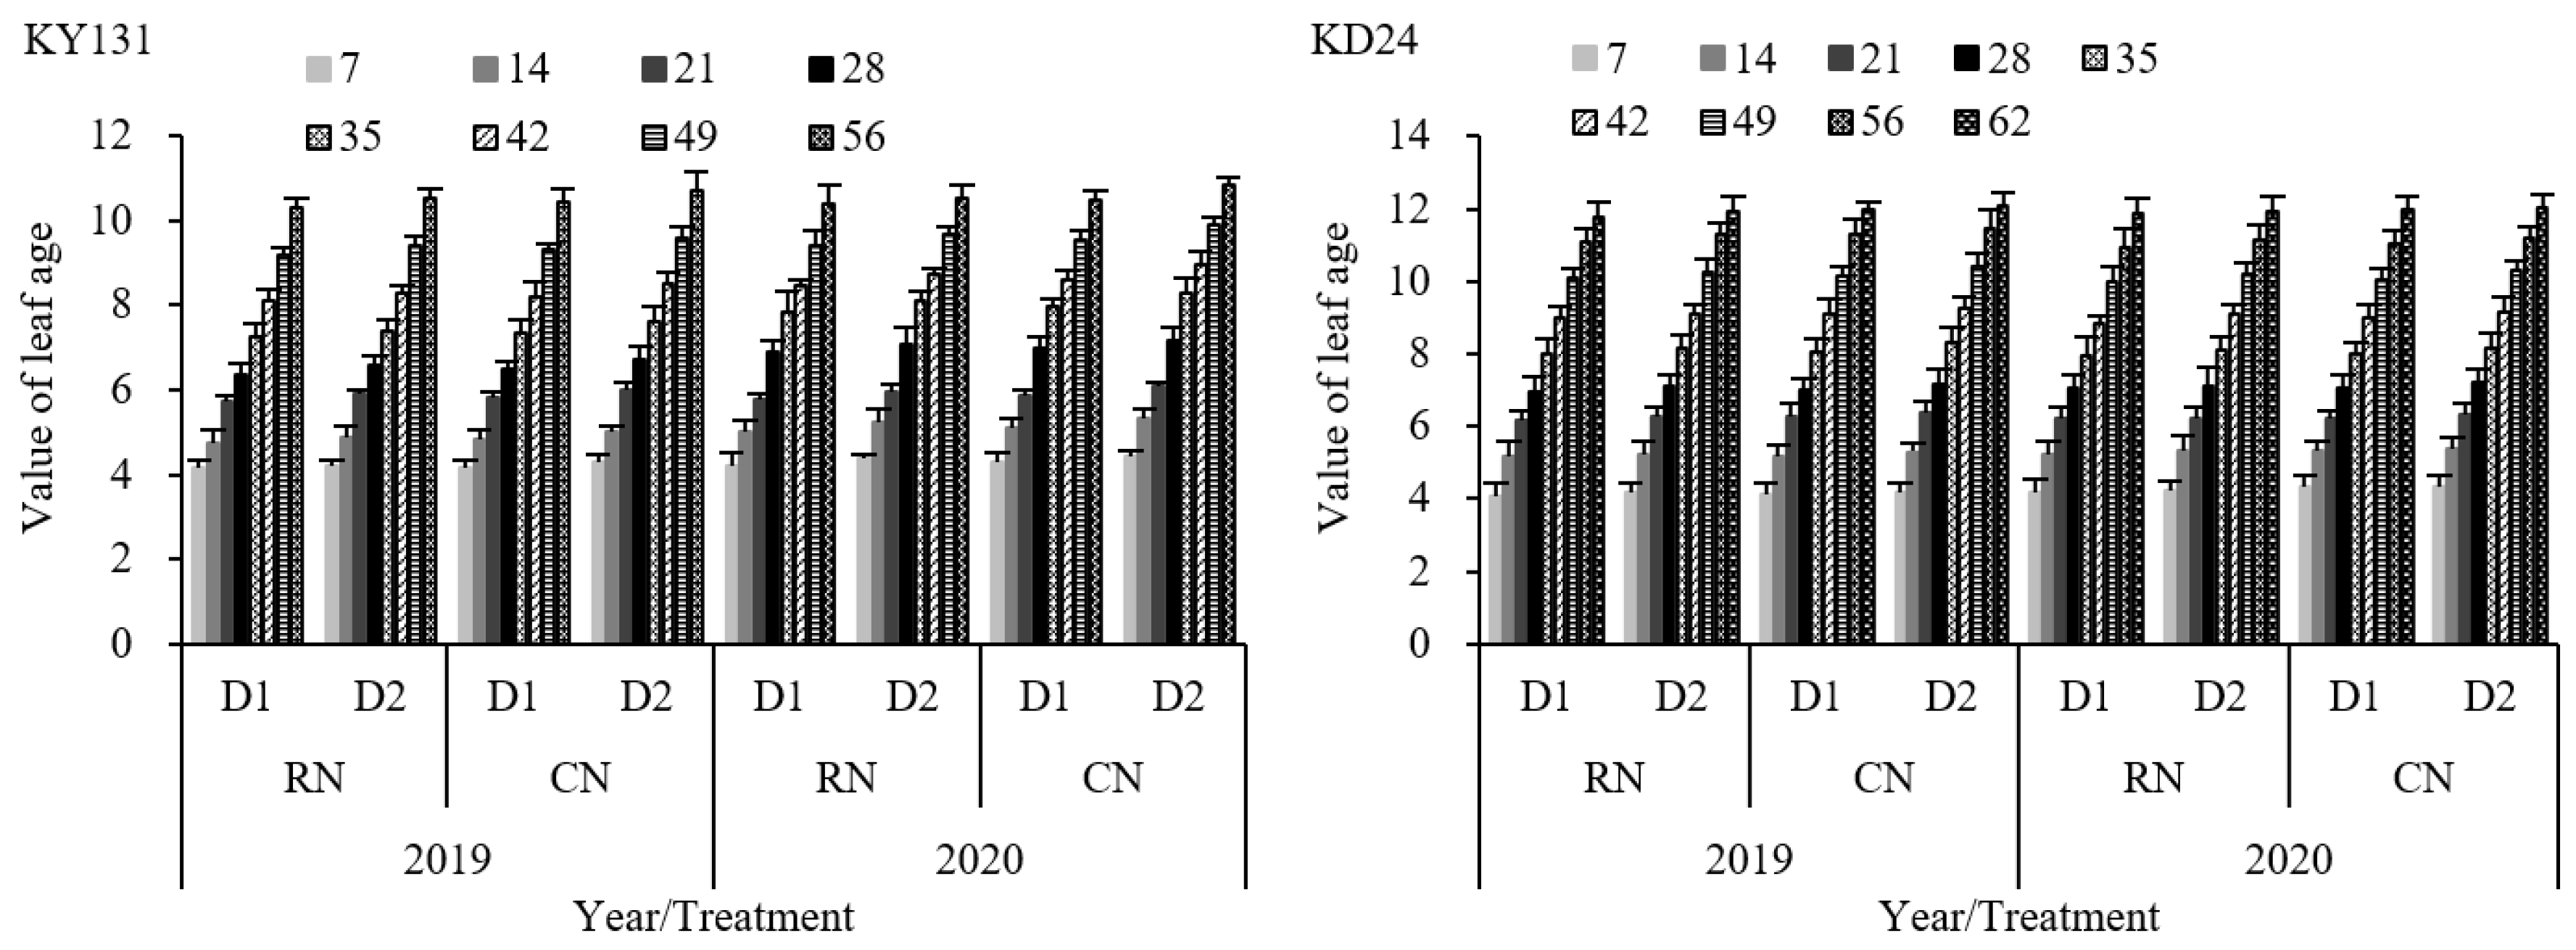
The growth of the leaves of the main stem of rice reflects the growth process of different organs at different stages. During the entire leaf age growth process, the average leaf age value of RN was reduced by 1.77% (KY131) and 1.17% (KD24) compared to CN, and that of D1 decreased by 2.91% (KY131) and 1.61% (KD24) compared to D2. KY131 and KD24 reached their maximum leaf age values on the 56th and 62nd days after transplantation, respectively (Figure 2). RN and D1 decreased the final leaf number of the main stem, but this decrease was not significant. This indirectly indicated that the impact of N and density on the rice growth process was within a controllable range. In addition, the adaptability of the main stem leaf number of rice in the same area differed between years and varieties. This indicated that the leaf age growth process of high-leaf-age varieties was faster than that of the low-leaf-age varieties. The leaf age value of RND1 decreased the most, with an average decrease of 4.62% (KY131) and 2.76% (KD24) in the whole leaf age growth process, which was not significant (Figure 2). The leaf age reduction effect of RN under the same density was lower than D1 under the same N application rate. Overall, the reduction in leaf age of KY131 was greater than that of KD24.
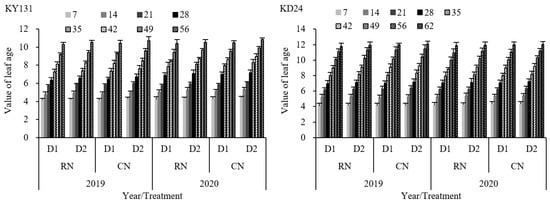
Figure 2.
Effect of reduced N and increased planting density on leaf age dynamics of the main stem of rice KY131 and KD24. CN: conventional N (120 kg ha−1); RN: basal N reduction (108 kg ha−1). D1: 33.3 × 10⁴ hills ha−1; D2: 27.8 × 10⁴ hills ha−1. The average deviation is used for the error line.
The influence of the number of main stem leaves, according to the law of co-extension of N-3 (the age value of N’s main stem leaves), caused a difference in the effective tiller nodes between KY131 and KD24. This resulted in KY131 and KD24 reaching maximum tiller numbers on the 35th and 42nd days after transplantation, respectively. N application had a significant impact on the tillers. RN reduced rice tillering, with KY131 and KD24 decreasing by 5.51% and 5.03% compared to CN on 7 to 56 days after transplantation and 9.79% and 8.58%, respectively, on the 14th and 21st days after transplantation (Figure 3). Conversely, D1 significantly increased the tillers compared to D2. The average increase of the tiller numbers in KY131 and KD24 at 7 to 56 days after transplanting was 12.08% and 19.02%, respectively, and the increase was the highest on the 21st and 28th days following transplanting, with a rise of 33.60% and 31.41%, respectively (Figure 3). A further evaluation indicated that D1 could significantly elevate the tillers per square meter using the same N application rate, while N reduction at the same density caused a decrease in the number of tillers. The interaction between the N application rate and planting density significantly impacted tillering. The number of CND1 tillers was the highest during the entire tillering process, followed by RND1. Compared to CND2, RND1 significantly increased the tillers, and the average increase of KY131 and KD24 was 5.75% and 12.85%, respectively (Figure 3). These results indicated that RN was not conducive to rice tillering, while D1 increased the population tillering capacity, and RND1 achieved higher population tillering than CND2.
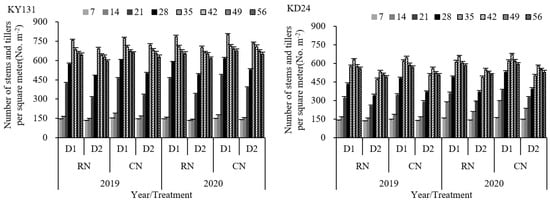
Figure 3.
Effect of reduced N and increased planting density on tiller dynamics of rice KY131 and KD24. CN: conventional N (120 kg ha−1); RN: basal N reduction (108 kg ha−1). D1: 33.3 × 10⁴ hills ha−1; D2: 27.8 × 10⁴ hills ha−1. The average deviation is used for the error line.
3.2. Biomass and Dry Matter Transport in Stems and Sheaths
Biomass and dry matter transport in stems/sheaths are primary sources of yield formation, particularly the dry matter, which increases continuously following heading. Compared to CN, RN significantly reduced the biomass during the tillering, heading, and maturation stages, with the most pronounced decrease observed during tillering at 7.64%. The DMO, DMER, and DMCR also increased by 3.87%, 6.81%, and 7.60%, respectively (Table 1). Density had significant or very significant effects on the biomass at the tillering, heading, and mature stages, as well as the stems/sheaths transport index following heading. Compared to D2, the biomass of D1 at the tillering stage, heading stage, and mature stage increased significantly by 13.62%, 9.51%, and 9.16%, and the DMO, DMER, and DMCR increased by 14.51%, 4.52%, and 3.24%, respectively (Table 1).

Table 1.
Effect of reduced N and increased planting density on biomass and matter transport of stems/sheaths in rice.
Interaction analysis indicated that the interaction between the N application rate and planting density significantly impacted the biomass at the tillering and heading stages, as well as the DMO, DMER, and DMCR following heading. The biomass of RND1 increased significantly by 16.92%, 9.64%, and 10.07% at the tillering, heading, and mature stages, respectively, and the increases in the DMO, DMER, and DMCR after heading were 16.01%, 4.60%, and 3.92%, respectively, compared to RND2 (Table 1). Compared to CND2, the biomass of CND1 increased by 10.66%, 9.38%, and 8.29% at the tillering, heading, and mature stages, respectively, and the DMO, DMER, and DMCR after heading increased by 12.97%, 4.42%, and 2.53%, respectively (Table 1). In contrast, the biomass of RND1 decreased by 5.24%, 3.94%, and 1.81% compared to CND1 at the tillering, heading, and mature stages, respectively; following heading, the DMO, DMER, and DMCR significantly increased by 5.16%, 6.90%, and 8.28%, respectively. Compared to CND2, the RND2 biomass decreased by 10.30%, 4.14%, and 3.40%, respectively, at the tillering, heading, and mature stages, respectively, whereas the DMO, DMER, and DMCR following heading increased by 2.42%, 6.72%, and 6.83%, respectively (Table 1). The above results indicated that compared to D2, the biomass increase of D1 under the RN conditions was higher than under the CN conditions, whereas the changes in the DMO, DMER, and DMCR were the opposite. Relative to CN, the biomass reduction in RN under the D1 conditions was smaller than that under the D2 condition, and changes in the DMO, DMER, and DMCR were opposite.
Additionally, compared to CND2, the biomass of RND1 increased by 4.87%, 5.11%, and 6.33% at the tillering, heading, and mature stages, while the DMO, DMER, and DMCR following heading significantly increased by 18.81%, 11.63%, and 11.02%, respectively (Table 1). The increase observed in KD24 was higher than that of KY131 at the tillering stage, whereas KY131 increases were higher than KD24 at the heading and mature stages. Overall, RN decreased the biomass at each growth stage and increased the transport capacity of stems/sheaths following heading. D1 increased the biomass at each stage and increased the transport capacity of stems/sheaths after heading. Compared to CND2, RND1 significantly increased the biomass at the tillering and heading stages and increased the transport capacity of the stems/sheaths following heading.
3.3. Characteristics of Main Photosynthetic Indexes
LAI, CGR, and NAR are critical indicators of the population’s photosynthetic capacity. Variety, N application rate, and planting density significantly affected the LAI, NAR, and CGR. RN decreased the LAI, CGR, and NAR compared to CN, and the LAI at the mature stage decreased by 9.13%, CGR and NAR decreased by 3.42% and 4.65%, respectively, from the tillering stage to the heading stage, and by 4.27% and 4.94% respectively, from heading to maturity. D1 significantly elevated the LAI at the tillering and heading stages and increased the CGR and NAR compared to D2 (Table 2).
Table 2.
Effect of reduced N and increased planting density on LAI, CGR, and NAR of rice.
Interaction analysis indicated that the interaction between the variety and N significantly impacted the LAI at the heading stage. The interaction between the variety and density significantly influenced the LAI following heading and the CGR and NAR from tillering to heading. The interaction between the N application rate and planting density significantly affected the LAI at the tillering stage and the NAR from heading to maturity. The interaction between the variety, N application rate, and planting density only significantly affected the LAI at the tillering stage (Table 2). Compared to RND2, the LAI of RND1 significantly increased by 13.24% during tillering, which is higher than during the heading and maturity stages. This improved the CGR and NAR, with a more pronounced increase in the CGR after heading than prior to heading, while the opposite effect was identified for the NAR. Compared to CND2, CND1 increased the LAI at the tillering, heading, and mature stages by 7.22%, 6.80%, and 3.38%, respectively, and increased the CGR from the tillering to maturity and the NAR from the tiller to heading stages, in which the CGR increased by 8.54% and 10.88%, respectively, before and after heading, and decreased the NAR from heading to maturity (Table 2).
Compared to CND2, RND1 elevated the LAI at the tillering and heading stages and significantly reduced the LAI at maturity, and the increase and decrease in KD24 were greater than in KY131. RND1 increased CGR and NAR from tillering to maturity, with the CGR and NAR increasing by 4.26% and 6.00% from tillering to heading and 6.47% and 3.29% from heading to maturity, respectively (Table 2). According to variety performance, KY131 had the optimal CGR growth effect, while KD24 had the optimal NAR growth effect. These results suggested that RN reduced the LAI, CGR, and NAR from tillering to maturity, while D1 increased the LAI and CGR during the tillering and maturity stages. Compared with CND2, RND1 was more conducive to improving the pre-heading LAI, CGR, and NAR, and promoting dry matter accumulation and post-heading stems/sheaths transport capacity.
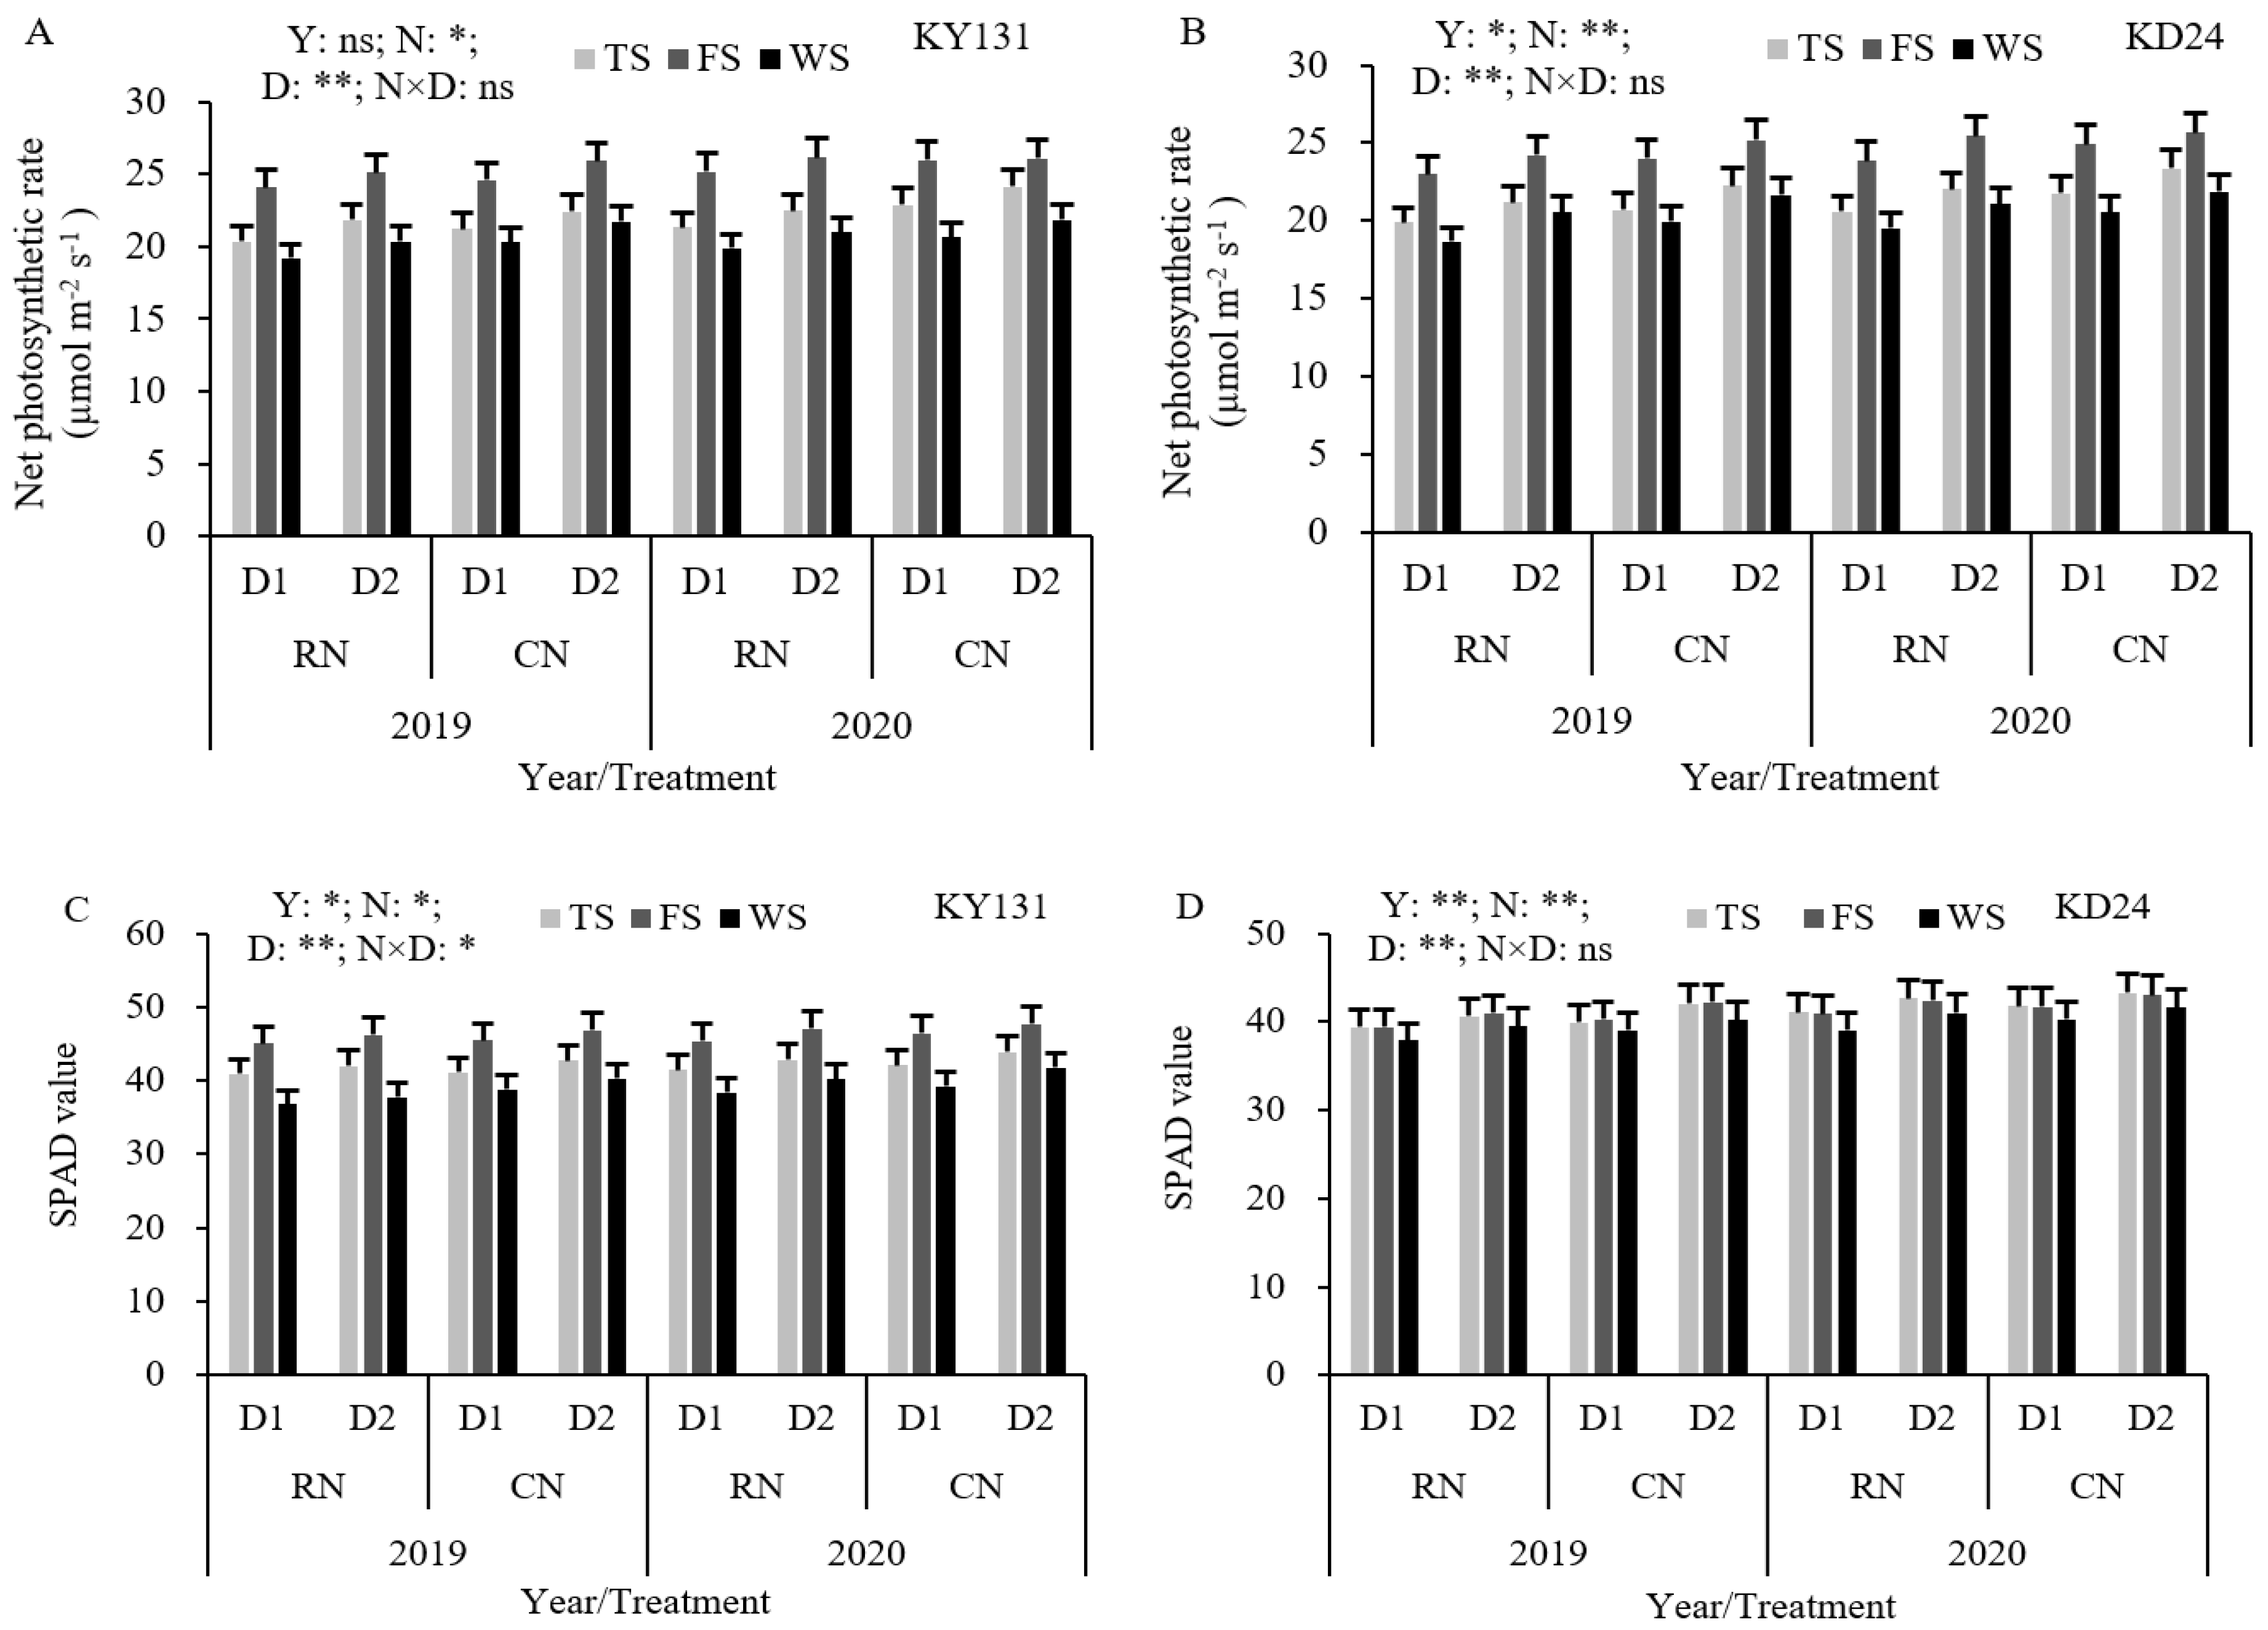
RN reduced the net photosynthetic rate (Pn) and SPAD values compared to CN, with differences across the growth stage and variety. Among them, Pn decreased by 5.08%, 2.67%, and 4.89% during the tillering, full heading, and wax maturity stages, respectively, with a significant decrease during tillering. KY131 exhibited the largest decrease before heading, and KD24 showed the most pronounced decrease after heading. Similarly, the SPAD values decreased by 1.79%, 1.74%, and 3.29%, respectively, but the decrease in each reproductive period was not significant (Figure 4). During the tillering, full heading, and wax maturity stages, the Pn of D1 decreased by 6.10%, 2.67%, and 6.75% compared to D2, respectively. KD24 exhibited a higher decrease than KY131 during the tillering and wax maturity stages (Figure 4). Compared to CND2, RND1 reduced the SPAD values and Pn during the tillering, full heading, and wax maturity stages. The SPAD values correlated with KY131 before heading and KD24 after heading, and the effect in KD24 was greater than KY131 during the tillering, full heading, and wax maturity stages. These results indicated that reducing N or increasing the density was not conducive to increasing the leaf SPAD values and the Pn of KD24, especially following heading.
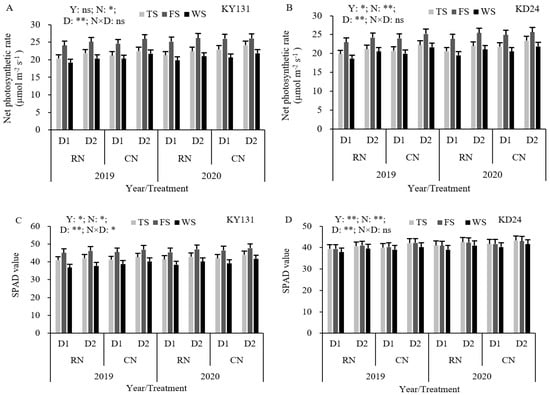
Figure 4.
Effect of reduced N and increased planting density on Pn (A,B) and SPAD values (C,D) of leaves in rice. CN: conventional N (120 kg ha−1); RN: basal N reduction (108 kg ha−1). D1: 33.3 × 10⁴ hills ha−1; D2: 27.8 × 10⁴ hills ha−1. TS: tillering stage; FS: full heading stage; WS: waxy ripe stage; ns: not significant at the 0.05 probability level. * and ** are significant at the 0.05 and 0.01 probability levels, respectively. The average deviation is used for the error line.
3.4. Agronomic Characteristics
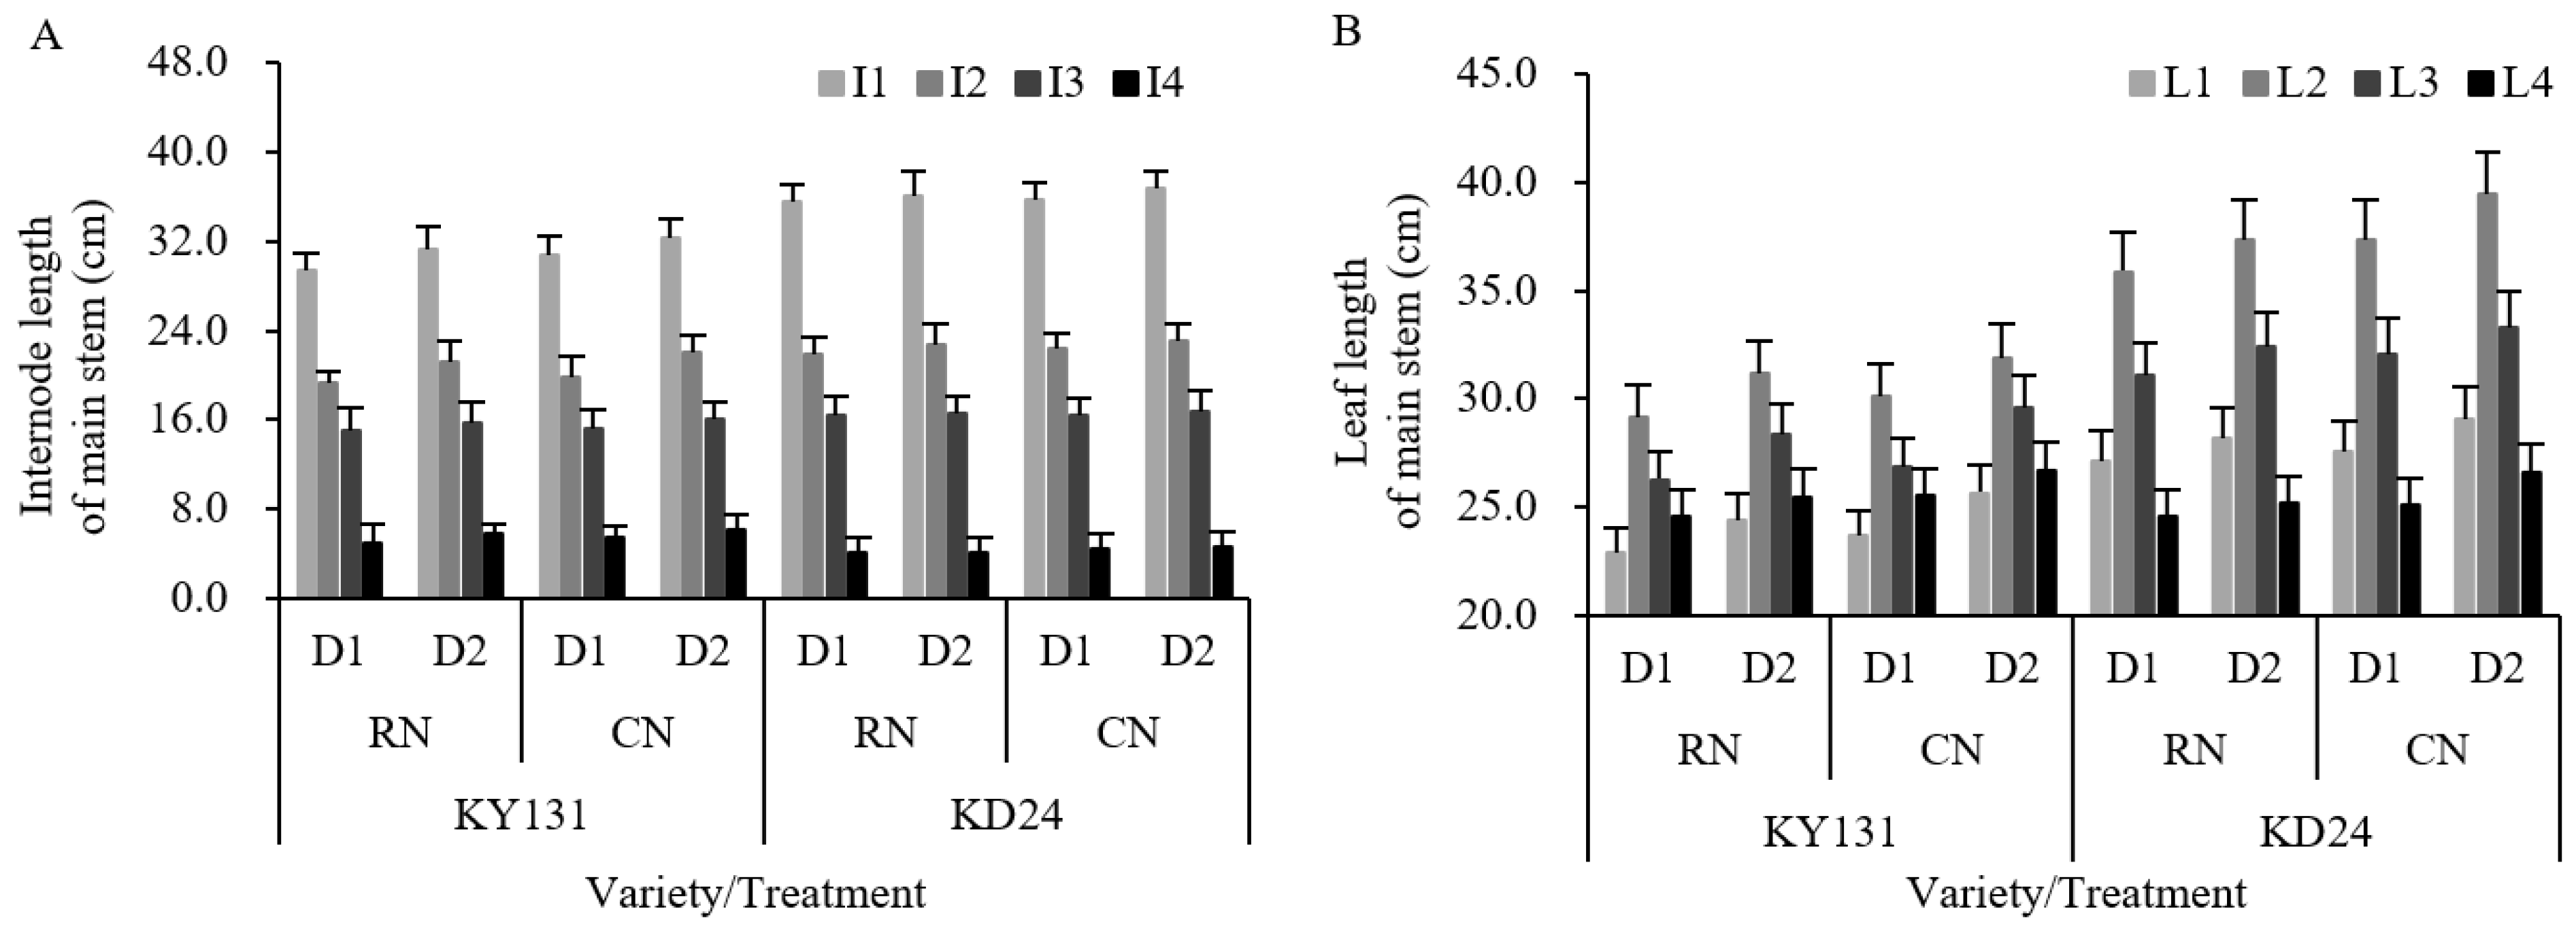
A reasonable allocation of agronomic characteristics allows for improving the photosynthetic capacity and yield potential of rice varieties. Differences in plant height, panicle length, internode length, leaf length, and width were observed between years and varieties. N significantly affected the leaf length and width, and the planting density significantly affected the plant height, internode length, leaf length, and leaf width. N fertilizer influenced the indexes of the agronomic characteristics of RN, causing them to be lower than CN, in which the decrease in the length of the fourth internode at the top of the main stem was most pronounced and significantly decreased, and the reduction of leaf length and width was 3.49% and 4.51%, respectively (Figure 5, Table 3). Planting density exerted effects on the plant height, internode length, leaf length, and width of D1, which were significantly lower than D2 (Figure 5, Table 3). The fourth internode from the top of the main stem decreased the most in length.
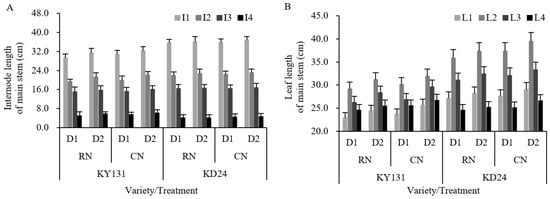
Figure 5.
Effect of reduced N and increased planting density on internode length (A) and leaf length (B) of the main stem of rice. CN: conventional N (120 kg ha−1); RN: basal N reduction (108 kg ha−1). D1: 33.3 × 10⁴ hills ha−1; D2: 27.8 × 10⁴ hills ha−1. I1: first internode from the top; I2: second internode from the top; I3: third internode from the top; I4: fourth internode from the top. L1: first leaf from the top; L2: second leaf from the top; L3: third leaf from the top; L4: fourth leaf from the top. The data in the figure is a two-year average. The average deviation is used for the error line.
Table 3.
Effect of reduced N and increased planting density on agronomic characteristics of rice.
The interaction between the variety and N application rate had a significant influence on the plant height, panicle length, and internode length, while the interaction between the variety and planting density had a significant or very significant impact on the plant height, internode length, leaf length, and leaf width. The N application rate and planting density interaction had a significant effect on the leaf length. Compared to CND2, RND1, RND2, and CND1 all reduced the indexes of the agronomic characteristics, and RND1 had the largest decrease, and the total leaf length and total width decreased significantly by 8.51% and 8.94%, respectively. The reduction in length of the first leaf to the fourth leaf at the top of the main stem was not apparent, but the reduction in internode length fluctuated substantially (Figure 5, Table 3).
3.5. Yield and Its Composition
The N application rate, planting density, and their interaction significantly impacted the yield and its components, but differences between the years and varieties were observed. Regarding the yield, the average decrease in RN was 2.68% higher than in CN, and the average reduction in KD24 was higher than in KY131; compared to D2, the average increase in D1 was 8.26%, and the increase in KD24 was higher than that of KY131. The yields per hectare of CND1 and RND1 were 10370.51 kg and 10097.42 kg, respectively, significantly increased by 8.21% and 5.36% compared to CND2, and the yield increasing effect of KD24 was more pronounced than KY131 (Table 4). Compared to CN, RN decreased the harvest index, effective panicle number, and filled grain number by 1.77%, 3.51%, and 4.25%, and the increased seed setting rate and 1000-grain weight by 1.86% and 1.01%, respectively. The number of effective panicles and filled grains of D1 significantly increased by 10.08% and 8.06% compared to D2, but the seed setting rate, 1000-grain weight, and harvest index decreased by 1.40%, 0.97%, and 3.28%, respectively (Table 4). The impact of RN and D1 on the yield and composition of KD24 was greater than KY131, and the intensity of their effect on variety was higher than the N application rate.
Table 4.
Effect of reduced N and increased planting density on yield and its components in rice.
The number of effective panicles and filled grains in RND1 increased by 10.83% and 8.06%, respectively, compared to RND2, while the seed setting rate, 1000-grain weight, and harvest index decreased by 1.39%, 1.27%, and 3.16%, respectively. Compared to CND2, the number of effective panicles and filled grains in CND1 increased by 9.36% and 8.02%, while the seed setting rate, 1000-grain weight, and harvest index decreased by 1.42%, 0.66%, and 3.39%, respectively (Table 4). These results indicated that the increasing influence of RND1 on the effective panicle number and grain number per ear was higher than under CN, but the decreasing effect on the seed setting rate, 1000-grain weight, and harvest index was not pronounced. Under the same planting density conditions, RN lowered the effective number of panicles, number of grains, and harvest index compared to CN and increased the seed setting rate and 1000-grain weight, but these changes were not significant. Further investigation indicated that relative to CND2, RND1 and CND1 increased the number of effective panicles and grains, with RND1 exhibiting an increase of 6.19% and 3.21% in effective panicles and grains, respectively, while CND1 showed a rise of 9.36% and 8.02%, respectively, suggesting that the increase in RND1 was lower than that in CND1. Conversely, RND1 was more conducive to an elevated seed setting rate and 1000-grain weight than CND2, and the effective panicle number and harvest index of KD24 were greater than KY131.
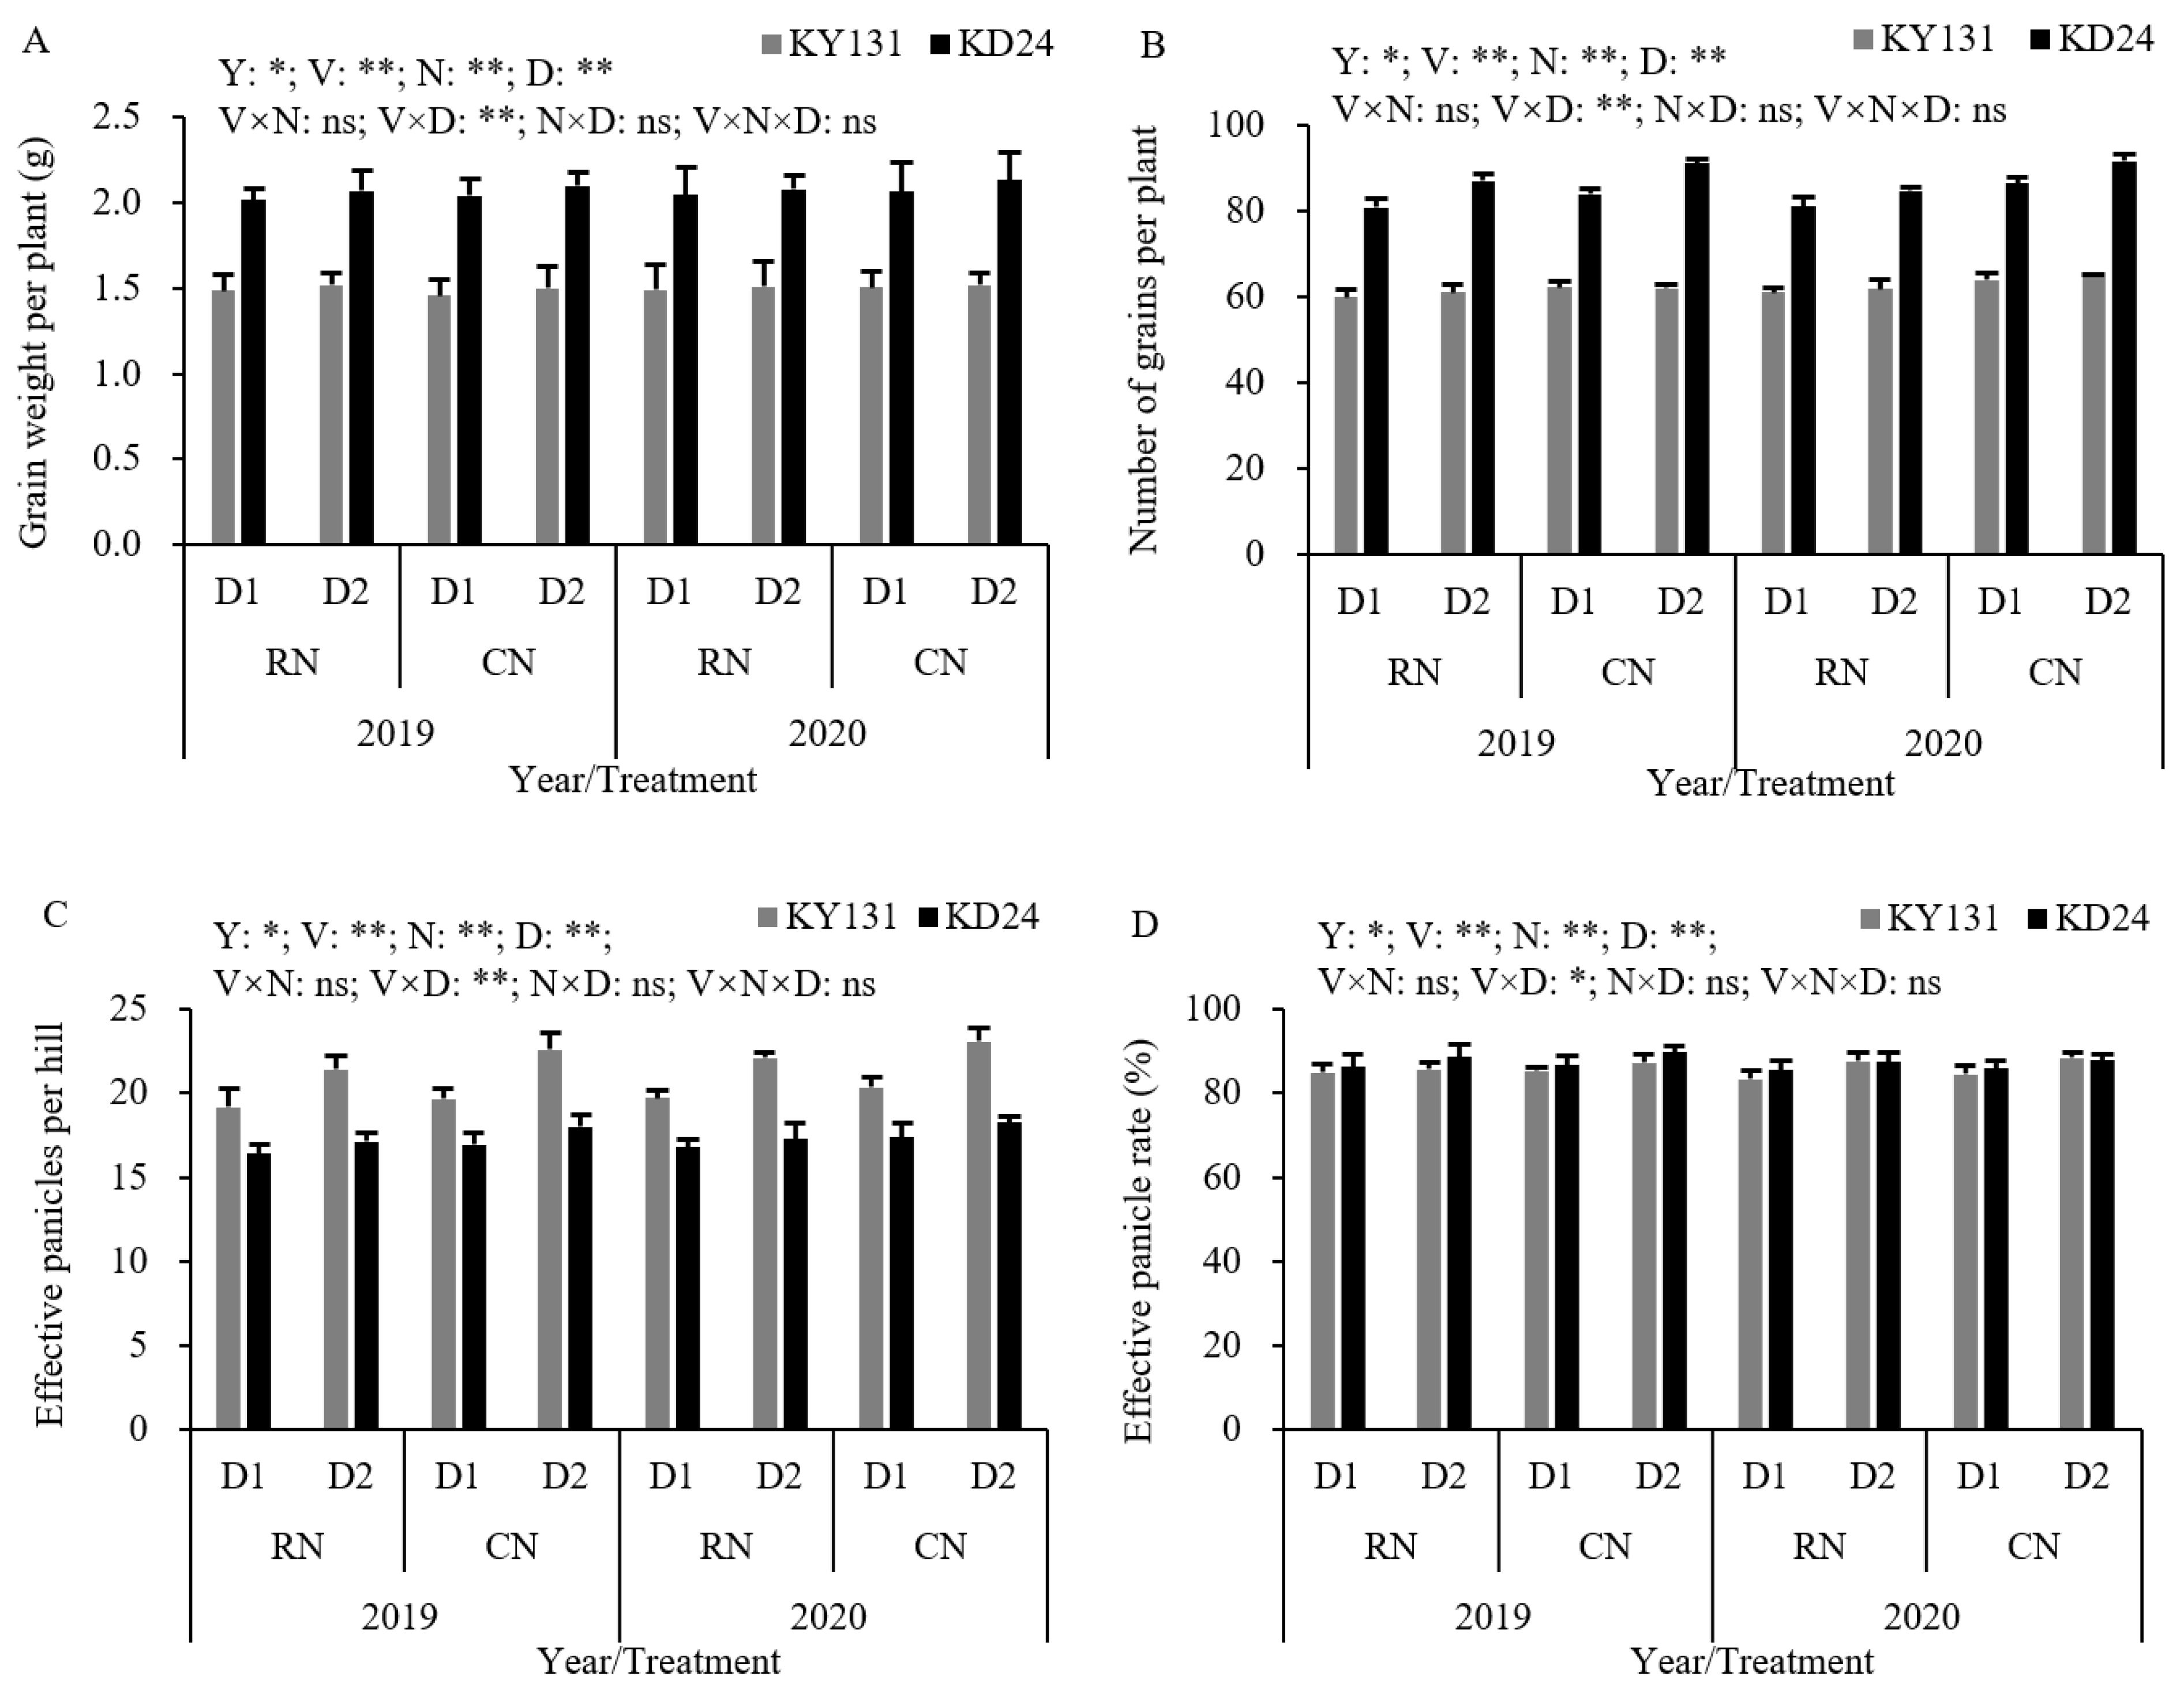
Compared to CN, the number of grains per panicle and panicles per hill were reduced by 4.50% and 4.03%, respectively, in RN. Compared to D2, D1 reduced the number of grains per panicle, grain weight per panicle, panicles per hill, and effective panicle rate, and the number of panicles per hill decreased by 8.01% (Figure 6). These findings suggest that RN was more unfavorable for the KD24 yield per unit, while D1 was more unfavorable for individual growth of KY131. The interaction effects between the N application rate and planting density suggested that RND1, RND2, and CND1 decreased the grain weight per panicle, grains per panicle, panicles per hill, and effective panicle rate compared to CND2, and the decreased intensity of RND1 was the most pronounced. Among the yield traits, the reduction in panicles per hill was the most clear, and the panicles per hill of RND1, CND1, and RND2 decreased by 12.03%, 9.31%, and 4.92%, respectively, compared with CND2 (Figure 6).
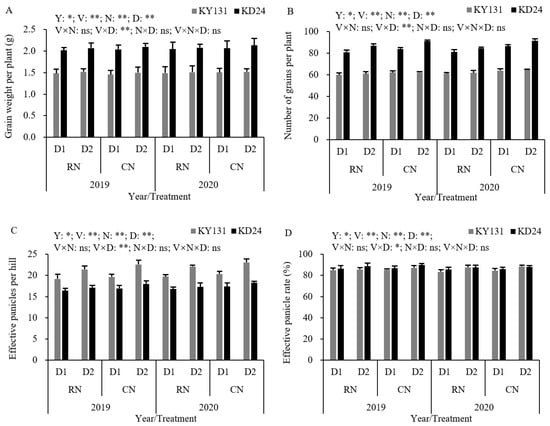
Figure 6.
Effect of reduced N and increased planting density on grain weight per panicle (A), grain number per panicle (B), panicle number per hill (C), and effective panicle percentage (D) of rice. CN: conventional N (120 kg ha−1); RN: basal N reduction (108 kg ha−1). D1: 33.3 × 10⁴ hills ha−1; D2: 27.8 × 10⁴ hills ha−1; ns: not significant at the 0.05 probability level. * and ** are significant at the 0.05 and 0.01 probability levels, respectively. The average deviation is used for the error line.
4. Discussion
4.1. Leaf Age and Tiller Number
The dynamic changes in the leaf age of the main stem of rice can be utilized to assess the organ growth process of rice before flag leaf development to govern the agronomic management of rice according to the leaf age before heading. The photosynthetic capacity of leaves reflects the crop growth, development, and dry matter production capacity. Regulating leaf growth dynamics through cultivation approaches can alter the leaf photosynthetic matter production capacity. Nitrogen and planting density influence the leaf emergence rate of rice, and the total number of leaves on the main stem shows a phenomenon of “increasing or decreasing leaves”. The higher the planting density or the lower the nitrogen application rate, the faster the appearance of the top leaves on the main stem [41]. In this study, RN or D1 had adverse effects on the leaf age growth process but were not significant. This suggested that N reduction and density increases were within the controllable range of the leaf age growth process. The effect of increasing planting density on leaf age was greater than the effect of reducing nitrogen.
Tillering is an essential agronomic characteristic affecting yield, closely related to the final effective panicle number, effective panicle rate, and grain number per panicle, reflecting individual robustness and population quality. However, the tillering characteristics change with different environments and cultivation approaches, in which the planting density and N are the primary factors affecting gramineous tillering [42]. Increasing planting density elevates the number of tillers per unit land area, while N reduction leads to a significant decrease in the number of tillers, suggesting that a higher planting density and plant N concentration are required for higher tiller numbers [9,14,43]. Although the N reduction treatment increased the panicle rate, the number of tillers decreased, leading to a decreased yield. Some scholars [44,45] have demonstrated that the dynamics of plant tillering are closely related to the number of leaves that have appeared on the main stem, and the tillering time halts prematurely with increased planting density. There were differences in the time required for KY131 and KD24 to reach their maximum tiller number due to differences in main stem leaf ages among rice varieties. However, reduced nitrogen or increased planting density did not significantly impact the joint expansion of leaves and tillers.
4.2. Dry Matter Accumulation and Transport
The yield of rice primarily arises from the accumulation, distribution, and transport of photosynthetic matter. Improving the capacity of dry matter accumulation and stem-sheath matter transport in the middle and later stages of rice growth has been hypothesized to be critical for yield formation [46,47,48]. Increasing the N and planting density to enhance crop yields has been reported previously [5,6,19,23]. N application can alter the accumulation and distribution of dry matter in plant organs and increase dry matter accumulation, and within a specific nitrogen application range, dry matter accumulation increases with an increased nitrogen application rate [4,49]. A reasonable planting density can provide suitable biomasses for populations, regulate conflicts between populations and individuals, and promote high yields [50]. In this study, RN lowered the biomass at various growth stages under the same planting density and increased the transport capacity of stems and sheaths. Under the same nitrogen application rate, increasing the planting density increased the population’s biomass and stem/sheath transport capacity. RND1 was more beneficial in alleviating the contradiction between population and individual and increased biomass more than CND2 [51]. RND1 also increased the stems/sheaths transport capacity from full heading to maturity by increasing population dry matter accumulation, compensating for the negative effect of N reduction on rice and enhancing yield potential [52].
4.3. Photosynthetic
The LAI, CGR, NAR, and chlorophyll content are crucial indicators of the photosynthetic capacity of leaves. Previous studies have demonstrated that keeping leaves green and prolonging the duration of canopy photosynthesis effectively increases biomass accumulation following flowering [53]. The N application rate and planting density can effectively regulate the horizontal tillering and vertical canopy distribution of crops, obtaining different light interception amounts. Applying N can promote canopy development and prolong the duration of green leaf areas by altering leaf morphology to increase their photosynthetic capacity. However, N reduction limits the photosynthetic capacity of leaves [54,55]. Under the same nitrogen application rate, increasing the planting density enhances the dry matter accumulation and leaf area of the population but inhibits the photosynthetic capacity of leaves in the lower portion of the canopy while reducing the chlorophyll content and leading to changes in the relationship between source and sink [56,57]. In this study, RN reduced the LAI, CGR, and NAR, while RND1 increased the LAI at the tillering and heading stages, and the CGR and NAR at each stage also increased. This suggested that RND1 could impact the population’s photosynthetic efficiency by regulating the spatial distribution of plant canopy, promoting the full utilization of leaf photosynthetic capacity, and improving pre-heading dry matter accumulation and stems/sheaths transport capacity [58].
This study determined that during the growth and development of Japonica rice, the SPAD value and Pn of leaves peaked during the heading and flowering stages. After flowering, the dominance of the chlorophyll content and photosynthetic rate gradually transferred from the lower leaves to the upper leaves, decreasing the SPAD value and Pn of the leaves, and the photosynthetic capacity gradually weakened. Therefore, an appropriate adjustment of the planting density has a positive effect on rice photosynthetic matter production capacity, but a density that is too high will reduce leaf photosynthetic capacity and accelerate chlorophyll degradation after anthesis [59]. RN or D1 were not conducive to increased SPAD and Pn in leaves at each growth stage, and the effect of a decrease at the tillering stage was significant, potentially due to the reduction of N in basal fertilizer. Therefore, the interaction between N reduction and planting density will inform how to increase the green leaf area or prolong the duration of greenness to promote dry matter accumulation and yield formation [60,61].
4.4. Agronomic Characteristics, Yield, and Its Components
Regarding rice population quality, changes in the plant height, panicle length, internode length, leaf morphology, and tiller number change the population structure. The rational allocation of plant height and tiller number can enhance the population’s vertical and horizontal canopy structure, enable the coordinated development of the population and individuals, and promote dry matter production of source organs and dry matter accumulation of sink organs. Nitrogen and planting density are the key cultivation features affecting plant height, leaf morphology, and leaf quantity, and plant height and leaf morphology are closely tied to the plant growth rate and final yield. Studies have demonstrated that leaf morphology is influenced by genotype, environmental conditions, and cultivation practices. The increase or decrease in nitrogen and planting density can cause adaptive changes in plant height, internodes, and leaf morphology [62,63], resulting in changes in the LAI, SPAD values, and Pn [64]. This study identified that RN reduced the indexes of the agronomic characteristics under the same density. Under the same nitrogen application rate, increasing the planting density lowered the plant’s height, internode length, leaf length, and leaf width and produced a stronger impact on the leaves than the internode length. RND1 altered the original agronomic characteristics of plants and weakened the photosynthetic capacity of canopy leaves. Therefore, a varied nitrogen application rate, planting density, and their interaction can alter the aboveground dry matter accumulation capacity by regulating the morphological characteristics of the internodes and leaves. This alters the interception and assimilation of light energy by canopy leaves [54,55].
Yield is the final outcome of the combination of effective panicles per unit area, grains per panicle, grain weight per panicle, seed setting rate, and 1000-grain weight. The analysis of yield components assists in characterizing the factors that limit yield formation. Some studies determined that increasing the number of effective panicles and grains per square meter was critical to increasing the yield [65]. However, some studies indicated that increasing the number of effective panicles per square meter while reducing grain weight per panicle increases the yield [66]. Reasonably increasing the grain weight per panicle based on a certain number of effective panicles and coordinating the relationship among grains per panicle, seed setting rate, and 1000-grain weight can also enhance yields [67]. Under the same N application conditions, the crop yield increased with planting density over a defined range, but the increase led to a reduction in grain number per panicle and 1000-grain weight [49,68]. However, high N and density significantly lowered the grain weight and 1000-grain weight and inhibited an increase in grains per panicle [69]. High planting density also led to an unreasonable canopy structure and decreased the number of panicles and grains per panicle [70]. The effects of the N application rate and planting density on yields and its components were limited by year and variety [71]. In our study, N reduction reduced the effective panicles per square meter, filled grains and grain yield, harvest index, panicles per hill, and grains per panicle under the same planting density. Under the same nitrogen application rate, the elevated planting density significantly increased the number of effective panicles and grain filling, accounting for the decrease in other yield components and improved grain yield. RND1 reduced the harvest index, weight per panicle, number of grains per panicle, number of grains per hill, and effective panicle rate, as well as increased the number of effective panicles, number of filled grains, and grain yield. KD24 had a higher yield increase effect than KY131. The regulation of nitrogen and planting density is critical in the growth, development, population formation, and yield formation of rice.
5. Conclusions
Examining the yield formation and photosynthetic production characteristics of rice under reduced N and an increased density will assist in the development of new high-yield and efficient planting approaches for rice in colder regions. In this study, the RND1 interaction mode had a higher number of tillers in the population relative to CND2, as well as an increased leaf area index during the tillering and heading stages and enhanced agronomic traits between canopy layers. Additionally, under RND1, the complete use of the leaf photosynthetic capacities of KD24 and KY131 was promoted, increasing the biomass, dry matter accumulation, and the transformation ability of stems/sheaths were increased, realizing the potential for yield increase. The yield increase effect of KD24 was higher than that of KY131. In cold rice cultivation, the RND1 (108 kg ha−1 compared to 33.3 × 10⁴ hills ha−1) interaction mode represented a novel combination for achieving high-yield and high-efficiency rice cultivation.
Author Contributions
This manuscript was reviewed and approved for publication by all authors. L.Z. conceived and designed the experiments, performed the experiments, and wrote the paper. H.Z. analyzed the data and drew the figures. The other authors revised the paper. All authors have read and agreed to the published version of the manuscript.
Funding
This research was supported by the Program for Scientific Research Start-up Funds of Guangdong Ocean University (060302052010), the National 12th five-year Science and Technology support Plan (2012BAD20B0402), the Special Funds for Scientific Research in Public Welfare Industries (Agriculture) (201303102), and the National Key R & D Program of the 13th five-year Plan (2016YFD 0300504).
Data Availability Statement
The datasets generated and analyzed during the current study are not publicly available due to this experiment being a collaborative effort; the trial data do not belong to me alone but are available from the corresponding author at reasonable request.
Acknowledgments
The authors acknowledge the usage of ZhiyunV8.4 software (www.zhiyunwenxian.cn, accessed on 15 June 2024), an AI editing tool, to enhance the English language presentation of the manuscript.
Conflicts of Interest
The authors declare no conflicts of interest.
References
- Wu, P.; Chen, T.Y.; Yuan, J.Q.; Huang, H.; Xing, Z.P.; Hu, Y.J.; Zhu, M.; Li, D.J.; Liu, G.L.; Zhang, H.C. Effects of interaction between nitrogen application rate and direct-sowing density on yield formation characteristics of rice. Chin. J. Rice Sci. 2019, 33, 269–281. [Google Scholar] [CrossRef]
- Wang, D.; Li, G.G.; Mo, Y.; Cai, M.K.; Bian, X.Y. Evaluation of optimal nitrogen rate for corn production under mulched drip fertigation and economic benefits. Field Crop. Res. 2018, 216, 225–233. [Google Scholar] [CrossRef]
- Li, R.F.; Liu, P.; Dong, S.T.; Zhang, J.W.; Zhao, B. Increased maize plant population induced leaf senescence, suppressed root growth, nitrogen uptake, and grain yield. Agron. J. 2019, 111, 1581–1591. [Google Scholar] [CrossRef]
- Kitonyo, O.M.; Sadras, V.O.; Zhoua, Y.; Denton, M.D. Nitrogen supply and sink demand modulate the patterns of leaf senescence in maize. Field Crop. Res. 2018, 225, 92–103. [Google Scholar] [CrossRef]
- Fageria, N.K.; Baligar, V.C. Enhancing nitrogen use efficiency in crop plants-science direct. Adv. Agron. 2005, 88, 97–185. [Google Scholar] [CrossRef]
- Marques, G.; Aguiar, A.; Macedo, V.; Alves, E.; Moura, E.G. Nitrogen use and protein yield of two maize cultivars in cohesive tropical soil. J. Agric. Sci. 2017, 9, 193–201. [Google Scholar] [CrossRef]
- Liu, G.; Hou, P.; Xie, R.; Ming, B.; Wang, K.; Liu, W. Nitrogen uptake and response to radiation distribution in the canopy of high-yield maize. Crop Sci. 2019, 59, 1236–1247. [Google Scholar] [CrossRef]
- Zheng, B.Q.; Jiang, J.L.; Wang, L.L.; Huang, M.; Zhou, Q.; Cai, J.; Wang, X.; Dai, T.B.; Jiang, D. Reducing nitrogen rate and increasing plant density accomplished high yields with satisfied grain quality of soft wheat via modifying the free amino acid supply and storage protein gene expression. J. Agric. Food Chem. 2022, 70, 2146–2159. [Google Scholar] [CrossRef] [PubMed]
- Zhong, X.; Peng, S.; Sheehy, J.; Visperas, R.; Liu, H. Relationship between tillering and leaf area index: Quantifying critical leaf area index for tillering in rice. J. Agric. Sci. 2002, 138, 269–279. [Google Scholar] [CrossRef]
- Correndo, A.A.; Rotundo, J.L.; Tremblay, N.; Archontoulis, S.; Coulter, J.A.; RuizDiaz, D.; Schwalbert, R. Assessing the uncertainty of maize yield without nitrogen fertilization. Field Crop. Res. 2021, 260, 107985. [Google Scholar] [CrossRef]
- Wu, K.; Wang, S.S.; Song, W.Z.; Zhang, J.P.; Wang, Y.; Liu, Q.; Yu, J.P.; Ye, Y.F.; Li, S.; Chen, J.F.; et al. Enhanced sustainable green revolution yield via nitrogen-responsive chromatin modulation in rice. Science 2020, 367, eaaz2046. [Google Scholar] [CrossRef] [PubMed]
- Zheng, J.; Fan, J.L.; Zhang, F.C.; Guo, J.J.; Yan, S.C.; Zhuang, Q.L.; Cui, N.B.; Guo, L. Interactive effects of mulching practice and nitrogen rate on grain yield, water productivity, fertilizer use efficiency and greenhouse gas emissions of rainfed summer maize in northwest China. Agric. Water Manag. 2021, 248, 106778. [Google Scholar] [CrossRef]
- Zhang, J.J.; He, P.; Ding, W.C.; Ullah, S.; Abbas, T.; Li, M.Y.; Ai, C.; Zhou, W. Identifying the critical nitrogen fertilizer rate for optimum yield and minimum nitrate leaching in a typical field radish cropping system in China. Environ. Pollut. 2021, 268, 115004. [Google Scholar] [CrossRef] [PubMed]
- Zhong, X.H.; Peng, S.B.; Sanico, A.L.; Liu, H.X. Quantifying the interactive effect of leaf nitrogen and leaf area on tillering of rice. J. Plant Nutr. 2003, 26, 1203–1222. [Google Scholar] [CrossRef]
- Wu, H.; Xiang, J.; Zhang, Y.; Zhang, Y.; Peng, S.; Chen, H.; Zhu, D. Effects of post-anthesis nitrogen uptake and translocation on photosynthetic production and rice yield. Sci. Rep. 2018, 8, 12891. [Google Scholar] [CrossRef] [PubMed]
- Gao, H.X.; Zhang, C.C.; Van, D.W.W.; Ning, P.; Zhang, Z.; Wan, S.B.; Zhang, F.S. Intercropping modulates the accumulation and translocation of dry matter and nitrogen in maize and peanut. Field Crop. Res. 2022, 284, 108561. [Google Scholar] [CrossRef]
- Assefa, Y.; Vara Prasad, P.V.; Carter, P.; Hinds, M.; Bhalla, G.; Schon, R.; Jeschke, M.; Paszkiewicz, S.; Ciampitti, I.A. Yield responses to planting density for US modern corn hybrids: A synthesis-analysis. Crop Sci. 2016, 56, 2802–2817. [Google Scholar] [CrossRef]
- Zhang, M.; Chen, T.; Latifmanesh, H.; Feng, X.M.; Cao, T.H.; Qian, C.R.; Deng, A.X.; Song, Z.W.; Zhang, W.J. How plant density affects maize spike differentiation, kernel set, and grain yield formation in Northeast China? J. Integr. Agric. 2018, 17, 1745–1757. [Google Scholar] [CrossRef]
- Guo, Q.; Huang, G.M.; Guo, Y.L.; Zhang, M.C.; Zhou, Y.Y.; Duan, L.S. Optimizing irrigation and planting density of spring maize under mulch drip irrigation system in the arid region of northwest China. Field Crop. Res. 2021, 266, 108141. [Google Scholar] [CrossRef]
- Zheng, B.Q.; Zhang, X.Q.; Wang, Q.; Li, W.Y.; Huang, M.; Zhou, Q.; Cai, J.; Wang, X.; Cao, W.X.; Dai, T.B.; et al. Increasing plant density improves grain yield, protein quality and nitrogen agronomic efficiency of soft wheat cultivars with reduced nitrogen rate. Field Crop. Res. 2021, 267, 108–145. [Google Scholar] [CrossRef]
- Zhang, K.; Liu, X.J.; Ma, Y.; Wang, Y.Y.; Cao, Q.; Zhu, Y.; Cao, W.X.; Tian, Y.C. A new canopy chlorophyll index-based paddy rice critical nitrogen dilution curve in eastern China. Field Crop. Res. 2021, 266, 108139. [Google Scholar] [CrossRef]
- Hayashi, S.; Kamoshita, A.; Yamagishi, J. Effect of planting density on grain yield and water productivity of rice (Oryza sativa L.) grown in flooded and non-flooded fields in Japan. Plant Prod. Sci. 2006, 9, 298–311. [Google Scholar] [CrossRef]
- Nakano, H.; Morita, S.; Kitagawa, H.; Wada, H.; Takahashi, M. Grain yield response to planting density in forage rice with a large number of spikelets. Crop Sci. 2012, 52, 345–350. [Google Scholar] [CrossRef]
- Zhang, P.; Yan, Y.; Gu, S.; Wang, Y.; Xu, C.; Sheng, D.; Li, Y.; Wang, P.; Huang, S. Lodging resistance in maize: A function of root-shoot interactions. Eur. J. Agric. 2022, 132, 126393. [Google Scholar] [CrossRef]
- Duan, F.; Wei, Z.; Soualiou, S.; Zhou, W. Nitrogen partitioning in maize organs and underlined mechanisms from different plant density levels and N application rate in China. Field Crop. Res. 2023, 294, 108874. [Google Scholar] [CrossRef]
- Testa, G.; Reyneri, A.; Blandino, M. Maize grain yield enhancement through high plant density cultivation with different inter-row and intra-row spacings. Eur. J. Agric. 2016, 72, 28–37. [Google Scholar] [CrossRef]
- Xue, J.; Xie, R.Z.; Zhang, W.F.; Wang, K.R.; Hou, P.; Ming, B.; Gou, L.; Li, S.K. Research progress on reduced lodging of high-yield and-density maize. J. Integr. Agric. 2017, 16, 2717–2725. [Google Scholar] [CrossRef]
- Clerget, B.; Bueno, C.; Domingo, A.J.; Layaoen, H.L.; Vial, L. Leaf emergence, tillering, plant growth, and yield in response to plant density in a high-yielding aerobic rice crop. Field Crop. Res. 2016, 199, 52–64. [Google Scholar] [CrossRef]
- Xu, C.L.; Huang, S.B.; Tian, B.J.; Ren, J.H.; Meng, Q.F.; Wang, P. Manipulating planting density and nitrogen fertilizer application to improve yield and reduce environmental impact in Chinese maize production. Front. Plant Sci. 2017, 8, 1234. [Google Scholar] [CrossRef]
- Guo, Y.; Yin, W.; Fan, H.; Fan, Z.L.; Hu, F.L.; Yu, A.Z.; Zhao, C.; Chai, Q.; Zhang, X.J. Photosynthetic physiological characteristics of water and nitrogen coupling for enhanced high-density tolerance and increased yield of maize in arid irrigation regions. Front. Plant Sci. 2021, 12, 726568. [Google Scholar] [CrossRef]
- Zhang, Y.H.; Wang, R.; Wang, S.L.; Ning, F.; Wang, B.; Wen, P.F.; Li, A.; Dong, Z.Y.; Xu, Z.G.; Zhang, Y.J.; et al. Effect of planting density on deep soil water and maize yield on the Loess Plateau of China. Agric. Water Manag. 2019, 223, 105655. [Google Scholar] [CrossRef]
- Huang, L.Y.; Yang, D.S.; Li, X.X.; Peng, S.B.; Wang, W. Coordination of high grain yield and high nitrogen use efficiency through large sink size and high post-heading source capacity in rice. Field Crop. Res. 2019, 233, 49–58. [Google Scholar] [CrossRef]
- Zheng, H.B.; Chen, Y.W.; Chen, Q.M.; Li, B.; Zhang, Y.S.; Jia, W.; Mo, W.W.; Tang, Q.Y. High-density planting with lower nitrogen application increased early rice production in a double-season rice system. Agron. J. 2020, 112, 205–214. [Google Scholar] [CrossRef]
- Fu, Y.Q.; Zhong, X.H.; Zeng, J.H.; Liang, K.M.; Pan, J.F.; Xin, Y.F.; Liu, Y.Z.; Hu, X.Y.; Peng, B.L.; Chen, R.B.; et al. Improving grain yield, nitrogen use efficiency and radiation use efficiency by dense planting, with delayed and reduced nitrogen application, in double cropping rice in South China. J. Integr. Agric. 2021, 20, 565–580. [Google Scholar] [CrossRef]
- Chong, H.T.; Jiang, Z.Y.; Shang, L.Y.; Shang, C.; Deng, J.; Zhang, Y.B.; Huang, L.Y. Dense planting with reduced nitrogen input improves grain yield, protein quality, and resource use efficiency in hybrid rice. J. Plant Growth Regul. 2023, 42, 960–972. [Google Scholar] [CrossRef]
- Zhao, L.M.; Zheng, D.F.; Feng, N.J.; Shen, X.F.; Huang, A.Q.; Wang, Y.X.; Jiang, W.X. Effects of tillage and plant growth regulators on the yield and photosynthetic characteristics of high-quality japonica rice. Trans. Chin. Soc. Agric. Eng. 2022, 38, 93–103. (In Chinese) [Google Scholar] [CrossRef]
- Pommel, B.; Gallais, A.; Coque, M.; Quillere, I.; Hirel, B.; Prioul, J.L.; Andrieu, B.; Floriot, M. Carbon and nitrogen allocation and grain filling in three maize hybrids differing in leaf senescence. Eur. J. Agron. 2006, 24, 203–211. [Google Scholar] [CrossRef]
- Zhang, H.; Yu, C.; Kong, X.; Hou, D.; Gu, J.; Liu, L.; Wang, Z.; Yang, J. Progressive integrative crop managements increase grain yield, nitrogen use efficiency and irrigation water productivity in rice. Field Crop Res. 2018, 215, 1–11. [Google Scholar] [CrossRef]
- Ding, C.; Zhu, X.H.; Xu, C.S.; Cambula, E.; Lu, B.; Luo, X.K.; Wu, Q.; Zhong, Q.Y.; Xu, X.; Liu, Z.H.; et al. Yield potential of machine-transplanted rice and correlation of crop-growing rate during grain-filling stage. Agronomy 2022, 12, 2299. [Google Scholar] [CrossRef]
- Zou, J.N.; Pang, Z.Q.; Li, Z.; Guo, C.L.; Lin, H.M.; Li, Z.; Chen, H.F.; Huang, J.W.; Chen, T.; Xu, H.L.; et al. The underlying mechanism of variety-water-nitrogen-stubble damage interactions on yield formation in ratoon rice with low stubble height under mechanized harvesting. J. Integr. Agric. 2024, 23, 806–823. [Google Scholar] [CrossRef]
- Martínez-Eixarch, M.; Zhu, D.F.; Catalá-Forner, M.D.M.; Pla-Mayor, E.; Tomás-Navarro, N. Water, nitrogen and plant density affect the response of leaf appearance of direct seeded rice to thermal time. Rice Sci. 2013, 20, 52–60. [Google Scholar] [CrossRef]
- Wu, G.; Wilson, L.T.; McClung, A.M. Contribution of rice tillers to dry matter accumulation and yield. Agron. J. 1998, 90, 317–323. [Google Scholar] [CrossRef]
- Li, X.Y.; Zuo, Q.S.; Chang, H.B.; Bai, G.P.; Kuai, J.; Zhou, G.S. Higher density planting benefits mechanical harvesting of rapeseed in the Yangtze River basin of China. Field Crop. Res. 2018, 218, 97–105. [Google Scholar] [CrossRef]
- Yoshida, S.; Hayakawa, Y. Effects of mineral nutrition on tillering of rice. Soil Sci. Plant Nutr. 1970, 16, 186–191. [Google Scholar] [CrossRef]
- Dreccer, M.F.; Chapman, S.C.; Rattey, A.R.; Neal, J.; Song, Y.; Christopher, J.T.; Reynolds, M. Developmental and growth controls of tillering and water-soluble carbohydrate accumulation in contrasting wheat (Triticum aestivum L.) genotypes: Can we dissect them? J. Exp. Bot. 2013, 64, 143–160. [Google Scholar] [CrossRef]
- Zhang, Y.B.; Tang, Q.Y.; Zou, Y.B.; Li, D.Q.; Qin, J.P.; Yang, S.G.; Chen, L.G.; Xia, B.; Peng, S.B. Yield potential and radiation use efficiency of “super” hybrid rice grown under subtropical conditions. Field Crop. Res. 2009, 114, 91–98. [Google Scholar] [CrossRef]
- Pal, R.; Mahajan, G.; Sardana, V.; Chauhan, B.S. Impact of sowing date on yield, dry matter and nitrogen accumulation, and nitrogen translocation in dry-seeded rice in North-West India. Field Crop. Res. 2017, 206, 138–148. [Google Scholar] [CrossRef]
- Yang, Z.F.; Naoto, I.; Kaori, F. Analysis of dry-matter translocation during grain filling stage of rice. Jpn. J. Crop Sci. 2004, 73, 416–423. [Google Scholar] [CrossRef]
- Westgate, M.E.; Forcella, F.; Reicosky, D.C.; Somsen, J. Rapid canopy closure for maize production in the northern US corn belt: Radiation-use efficiency and grain yield. Field Crop. Res. 1997, 49, 249–258. [Google Scholar] [CrossRef]
- Wang, S.H.; Yang, Z.X.; Shi, J.L.; Li, H.T.; Song, X.L.; Sun, X.Z. Effects of increasing planting density and decreasing nitrogen rate on dry matter, nitrogen accumulation and distribution, and yield of cotton. Acta Agron. Sin. 2020, 46, 395–407. (In Chinese) [Google Scholar] [CrossRef]
- Cao, Y.J.; Wang, L.C.; Gu, W.R.; Wang, Y.J.; Zhang, J.H. Increasing photosynthetic performance and post-silking nitrogen uptake by moderate decreasing leaf source of maize under high planting density. J. Integr. Agric. 2021, 20, 494–510. [Google Scholar] [CrossRef]
- Zhang, L.; Jiang, P.; Gou, X.Q.; Zhou, X.B.; Zhu, Y.C.; Liu, M.; Xiong, H.; Xu, F.X. Integrated water and nitrogen management practices to enhance yield and environmental goals in rice-ratoon rice systems. Agron. J. 2019, 111, 2821–2831. [Google Scholar] [CrossRef]
- Kumar, R.; Bishop, E.; Bridges, W.C.; Tharayil, N.; Sekhon, R.S. Sugar partitioning and source-sink interaction are key determinants of leaf senescence in maize. Plant Cell Environ. 2019, 42, 2597–2611. [Google Scholar] [CrossRef]
- Li, Y.Y.; Ming, B.; Fan, P.P.; Liu, Y.; Wang, K.; Hou, P.; Xue, J.; Li, S.K. Quantifying contributions of leaf area and longevity to leaf area duration under increased planting density and nitrogen input regimens during maize yield improvement. Field Crop. Res. 2022, 283, 108551. [Google Scholar] [CrossRef]
- Yang, H.K.; Li, J.G.; Wu, G.; Huang, X.L.; Fan, G.Q. Maize straw mulching with no-tillage increases fertile spike and grain yield of dryland wheat by regulating root soil interaction and nitrogen nutrition. Soil Till. Res. 2023, 228, 105652. [Google Scholar] [CrossRef]
- Zhang, D.S.; Sun, Z.X.; Feng, L.S.; Bai, W.; Yang, N.; Zhang, Z.; Du, G.J.; Feng, C.; Cai, Q.; Wang, Q.; et al. Maize plant density affects yield, growth and source-sink relationship of crops in maize/peanut intercropping. Field Crop. Res. 2020, 257, 107926. [Google Scholar] [CrossRef]
- Gao, J.; Lei, M.; Yang, L.J.; Wang, P.; Tao, H.B.; Huang, S.B. Reduced row spacing improved yield by optimizing root distribution in maize. Eur. J. Agron. 2021, 127, 126291. [Google Scholar] [CrossRef]
- Yang, J.S.; Gao, H.Y.; Peng, L.; Geng, L.I.; Dong, S.T.; Zhang, J.W. Effects of planting density and row spacing on canopy apparent photosynthesis of high-yield summer corn. Acta Agron. Sin. 2010, 36, 1226–1235. (In Chinese) [Google Scholar] [CrossRef]
- Khanna-Chopra, R.; Maheswari, M. Effect of altering source availability on expression of sink capacity in a maize hybrid and its parents. Eur. J. Agron. 1998, 9, 101–107. [Google Scholar] [CrossRef]
- Ciampitti, I.A.; Zhang, H.; Rriedemann, P.; Vyn, T.J. Potential physiological frameworks for mid-season field phenotyping of final plant nitrogen uptake, nitrogen use efficiency and grain yield in maize. Crop Sci. 2012, 52, 2728–2742. [Google Scholar] [CrossRef]
- Hisse, I.R.; D’Andrea, K.E.; Otegui, M.E. Source-sink relations and kernel weight in maize inbred lines and hybrids: Responses to contrasting nitrogen supply levels. Field Crop. Res. 2019, 230, 151–159. [Google Scholar] [CrossRef]
- Peng, S.; Cassman, K.G.; Virmani, S.S.; Sheehy, J.; Khush, G.S. Yield potential trends of tropical rice since the release of IR8 and the challenge of increasing rice yield potential. Crop Sci. 1999, 39, 1552–1559. [Google Scholar] [CrossRef]
- Dong, S.X.; Zhang, J.; Zha, T.; Dai, X.L.; He, M.R. Increased plant density with reduced nitrogen input can improve nitrogen use efficiency in winter wheat while maintaining grain yield. Arch. Agron. Soil Sci. 2019, 14, 1707–1720. [Google Scholar] [CrossRef]
- Wei, Z.; Ren, T.H.; Huang, X.Y.; Xu, Z.; Zhou, Y.Z.; Yin, C.L.; Zhao, R.; Liu, S.B.; Ning, T.Y.; Li, G. Leaf shape, planting density, and nitrogen application affect soybean yield by changing direct and diffuse light distribution in the canopy. Plant Physiol. Bioch. 2023, 204, 108071. [Google Scholar] [CrossRef]
- Huang, M.; Jiang, L.G.; Xia, B.; Zou, Y.B.; Jiang, P.; Ao, H.J. Yield gap analysis of super hybrid rice between two subtropical environments. Aust. J. Crop Sci. 2013, 7, 600–608. [Google Scholar]
- Zhu, Y.G.; Chu, J.P.; Dai, X.L.; He, M.R. Delayed sowing increases grain number by enhancing spike competition capacity for assimilates in winter wheat. Eur. J. Agron. 2019, 104, 49–62. [Google Scholar] [CrossRef]
- Masaki, O.; Jun, H.; Kenji, N.; Kentaro, K.; Daisuke, S.; Yumiko, A.S.; Nobuya, K.; Motohiko, K. Cross-locational experiments to reveal yield potential and yield-determining factors of the rice cultivar ‘Hokuriku 193’ and climatic factors to achieve high brown rice yield over 1.2 kg hm−2 at Nagano in central inland of Japan. Plant Prod. Sci. 2022, 25, 131–147. [Google Scholar] [CrossRef]
- Postma, J.A.; Hecht, V.L.; Hikosaka, K.; Nord, E.A.; Pons, T.L.; Poorter, H. Dividing the pie: A quantitative review on plant density responses. Plant Cell Environ. 2021, 44, 1072–1094. [Google Scholar] [CrossRef]
- Liu, Y.; Liao, Y.C.; Liu, W.Z. High nitrogen application rate and planting density reduce wheat grain yield by reducing filling rate of inferior grain in middle spikelets. Crop J. 2021, 9, 412–426. [Google Scholar] [CrossRef]
- Sangoi, L.; Ender, M.; Guidolin, A.F.; Bogo, A.; Kothe, D.M. Disease incidence and severity of four maize hybrids grown at different plant densities. Ciência Rural. 2000, 30, 17–21. [Google Scholar] [CrossRef]
- Assefa, Y.; Carter, P.; Hinds, M.; Bhalla, G.; Schon, R.; Jeschke, M.; Paszkiewicz, S.; Smith, S.; Ciampitti, I.A. Analysis of long term study indicates both agronomic optimal plant density and increase maize yield per plant contributed to yield gain. Sci. Rep. 2018, 8, 4937. [Google Scholar] [CrossRef] [PubMed]

Disclaimer/Publisher’s Note: The statements, opinions and data contained in all publications are solely those of the individual author(s) and contributor(s) and not of MDPI and/or the editor(s). MDPI and/or the editor(s) disclaim responsibility for any injury to people or property resulting from any ideas, methods, instructions or products referred to in the content. |
© 2024 by the authors. Licensee MDPI, Basel, Switzerland. This article is an open access article distributed under the terms and conditions of the Creative Commons Attribution (CC BY) license (https://creativecommons.org/licenses/by/4.0/).