Article

Comprehensive Identification of Rhubarb Species Based on DNA Barcoding and Multiple-Indicator Quantification

1
Key Laboratory of Specialty Agri-Product Quality and Hazard Controlling Technology of Zhejiang Province, College of Life Science, China Jiliang University, Hangzhou 310018, China
2
Department of Modern Agricultural Technology, Chengdu Agricultural College, Chengdu 611130, China
3
Meitang Agriculture (Hangzhou) Co., Ltd., Hangzhou 311116, China
*
Author to whom correspondence should be addressed.
These authors contributed equally to this work.
Agronomy 2024, 14(8), 1746; https://doi.org/10.3390/agronomy14081746
Submission received: 29 June 2024 / Revised: 2 August 2024 / Accepted: 6 August 2024 / Published: 9 August 2024
(This article belongs to the Section Agricultural Biosystem and Biological Engineering)

Abstract

:
Rhubarb is a significant medicinal herb in China. Its adulteration or fabrication is common in the market. Consequently, it is necessary to establish a comprehensive identification method to accurately identify genuine rhubarb and its adulterants. In this study, the sequences of chloroplast genes rps3-rpl22 and rpl16 from three genuine rhubarbs (Rheum tanguticum, Rh. palmatum and Rh. officinale) and their adulterants (Rumex japonicus and Rumex spp.) were amplified, sequenced and subjected to genetic analyses. The genetic distances for rps3-rpl22 and rpl16 between genuine rhubarbs and their adulterants showed that there was an evident barcoding gap, which allowed the adulterants to be distinguished from the genuine rhubarbs, as demonstrated by a neighbor joining tree. Additionally, Rh. officinale could be distinguished from the other two genuine rhubarbs. The anthraquinone, sennoside, polysaccharide and protein contents were analyzed in seven rhubarbs using high-performance liquid chromatography and ultraviolet spectrophotometry. Cluster and principal component analyses results showed that Rh. tanguticum and Rh. palmatum could be effectively distinguished. The study suggests that DNA barcoding based on rps3-rpl22 and rpl16 sequences coupled with multiple-indicator quantification can be successfully applied to identify rhubarb species and distinguish among the three genuine rhubarbs, and this can provide a scientific foundation for rhubarb quality assurance.

1. Introduction

The Polygonaceae family of plants contains over 60 species of rhubarb, among which Rheum tanguticum Maxim. ex Balf, Rh. palmatum L. and Rh. officinale Baill. are recognized as genuine rhubarb in the 2020 edition of the Chinese Pharmacopoeia [1]. The roots and rhizomes of rhubarb are usually used in medicine. However, as the digging for rhubarb increases, wild rhubarb resources are becoming scarce. Adulterants, such as Rh. hotaoense C. Y. Cheng and T. C. Kao, Rh. franzenbachii L. and Rh. australe D. Don, are frequently sold instead of genuine rhubarbs in the market [2]. Different rhubarbs are relatively similar in traits and microscopic features, but there are significant differences in their medicinal components and pharmacological activities. Consequently, more attention should be paid to the identification of rhubarb species.
Medicinal plants can be quickly and easily identified using DNA barcoding, a molecular technique that uses one or more short DNA gene fragments to identify species quickly and accurately [3,4]. In the past, sequences, such as matK, rbcL and ITS2, were frequently utilized for the DNA barcoding identification of medicinal plants. For example, the ITS2 sequence has been used as a general barcode for toxic medicinal plants and their toxic related species or adulterants in the Chinese Pharmacopoeia [5]. The matK sequence has been used as the principal region for the identification of Indonesian medicinal plants, and rbcL and ITS2 sequences have been used as alternative or complementary regions [6]. The identification, phylogeny and genetic backgrounds of various medicinal plants, such as Paederia foetida L., Arctium lappa L. and Zingiber teres S. Q. Tong and Y. M. Xia, have been extensively studied using chloroplast genome sequencing technology [7,8,9]. Specific barcodes were obtained based on chloroplast genomes to accurately identify medicinal plants. However, specific DNA barcodes for many medicinal plants have not been mined. It is crucial to realize that mutations in chloroplast genomes are not produced at random. Instead, they are concentrated in certain hotspot locations, leading to the creation of highly variable polymorphic regions within the genome. Therefore, to reliably identify different plant species, special DNA barcodes such as trnD-trnT, psaA-ycf3 and rpoA could be developed based on the highly variable sections of the chloroplast genome [10,11]. Zuo et al. sequenced the whole chloroplast genome of three genuine rhubarbs and revealed some highly variable sites in intergenic regions, such as the psaA-ycf3 sequence with base insertion at positions 45–50 and specific base A at 164; the psbD-trnT at 271 and 276 and the rpl16-rps3 at 111–113, thus distinguishing the three rhubarbs. These specific loci can be used as candidate genetic markers for species identification and phylogenetic development of rhubarbs [12]. These studies indicate that the whole chloroplast genome can be used as a super barcode to identify rhubarb relatives, and provide more specific barcode choices for subsequent molecular identification.
Rhubarb is used in multi-effective, multi-species and multi-origin traditional Chinese medicines. Its primary medicinal components include anthraquinones, sennosides, tannins, polysaccharides and proteins. According to contemporary pharmacological investigations, these components have multiple pharmacological actions, such as laxative, anti-tumor, anti-inflammatory and antibacterial effects [13,14,15,16]. Additionally, various rhubarb species show distinct therapeutic effects. Thus, it is vital to employ chemical methods to analyze and determine the active components of rhubarbs to provide theoretical foundations for the proper use and development of specific rhubarb species. In recent years, principal component analysis (PCA) has been applied to the quality evaluation of traditional Chinese medicine such as Trillium tschonoskii Maxim [17], Caulis Bambusae In Taenias [18] and Jinteng Qingbi granules [19]. The purpose of PCA is to use a small number of principal components to describe the relationship between multiple indicators. By means of data dimensionality reduction, the overlapping information in diverse chemical information is excluded, and the potential comprehensive index is obtained for evaluation. For example, in a study on the quality evaluation of Scutellaria barbata, Du et al. used fingerprint analysis combined with PCA and screened out four principal components. Thus, it can be used for the comprehensive evaluation and ranking of herbs [20].
In this study, we screened the rps3-rpl22 and rpl16 chloroplast gene sequences as specific barcodes for the identification of seven rhubarbs. To comprehensively identify the rhubarb species, the quantitative data were analyzed using PCA and cluster analysis in conjunction with DNA barcoding. The goal was to provide valuable references for research on the genetic diversity, resource conservation and species identification of rhubarb.

2. Materials and Methods

2.1. Plant Materials

A total of 55 fresh root, leaf and stem samples of rhubarb were collected from Zhejiang, Sichuan, Gansu, Qinghai and Beijing, China. All of the samples were authenticated by Prof. Dequan Zhang from the College of Life Science and Technology, Southwest University of Science and Technology. The information on the samples is shown in Table 1. All the samples were stored at −20 °C. The samples of dried rhubarb roots were ground into a uniform size in a grinder and then passed through a 0.23 mm mesh sieve for subsequent content determination. All active substances were extracted from a bulk sample of each rhubarb species.

2.2. DNA Extraction, PCR Amplification and Sequencing

The surfaces of the root, leaf or stem tissues of rhubarb samples were cleaned with anhydrous ethanol, chopped and fully ground with a mortar and pestle. Approximately 0.1 g of each sample was used to extract rhubarb DNA using the modified CTAB method [21]. A Nano-100 spectrophotometer (Aosheng Instrument Company, Hangzhou, China) was used to evaluate the purity and concentration of the extracted DNA. Each sample was then diluted to 50 ng/μL and stored at −20 °C.
In this study, the whole chloroplast genome sequences of the three genuine rhubarbs (Rheum tanguticum, Rh. palmatum and Rh. officinale) were downloaded from the NCBI platform to compare the regions of high variation for the three authentic rhubarbs. Primers were independently designed for the selected rps3-rpl22 and rpl16 sequence, and the primer information and amplification procedures are shown in Table 2. The 25 μL PCR reaction contained 9.5 μL of ddH2O, 1 μL of forward and reverse primers (10 μM), 12.5 μL of 2X SanTaq PCR Master Mix (Sangon, Shanghai, China) and 1 μL of DNA template (50 ng/μL). The reactions were performed with a Thermal Cycler Block 5020 (Thermo Fisher Scientific, Waltham, MA, USA). In total, 5 μL of PCR products were used for electrophoresis on a 1% agarose gel, and then, they were observed and photographed using a Tanon-5200 Multi chemiluminescent imager (Tanon, Shanghai, China). The successfully amplified PCR products were sent to Beijing Tsingke Biotech Co. (Beijing, China) for sequencing.

2.3. DNA Barcoding Analysis

Chromas software 2.1.3 was used to view the sequence mappings and remove the low-quality sequence regions. BLAST tools in NCBI were used to compare with the database to ensure the correctness of the sequence. Then, DNASTAR 7.1 software was used to calculate the GC contents of the sequences, and MEGA 11.0 software was used to conduct multiple sequence comparisons of the rps3-rpl22 and rpl16 sequences of rhubarb and its adulterant using the ClustalW method. Then, we used MEGA 11.0 software to calculate intraspecific and interspecific genetic distances based on the Kimura 2-parameter model and construct neighbor joining trees to evaluate the discriminatory abilities of the two sequences.

2.4. Anthraquinones Extraction and Analysis Conditions

The free anthraquinone and total anthraquinone contents in rhubarb were extracted in accordance with the method of Chinese Pharmacopoeia [1]. Approximately 3.0 mg each of emodin, rhein, aloe-emodin, chrysophanol and physcion were weighed precisely and placed in 25 mL volumetric flasks. They were dissolved in methanol and calibrated to obtain 120 μg/mL concentrations of each standard solution. Prior to injection, the samples were passed through a 0.22 μm filter.
The extract was used for the high-performance liquid chromatography (HPLC) analysis with a Waters e2695-2998 system (Waters, Milford, MA, USA) using a Thermo Fisher Hypersil GOLD aQ C18 column (250 mm × 4.6 mm, 5 μm) at 25 °C. The flow was 1 mL/min, and the injected volume was 10 μL. The mobile phase was composed of methanol-0.1% (v/v) phosphoric acid (85:15 v/v), and the wavelength of detection was set at 440 nm. Free anthraquinones and total anthraquinones were calculated as the sum of the contents of emodin, rhein, aloe-emodin, chrysophanol and physcion, respectively, under different sample preparation conditions. Content of combined anthraquinones = Content of total anthraquinones − Content of free anthraquinone.

2.5. Sennosides Extraction and Analysis Conditions

The sennosides were analyzed using HPLC as described by Peng et al. [22]. Approximately 0.25 g of rhubarb powder was weighed and placed in a 50 mL conical flask, and then, 25 mL of 60% methanol was added. Each sample was ultrasonicated for 1 h, left at room temperature and then weighed. The samples were filtered and then diluted into 25 mL. For a standard solution, approximately 1.0 mg of sennoside A and 3.0 mg of sennoside B were weighed into 10 mL volumetric flasks, and 60% methanol was added to dissolve and calibrated to obtain the 100 μg/mL concentrations of sennoside A and 300 μg/mL concentrations of B standard solutions. They were passed through a 0.22 μm filter prior to injection.
The compounds were determined using the previously described Waters system and column. The injection volume was 10 µL, and the flow was 1 mL/min at 25 °C. The mobile phase was composed of methanol-0.1% (v/v) phosphoric acid (48:52 v/v), and the wavelength of detection was set at 286 nm. Content of Total sennosides = Content of sennoside A + Content of sennoside B.

2.6. Proteins Extraction and Analysis Conditions

Approximately 0.25 g of rhubarb powder, 0.1 g of quartz sand and 10 mL of 0.2 M PBS solution (pH = 6.8) were added to a mortar and pestle for the protein extraction. The solution was centrifuged twice, once at 7500× g for 6 min followed by once at 10,300× g for 16 min. Then, 2.5 mL of supernatant was aspirated, and PBS solution was added to 25 mL to obtain the protein test solutions [23]. In total, 0.0118 g of Bovine serum albumin was fully dissolved with PBS solution to obtain a 1.18 mg/mL standard solution.
The proteins were detected using a HU5300 ultraviolet spectrophotometer (Tianmei Scientific Instrument, Shanghai, China). For each solution, 0.2 mL was aspirated into a 10 mL centrifuge tube and 5 mL of Coomassie Blue Staining Solution was added. The solutions were vortexed and mixed for 2 min, and then, the absorbance values were determined at 595 nm using PBS solution as the blank control.

2.7. Polysaccharides Extraction and Analysis Conditions

Approximately 0.50 g of sample powder was weighed, and the polysaccharides were obtained using the method of Qu [24]. To prepare the 0.903 mg/mL glucose standard solution, 0.0903 g of glucose powder was weighed, dissolve in distilled water and placed in a 100 mL volumetric flask.
The polysaccharides were detected using a HU5300 ultraviolet spectrophotometer (Tianmei Scientific Instrument, Shanghai, China). Briefly, 1 mL of each polysaccharide sample was aspirated, and 1 mL of freshly prepared 6% phenol solution was added. Afterwards, 5 mL of concentrated sulfuric acid was slowly added. After boiling for 20 min, the samples were cooled to room temperature in an ice bath. The absorbance values were detected at a wavelength of 490 nm. Pure water was used as the blank control.

2.8. Data Analysis of Each Component

SPSS 27 statistical software was used to perform cluster analyses with squared Euclidean distances, and a PCA was performed on the component indicator of the seven species of rhubarb. SIMCA 14.1 software was used to construct the principal component score scatter plot to comprehensively evaluate the rhubarb quality and the accuracy of the species identification.

3. Results

3.1. DNA Barcoding Sequence Characterization

In this study, the sequences of the chloroplast genes rps3-rpl22 and rpl16 of Rh. tanguticum, Rh. palmatum, Rh. officinale, Ru. japonicus and Rumex spp. were amplified, and the electrophoretic results are shown in Figure 1. The PCR amplification success rates for rps3-rpl22 and rpl16 were both 100%, and the sequencing success rates were 100% and 96.36%, respectively. The length of the rps3-rpl22 sequence after proofreading was 865–869 bp, and the GC content was 33.64–34.41%. There were 26 variable sites and 24 parsimony information sites. Among the tested samples, Rh. officinale had six stable variant sites located at 14, 19, 115, 487, 664, and 803 bp. The sequence length of the rpl16 sequence was 789–864 bp and the GC content was 29.40–32.07%. There were 66 variable sites and 63 parsimony informative sites, with Rh. officinale having two variable sites at 61 and 172 bp.

3.2. Genetic Distance Analysis

Intraspecific and interspecific Kimura 2-parameter genetic distance analyses were performed on 55 rhubarb samples (Table 3 and Table 4). The rps3-rpl22 sequence analyses showed that the intraspecific genetic distances of the three genuine rhubarbs ranged from 0.0000 to 0.0060, and the interspecific genetic distances ranged from 0.0000 to 0.0108. The rpl16 sequence analyses showed that the intraspecific genetic distances of the three genuine rhubarbs ranged from 0.0000 to 0.0012, and the range of interspecific genetic distances ranged from 0.0000 to 0.0048. The minimum interspecies genetic distances of rps3-rpl22 and rpl16 were 0.0205 and 0.0804, respectively, which were greater than their intraspecific genetic distances. The requirements of DNA barcodes were satisfied, indicating that these two sequences can be used as new specific barcodes for the authentication of rhubarb.

3.3. Phylogenetic Tree Analysis

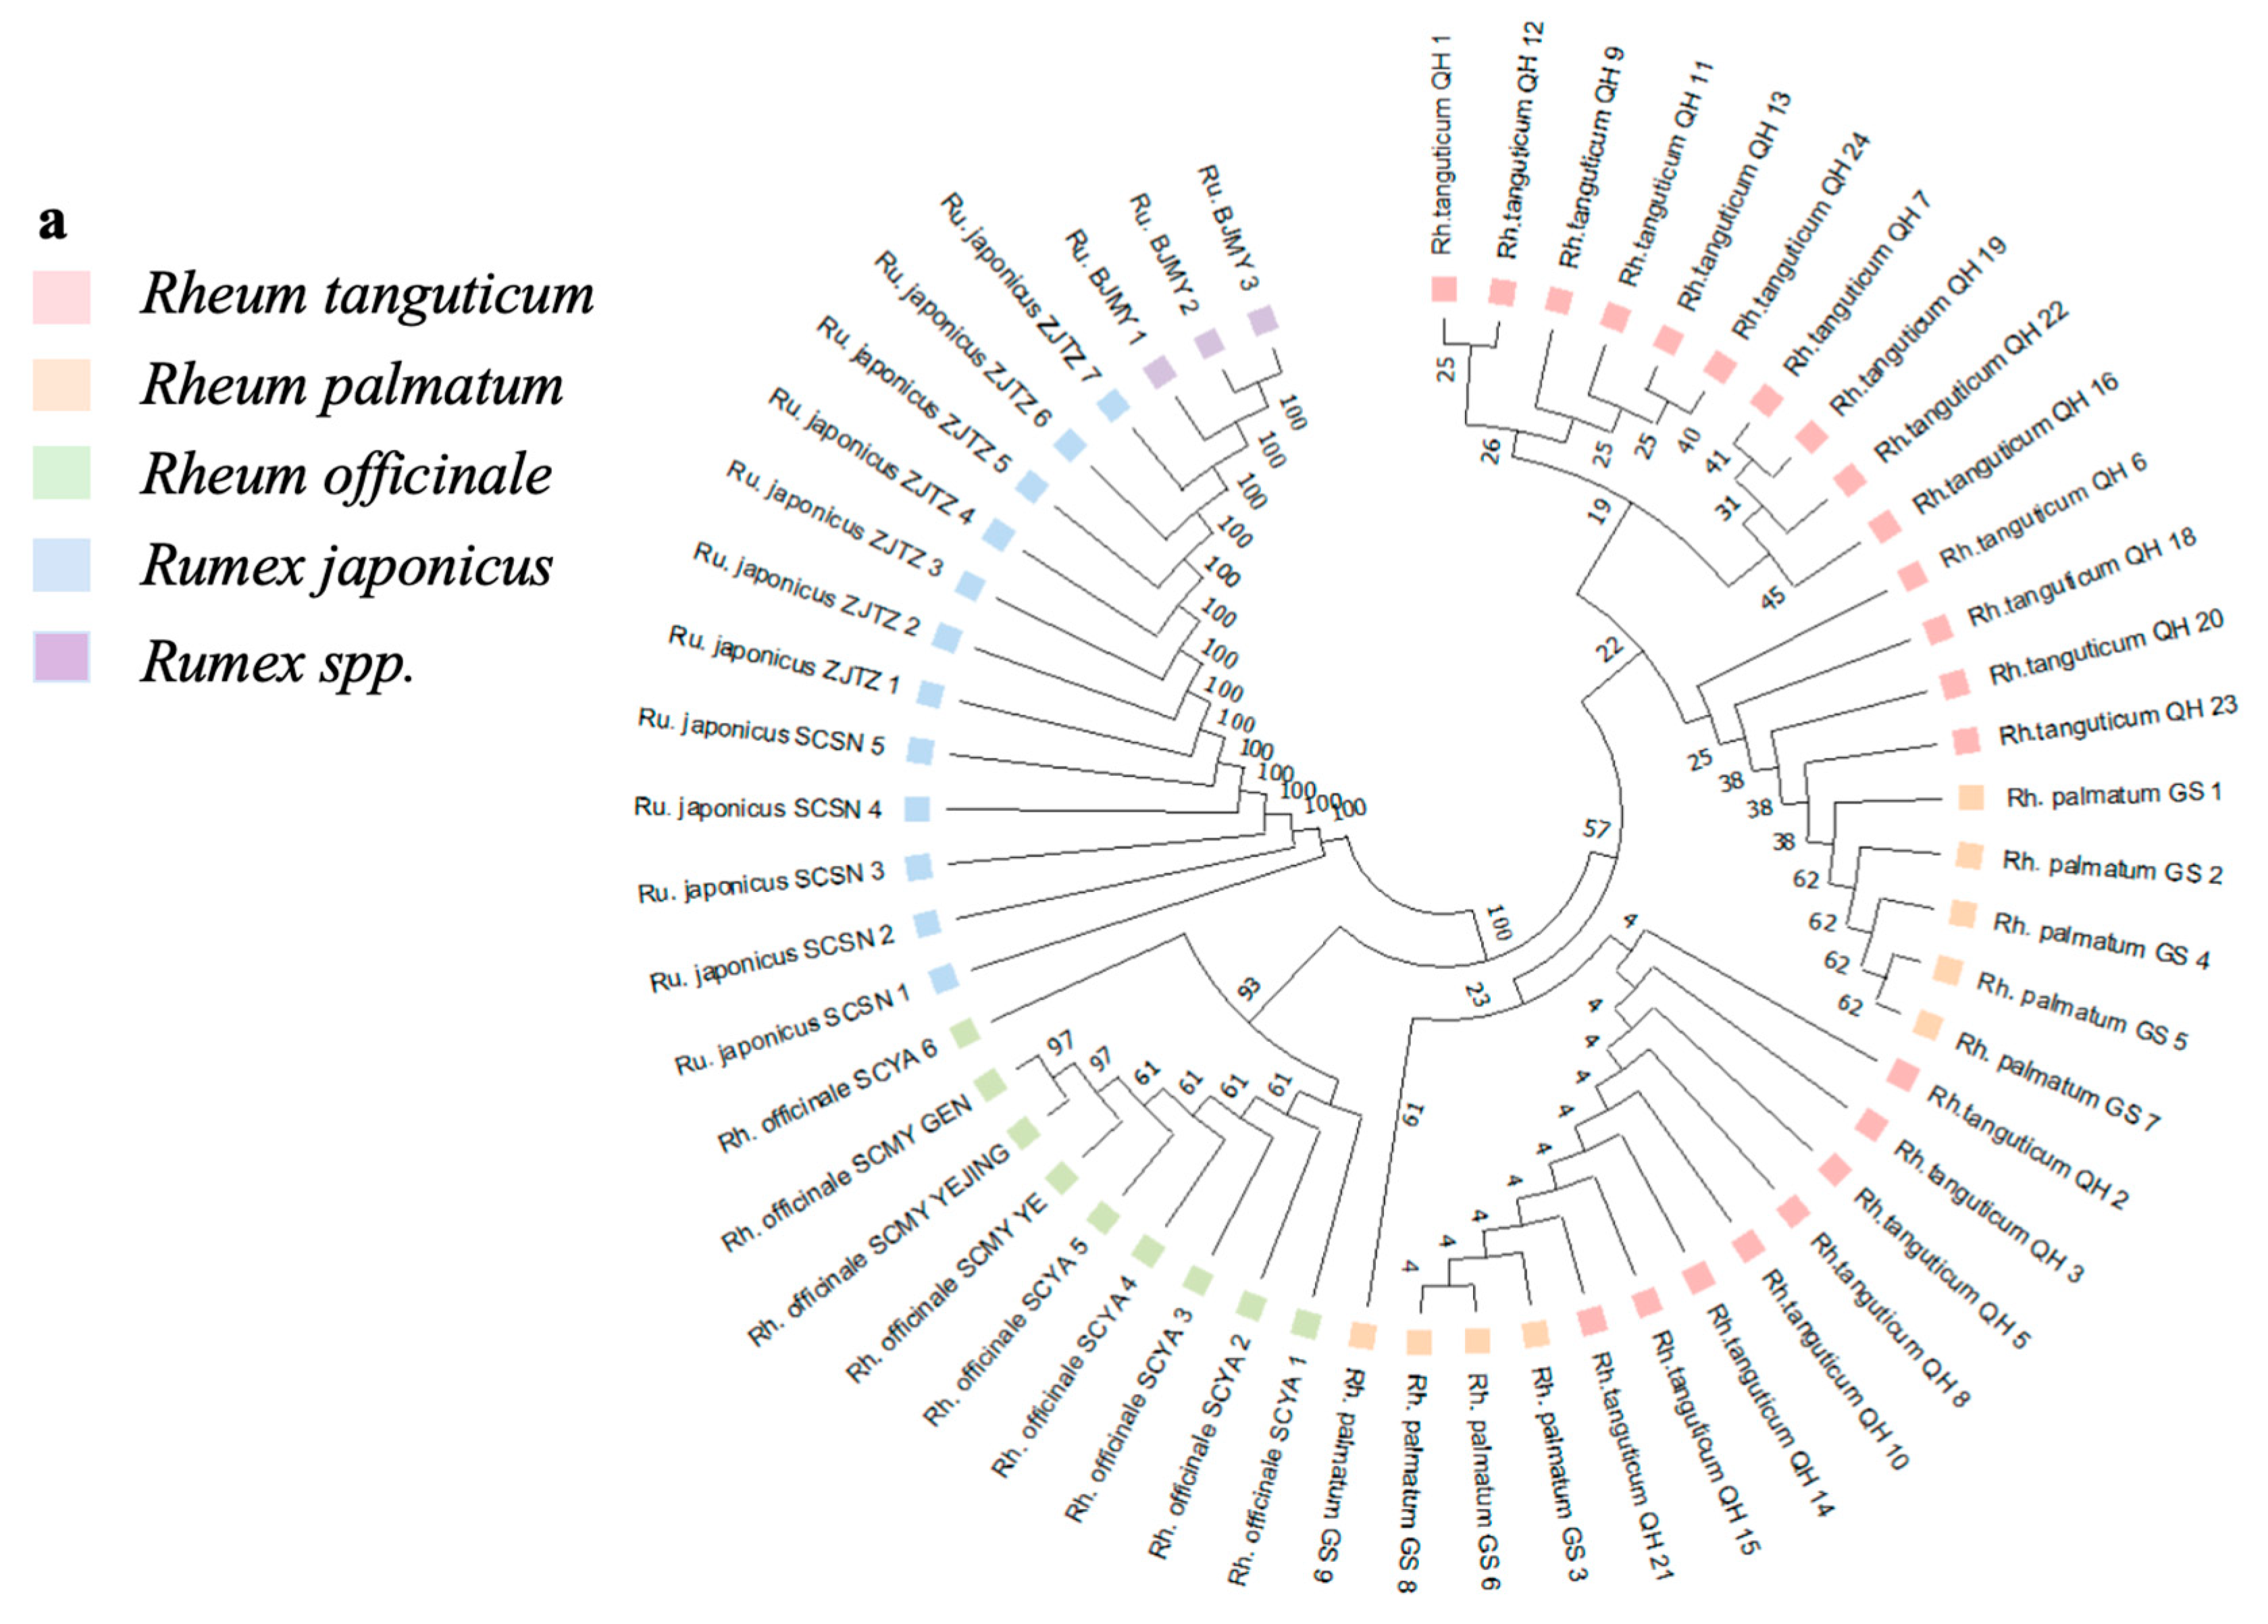
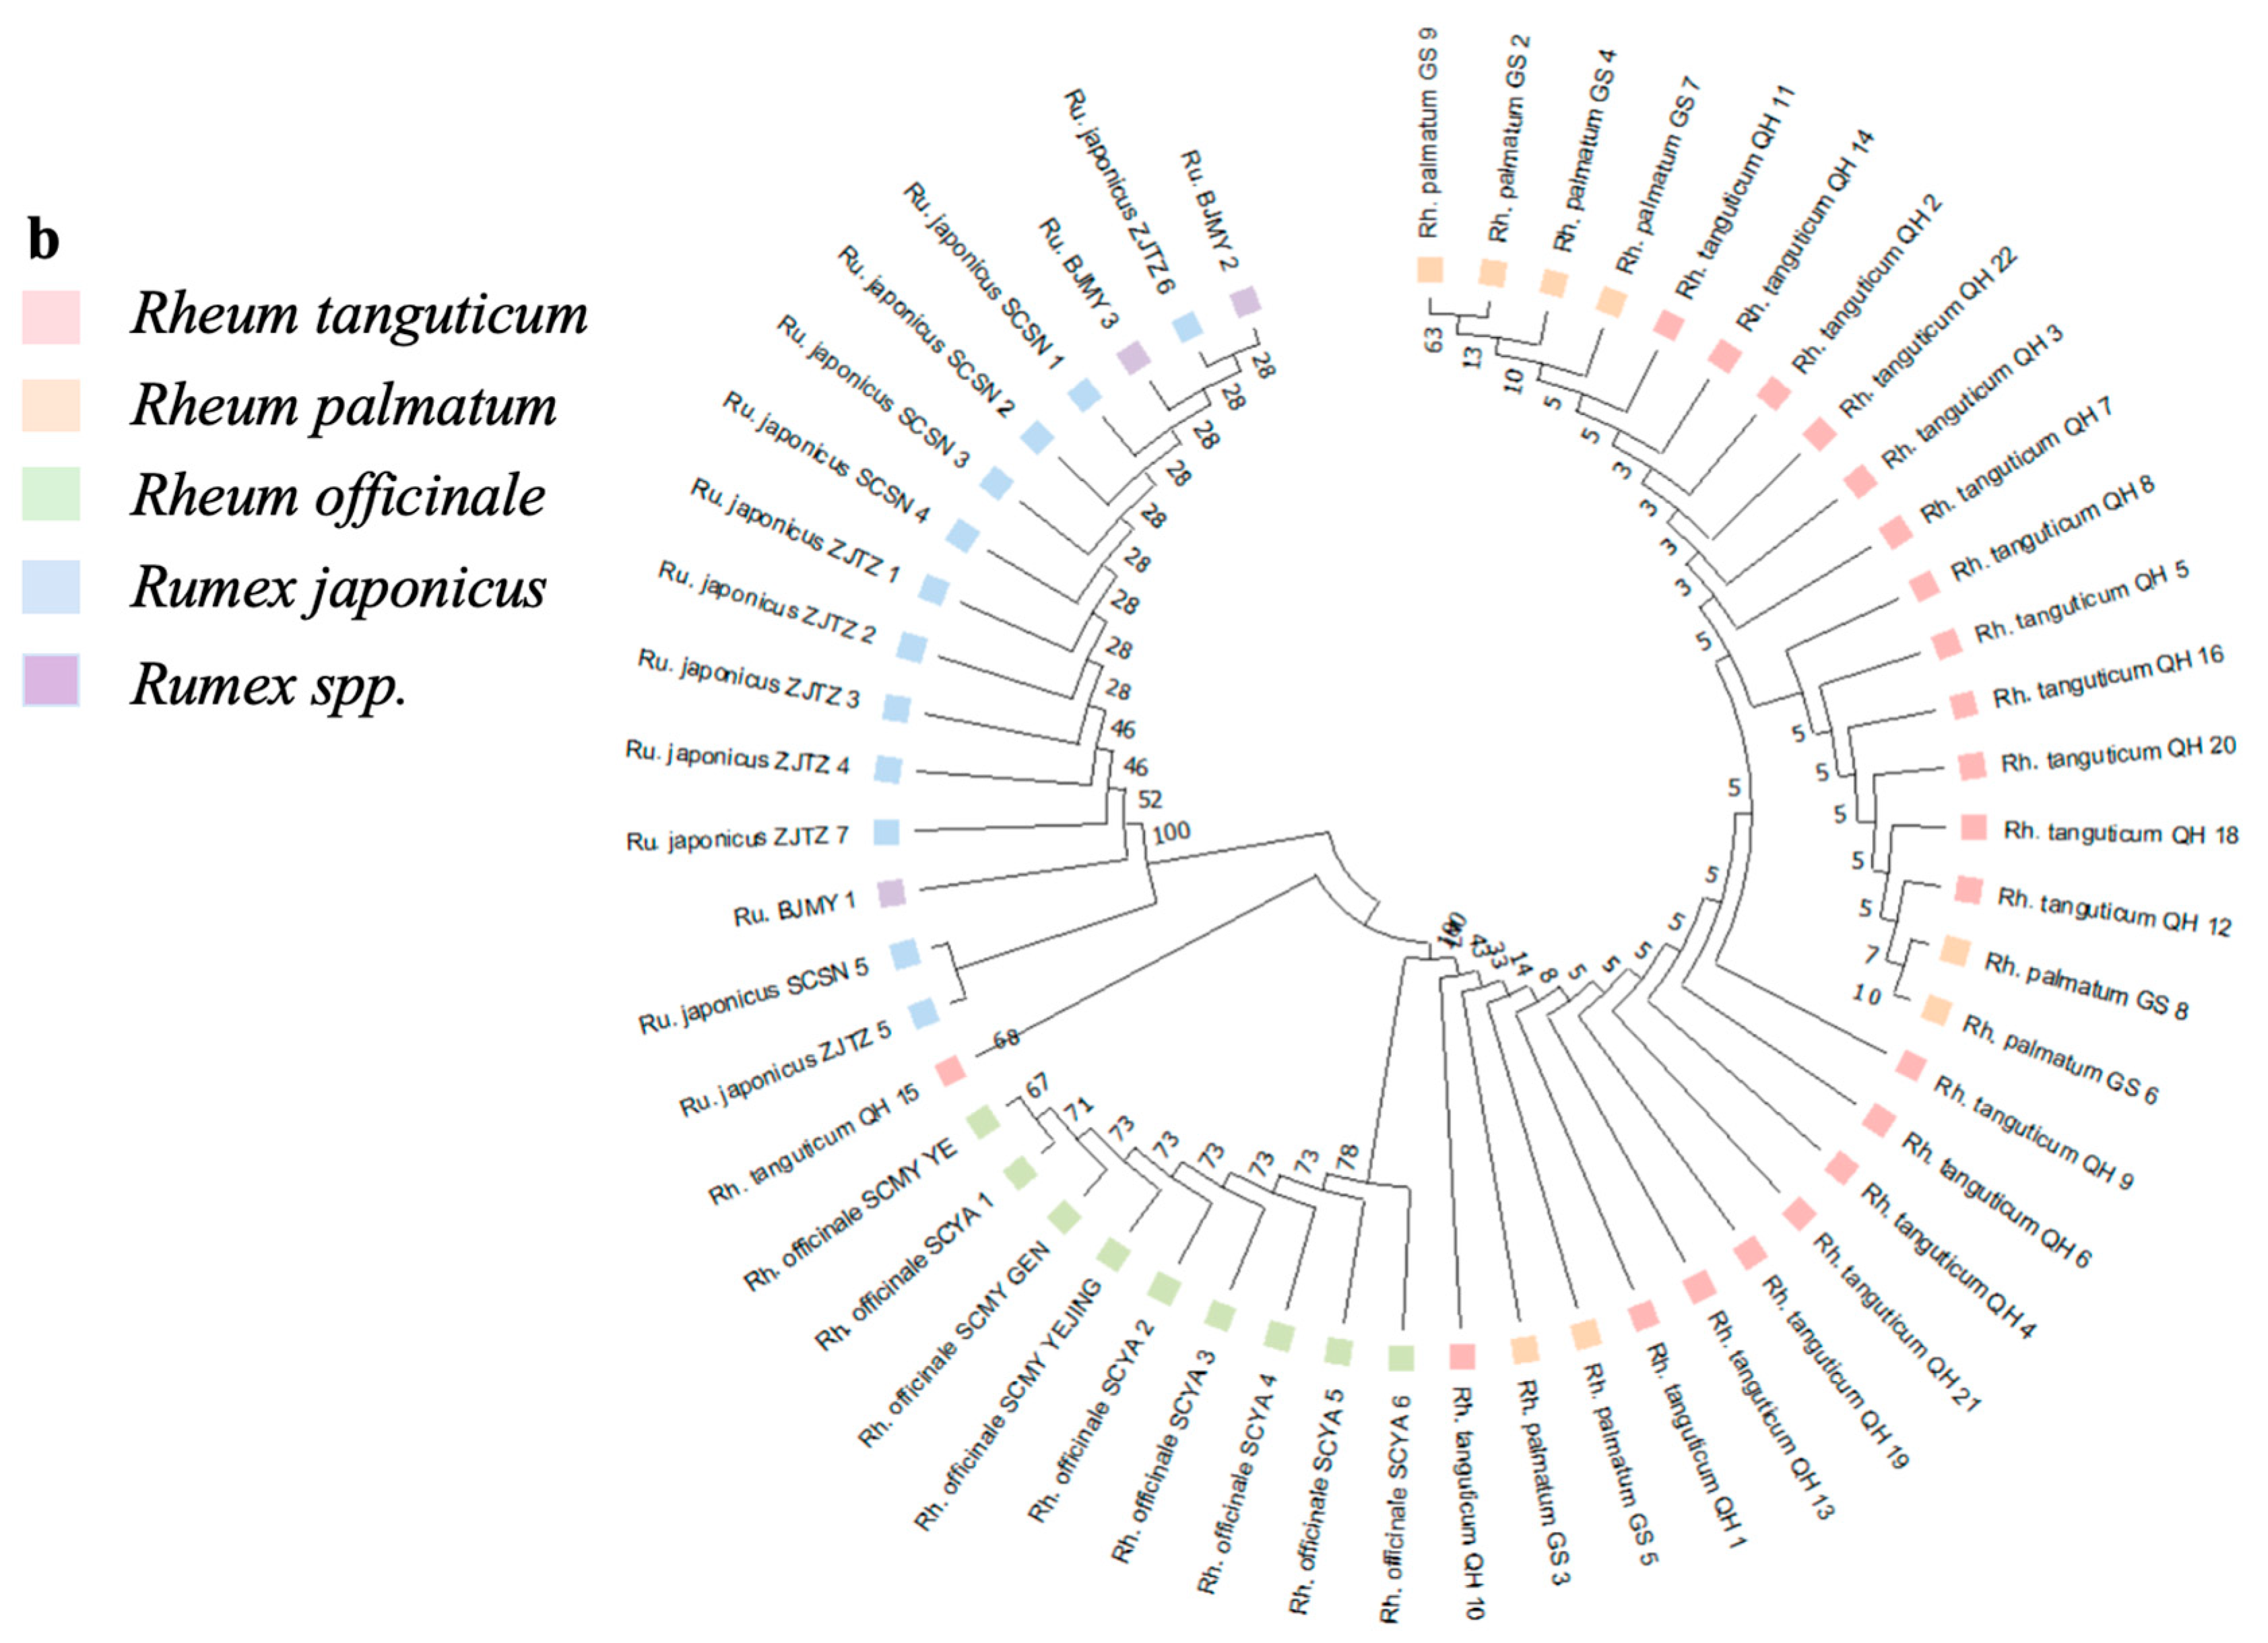
A phylogenetic tree using the neighbor joining method was constructed from the rps3-rpl22 and rpl16 sequences of each rhubarb species (Figure 2). Both regions rps3-rpl22 and rpl16 enabled the classification of all the samples into three major branches, in which Rumex and the three genuine rhubarbs were clearly distinguished from each other. This placed Rh. tanguticum and Rh. palmatum together into one branch, and Rh. officinale was separately divided into another. Among the three genuine rhubarbs, Rh. officinale was genetically distant from Rh. tanguticum and Rh. palmatum, clustering into a separate branch. Rh. tanguticum and Rh. palmatum are genetically closer and clustered into one large branch. Using the rps3-rpl22 sequence, Rh. tanguticum and Rh. palmatum were divided into three sub-branches due to base variants at 783, 803 and 823 bp. Using the rpl16 sequence, samples of Rh. palmatum were divided into two branches due to a base change from T to G at 837 bp.

3.4. Determination of Medicinal Components in Rhubarb

We chose to determine the anthraquinones, sennosides, polysaccharides and proteins present in rhubarb. The standard solutions for each component were independently diluted into six concentration gradients. The standard curves were prepared with concentration as the horizontal coordinate and peak area or absorbance as the vertical coordinate. The regression equations of the nine components are shown in Table 5, and they indicated good linear relationships between each of the components within a certain range.
The anthraquinone, sennoside, polysaccharide and protein contents of the seven rhubarb samples are shown in Table 6. Rh. tanguticum QH had significantly higher levels of anthraquinones, sennoside A and total sennosides than the other rhubarbs. Rh. officinale SCMY had higher sennoside B and polysaccharides contents than the other rhubarbs, whereas Rh. officinale SCYA had a higher protein content. No sennoside B was detected in the Ru. BJMY.

3.5. Cluster Analysis

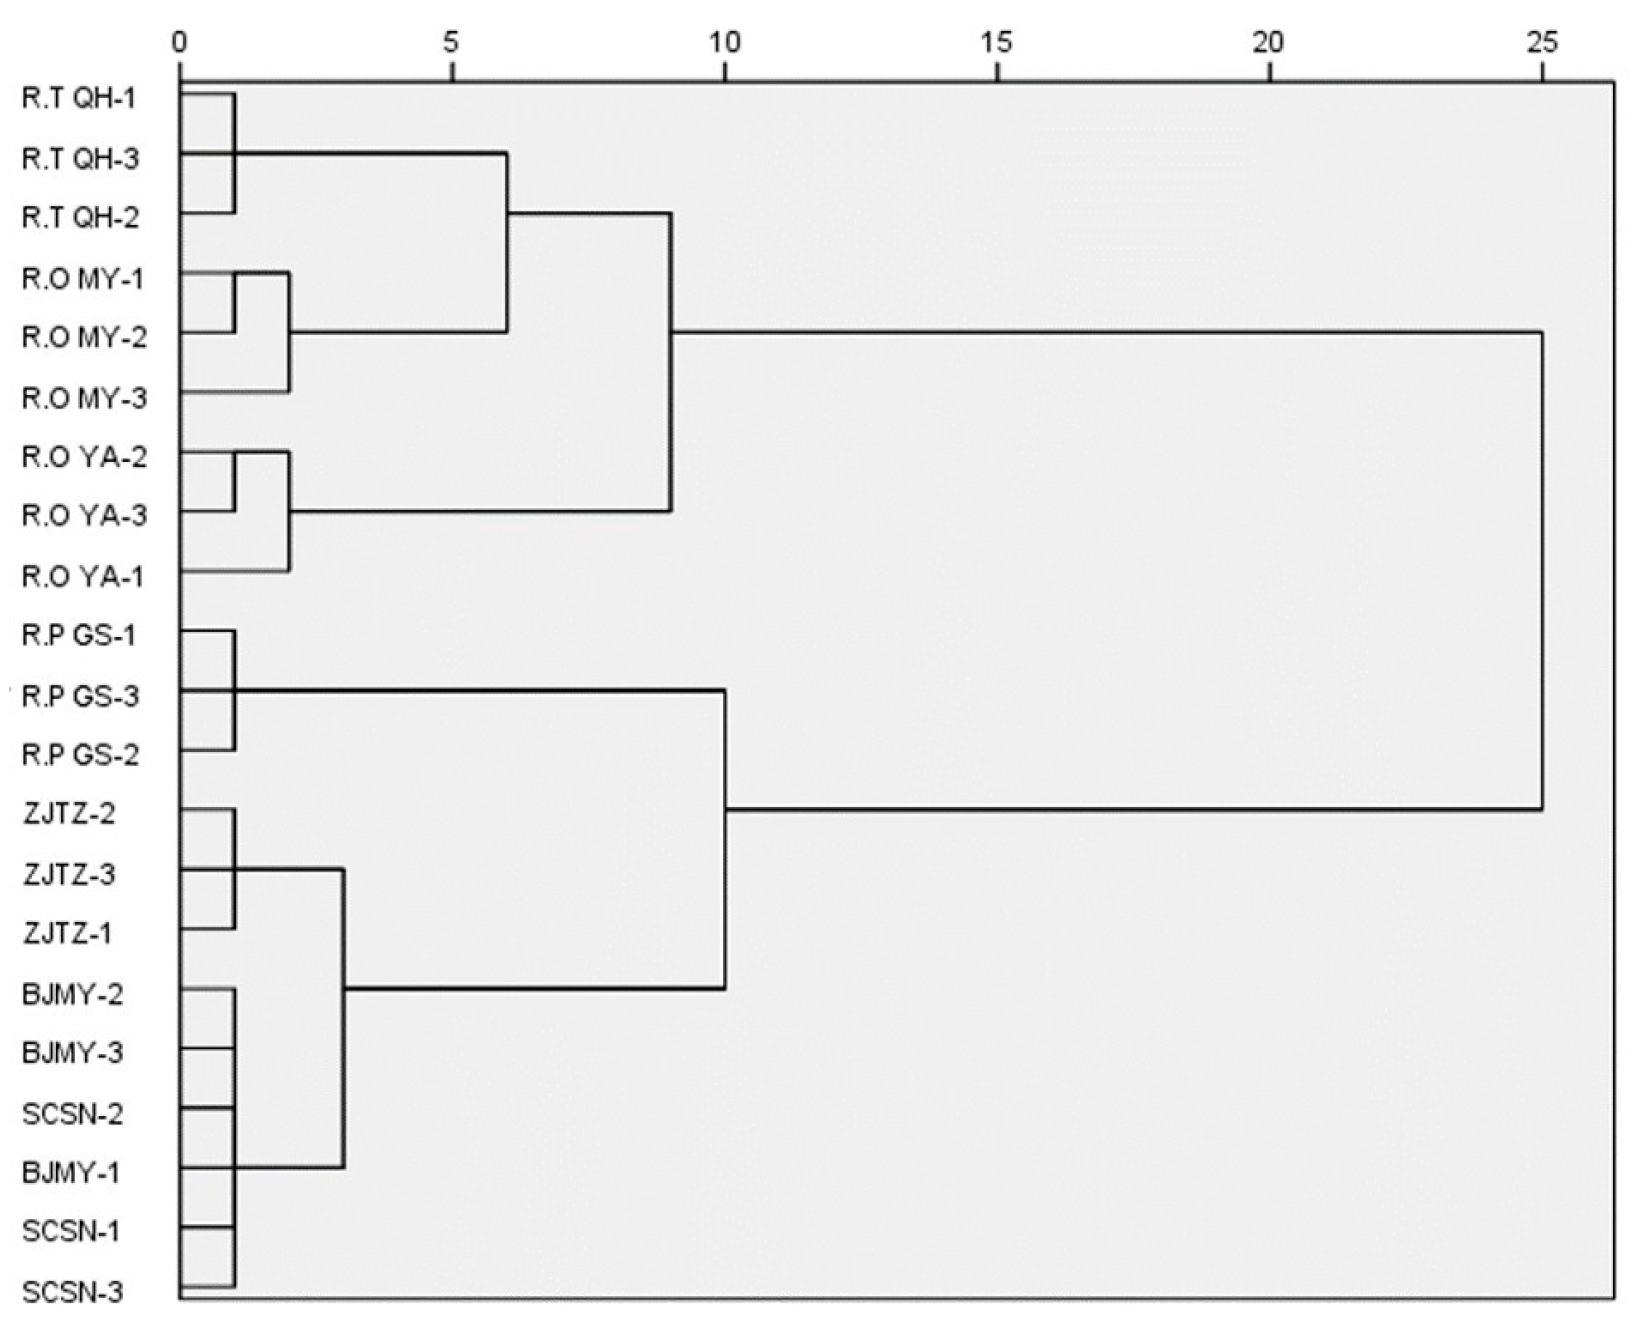
Using the contents of the eight indicators from the seven rhubarbs as variables, SPSS 27 software was used to perform a cluster analysis with squared Euclidean distances (Figure 3). The seven rhubarbs were classified into four groups, with Rh. tanguticum QH and Rh. officinale SCMY forming the first group, Rh. officinale SCYA forming the second group, Rh. palmatum GS forming the third group and Ru. japonicus ZJTZ, Ru. japonicus SCSN and Ru. BJMY forming the fourth group.

3.6. Principal Component Analysis

The PCA of the total anthraquinone, free anthraquinone, combination anthraquinone, sennoside A, sennoside B, total sennoside, polysaccharide and protein contents of the seven rhubarb species was performed using SPSS 27 software. PCA revealed relationships between the eight indicators (medicinal components) and the quality and bioactive potential of the rhubarbs. The correlation matrices’ eigenvalues were determined, and two principal components were extracted using the criterion of eigenvalue > 1. The extracted principal components had a cumulative variance contribution rate of 83.053%, fully satisfying the requirements that the value be greater than 80% and that the principal components have the greatest amount of raw data with the fewest number of principal components [25].
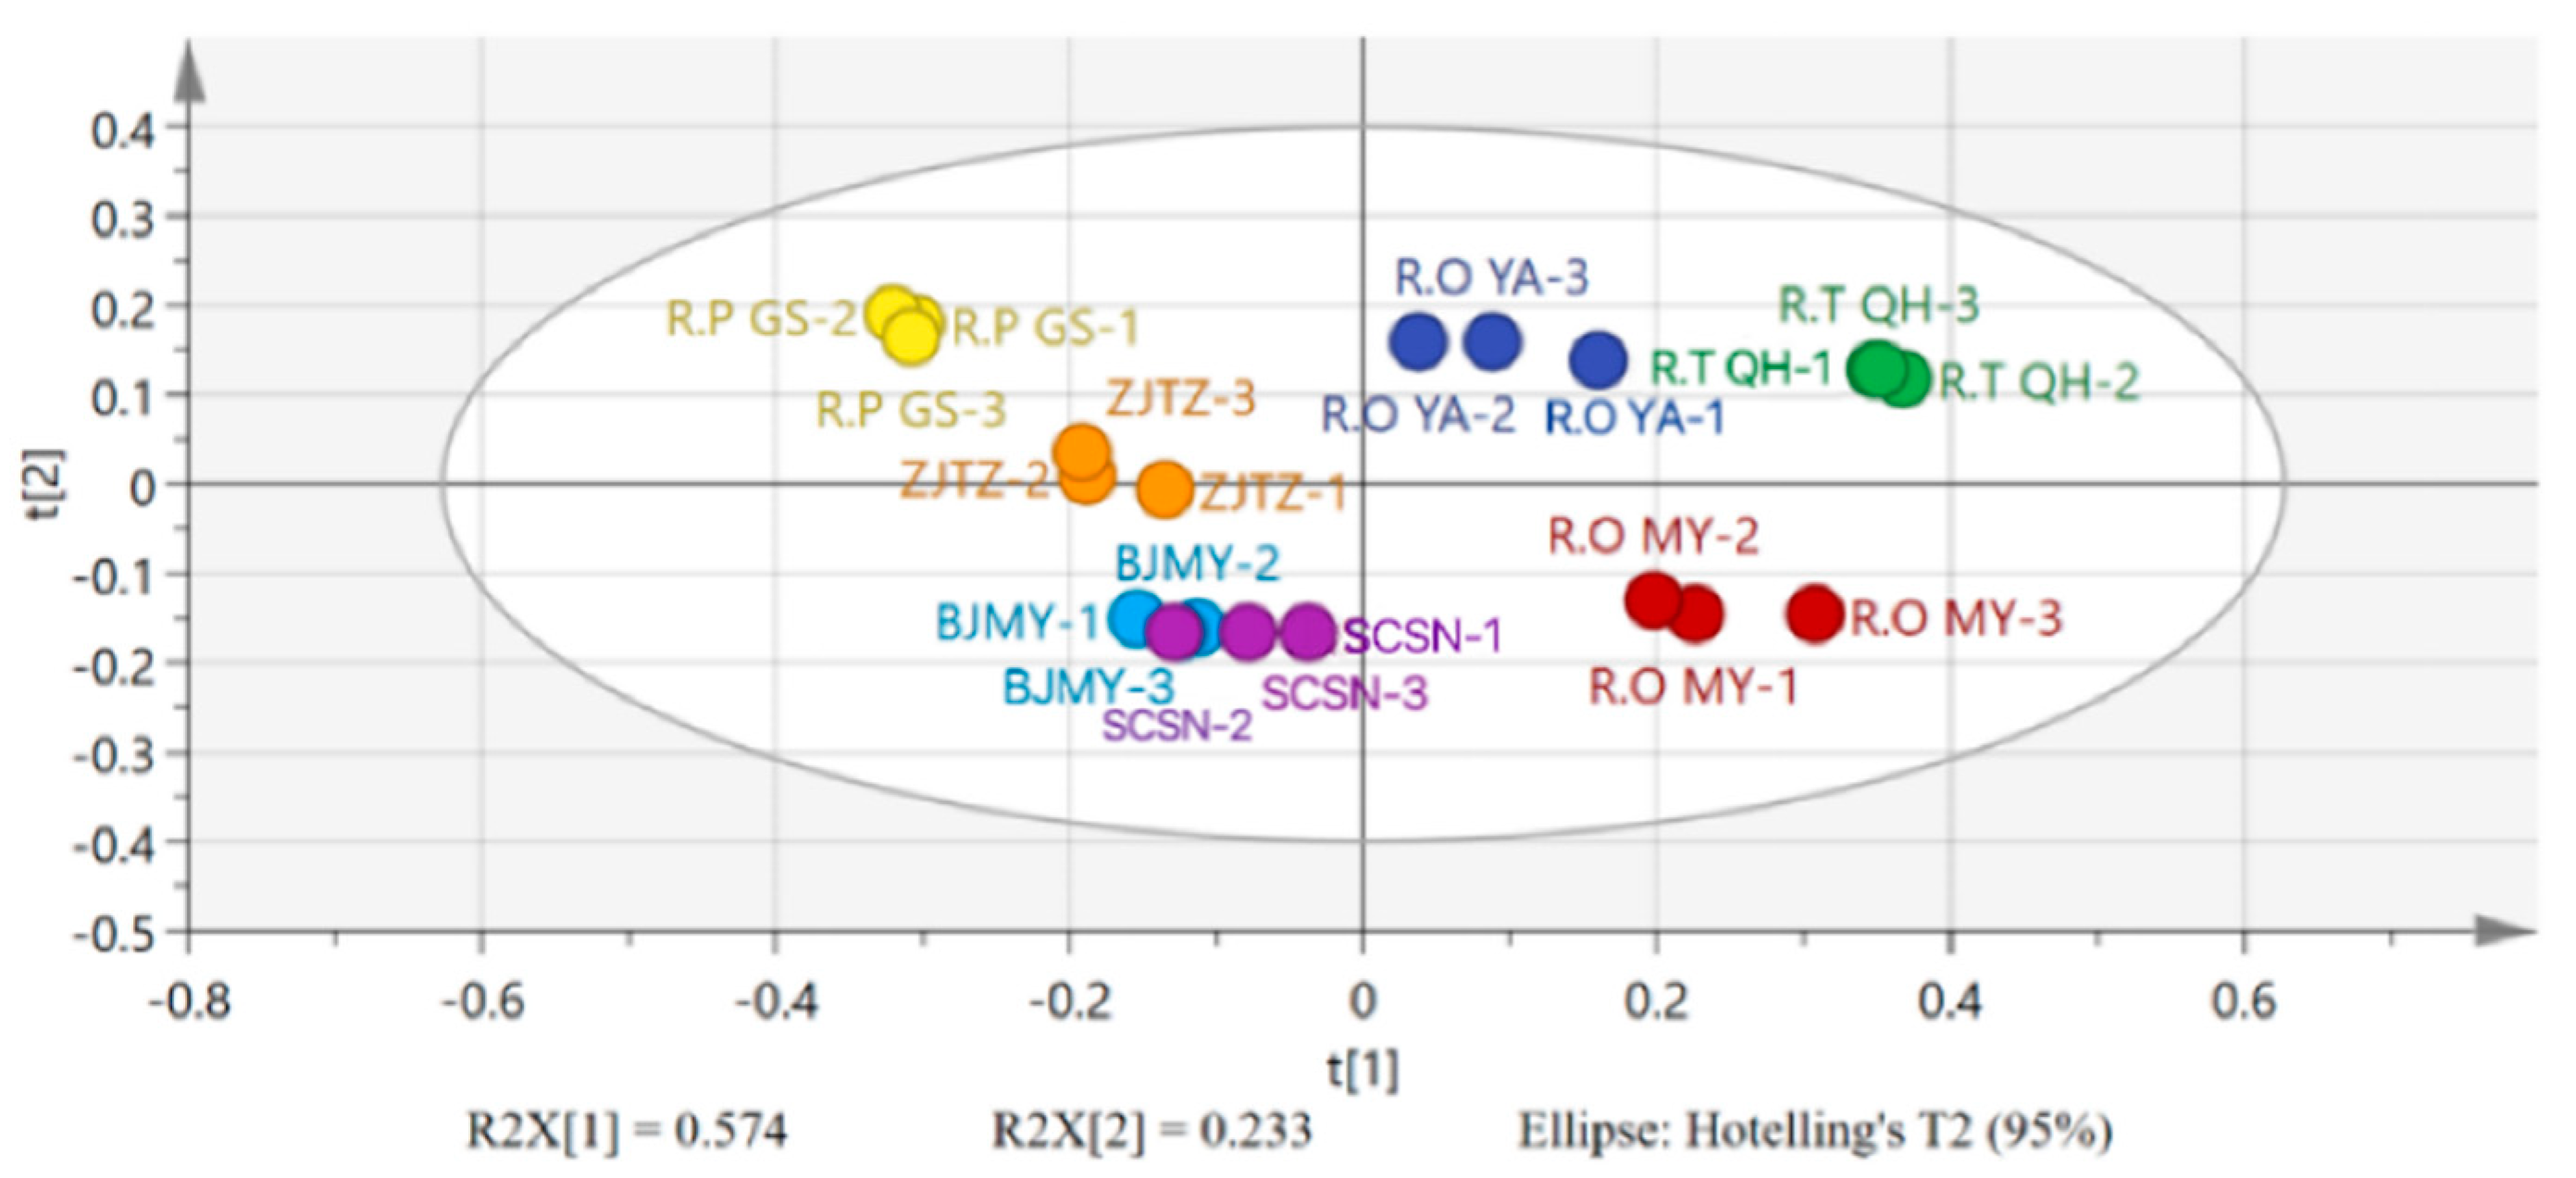
As shown in Table 7 and Table 8, the independent variance contribution rate of the first principal component was 63.786%, mainly reflecting the information of total sennoside, total anthraquinone, sennoside A, free anthraquinone and combination anthraquinone, whereas that of the second principal component was 19.267%, mainly reflecting the information of sennoside B and protein. The principal component scores were plotted using SIMCA 14.1 software (Figure 4). The findings indicated that Ru. japonicus ZJTZ was in the middle of the major component scores, Rh. palmatum GS was on the upper left side, and Rh. tanguticum QH and the two kinds of Rh. officinale were on the right side. The major component scores showed that Ru. BJMY and Ru. japonicus SCSN were on the lower left side. These results were in line with those of the cluster analysis. Thus, the quality differences among the rhubarbs were determined using a variety of components, and the seven rhubarb species were identified using DNA barcoding and PCA.

4. Discussion

The chloroplast genome sequences of a variety of medicinal plants have been gradually revealed owing to the rapid development of related sequencing technology. Using chloroplast genome sequencing, the foundations for species-specific DNA barcodes, germplasm resources and genetic evolution have been laid [26]. Chloroplast matK, rbcL and psbA-trnH sequences have often been used to identify species, but the chloroplast variation regions of species may differ. Consequently, the development of chloroplast genome sequencing provides the possibility of screening for species-specific barcodes. For example, Zhang et al. screened for atpI, ndhA, ycf1, atpB-rbcL and ndhF-rpl32 sequences, which act as DNA barcodes of Eleutherococcus senticosus (Rupr. Maxim.) in a comparison of three E. senticosus genomes [27]. Therefore, the screening for species-specific barcodes from whole chloroplast genomes could provide a new approach for species identification. Because the intraspecific variation among the three genuine rhubarbs is small, such barcodes have been difficult to distinguish. Therefore, to identify rhubarb species, we screened for rps3-rpl22 and rpl16 sequences from the rhubarb chloroplast genome. Then, by comparing different rhubarbs, we confirmed that these two sequences could distinguish authentic rhubarb from adulterants. Notably, the two sequences were also able to distinguish Rh. officinale from the other two genuine rhubarbs during species identification. It means that the rps3-rpl22 and rpl16 sequences can be used in the identification of medicinal rhubarb. However, Rh. palmatum and Rh. tanguticum are closely related, which may be that the locus of variation in a single chloroplast gene segment is not enough to distinguish between these two closely related priyophytes [28]. One of the authors of the Rheum treatment for Flora of China (Grabovskaya-Borodina) indicates that Rh. tanguticum is a synonym of Rheum palmatum. For Rh. palmatum and Rh. tanguticum, so far there are no good DNA markers that can distinguish them [29,30,31,32]. Some of the markers also cannot separate Rh. officinale from two other rhubarb species. However, Rh. officinale is tetraploid and the two other species are diploids [33,34]. The research of the whole Rheum chloroplast genome proposed several regions that can be perspective for species discrimination in the section Palmata [10,12]. In order to test the suitability of these sites as good DNA markers, future studies of this type of rhubarb should sample widely from natural populations to cover all areas where the species is distributed. Moreover, morphological analysis and morphometry should also be performed on each population sample. In subsequent studies, combining different chloroplast gene fragments can be considered to add more variant sites.
The relationship between the key component contents and the quality of rhubarb can be effectively revealed using PCA. Previous studies comparing different origins and species of rhubarb with proposed free anthraquinone, sennoside and combination anthraquinone contents as the main inputs for evaluating rhubarb [35,36,37]. However, because the 2020 edition of the Chinese Pharmacopoeia included total anthraquinone content as a quality indicator for rhubarb, it can be used in rhubarb quality assessments [1]. Moreover, the polysaccharide and protein contents of rhubarb were significantly higher than other components, and they also have wide ranges of medicinal value [38]. Therefore, this study determined the total anthraquinone, free anthraquinone, combination anthraquinone, sennoside A, sennoside B, total sennoside, polysaccharide and protein contents in rhubarb using HPLC and ultraviolet spectrophotometry, providing a comprehensive evaluation of the quality of rhubarb. The first group of major components affecting the quality of rhubarb contained total sennoside, sennoside A and free anthraquinone, which corroborated the results of previous studies [35,36]. In addition, total anthraquinone was likewise a major component group. Another group of major components included sennoside B and protein. No sennoside B was detected in Ru. BJMY, thereby distinguishing it from other rhubarbs. Sun et al. [39] also found that sennoside B was almost undetectable in collected adulterants. Moreover, using a cluster analysis and PCA, seven rhubarb species were roughly clustered into four classes, and Rh. tanguticum and Rh. palmatum could be distinguished from each other. DNA barcoding combined with the quantitative analysis of multiple indicators effectively differentiated the three genuine rhubarbs and identified the species of rhubarb.

5. Conclusions

In conclusion, the present study developed rhubarb-specific rps3-rpl22 and rpl16 barcodes, and their applicability to the authenticity of rhubarb was confirmed. A quantitative data analysis of multiple indicators showed that rhubarb quality was determined by a variety of components and that differences in total sennoside, sennoside A, free anthraquinone and total anthraquinone contents could be used to identify rhubarb species. The combination of DNA barcoding and multi-indicator quantification could serve as a powerful tool to identify rhubarb species, which guarantees its safety and effectiveness.

Author Contributions

Conceptualization, Y.W., L.Y. and Y.L.; methodology, Y.W., L.S. and Y.L.; software, Y.W.; validation, L.Y., Z.Y., L.S. and Y.L.; investigation, M.Z.; resources, M.Z. and L.S.; data curation, L.Y., M.Z. and J.L.; writing—original draft, Z.Y.; writing—review and editing, Z.Y. and Y.D.; visualization, F.T. and L.Z.; supervision, C.Z. and Y.D.; Project administration, C.Z. and Y.D.; funding acquisition, Q.J., C.Z., Y.D. and L.Z. All authors have read and agreed to the published version of the manuscript.

Funding

This study was supported through funding from Science and Technology Program of Zhejiang Province (2022C04002), the Natural Science Foundation of Zhejiang Province (LZ22C130003) and the National Natural Science Foundation of China (32272051).

Data Availability Statement

The 55 rps3-rpl22 sequences and 53 rpl16 sequences can be found in the NCBI database; accession numbers—PQ121294-PQ121346 and PQ121347-PQ121401, respectively. For further queries, please contact the corresponding authors.

Conflicts of Interest

Author Jing Lin was employed by the company Meitang Agriculture (Hangzhou) Co., Ltd. The remaining authors declare that the research was conducted in the absence of any commercial or financial relationships that could be construed as a potential conflict of interest.

References

  1. State Pharmacopoeia Committee. Pharmacopoeia of the People’s Republic of China (2020 Edition, Part I); China Medical Science Press: Beijing, China, 2020; pp. 24–25. [Google Scholar]
  2. Chen, M.; Wang, J.; Lin, X.J.; Yao, J.J.; Zhang, B.; Wang, X. Research progress on authenticity identification and quality control methods of Rhubarb. China Pharm. 2019, 30, 2583–2589. [Google Scholar]
  3. Chen, S.-L.; Yao, H.; Han, J.-P.; Xin, T.-Y.; Pang, X.-H.; Shi, L.-C.; Luo, K.; Song, J.-Y.; Hou, D.-Y.; Shi, S.-M.; et al. Principles for molecular identification of traditional Chinese materia medica using DNA barcoding. China J. Chin. Mater. Medica 2013, 38, 141–148. [Google Scholar]
  4. Shi, S.M.; Pan, M.J.; Wang, J.; Chen, C.Q. Application of molecular identification techniques in Chinese materia medica. Chin. Tradit. Herb. Drugs 2016, 17, 3121–3126. [Google Scholar]
  5. Liu, M.; Li, X.-W.; Liao, B.-S.; Luo, L.; Ren, Y.-Y. Species identification of poisonous medicinal plant using DNA barcoding. Chin. J. Nat. Med. 2019, 17, 585–590. [Google Scholar] [CrossRef] [PubMed]
  6. Cahyaningis, R.; Compto, L.J.; Rahay, S.; Brehm, J.M.; Maxte, N. DNA Barcoding Medicinal Plant Species from Indonesia. Plants 2022, 11, 1375. [Google Scholar] [CrossRef] [PubMed]
  7. Nie, L.P.; Cui, Y.X.; Chen, X.L.; Xu, Z.C.; Sun, W.; Wang, Y.; Song, J.Y.; Yao, H. Complete chloroplast genome sequence of the medicinal plant Arctium lappa. Genome 2020, 63, 53–60. [Google Scholar] [CrossRef] [PubMed]
  8. Lin, N.; Liu, R.; Wang, Y.; Guo, P.; Wang, Y.; Liu, Y.; Shang, F. The complete chloroplast genome of Ulmus mianzhuensis with insights into structural variations, adaptive evolution, and phylogenetic relationships of Ulmus (Ulmaceae). BMC Genom. 2023, 24, 366. [Google Scholar] [CrossRef] [PubMed]
  9. Wang, X.; Tian, S.; Wang, H.; Yang, L.; Zou, X.L.; Baskaran, X.R.; Li, Q.; Xing, H.T.; Li, H.L. The complete chloroplast genome sequence of Zingiber teres S. Q. Tong & Y. M. Xia (Zingiberaceae). Mitochondrial DNA Part B 2023, 8, 699–703. [Google Scholar] [PubMed]
  10. Zhou, Y.; Nie, J.; Xiao, L.; Hu, Z.; Wang, B. Comparative Chloroplast Genome Analysis of Rhubarb Botanical Origins and the Development of Specific Identification Markers. Molecules 2018, 23, 2811. [Google Scholar] [CrossRef]
  11. Zhou, T.; Zhu, H.; Wang, J.; Xu, Y.; Xu, F.; Wang, X. Complete chloroplast genome sequence determination of Rheum species and comparative chloroplast genomics for the members of Rumiceae. Plant Cell Rep. 2020, 39, 811–824. [Google Scholar] [CrossRef]
  12. Zuo, W.M.; Zen, Y.; Yang, C.F.; Li, M.J.; Li, J.P.; Liu, L.K. High-throughput sequencing of complete chloroplast genome of Rheum tanguticum and its application in species identification. Chin. Tradit. Herb. Drugs 2019, 50, 5545–5553. [Google Scholar]
  13. Xiang, H.; Tao, X.; Xia, S.; Qu, J.; Song, H.; Liu, J.; Shang, D. Emodin Alleviates Sodium Taurocholate-Induced Pancreatic Acinar Cell Injury via MicroRNA-30a-5p-Mediated Inhibition of High-Temperature Requirement A/Transforming Growth Factor Beta 1 Inflammatory Signaling. Front. Immunol. 2017, 8, 1488. [Google Scholar] [CrossRef] [PubMed]
  14. Zhou, G.M.; Peng, F.H.; Zhong, Y.P.; Chen, Y.H.; Tang, M.; Li, D.R. Rhein suppresses matrix metalloproteinase production by regulating the Rac1/ROS/MAPK/AP-1 pathway in human ovarian carcinoma cells. Int. J. Oncol. 2017, 50, 933–941. [Google Scholar] [CrossRef] [PubMed]
  15. Xiong, Y.; Chen, L.; Fan, L.; Wang, L.; Zhou, Y.; Qin, D.; Sun, Q.; Wu, J.; Cao, S. Free Total Rhubarb Anthraquinones Protect Intestinal Injury via Regulation of the Intestinal Immune Response in a Rat Model of Severe Acute Pancreatitis. Front. Pharmacol. 2018, 9, 75. [Google Scholar] [CrossRef] [PubMed]
  16. Keser, S.; Keser, F.; Karatepe, M.; Kaygili, O.; Tekin, S.; Turkoglu, I.; Demir, E.; Yilmaz, O.; Kirbag, S.; Sandal, S. Bioactive contents, In vitro antiradical, antimicrobial and cytotoxic properties of rhubarb (Rheum ribes L.) extracts. Nat. Prod. Res. 2020, 34, 3353–3357. [Google Scholar] [CrossRef] [PubMed]
  17. Chen, J.; Chen, W.X.; Guo, W.D.; Lei, T.; Ouyang, J.Y.; Zhao, H.; Zou, H.Y. Evaluation of Quality Coherence of Trillium tschonoskii Maxim. from Different Producing Areas Based on HPLC Fingerprint and PCA. Chin. J. Inf. TCM 2017, 24, 1005–5304. [Google Scholar]
  18. Zhou, B.Q.; Gao, X.M.; Yang, Y.; Wang, L.C.; Zhang, W.; Zhao, X.L.; Di, L.Q. Quality analysis of Caulis Bambusae in Taeniam from different origins by HPLC coupled with chemometrics. Chin. Tradit. Herb. Drugs 2022, 53, 0523–2670. [Google Scholar]
  19. Deng, L.H.; Xu, K.; Yuan, X.M.; Ding, B.; Wang, L.P.; Xu, L.; Yang, B.G.; Liu, Y.H.; Fan, J.W. Based on UHPLC multi-component determination and principal component analysis Quality evaluation of Jinteng Qingbi granules. Chin. J. Pharm. Anal. 2024, 44, 0254–1793. [Google Scholar]
  20. Du, Y.L.; Li, Y.R.; Hong, X. Quality evaluation of Scutellaria barbata based on combination of chromatographic fingerprints and multi-component quantitative analysis. Chin. Tradit. Herb. Drugs 2023, 54, 670–676. [Google Scholar]
  21. Cui, G.H.; Tang, X.J.; Huang, L.Q. Study on extraction methods of DNA from Chinese medicinal materials containing starch and polysaccharides. China J. Chin. Mater. Medica 2006, 16, 1365–1367. [Google Scholar]
  22. Peng, B.Y.; Ding, Y.M.; Tang, J.C.; Zhao, J.Y.; Zhao, T.; Liu, F.; Liu, F.B.; Zhang, Y.; Wei, S.L. Effects of growth year and specification grade on content of active compounds of Rheum tanguticum. J. Beijing Univ. Tradit. Chin. Med. 2022, 45, 842–849+854. [Google Scholar]
  23. Xing, D.M.; Liu, J.L.; Deng, S.F.; Sun, Y.J.; Wang, Y.L. Determination and analysis of main nutrients in Angelica sinensis roots, stems and leaves. J. Gansu Univ. Chin. Med. 2021, 38, 22–27. [Google Scholar]
  24. Qu, Y.H. The Component Analysis of Rheum officinale Baill and the Biotransformation of the Conjugated Anthraquinone; Shaanxi University of Technology: Hanzhong, China, 2019. [Google Scholar]
  25. Li, D.H.; Wu, H.W.; Li, G.F.; Yang, X.R.; Li, X.W.; Song, Q.J.; Li, Y.; Li, W.F. Study on content of total polyphenols and total anthraquinones in rhubarb and its spectrum-effect relationship of anti-oxidation in vitro. Nat. Prod. Res. Dev. 2022, 34, 541–552. [Google Scholar]
  26. Yin, G.Y.; Yuan, L.; Wang, X.; Zhang, Z.F.; Chen, Y.; Liu, S.H.; Man, J.H.; Shi, Y.; Huang, Y.Y.; Zhang, X.Q.; et al. Screening of specific DNA barcode, identification of germplasm resources, andanalysis of genetic diversity of Atractylodes chinenesis. Acta Pharm. Sin. 2023, 58, 1693–1704. [Google Scholar]
  27. Zhang, Z.F.; Zhao, Z.Z.; Wang, X.; Yin, G.Y.; Chen, Y.; Man, J.H.; Shi, Y.; Huang, Y.Y.; Liu, S.H.; Liu, Z.Q.; et al. Specific DNA barcodes, germplasm resources, and genetic diversity of Eleutherococcus senticosus. China J. Chin. Mater. Medica 2023, 48, 1229–1237. [Google Scholar]
  28. Brach, A.R.; Song, H. eFloras: New directions for online floras exemplified by the Flora of China Project. Taxon 2006, 55, 188–192. [Google Scholar] [CrossRef]
  29. Wang, A.; Yang, M.; Liu, J. Molecular phylogeny, recent radiation and evolution of gross morphology of the rhubarb genus Rheum (Polygonaceae) inferred from chloroplast DNA trn LF sequences. Ann. Bot. 2005, 96, 489–498. [Google Scholar] [CrossRef] [PubMed]
  30. Sun, Y.; Wang, A.; Wan, D.; Wang, Q.; Liu, J. Rapid radiation of Rheum (Polygonaceae) and parallel evolution of morphological traits. Mol. Phylogenetics Evol. 2012, 63, 150–158. [Google Scholar] [CrossRef]
  31. Li, W.; Wang, A. Phylogeny of Rheum (Polygonaceae) based on CPDNA TRNS-G sequences. Pak. J. Bot. 2020, 52, 1345–1351. [Google Scholar] [CrossRef]
  32. Wan, D.; Sun, Y.; Zhang, X.; Bai, X.; Wang, J.; Wang, A.; Milne, R. Multiple ITS Copies Reveal Extensive Hybridization within Rheum (Polygonaceae), a Genus That Has Undergone Rapid Radiation. PLoS ONE 2014, 9, e89769. [Google Scholar] [CrossRef]
  33. Yanping, H.; Wang, L.; Li, Y. New occurrence of B chromosomes in Rheum tanguticum Maxim. ex Balf.(Polygonaceae). Caryologia 2011, 64, 320–324. [Google Scholar] [CrossRef]
  34. Zhang, H.; He, Q.; Xing, L.; Wang, R.; Wang, Y.; Liu, Y.; Zhou, Q.; Li, X.; Jia, Z.; Liu, Z.; et al. The haplotype-resolved genome assembly of autotetraploid rhubarb Rheum officinale provides insights into its genome evolution and massive accumulation of anthraquinones. Plant Commun. 2024, 5, 100677. [Google Scholar] [CrossRef] [PubMed]
  35. Gong, X.H.; Zhao, M.J.; Dang, J.; Luo, L.; Yan, P.A.; Yuan, A.; Li, Y.X.; Peng, C. Comparision of contents of thirteen components in different origins of Rhei Radix et Rhizoma based on principal component analysis. Chin. Tradit. Herb. Drugs 2017, 48, 4994–4999. [Google Scholar]
  36. Liang, H.Q.; Tian, J.; Feng, R.Z.; Zhou, W.H.; Liu, Y. Comprehensive evaluation of quality of Rhubarb based on principal component and cluster analysis. Lishizhen Med. Mater. Medica 2019, 30, 1036–1040. [Google Scholar]
  37. Li, S.; Chen, L.; Li, Y.; Hu, T.; Zhang, X.; Chen, L.; Wang, X. UPLC fingerprint combined with principal component analysis for quality control of Rheum palmatum. J. Liq. Chromatogr. Relat. Technol. 2021, 44, 610–617. [Google Scholar] [CrossRef]
  38. Du, Y.; Kou, L.; Li, X.R.; Kang, S.H. General situation of extraction method, structure and pharmacological activity of rhubarb polysaccharide. Shangdong Chem. Ind. 2022, 51, 111–114. [Google Scholar]
  39. Sun, D.M.; Luo, S.N.; Wei, M.; Zhu, D.Q.; He, G.M.; Luo, W.A.; Yang, R.P. Study on quality evaluation of different origins of Rhei Radix et Rhizoma Based on multivariate statistical analysis fingerprints and multi-component quantitative analysis. J. Nanjing Univ. Tradit. Chin. Med. 2021, 37, 83–90. [Google Scholar]
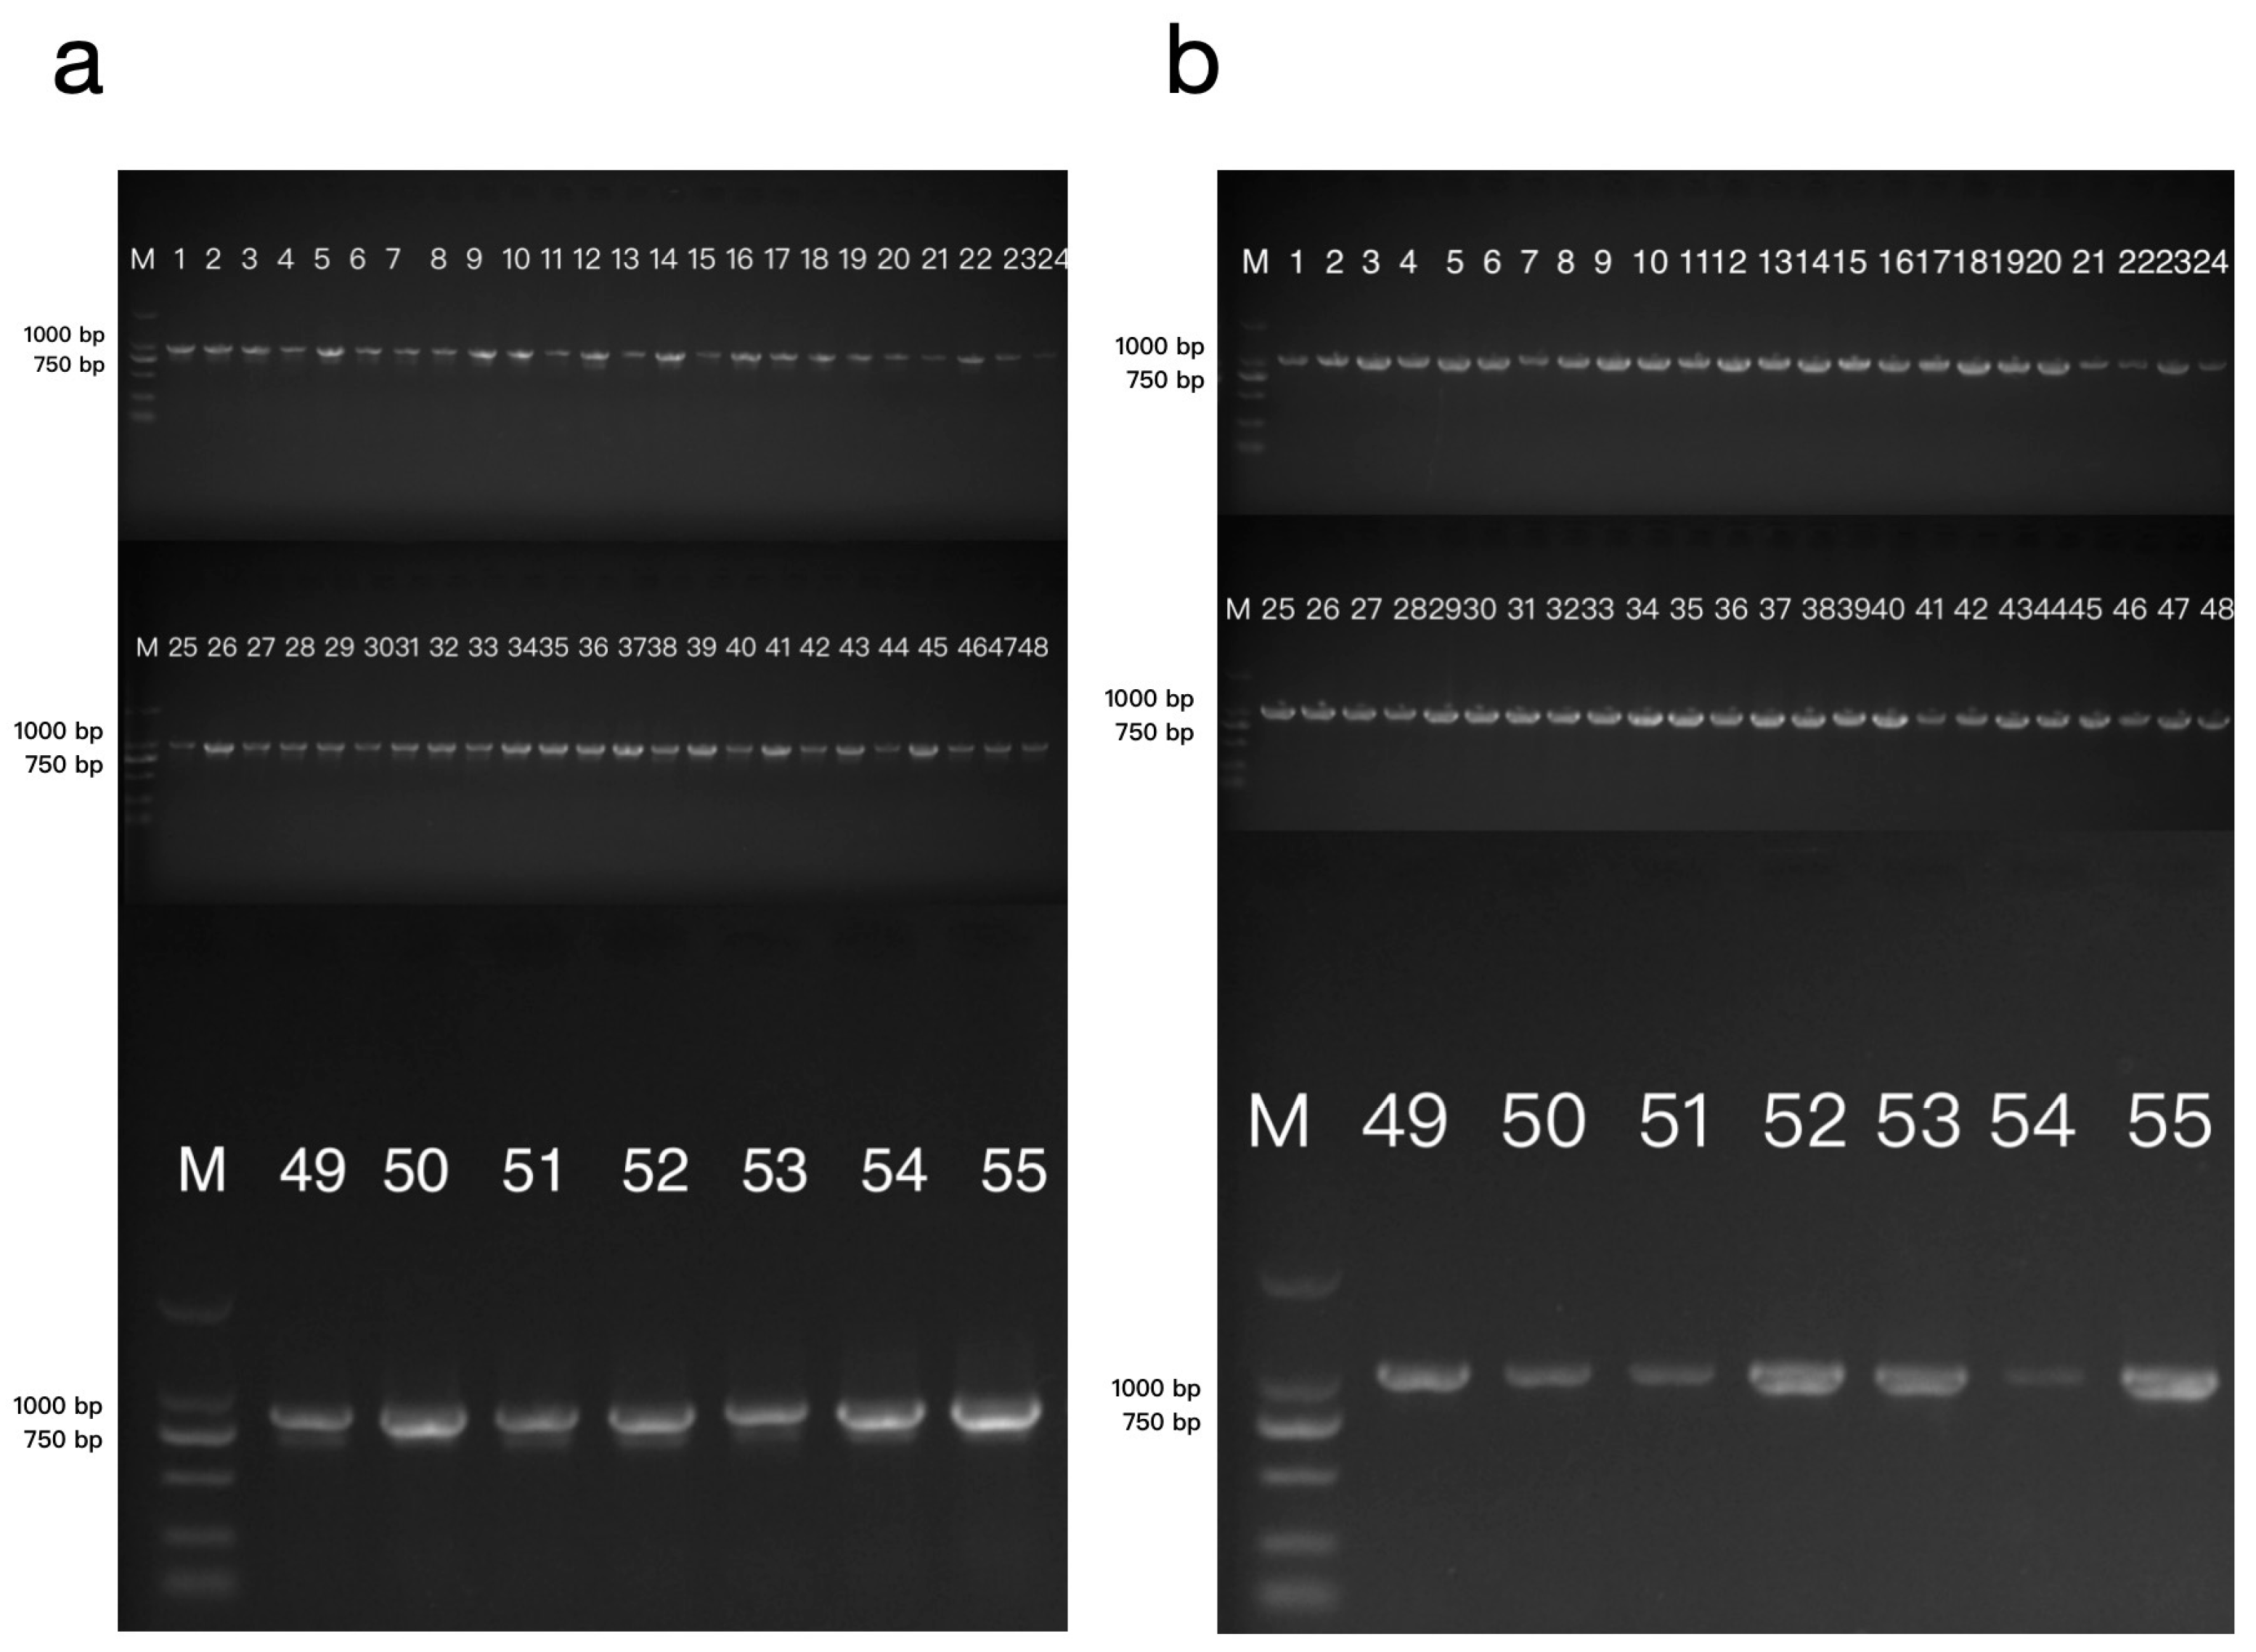
Figure 1. Agarose gel electrophoresis of amplified products of fresh rhubarb samples in rps3-rpl22 (a) and rpl16 (b) sequences. M: 2000 DNA marker, 1–22: Rheum tanguticum QH, 23–25: Rumex spp. BJMY, 26-30: Rumex japonicus SCSN, 31–39: Rheum palmatum GS, 40-45: Rheum officinale SCYA, 46–48: Rheum officiale SCMY, 49–55: Rumex japonicus ZJTZ.
Agronomy 14 01746 g001
Figure 2. NJ phylogenetic tree constructed based on rps3-rpl22 (a) and rpl16 (b) sequences. Red, orange, green, blue, and purple regions represent Rheum tanguticum from Qinghai, Rh. palmatum from Gansu, Rh. officinale from Sichuan, Rumex japonicus from Zhejiang and Sichuan, and Rumex spp. from Beijing.
Agronomy 14 01746 g002aAgronomy 14 01746 g002b
Figure 3. Hierarchical cluster analysis plot for seven rhubarbs. The seven rhubarbs were classified into four groups, with Rh. tanguticum QH and Rh. officinale SCMY forming the first group, Rh. officinale SCYA forming the second group, Rh. palmatum GS forming the third group and Ru. japonicus ZJTZ, Ru. japonicus SCSN and Ru. spp. BJMY forming the fourth group.
Agronomy 14 01746 g003
Figure 4. Score scatter plot of PCA. Red, orange, yellow, green, cyan, blue and purple regions represent Rh. officinale from Sichuan, Rumex japonicus from Zhejiang, Rh. palmatum from Gansu, Rh. tanguticum from Qinghai, Rumex spp. from Beijing, Rh. tanguticum from Sichuan and Rumex japonicus from Sichuan.
Agronomy 14 01746 g004
Table 1. Information of 55 rhubarb materials. Including three genuine rhubarbs (Rheum tanguticum, Rh. palmatum and Rh. officinale) and their adulterants (Rumex japonicus and Rumex spp.).
SpeciesSample CodeOriginNumber of SamplesForm of Sample
Rheum tanguticumRh. tanguticum QHQinghai22Roots
Rheum officinaleRh. officinale SCYAYa’an, Sichuan6Roots
Rheum officinaleRh. officinale SCMYMianyang, Sichuan3Root, leaf, stem
Rheum palmatumRh. palmatum GSGansu9Roots
Rumex japonicusRu. japonicus ZJTZZhejiang7Roots
Rumex japonicusRu. japonicus SCSNSichuan5Roots
Rumex spp.Ru. BJMYBeijing3Roots
Table 2. PCR amplification primers and amplification procedures.
PrimerSequence (5′ → 3′)Amplification ConditionProduct Length
rps3-rpl22-FCAACGAGTCACACACTAAG94 °C 5 min; (94 °C 30 s, 50 °C 30 s, 72 °C 70 s,
35 cycles); 72 °C 10 min.
1044 bp
rps3-rpl22-RCTAAACACAATAGAGGGTTCG
rpl16-FCCTATTACAGAACCGGAC94 °C 5 min; (94 °C 30 s, 51 °C 30 s, 72 °C 60 s,
35 cycles); 72 °C 10 min.
973 bp
rpl16-RCTTAGTGTGTGACTCGTT
Table 3. Analysis of intraspecific and interspecific genetic distance based on rps3-rpl22 sequence. Three genuine rhubarbs (Rh. tanguticum, Rh. palmatum and Rh. officinale) and their adulterants (Rumex japonicus and Rumex spp.) are unified here as Ru.
SampleInterspecific Genetic
Divergences
Intraspecific Genetic
Divergences
Rh.TRh.PRh.O
Rh. tanguticum 0–0.0060
Rh. palmatum0–0.0060 0–0.0012
Rh. officinale0.0060–0.01080.0060–0.0084 0–0.0012
Ru.0.0205–0.02540.0205–0.02180.0242–0.02540.0000
Table 4. Analysis of intraspecific and interspecific genetic distance based on rpl16 sequence. Including three genuine rhubarbs (Rh. tanguticum, Rh. palmatum and Rh. officinale) and their adulterants (Rumex japonicus and Rumex spp.) are unified here as Ru.
SampleInterspecific Genetic
Divergences
Intraspecific Genetic
Divergences
Rh.TRh.PRh.O
Rh. tanguticum 0–0.0012
Rh. palmatum0–0.0024 0–0.0012
Rh. officinale0.0024–0.00480.0024–0.0048 0–0.0012
Ru.0.0804–0.08450.0804–0.08600.0804–0.08630–0.0013
Table 5. Regression equation.
ComponentsRegression EquationRangeR2
Aloe-emodiny = 25.067x − 3952.50.5–50 μg/mL1.0000
Rheiny = 10.158x + 5820.20.1–120 μg/mL0.9992
Emodiny = 30.231x − 157131–50 μg/mL0.9995
Chrysophanoly = 29.666x − 5833.31–100 μg/mL0.9995
Physciony = 16.549x − 3540.71–100 μg/mL0.9998
Sennoside Ay = 6029.3x – 20.0761–300 μg/mL0.9991
Sennoside By = 9731.7x – 22.5761–100 μg/mL0.9991
Proteinsy = 0.5592x + 0.00960.0059–1.1800 mg/mL0.9987
Polysaccharidesy = 6.3011x − 0.07510.01–0.70 mg/mL0.9953
Table 6. Results of determination of components in rhubarb samples (%, x - ± s, n = 3).
Total AnthraquinonesFree AnthraquinonesCombination AnthraquinonesSennoside BSennoside ATotal SennosidesPolysaccharidesProteins
Rh. tanguticum QH3.896 ± 0.0351.260 ± 0.0452.636 ± 0.0630.057 ± 0.0010.308 ± 0.0020.365 ± 0.00212.842 ± 0.2232.175 ± 0.072
Rh. officinale SCYA0.826 ± 0.0070.607 ± 0.0090.219 ± 0.0020.061 ± 0.0010.072 ± 0.0040.132 ± 0.00510.950 ± 1.4675.769 ± 0.109
Rh. officinale SCMY0.668 ± 0.0120.581 ± 0.0090.087 ± 0.0070.074 ± 0.0010.061 ± 0.0070.135 ± 0.00715.942 ± 1.3581.435 ± 0.180
Rh. palmatum GS0.976 ± 0.0190.372 ± 0.0070.604 ± 0.0180.059 ± 0.0010.063 ± 0.0030.122 ± 0.0031.245 ± 0.1494.797 ± 0.180
Ru. BJMY0.605 ± 0.0140.178 ± 0.0040.427 ± 0.014-0.061 ± 0.0040.061 ± 0.0045.772 ± 0.4870.172 ± 0.072
Ru. japonicus SCSN0.600 ± 0.0130.441 ± 0.0060.159 ± 0.0090.046 ± 0.0010.073 ± 0.0020.119 ± 0.0027.725 ± 1.0840.148 ± 0.109
Ru. japonicus ZJTZ0.926 ± 0.0150.627 ± 0.0090.299 ± 0.0230.054 ± 0.0010.065 ± 0.0070.119 ± 0.0073.870 ± 0.7172.461 ± 0.258
Table 7. Characteristic values and cumulative variance proportion.
Principal ComponentInitial EigenvalueSums of Squared Loadings
TotalVariance Contribution Rate (%)Cumulative Variance Contribution Rate (%)TotalVariance Contribution Rate (%)Cumulative Variance Contribution Rate (%)
15.10363.78663.7865.10363.78663.786
21.54119.26783.0531.54119.26783.053
30.95711.96495.017
40.3334.16599.182
50.0560.69699.878
60.0100.122100.000
70.0000.000100.000
80.0000.000100.000
Table 8. Initial factor loading matrix.
FactorPrincipal Component Load Value
12
Total sennosides0.996−0.006
Total anthraquinones0.972−0.165
Sennoside A0.970−0.223
Free anthraquinones0.9630.149
Combination anthraquinones0.924−0.274
Polysaccharides0.5520.199
Sennoside B0.3630.848
Proteins0.0950.780
Disclaimer/Publisher’s Note: The statements, opinions and data contained in all publications are solely those of the individual author(s) and contributor(s) and not of MDPI and/or the editor(s). MDPI and/or the editor(s) disclaim responsibility for any injury to people or property resulting from any ideas, methods, instructions or products referred to in the content.