Article

Effect of Irrigation and Cultivation Modes on Growth, Physiology, Rice Yield Parameters and Water Footprints

1
College of Agricultural Science and Engineering, Hohai University, No.8 Focheng West Road, Nanjing 211100, China
2
College of Resources and Environmental Engineering, Guizhou University, Guiyang 550025, China
3
Plant Nutrition and Fertilization Department, Guangxi South Subtropical Agricultural Science Research Institute, Chongzuo 532415, China
4
Nanjing Gao Chun District Water Authority Gubai Water Station, Nanjing 211300, China
*
Author to whom correspondence should be addressed.
Agronomy 2024, 14(8), 1747; https://doi.org/10.3390/agronomy14081747
Submission received: 25 June 2024 / Revised: 30 July 2024 / Accepted: 31 July 2024 / Published: 9 August 2024

Abstract

:
Under the background of the worsening global food and water crisis, efficient agricultural practices have become increasingly important. This study investigated the impact of different irrigation and cultivation modes on rice growth parameters, gas exchange, rice yield components, and water footprints in Jiangsu, China. Four treatments were employed in a randomized complete block design with three replications: (i) transplanted rice with frequent shallow irrigation (T-FSI), (ii) transplanted rice with rain-catching and controlled irrigation (T-RCCI), (iii) direct-seeded rice with frequent shallow irrigation (D-FSI), (iv) and direct-seeded rice with rain-catching and controlled irrigation (D-RCCI). The results revealed that the D-RCCI treatment significantly improved growth and physiological parameters. The D-FSI treatment drastically increased rice yield whereas T-RCCI increased the stem bending resistance and reduced lodging risk. The water footprint analysis showed significant water savings by optimized management practices. Compared to T-FSI, the T-RCCI, D-FSI, and D-RCCI treatments reduced the blue-green water footprint by 33%, 25%, and 25%, respectively. Additionally, water production efficiency increased by 13%, 106%, and 154% for T-RCCI, D-FSI, and D-RCCI respectively. The water footprint per unit yield of T-RCCI, D-FSI, and D-RCCI treatments was significantly reduced by 12%, 5,3%, and 63% compared to T-FSI. Overall, D-RCCI is the optimal strategy for rice cultivation in Jiangsu province and similar climatic areas due to its positive impact on yield, water savings, and environmental benefits.

1. Introduction

The food and water crisis are major issues that the world has been facing in the last decade. The global per capita availability of freshwater resources has declined by more than 20% over the past 20 years as the population has expanded [1]. In the past decade, extreme weather has occurred frequently around the world, and global food production has declined [2]. More than 1.2 billion people worldwide are under water stress and drought; more than 11% of farmland and 14% of pastureland are affected by drought; and more than 60% of farmland is facing a shortage of irrigation water [3,4,5]. As one of the main crops in China, rice is the staple food for over 65% of the population [6]. By 2021, the rice planting area reached 30 million hectares, accounting for 23.5% of the total cultivated land in China [7], and the total rice output reached 210 million tons accounting for 31.2% of the total grain output [8]. The yield per unit area of rice remains stable at over 6.5 tons per hectare throughout the year, which is 50.1% higher than the world average [9]. The continuous development of agronomic technology and water-saving irrigation methods play crucial roles in ensuring China’s food security.
Direct seeding is an efficient and economical cultivation method by sowing seeds directly into the field, which eliminates the tedious process of seedling cultivation and transplantation [10]. As China’s agriculture transitions towards precision and efficiency, as well as the increasingly prominent problems such as labor shortage and water scarcity, direct seeding has gained significant attention and adoption [11,12,13]. Studies have shown that direct-seeded rice can attain the same yield as transplanted rice under optimal management conditions [14]. However, at present, how to manage the water content after the direct seeding of rice is not clear, and there is a lack of scientific evidence supporting measures for both flooded and drained cultivation systems [15]. Furthermore, yield stability and lodging resistance in direct-seeded rice require further investigation [16,17].
Agricultural water consumption is the main water use sector in China, accounting for 64.38% of the total water consumption in China [18], but the water use efficiency remains relatively low at 32% [19]. Rice water consumption accounts for 70% of agricultural water consumption and 50% of national water consumption [20]. According to the growing characteristics of rice in different growth stages, different experts proposed a variety of water-saving irrigation modes, such as shallow–frequent irrigation, controlled irrigation, and shallow-wet irrigation [21,22]. However, these modes tend to focus excessively on saving water by restraining physiological water demand and lack sufficient research on improving rainwater utilization in the rainy areas of southern China [23]. In recent years, Jiangsu Province has conducted research on the rain-catching and control irrigation mode. By increasing the depth of water storage after rainfall during periods of moderate drought, this approach improves the utilization rate of rainwater, reduces the frequency and volume of irrigation and drainage, and significantly enhances water-saving and pollution control efforts [24]. However, there are currently few studies on the impact of these water-saving irrigation methods on irrigation drainage and rice growth characteristics.
Rice growth requires appropriate moisture, as both excessive and insufficient moisture can adversely affect rice growth [15]. Appropriate drought stress increased the lodging resistance and dry matter [25]. It was reported that the thousand-grain weight increased after flooding stress, but the number of grains per spike and the fruiting rate decreased significantly and were negatively correlated with the duration and depth of flooding, resulting in a decrease in yield [26].
Alternating drought and flood stresses saved water and improved rainwater utilization while ensuring stability and promoting plant growth [12,27]. Guo et al. [28] showed that rice subjected to a certain degree of alternating drought and flooding stress would reduce plant height, decrease basal internode length, and increase wall thickness and stem thickness, thus improving stem bending resistance and reducing the lodging coefficient. Machekposhti et al. [29] showed that alternating drought and flood stress would reduce the output rate and conversion rate of rice stem sheath storage material increase the stem fullness and stem node dry weight, and thus reduce the lodging coefficient. In addition to stem lodging, root lodging also occurs frequently, affecting rice harvest and yield [30]. Root lodging is related to planting and tillage practices, which alter the root distribution and root area of rice, resulting in differences in the probability of root lodging [31].
The water footprint is based on the theory of virtual water, which refers to the real amount of water resources consumed to provide a product or maintain a consumption service. It is mostly used to account for the impact of certain products and regional activities on water resources [32]. The concept of water footprint provides a new tool for the scientific evaluation and management of water resources. Crop water footprint is used to quantify the amount of water consumed in agricultural production and life from the perspective of consumers [33]. The water footprint of crops generally refers to a specific crop, analyzing and comparing the differences between its blue, green, and gray water footprints and regional differences, to provide a theoretical basis for subsequent cultivation and management [34]. In studies on the spatial distribution of crop water footprints and the factors affecting its distribution at the national scale, previous studies reported that from the southeast coastal region to the northwest region, the water footprints exhibit a U-shaped trend, being high at both ends and low in the middle [35,36].
On the field scale, the traditional water-saving irrigation modes are mainly considered from the aspects of saving water, increasing production, saving labor, and controlling pollution. The water-saving effect is primarily evaluated by comparing water savings, irrigation water productivity, and crop water productivity [37]. However, after considering the footprint of green water and grey water, the water footprint of rice water-saving irrigation modes aimed at reducing irrigation water may not decrease and could even increase [38].
The existing research shows that water-saving irrigation can improve the crops’ lodging resistance and water use efficiency, thus increasing production. However, the research on water-saving irrigation for direct seeding rice remains relatively limited, and the research on water footprint primarily focused on the macro-scale, lacking in-depth research at the field scale. The changing regular pattern of the water footprint of rice under different sowing and planting modes is still unclear. How to put forward a scientific water-saving mode selection method based on the comprehensive evaluation of water footprint, yield, and economic benefits still needs to be explored in depth. Therefore, this study aims to compare the growth, yield, and pollutant loading of rice under different irrigation and sowing modes to identify optimal water management indices and irrigation drainage modes, to improve water and fertilizer utilization efficiency and effectively mitigate non-point source pollution.

2. Materials and Methods

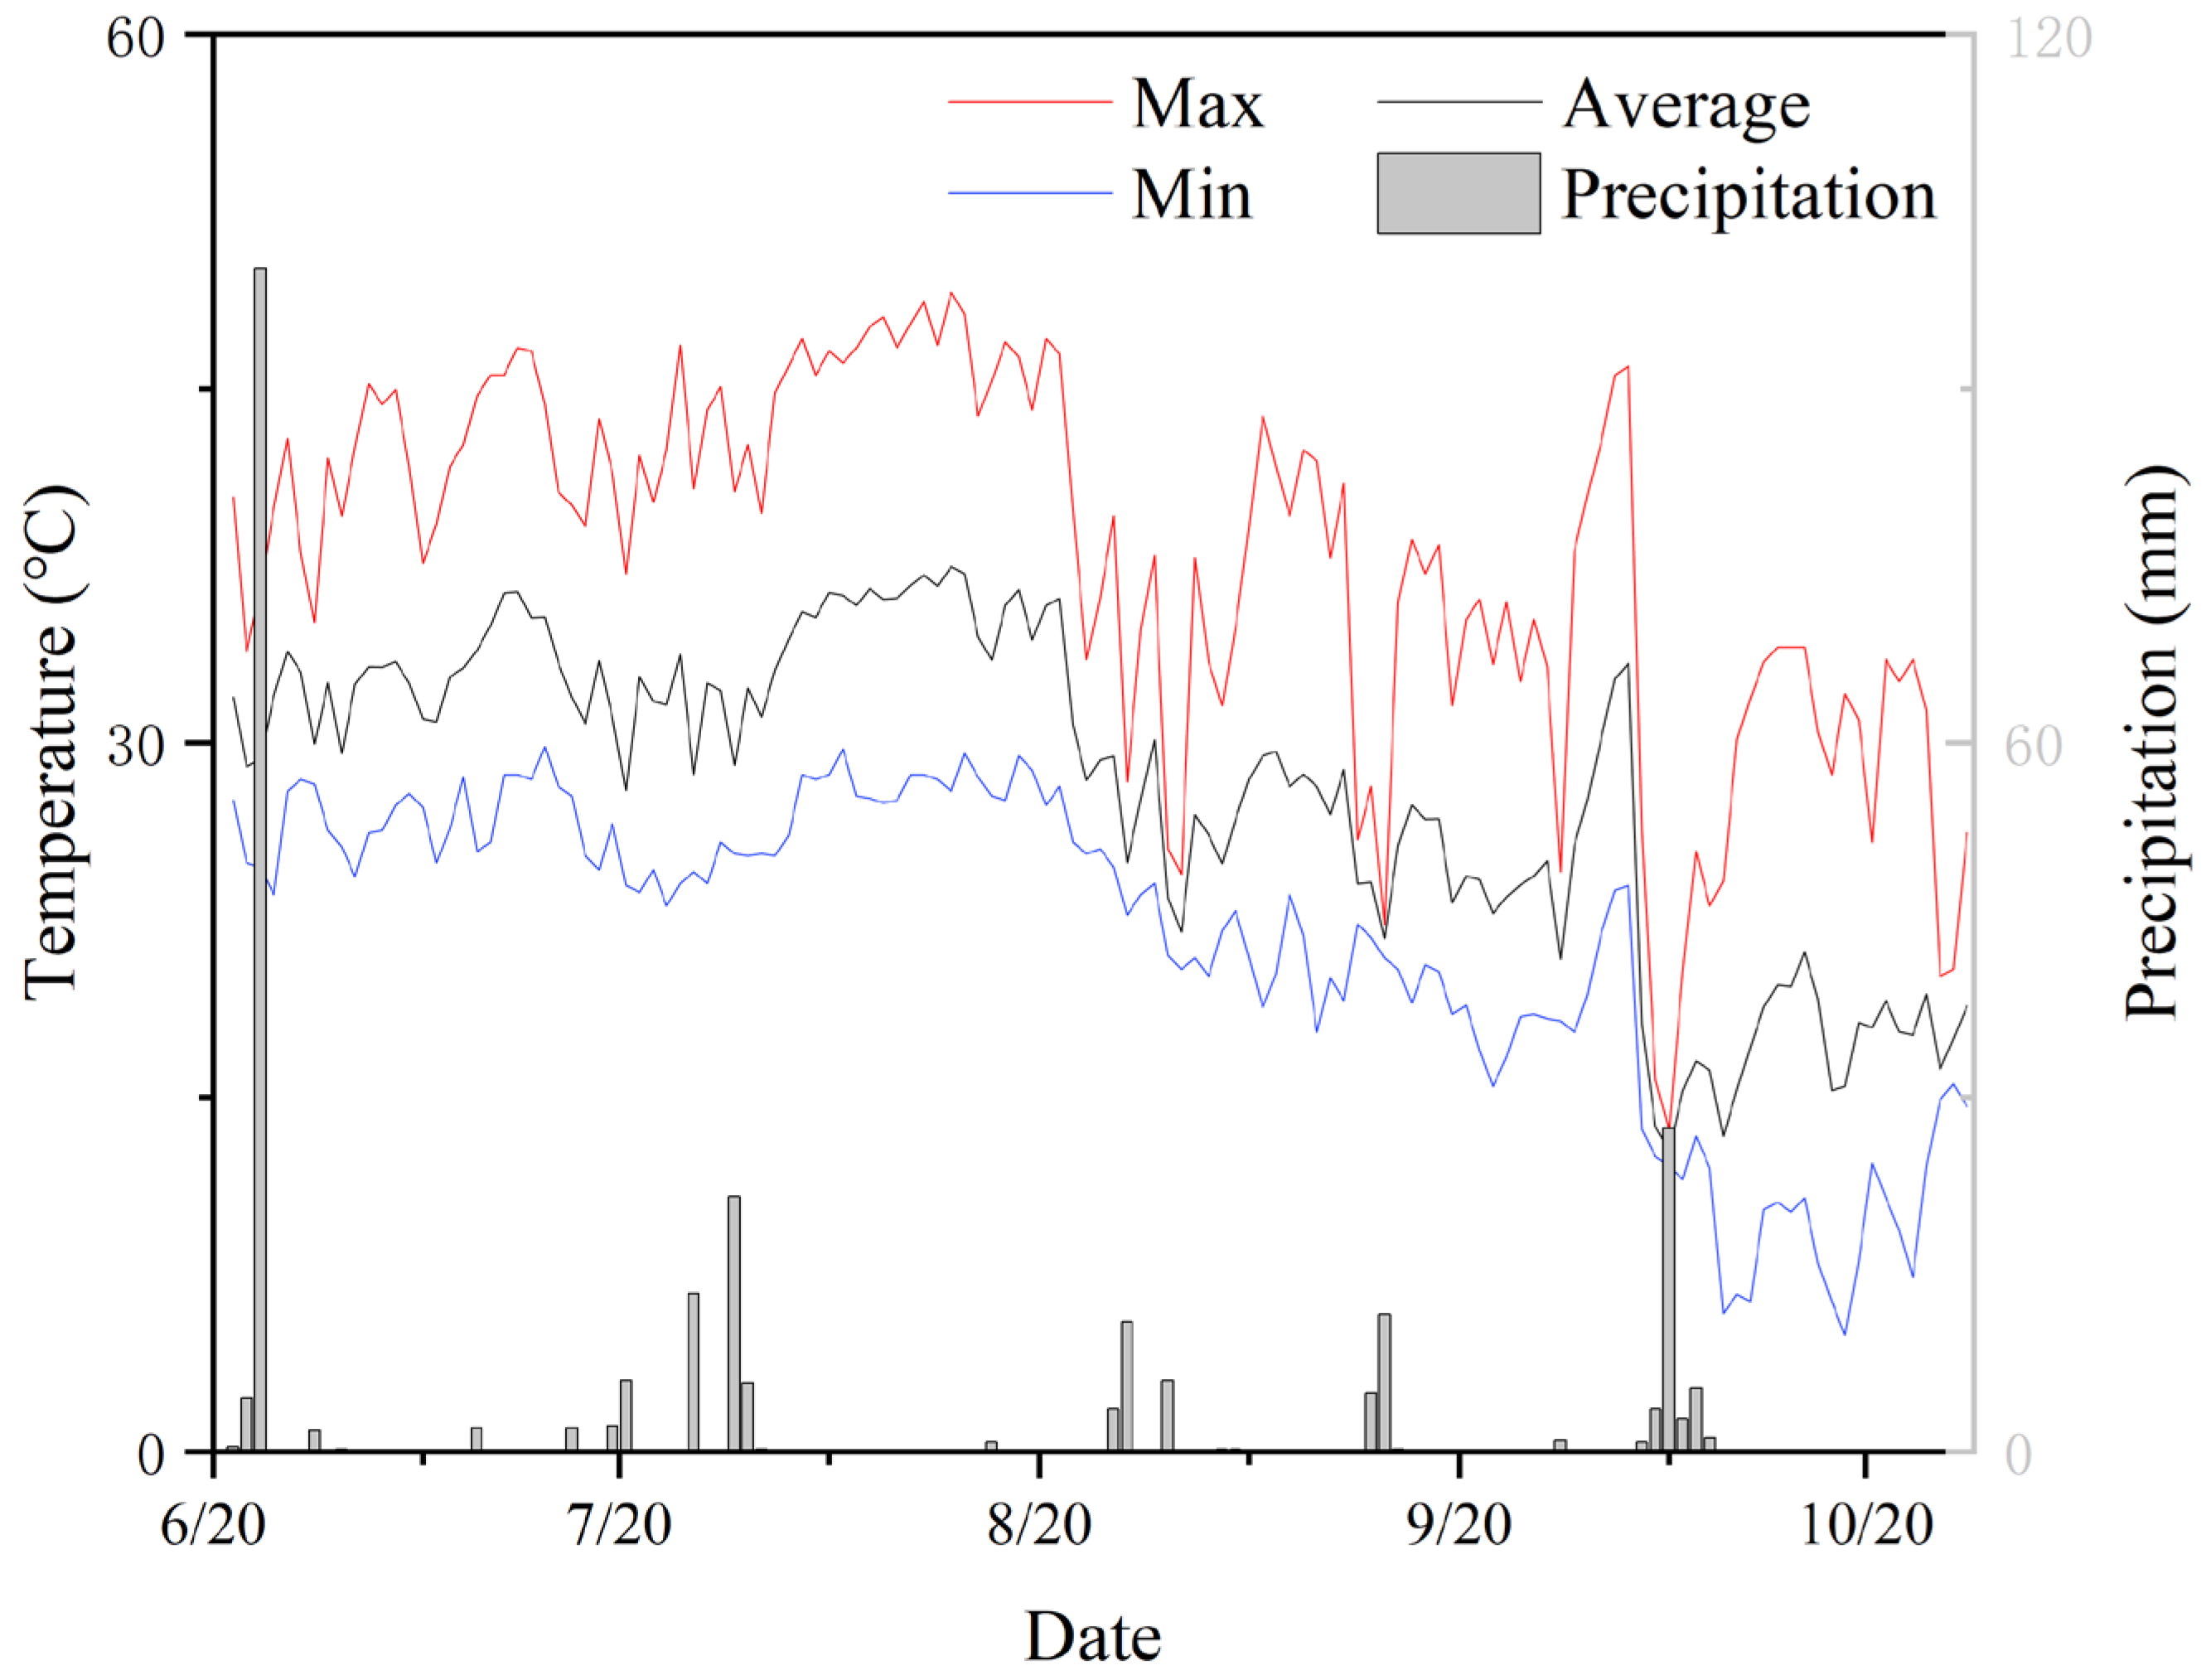
2.1. Experimental Site

The experimental site was located in the High-Efficiency Water Conservation Park of Hohai University Jiangning Campus, Nanjing, China, from June to October 2022. The experimental area features a subtropical monsoon climate characterized by abundant rainfall and concurrent rain and warmth. The long-term average temperature is 15.7 °C, with an annual precipitation average of 1072.9 mm. As shown in Figure 1, the temperature and precipitation of the experimental period were 140.73 mm (seedling stage) and 136 mm (field stage). The soils of this experiment were taken from the Water Conservation Park, and the physicochemical properties of the soils are shown in Table 1.

2.2. Experimental Design

A completely randomized block design with three replicates was employed to compare four treatments comprising irrigation and cultivation modes. The specific parameters for each treatment are shown in Table 2. The T-FSI treatment was used as the control check because it represents the conventional irrigation method commonly used in the region.
Twelve plastic buckets, each with 70 cm inner diameter and 90 cm height, were set in the outdoors without shelter. Before filling the soil, a 10 cm gravel anti-filtration layer was left at the bottom of each bucket to cover the water storage pipe. Then, the air-dried soil was compacted every 5 cm to fill the buckets to eliminate gaps between the soil and bucket. Additionally, a 25 cm water storage depth was reserved for each bucket.
The rice cultivar “Nanjing Japonica 5055” was used for the experiment, known for its high yield and resistance to common rice diseases. This cultivar is widely planted in Jiangsu province due to its adaptability to local climatic conditions. The seedling nursery started on May 22, and seedlings with basically similar sizes of three leaves were selected for transplanting on June 28. Each bucket accommodated five transplant holes for rice cultivation, with three rice plants per hole. The basal fertilizer was applied at the ratio of N:P2O5:K2O (15%:15%:15%), and the amount was 300 kg/ha. After that, 150 kg/ha and 150 kg/ha of urea were applied at tillering and spiking stages on July 13 and August 8 (transplanted rice) and August 1 and August 22 (direct seeded rice), respectively.
Table 3 shows the irrigation modes for paddy fields. The water level was measured daily at 5 p.m. Additional measurements were taken after rainfall, and drainage was carried out in time if the water level was higher than the upper limit of the rain storage. A 50 cm ruler was used to measure the water depth, and TDR (Mini Trase System-Soil Moisture Equipment Corp, Santa Barbara, CA, USA) was used to measure soil water contents.

2.3. Measurements

2.3.1. Crop Water Requirement

The crop water requirement was calculated by the following Equation (1):
ET = P + I D L Δ
where ET means evapotranspiration (mm); P means precipitation (mm), I means irrigation water amount (mm), D means surface drainage (mm), L means infiltration (mm), and Δ means soil water content changes (mm).

2.3.2. Nitrogen and Phosphorus Concentration

The total nitrogen (TN) concentration in water was determined by alkaline potassium persulfate digestion ultraviolet spectrophotometry (GB11894-89) [39]. The ammonia nitrogen concentration (NH4+-N) in water was measured by Nessler’s reagent spectrophotometry (HJ 535-2009) [40]. The nitrate-nitrogen (NO3-N) concentration in water was measured by ultraviolet spectrophotometry (HJ/T 346-2007) [41]. The ammonium molybdate spectrophotometry (GB 11893-89) [42] was used to measure the total phosphorus (TP) concentration in water.

2.3.3. Rice Growth Indicators

The height of rice plants in each bucket was determined from the root-soil interface to the tip of the leaves, and measurements were taken every 7 days during the whole growth stage using a 100 cm steel ruler. From the tillering stage to the ripening stage, three fixed holes were selected for each treatment, and stem thickness measurements were taken every 7 days. The stem thickness measurements were conducted at a depth of 5 cm from the soil surface at the stem base, using an electronic caliper.

2.3.4. Gas Exchange Parameters

During each growth stage, the fully expanded leaf or the flag leaf at the heading stage was chosen from each bucket. Measurements of parameters including net photosynthetic rate (Pn; µmol m−2s−1), transpiration rate (Tr; mol m−2s−1), stomatal conductance (Gs; mol m−2s−1), and intercellular CO2 concentration (µmol mol−1) for each treatment were conducted using a LI-6800 portable photosynthesis system (Li-Cor, Lincoln, NE, USA) between 9:00 a.m. and 11:00 a.m. on a cloudless morning. The settings included a red-blue light source, a photosynthetic photon flux density set at 1500 µmol m−2s−1, a leaf chamber CO2 concentration of 400 µmol mol−1, leaf chamber relative humidity of 50%, and leaf chamber temperature maintained at the ambient temperature.

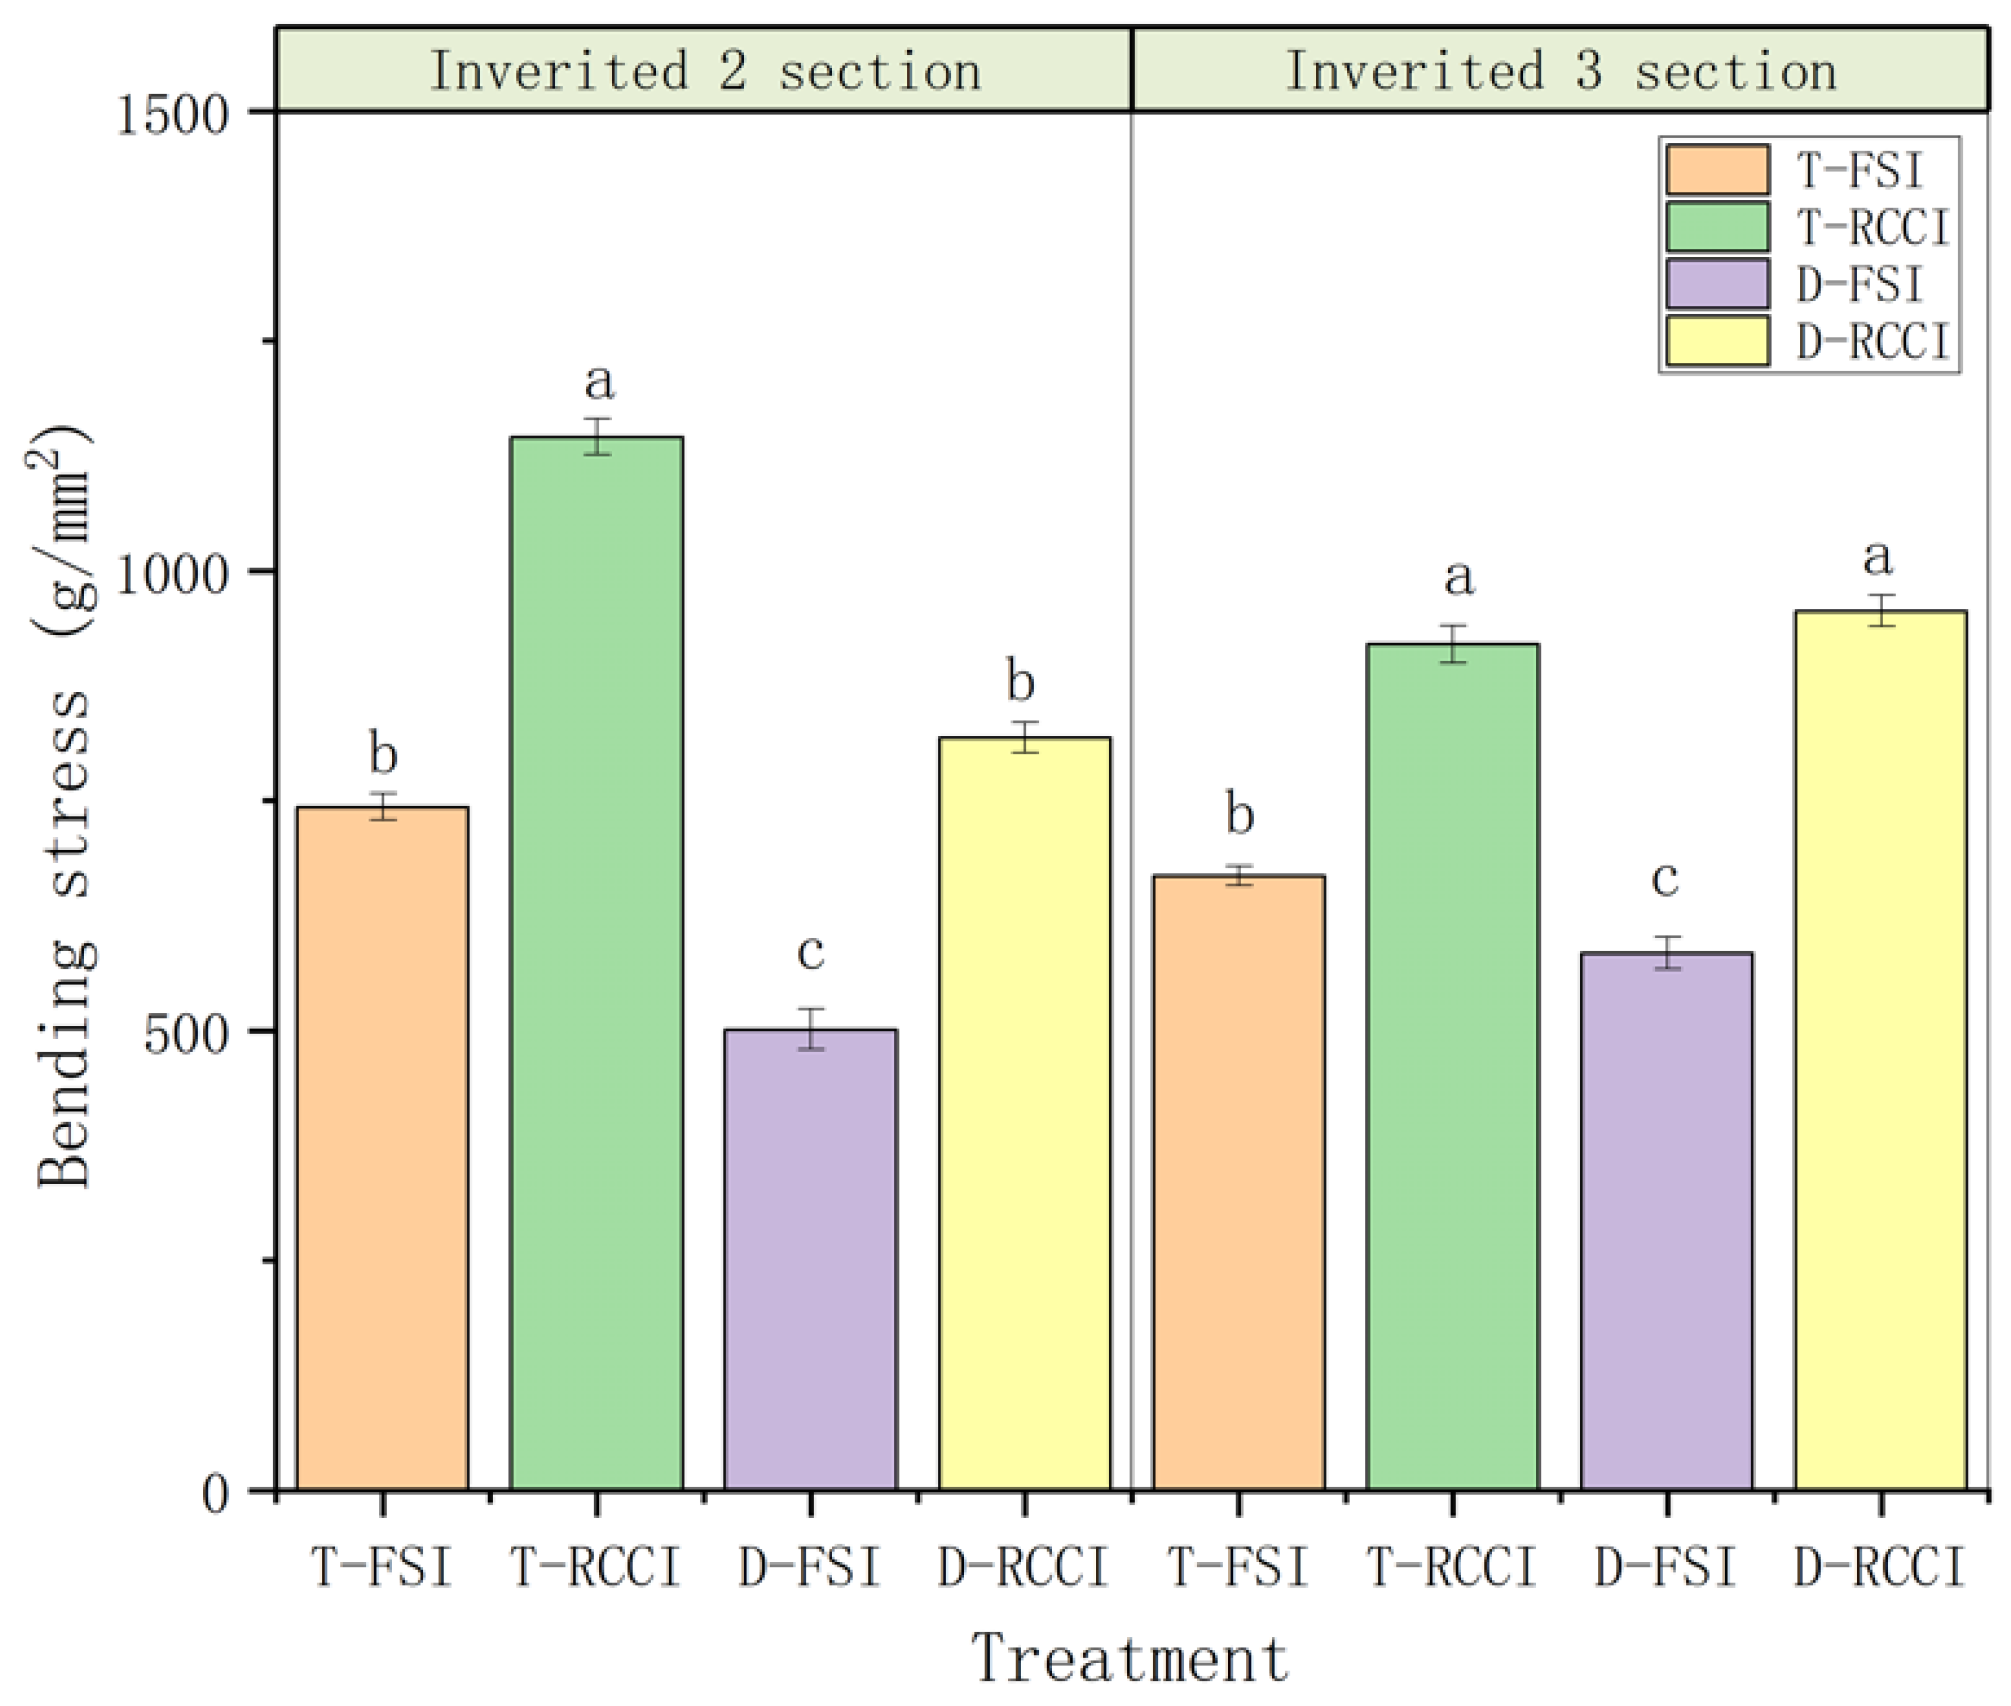
2.3.5. Lodging Coefficient and Stem Bending Resistance

Five days before rice harvest, stem samples were collected to determine morphological indices and mechanical properties. One representative hole was sampled from each bucket, and for each hole, three main stems were selected. These stems were harvested while retaining the leaf sheaths, leaf blades, and spikes intact. Indexes such as stem flexural strength were measured without any loss of water, as described below:
(1) Stem length and internode length:
A ruler was used to measure the lengths of the second and third sections from the base of the stem tiller, as well as the lengths from the base of each section to the top of the spike.
(2) Fresh weight:
The fresh weight of the aboveground parts of the rice was measured, followed by fresh weight measurement of the panicles, stems, and each internode separately.
(3) Internal and external diameter and stem wall thickness:
The maximum and minimum diameters of each internode were measured internally and externally, and multiple measurements were made to obtain an average value. The wall thickness at four points at each end of the internode was measured, and the average thickness was calculated to determine the internode wall thickness.
(4) Stem bending resistance:
The stem was placed horizontally on the electronic stem strength testing equipment (CMT6104, Shenzhen Century Tianyuan Instrument Co., Ltd., Shenzhen, China), and both ends were fixed to form a supported beam, leaving a 6 cm span in the middle for testing the bending resistance of the rice stem. Vertical pressure was applied from top to bottom at a speed of 0.1 mm/s by the sensor until the stem yielded and failed, which represents the maximum bending resistance of the stem (Fmax).
(5) Crack flexural torque:
M = 1000 × L × F m a x 4 g
where M means the crack flexural torque (g m); Fmax means the maximum bending resistance of the stem (N); L means the span between the two support points (cm); and g denotes the acceleration of gravity (N/kg).
(6) Inter-nodal moment of inertia:
I b = π ( a b 3 ( a t ) ( b t ) 3 ) 4
Ib means the intersection moment of inertia (mm4), a means the longitudinal axis diameter of the cross-section between nodes (mm), b means the transverse axis diameter of the cross-section between nodes (mm), and t means the stem wall thickness (mm).
(7) Young’s modulus of elasticity:
E = F m a x L 48 δ I b
E means the Young’s modulus of elasticity of the stem (MPa), Fmax means the maximum bending resistance of the stem (N), and δ means the central deflection of the stem when yield damage occurs (mm).
(8) Cross-sectional modulus:
S m = b 1 3 a 1 b 2 3 a 2 32 b 1
Sm means stem cross-sectional modulus (mm3); a1 means the major axis diameter of the cross-section outer diameter, mm; a2 means the major axis diameter of the cross-section inner diameter, mm; b1 means the minor axis diameter of the cross-section outer diameter (mm); and b2 means the minor axis diameter of the cross-section inner diameter (mm).
(9) Bending stress:
B s = 10 × M S m
Note: Bs means the stem bending stress (g/mm2).
(10) Single stem mass moment of inertia:
W p = S L × F W
Wp means the bending moment exerted on the base internode of the entire plant, SL means the distance from the breakage point to the tip of the main stem (cm), and FW means the fresh weight from the breakage point to the tip of the main stem (g).
(11) Lodging index:
L i = W p M
Li means the lodging index of the stem.

2.3.6. Yield

The rice samples were dried at 105 °C in the oven for 15 to 30 min and then were dried at 75 °C in the oven until constant weight to determine the yield of each treatment.

2.3.7. Water Footprints

The crop blue-green water footprint is equal to the crop emigration and is calculated as follows:
BGWF = ET = P + I D L Δ
where BGWF means crop blue-green water footprint (mm), ET means evapotranspiration (mm), P means precipitation (mm), I means irrigation water amount (mm), D means surface drainage (mm), L means infiltration (mm), and Δ means soil water content changes (mm).
The gray water footprint refers to the amount of freshwater required to dilute pollutant concentrations to specified levels. Therefore, the gray water footprint is only generated when pollutant concentrations in agricultural drainage exceed the standards. We assumed that there are “N” times of surface drainage, with “i” pollutants and zero concentrations of various pollutants in fresh water.
Gray water footprint from pollutant i:
GWF i = q = 1 N h q C q i C max i C max i
GWFi means the gray water footprint generated by the i-type pollutant (mm), hq means the volume of drainage for the q-th instance (mm), C q i means the concentration of pollutant i in the q-th drainage (mg/L), and C max i means the maximum environmentally permissible concentration of the i-th pollutant (mg/L), when C q i C max i ≤ 0, then GWF i = 0.
Crop gray water footprint (mm):
GWF = max [ GWF 1 , GWF 2 , GWF 3 ]
Note: In this study, the maximum allowable concentration for total nitrogen is 2 mg/L, and for total phosphorus, it is 0.2 mg/L.
Water footprint (mm):
CWF = BGWF + GWF

2.3.8. Water Use Efficiency

The unit yield gray water footprint represents the gray water footprint generated per unit mass of saturated grain produced, commonly used to quantify the environmental impact of rice production. The equation is as follows:
GWF g = 10 × GWF Y
GWF g means gray water footprint per unit of yield (m3/kg), Y means rice yield (kg/ha).
The water footprint per unit yield represents the amount of water footprint consumed to produce a unit mass of rice grains, used to measure the efficiency of crop water resource utilization. The equation is as follows:
CWF g = 10 × CWF Y
Water use efficiency is used to measure the efficiency of water resource utilization by crops.
WUE = Y 10 × WU
WUE means water use efficiency, kg/m3; WU means total water consumption (mm).
IWP = Y 10 × IW
IWP means irrigation water productivity (kg/m3), IW means irrigation water volume in paddy fields (mm).

2.4. Statistical Analysis

One-way ANOVA and correlation analysis between different parameters were performed using SPSS (IBM SPSS Statistics 26, Armonk, NY, USA), and corresponding plots were plotted using Origin 2023 (OriginLab Corporation, Northampton, MA, USA).

3. Results

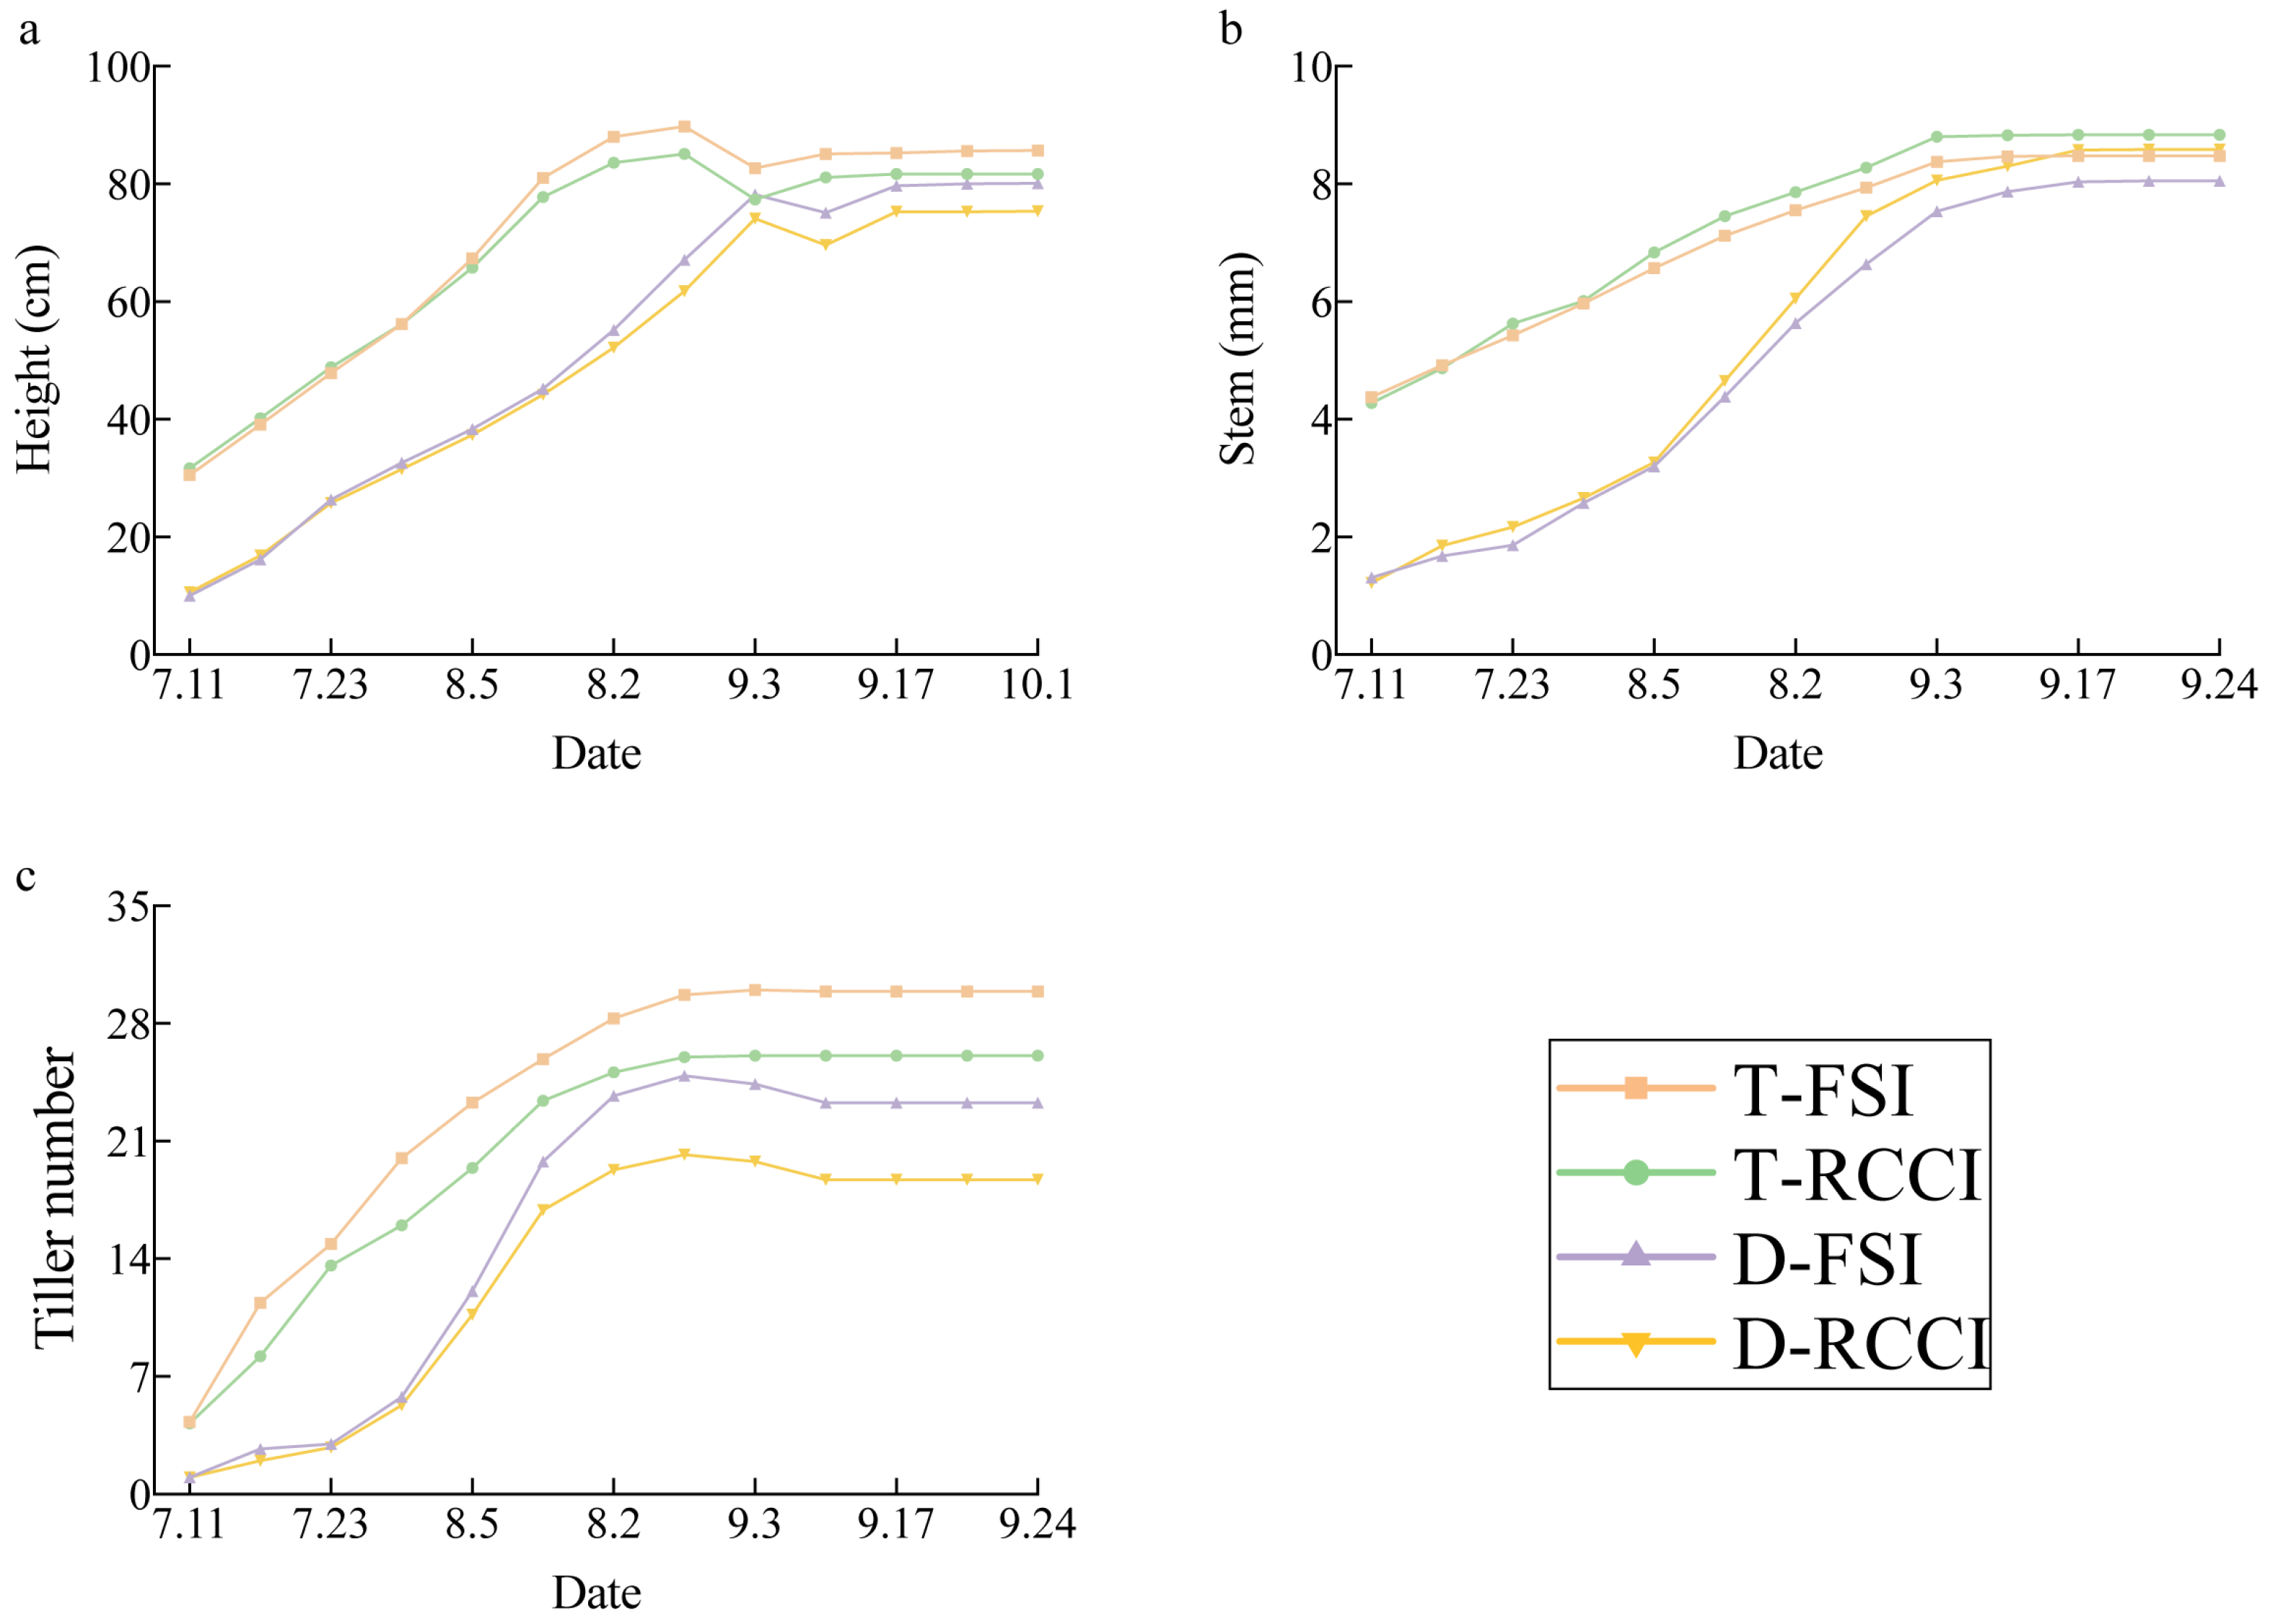
3.1. Effect of Treatments on Plant Growth Parameters

Figure 2a shows the height changes of transplanted rice and direct-seeded rice under two different irrigation modes. The trends of height variation in different treatments were similar, showing an initial increase followed by stability. In the growth period, the cultivation mode had a significant effect on rice plant height, while the irrigation and drainage mode had a significant effect on plant height after the tillering stage. At the same stage, the differences among the four treatment groups were all significant (p < 0.05) and exhibited the following trend: T-FSI > T-RCCI > D-FSI > D-RCCI. At the yellow ripeness stage, the heights of T-FSI, T-RCCI, D-FSI, and D-RCCI were 85.7 cm, 81.7 cm, 80.1 cm, and 75.4 cm, respectively.
Figure 2b illustrates that the stem diameter increase for direct-seeded rice was significantly higher than transplanted rice, and compared to FSI, RCCI significantly increased rice stem thickness. For transplanted rice, significant differences in rice stem thickness among different irrigation modes were observed at the tillering stage. However, for direct-seeded rice, significant differences in rice stem thickness were observed during the booting stage. The final stem thicknesses were 8.48 mm, 8.84 mm, 8.05 mm, and 8.59 mm under the T-FSI, T-RCCI, D-FSI, and D-RCCI, respectively.
Figure 2c shows the trend of the tiller number of rice under different irrigation and cultivation modes. Compared to direct-seeded rice, transplanted rice exhibited significantly higher tillering capacity and the tiller number in FSI treatments was significantly higher than in the RCCI treatments. As ineffective tillers withered, the number of rice tillers remained stable after the heading and flowering stage. The final tiller numbers were 29.9/hole, 26.1/hole, 23.3/hole, and 18.7/hole under T-FSI, T-RCCI, D-FSI, and D-RCCI, respectively.
Bending stress is the maximum pressure that rice can withstand per unit cross-section. As shown in Figure 3, the bending stress of rice under different treatments in the inverted two nodes was ranked as follows: T-RCCI > D-RCCI > T-FSI > D-FSI. The cultivation mode and irrigation and drainage mode both had a significant effect on bending stress in the inverted two nodes (p < 0.05), and the two together had no significant effect on bending stress in the inverted two nodes (p > 0.05). The size of bending stress in rice under different treatments in the inverted three nodes was ranked as follows: D-RCCI > T-RCCI > T-FSI > D-FSI. Irrigation and drainage modes all had a significant effect on bending stress in the inverted three sections (p < 0.05), and the cultivation mode and the cultivation mode irrigation and drainage mode together had no significant effect on bending stress in the inverted three sections (p > 0.05). Compared to inverted two nodes, transplanted rice decreased the bending stress in inverted three nodes, and direct-seeded rice increased the bending stress up to three nodes.

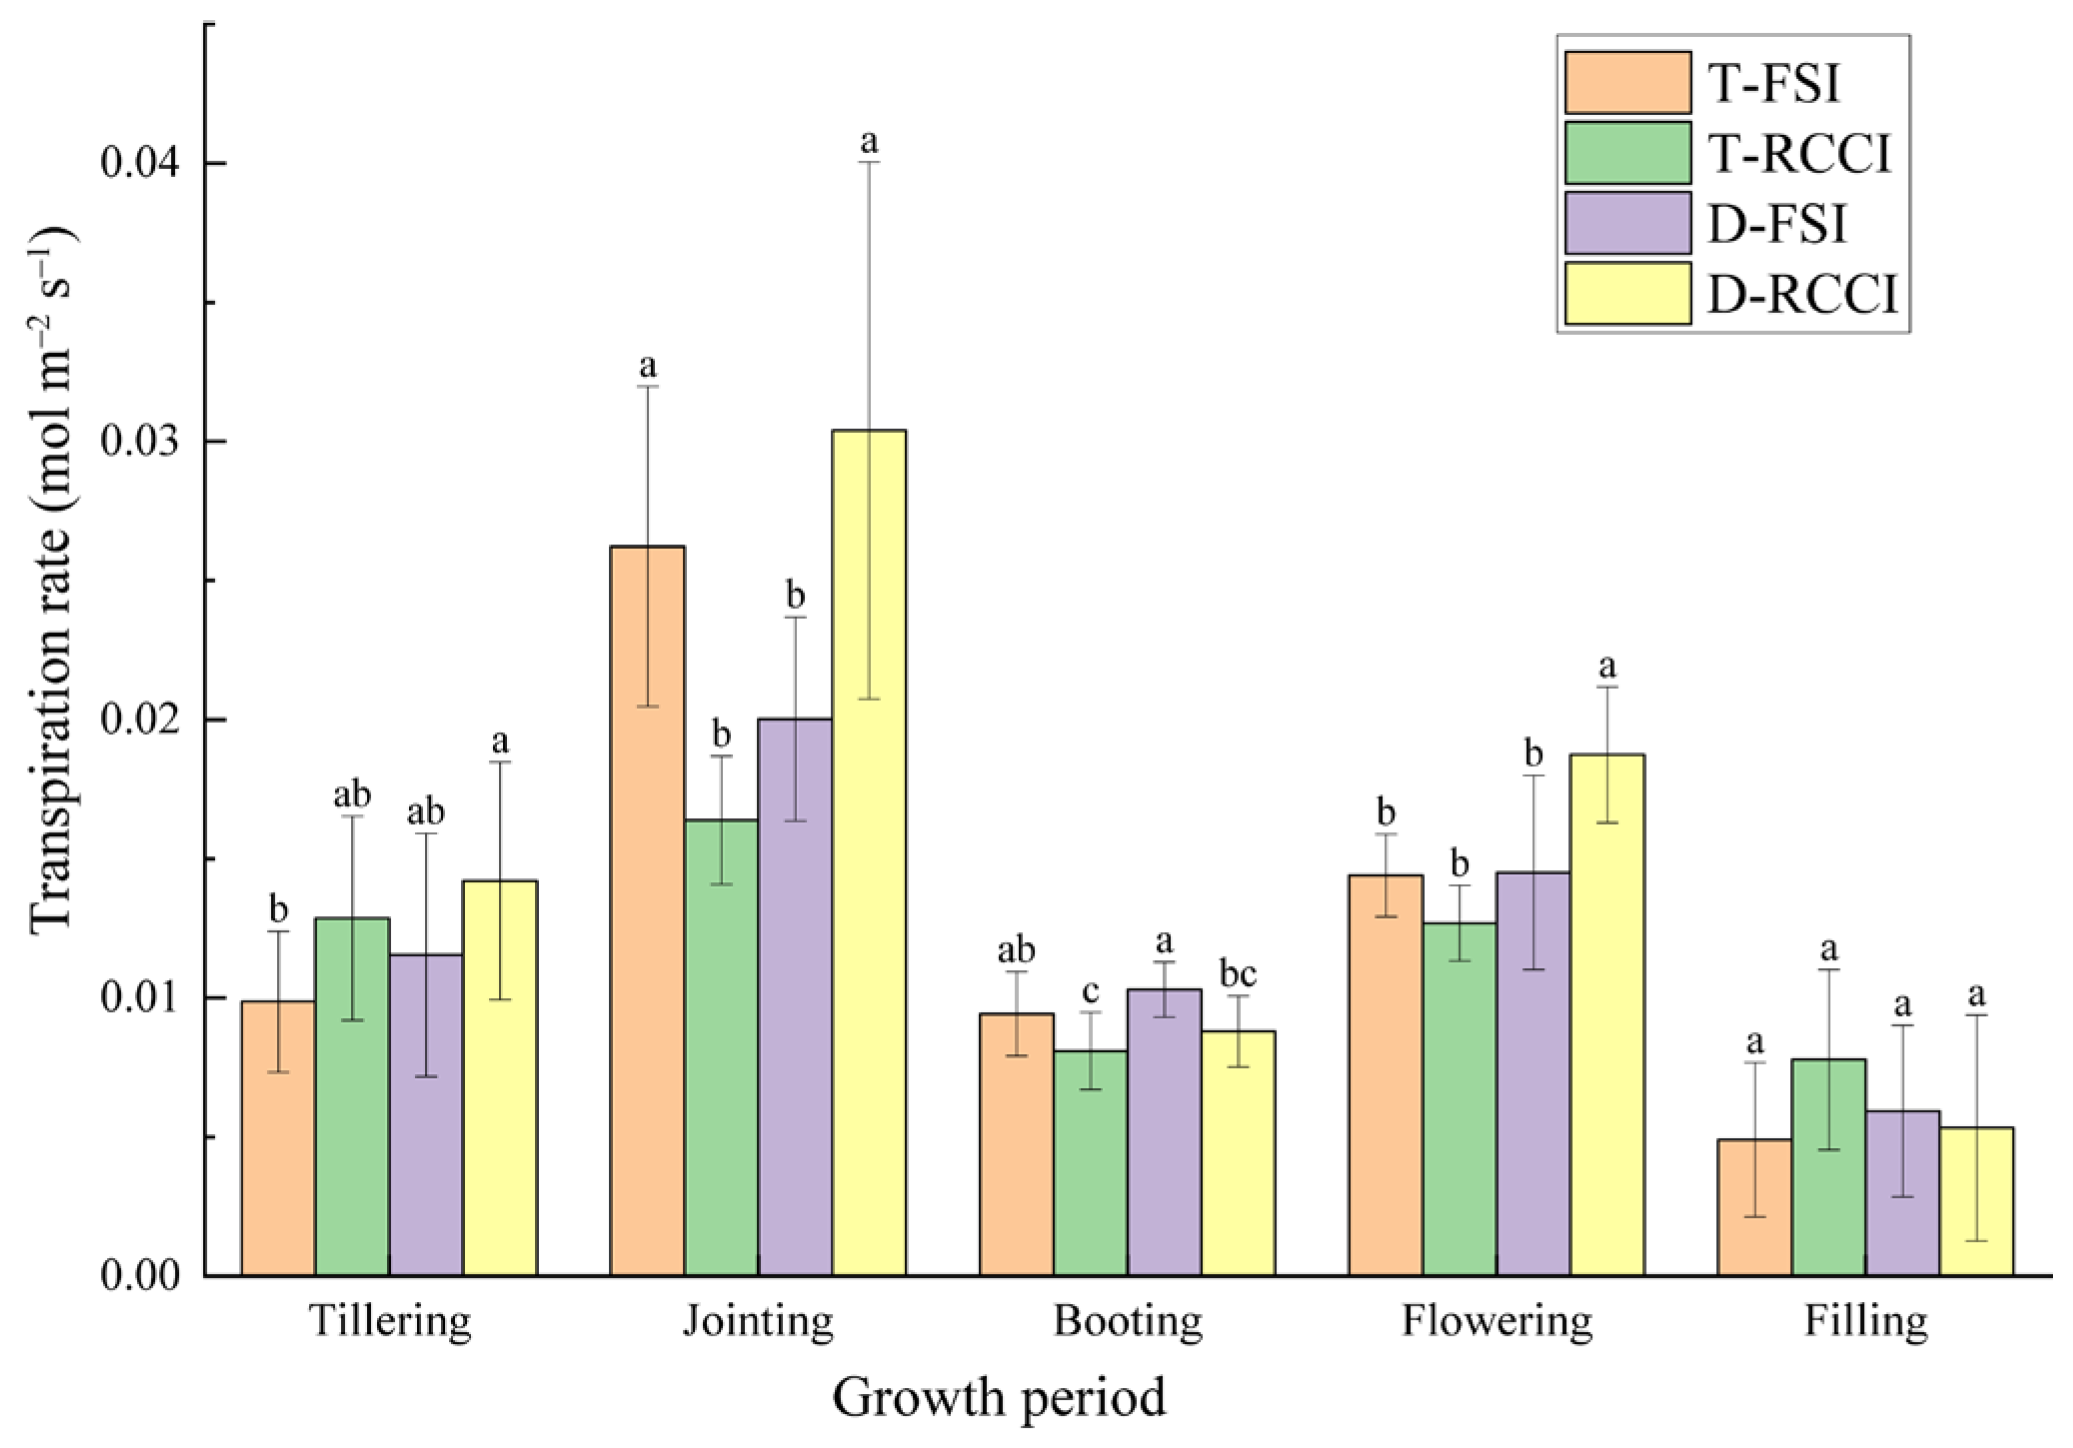
3.2. Effects of Treatments on Gas Exchange

Effects of irrigation and cultivation modes on the net photosynthetic rate (Pn), transpiration rate (Tr), stomatal conductance (Gs), and intercellular CO2 concentration for each treatment at different growth stages are depicted in Figure 3, Figure 4, Figure 5 and Figure 6. Overall, as rice progressed from nutritional to reproductive growth, the leaf physiological traits of Pn, Ci, Gs, and Tr showed a fluctuation trend, with a similar trend observed across them.
Figure 4 shows the effects of various irrigation and cultivation patterns on rice transpiration rates varied at different growth stages. At the booting and heading stages, there was a notable increase in the transpiration rate among the four treatments compared to other stages. Significant differences among the various treatments were also observed. The transpiration rates in the T-RCCI and D-FSI treatments were significantly lower than those in the T-FSI treatment (26.23), decreasing by 38% and 24%, respectively. Although the transpiration rate in the D-RCCI treatment increased by 16% compared to the T-FSI treatment, the difference was not statistically significant.

3.2.1. Intercellular CO2 Concentrations

The changes in intercellular CO2 concentration (Ci) of rice leaves under different irrigation and cultivation modes are illustrated in Figure 5. Ci showed a similar trend with Tr under different treatments.
Specifically, there was an increase in Ci from the tillering stage to the jointing stage, a subsequent decrease from the booting stage to the flowering stage, and approximate equivalence between the jointing and booting stage and the milky stage. The trend of changes in different cultivation modes varied from the milky to the yellow stage, with an increasing trend for transplanted rice and a decreasing trend for direct-seeded rice. The intercellular CO2 concentration of rice under different irrigation and cultivation modes also varied among fertility periods. At the tillering stage, significant differences (p < 0.05) were observed among the four treatment groups. The highest intercellular CO2 concentration of 325.66 µmol/mol was found in the T-SFI, while T-RCCI, D-FSI, and D-RCCI significantly reduced the intercellular CO2 concentration, with percentage decreases of 8%, 10%, and 5%, respectively. At the jointing stage, significant differences (p < 0.05) persisted among all treatments, with T-FSI having the largest intercellular CO2 concentration of 327.49 µmol/mol. Compared to T-FSI, T-RCCI and D-RCCI showed reduced intercellular CO2 concentrations, with non-significant differences and decreasing ratios of 2% and 1%, respectively. D-FSI significantly reduced the intercellular CO2 concentration, with a decrease ratio of 4%. At the tassel setting stage, significant differences (p < 0.05) were observed among the four treatments, with T-FSI having an intercellular CO2 concentration of 287.02 µmol/mol. T-RCCI increased the intercellular CO2 concentration significantly, with an increased rate of 6.51%, while D-FSI and D-RCCI also increased it but with no significant differences, showing increases of 4% and 5%, respectively. At the milky ripening stage, significant differences (p < 0.05) among the treatments persisted, with T-FSI having the smallest intercellular CO2 concentration of 289.20 µmol/mol. T-RCCI and D-FSI increased the concentration but with no significant differences, showing percentage increases of 3% and 1%, respectively. D-RCCI significantly increased the intercellular CO2 concentration, with a percentage increase of 5%. At the yellow ripening stage, significant differences (p < 0.05) were observed among the four treatments, with T-FSI having an intercellular CO2 concentration of 329.40 µmol/mol. T-RCCI increased the concentration, with a non-significant difference and an increase of 2%, while D-FSI and D-RCCI significantly decreased the concentration, with decreasing proportions of 13% and 14%, respectively.

3.2.2. Stomatal Conductance

Figure 6 depicts the stomatal conductance of rice at all fertility stages under different treatments, revealing similar trends. At the tillering stage, the stomatal conductance values for the four treatments were 0.30 mol m−2 s−1 (T-FSI), 0.36 mol m−2 s−1 (T-RCCI), 0.34 mol m−2 s−1 (D-FSI), and 0.40 mol m−2 s−1 (D-RCCI), respectively. Stomatal conductance increased to varying degrees from the tillering stage to the jointing and spike stage for all treatments, followed by a decrease from the jointing stage to the booting and flowering stage. The conductance then increased from jointing to milk maturity and decreased from milk maturity to yellow maturity across different treatments. The stomatal conductance of rice varied at different fertility stages and under different irrigation and cultivation patterns. At the tillering stage, no significant differences were observed among the four treatments (p > 0.05). Compared to transplanted shallow water-irrigated treatment, T-RCCI, D-FSI, and D-RCCI increased stomatal conductance, with non-significant differences between them and percentage increases of 22%, 14%, and 34%, respectively. At the jointing and spike stage, significant differences were noted among the four treatments (p < 0.05). T-RCCI and D-FSI decreased stomatal conductance compared to T-FSI, but the differences were not significant, with decreasing proportions of 15% and 11%. D-RCCI increased stomatal conductance, but the differences were not significant, with an increasing proportion of 3%. At the booting and flowering stage, no significant differences were observed among the four treatments (p > 0.05). T-RCCI, D-FSI, and D-RCCI increased stomatal conductance compared to T-FSI, with non-significant differences and proportions of increase being 8%, 10%, and 23%. At the milky ripening stage, significant differences were found among the four treatments (p < 0.05). T-RCCI showed approximately equal stomatal conductance compared to T-FSI, while D-FSI and D-RCCI significantly increased stomatal conductance, with proportions of increase at 39% and 38%, respectively. At the yellow ripening stage, no significant differences were observed among the four treatments (p > 0.05). T-RCCI, D-FSI, and D-RCCI increased stomatal conductance, with non-significant differences and proportions of increase at 45%, 17%, and 11%, respectively.

3.2.3. Net Photosynthetic Rate

Figure 7 illustrates the trend of net photosynthetic rate in rice at different fertility stages under various irrigation and cultivation methods. The net photosynthetic rate consistently increased during normal growth and development, reaching its peak at the jointing and spiking stage. Subsequently, as the reproductive period advanced, the net photosynthetic rate generally exhibited a decreasing trend, with a slight increase observed at the milky ripening stage.
Under the same irrigation mode, direct-seeded rice exhibited a higher net photosynthetic rate than transplanted rice. For direct-seeded rice, the net photosynthetic rate in the RCCI treatment is significantly higher than in the FSI treatment. However, for transplanted rice, during the tillering and jointing stages, the RCCI treatment surpasses the FSI treatment, while in later stages, the pattern is reversed.

3.3. Effect of Treatments on Production Parameters

The effect of treatments on yield parameters and water production efficiency are presented in Table 4. Affected by high temperature, the seed setting rate and yield of transplanted rice decreased significantly. The yield rankings for each treatment are as follows: D-FSI > D-RCCI > T-FSI > T-RCCI, with 9031 kg/ha, 8088 kg/ha, 5525 kg/ha, and 4151 kg/ha respectively.
Compared to T-FSI, the yield under T-RCCI decreased by 25%. However, due to the lower irrigation volume, water productivity significantly increased by 26%, reaching 0.68 kg/m3. Due to the delayed reproductive stage of direct-seeded rice, it mitigates the impact of high temperatures on panicle development. Compared to T-FSI treatment, D-FSI treatment demonstrates a significant increase in yield of 64%. Furthermore, water productivity has significantly risen by 110%, reaching 1.13 kg/m3. Compared to the T-FSI treatment, the D-RCCI treatment demonstrates a yield increase of 46%. Despite significantly lower irrigation water usage compared to other treatments, it achieves the highest water productivity, reaching 1.53 kg/m3. Compared with T-FSI, the water production efficiency of the D-RCCI increased by 150%, followed by D-FSI and T-RCCI, with 104% and 14%, respectively.

3.4. Impact of Different Irrigation and Cultivation Patterns on the Water Footprint Per Unit of Rice Production

3.4.1. Graywater Footprint Per Unit Yield

As shown in Table 5, compared to T-FSI treatment, T-RCCI, D-FSI, and D-RCCI treatments exhibit reductions of 57%, 5%, and 76%, respectively, in the gray water footprint per unit yield during the paddy field period. Similarly, throughout the whole growth period, they decrease by 40%, 24%, and 80%, respectively. Considering the gray water footprint and the gray water footprint per unit of yield, the D-RCCI treatment was the most environmentally friendly compared with other treatments.

3.4.2. Water Footprint Per Unit of Crop Production

The unit yield water footprint of rice under different planting irrigation patterns is shown in Table 6. The rice yield under T-FSI treatment was lower, the water footprint in the field period was the largest among the four treatment groups, and the resulting rice unit yield water footprint was the highest among the four groups, with decreased environmental benefits. Compared with the T-FSI treatment, the T-RCCI treatment reduced rice yield, but the water footprint of the field period significantly reduced at the same time, the water footprint of the rice unit yield was also reduced by 13%, and the environmental benefits were improved. D-FSI treatment improved the yield, and at the same time, significantly reduced the water footprint of the field period; the water footprint of the rice unit yield was reduced by 52%, and the environmental benefits were improved. Although the D-RCCI treatment had a decreased yield compared with the D-FSI treatment, it was still larger than the T-FSI treatment, the water footprint was the smallest among the four groups of treatments, and the water footprint of rice unit yield was the smallest among the four groups of treatments, which was reduced by 62% compared with the T-FSI treatment. The order of rice unit yield water footprints at the full-life stage under different irrigation and cultivation modes was as follows: T-FSI > T-RCCI > D-FSI > D-RCCI. Compared with the T-FSI treatment, the water footprint of the rice unit yield was reduced by 12%, 523%, and 63% in the T-RCCI, D-FSI, and D-RCCI treatments, respectively.

4. Discussion

4.1. Effect of Treatments on Plant Growth Parameters

The height and stem diameter of rice are significantly correlated with the flexural strength and lodging resistance of rice stems, making them important biological traits for rice growth [25,28,43]. Compared with transplanted rice, direct-seeded rice has a shorter growth period and insufficient nutrient accumulation. Consequently, direct-seeded rice exhibits a lower plant height, stem diameter, and tiller number. Due to water deficiency, the plant height under rain-catching and controlled irrigation is lower than that under frequent–shallow irrigation. However, the stem diameter under rain-catching and controlled irrigation is thicker than that under frequent–shallow irrigation, as adequate water promotes rice growth, resulting in longer internode length and smaller stem diameter. Although the tiller number of FSI was higher than that of RCCI, the irrigation and drainage pattern had no significant effect on the tiller number. The transplanted rice plant height was higher in the FSI treatment and was the highest among the four treatments, while the stem thickness was the third highest among the four treatments. The rice plant height was suppressed by drought stress in the transplanted RCCI treatment, which was the second highest among the four treatments. Under the D-FSI treatment, the plant height and stem thickness were both reduced compared with the T-FSI, with plant height being the third and stem thickness being the smallest among the four treatments. The number of tillers of transplanted rice increased significantly due to high temperature, and the number of tillers of rice under T-FSI treatment was the largest among the four groups. The number of tillers of rice under T-RCCI decreased compared with that of T-FSI, but there was no significant difference, and it was still larger than that of direct-seeded rice. The number of tillers of the D-FSI and D-RCCI was significantly smaller than that of T-FSI.
Compared with the T-FSI, the direct-seeded modes inhibited the growth of rice, and the plant height, stem thickness, and tiller number were reduced to different degrees, and the differences were significant (p < 0.05). Compared with T-FSI, T-RCCI had different effects on rice plant height, stem thickness, and tiller number. The T-RCCI treatment significantly reduced the height of rice plants; it promoted the thickness of rice stems, which was significant; and it reduced the number of tillers, but there was no significant difference. Compared with T-FSI, the effects of D-RCCI on plant height and number of tillers had the same synergistic effect, and the plant height and number of tillers of D-RCCI were significantly smaller than that of the T-FSI. The effects on stem thickness were antagonistic, and the stem thickness of the D-FSI was larger than that of the T-FSI, but there was no significant difference between the two treatments.

4.2. Gas Exchange Parameters

Leaf surface stomatal transpiration is the main pathway of plant transpiration, accounting for about 90% of the total transpiration of the plant [44,45]. At the tillering stage, significant differences (p < 0.05) were observed among the four treatments, with the transplanted shallow water intensively irrigated treatment showing the lowest transpiration rate. Comparatively, the transpiration rates of T-RCCI and D-FSI treatments were higher than T-FSI, though not significantly so. Notably, the transpiration rate of the D-RCCI treatment was significantly higher than T-FSI, indicating a substantial increase of 44%. At the jointing and spike stage, significant differences (p < 0.05) persisted, with T-FSI treatment having the highest transpiration rate. The T-RCCI and D-FSI treatments exhibited significantly lower transpiration rates, with reductions of 38% and 24%, respectively. Although D-RCCI had a higher transpiration rate than T-FSI, the difference was not significant (p < 0.05), indicating a 16% increase. During the spike and flowering period, significant differences (p < 0.05) in transpiration rates were maintained, with the transplanted shallow irrigated treatment having the lowest rate. At the milky ripening stage, significant differences (p < 0.05) in transpiration rates were still observed among the treatments. T-FSI had the highest rate, while T-RCCI inhibited transpiration by 12%, D-FSI increased it by 1% (not significantly different from T-FSI), and D-RCCI significantly increased it by 30%. At the yellow ripening stage, no significant differences (p > 0.05) were found among the four treatments. The results indicated that different irrigation and cultivation patterns had varying effects on the transpiration rate of rice at different fertility stages, with significant differences observed in several instances.
At the tillering stage, the significant differences among treatments suggest varying impacts on intercellular CO2 concentration [46]. T-SFI exhibited the highest concentration, while T-RCCI, D-FSI, and D-RCCI significantly reduced the concentration. The jointing stage continued to show significant differences, with T-FSI having the largest intercellular CO2 concentration. T-RCCI and D-RCCI reduced the concentration, though not significantly, while D-FSI significantly decreased it. The tassel setting stage demonstrated significant differences among treatments, with T-FSI having a distinct intercellular CO2 concentration. T-RCCI increased it significantly, while D-FSI and D-RCCI also increased it, albeit without significant differences. Milky ripening and yellow ripening stages maintained significant differences among treatments, emphasizing the ongoing variations in intercellular CO2 concentration. Our findings suggest that different irrigation and cultivation modes influence the intercellular CO2 concentration of rice leaves, and these effects are notable across different reproductive stages, with significant differences observed among treatments.
The stomatal conductance results underscore the dynamic regulation of gas exchange in rice leaves across various fertility stages and under different irrigation and cultivation modes. Stomatal conductance values for each treatment reflected a coordinated response to changing environmental and developmental conditions [47,48]. At the tillering stage, the lack of significant differences among treatments suggests a similar response in stomatal conductance. The increases in stomatal conductance compared to the transplanted shallow water-irrigated treatment indicate potential adaptive responses to varied cultivation modes [46]. Significant differences observed at the jointing and spike stages highlight the sensitivity of stomatal conductance to different treatments. While T-RCCI and D-FSI decreased stomatal conductance compared to T-FSI, D-RCCI increased it, suggesting treatment-specific responses. The absence of significant differences at the booting and flowering stage suggests a consistent increase in stomatal conductance across all treatments. The variations in stomatal conductance at different fertility stages demonstrate the dynamic nature of plant responses to changing growth conditions. At the milky and yellow ripening stages, significant differences among treatments underscore the differential impact of cultivation modes on stomatal conductance. T-RCCI showed similar conductance to T-FSI, while D-FSI and D-RCCI significantly increased stomatal conductance, indicating distinct responses to these treatments.
The photosynthesis rate revealed a pattern of increasing and then decreasing transpiration rate, stomatal conductance, and net photosynthesis rate in rice under all treatments, except for an increase at the milky stage due to temperature warming [44,45,47]. The resumption of irrigation after drought stress led to compensation in the net photosynthetic rate, with T-RCCI showing a significantly greater rate than T-FSI at the tillering and jointing stages. However, the drought stress experienced by rice at the jointing stage resulted in a significant reduction in the net photosynthetic rate during the booting and milky ripening stages [45]. Nevertheless, with continuous compensation and normal growth, the difference between T-RCCI and T-FSI gradually decreased. Direct-seeded rice compensated for its reduced reproductive time by maintaining a higher net photosynthetic rate than transplanted rice over the entire reproductive period (except at the booting and flowering stage). The antagonistic effects of direct-seeded rice and RCCI irrigation collectively achieved a net photosynthetic rate greater than that of each mode acting alone but less than direct-seeded rice acting alone [45]. The net photosynthetic rate of direct-seeded rice was higher than that of transplanted rice but also higher than that of direct-seeded rice alone (except at the jointing stage).

4.3. Effect of Treatments on Production Factors

Direct-seeded rice does not require the process of pulling out seedlings and re-greening period, resulting in a growth period that is 5–7 days shorter than that of transplanted cultivation. This method offers advantages over transplanting in terms of the number of panicles per unit area and the weight of 1000 grains, both of which contribute to increased yield. As shown in Table 4, the yield of direct-seeded rice increased by 64% compared with that of transplanted rice under the shallow and diligent irrigation mode, and the yield of direct-seeded rice increased by 95% compared with that of transplanted rice under the RCCI; this is related to the relatively high temperature of the rice field period and the delay of the fertility of the direct-seeded rice. The high temperature from the jointing to milky stage will lead to rice yield reduction, and the order of yield reduction rate under the same conditions is as follows: milky stage > booting and flowering stage > spikelet stage. When the temperature exceeds 35 °C, it will affect the normal growth of rice, resulting in a reduction in rice yield, and the rate of yield reduction will increase as the temperature rises and the duration of high temperature increases [49]. High temperatures at the jointing and spike stage will cause a significant decrease in the rice fruiting rate and the number of grains in the spike, which will lead to a decrease in rice yield, but the impact on the thousand-grain weight and the number of spikes will be smaller [50]. Transplanted rice has a greater impact because of the relatively high temperatures and the longer duration of high temperatures at the jointing and spike stage. The booting and flowering stage will significantly reduce the rice fruiting rate resulting in a decrease in rice yield; however, the impact on the number of glumes and spikes is small, and the thousand-grain weight increases [51]. The direct-seeded rice and the transplanted rice have similar and relatively small temperatures during the booting and flowering stage, and the high temperature durations are also approximately to be equal. The high temperature at the milky ripening stage will cause a decrease in nutrient accumulation and nutrient transport capacity, which will lead to a decrease in rice yield [52]. Direct-seeded and transplanted rice at the milky ripening stage had similar and relatively low temperatures, and the duration of the high temperatures was also approximately equal; however, the increase in net photosynthetic rate compared to that at the tassel stage is not in line with the results of Gong’s study and is probably due to the differences in the varieties of rice. Therefore, the lower yield of transplanted rice compared with direct-seeded rice was mainly due to the persistent high temperature at the period of jointing and tassel formation; direct-seeded rice may have stronger high temperature resistance (compared with transplanted rice) due to its cultivation mode.
Irrigation water production efficiency is the weight of saturated grains produced by rice per unit of irrigation water [15]. The irrigation water production efficiency of rice under the four treatment groups was ranked as follows: D-RCCI > D-FSI > T-RCCI > T-FSI. Due to high temperature and low rainfall, T-FSI resulted in lower yield and a large increase in irrigation water, so the irrigation water production efficiency was smaller, with a value of 0.54 kg/m3, which was the lowest among all the treatments. Field water consumption, which includes field transpiration and deep percolation, is equal to the sum of irrigation water and effective rainfall [5].
Rice unit yield water footprint refers to the water footprint consumed in the production of a unit mass of rice-saturated grain [36]. The gray water footprint of rice unit yield, also known as the gray water footprint per unit grain yield, refers to how much gray water footprint rice produces during the production of grain per unit yield. The gray water footprints of rice per unit of grain yield were the same during the whole reproductive period and the field period, which was T-FSI > D-FSI > T-RCCI > D-RCCI. The T-FSI treatment, characterized by the lowest yield and the largest water footprint during the field period, resulted in the highest unit yield water footprint. This indicates decreased environmental benefits and inefficiency in resource use. Conversely, the T-RCCI treatment, despite reducing yield, significantly lowered the water footprint during the field period and the unit yield water footprint by 13%, thereby improving environmental outcomes. The D-FSI treatment showed an improvement in yield and a notable reduction in the water footprint during the field period. This resulted in a 52% reduction in the unit yield water footprint compared to T-FSI, enhancing environmental benefits. Similarly, the D-RCCI treatment, despite a lower yield compared to D-FSI, outperformed T-FSI in both yield and water footprint metrics. The D-RCCI treatment achieved the smallest water footprint among the four treatments and reduced the unit yield water footprint by 62% compared to T-FSI, underscoring its superior sustainability.
The comparative analysis of the water footprint at the full-life stage across different irrigation and cultivation patterns reveals the following order: T-FSI > T-RCCI > D-FSI > D-RCCI. The T-RCCI, D-FSI, and D-RCCI treatments reduced the water footprint of rice unit yield by 12%, 52%, and 63%, respectively, compared to T-FSI. These findings emphasize that D-RCCI and D-FSI are more efficient and sustainable in terms of water usage and environmental impact. Our findings align with the assessment by Vinci et al. [53], indicating significant effects on local ecosystems and community health. For instance, the intensive use of water resources and agrochemicals in rice cultivation can lead to water scarcity and pollution, affecting both the environment and human health. Socially, rice farming provides employment and sustenance to rural communities, but it also poses challenges related to labor conditions and income stability. In terms of eco-efficiency, as highlighted by [54], our study emphasizes the need to balance high productivity with environmental sustainability. Intensive rice production can enhance yield and economic returns; however, it often comes at the cost of increased environmental degradation. By adopting sustainable practices, such as precision irrigation and integrated pest management, farmers can achieve a more balanced approach, improving both eco-efficiency and profitability.

5. Conclusions

This research investigated the influence of different irrigation and cultivation methods on rice growth, physiology, yield, and water footprints in Jiangsu province, China. The four treatments employed—transplanted rice with shallow water and frequent irrigation (T-FSI), transplanted rice with rain-catching and controlled irrigation (T-RCCI), direct-seeded rice with shallow water and frequent irrigation (D-FSI), and direct-seeded rice with rain-catching and controlled irrigation (D-RCCI)—exhibited varying impacts on plant growth and physiological parameters. Among the treatments, D-RCCI demonstrated the most positive effects, showcasing its potential as an optimal strategy for rice cultivation in Jiangsu province and similar climatic zones. The reduction in blue-green water footprint was noteworthy, with T-RCCI, D-FSI, and D-RCCI showing decreases of 33%, 25%, and 25%, respectively, compared to T-FSI. Moreover, water production efficiency increased significantly in T-RCCI, D-FSI, and D-RCCI, with improvements of 13%, 106%, and 154%, respectively, over T-FSI. Notably, the water footprint per unit yield in the T-RCCI and D-FSI treatments exhibited substantial reductions of 12% and 53% compared to FSI. Furthermore, when compared with T-FSI, the water footprint per unit yield in the T-RCCI, D-FSI, and D-RCCI treatments saw significant reductions of 12%, 53%, and 63%, respectively. The strength of this study is the significant water savings and enhanced water production efficiency observed with the D-RCCI treatment, highlighting its potential as a sustainable irrigation strategy for water-sensitive regions. However, the study has been conducted solely in Jiangsu Province, which may affect the generalizability of the findings. Future research should be conducted to validate the broader applicability of D-RCCI and conduct long-term studies to monitor sustained impacts. Integrating D-RCCI with advanced technologies like precision agriculture and remote sensing could further optimize water use and sustainability in rice cultivation.

Author Contributions

Conceptualization, X.G.; methodology, S.Z. and Z.Z.; software, S.W.; validation, S.Z. and G.R.; formal analysis, Y.Z.; data curation, Q.X. and Z.W.; writing—original draft preparation, S.Z. and G.R.; writing—review and editing, G.R. and S.Z.; supervision, X.G.; project administration, X.G.; funding acquisition, X.G. All authors have read and agreed to the published version of the manuscript.

Funding

This research was funded by the Postgraduate Research & Practice Innovation Program of Jiangsu Province (grant number KYCX24_0892) and the Special funds for Independent Scientific Research of Jiangsu Hydraulic Research Institute (grant number 2023z037).

Data Availability Statement

The original contributions presented in this study are included in the article, further inquiries can be directed to the corresponding authors.

Conflicts of Interest

The authors declare no conflicts of interest.

References

  1. Srivastav, A.L.; Dhyani, R.; Ranjan, M.; Madhav, S.; Sillanpää, M. Climate-resilient strategies for sustainable management of water resources and agriculture. Environ. Sci. Pollut. Res. 2021, 28, 41576–41595. [Google Scholar] [CrossRef] [PubMed]
  2. Mojeed, A.; Misiekaba-Kia, P.; dos Anjos, V.A.A.P. Climate change, extreme weather & conflict exacerbate global food crisis. Premium Times, 19 February 2024. [Google Scholar]
  3. Ingrao, C.; Strippoli, R.; Lagioia, G.; Huisingh, D. Water scarcity in agriculture: An overview of causes, impacts and approaches for reducing the risks. Heliyon 2023, 9, e18507. [Google Scholar] [CrossRef] [PubMed]
  4. Ling, T. A global study about water crisis. In Proceedings of the 2021 International Conference on Social Development and Media Communication (SDMC 2021), Sanya, China, 26–28 November 2021; pp. 809–814. [Google Scholar]
  5. Suzdaleva, A.; Goryunova, S.; Marchuk, A.; Borovkov, V. Mobilization strategy to overcome global crisis of water consumption. In IOP Conference Series: Earth and Environmental Science; IOP Publishing: Bristol, UK, 2017; p. 012201. [Google Scholar]
  6. Huang, M. The decreasing area of hybrid rice production in China: Causes and potential effects on Chinese rice self-sufficiency. Food Secur. 2022, 14, 267–272. [Google Scholar] [CrossRef]
  7. Tang, L.; Risalat, H.; Cao, R.; Hu, Q.; Pan, X.; Hu, Y.; Zhang, G. Food security in China: A brief view of rice production in recent 20 years. Foods 2022, 11, 3324. [Google Scholar] [CrossRef]
  8. National Bureau of Statistics of China. China Statistical Yearbook; China Statistics Publishing House: Beijing, China, 2022.
  9. Information Office of the State Council of the People’s Republic of China. The Grain Issue in China; White Paper of Chinese Government; Information Office of the State Council of the People’s Republic of China: Beijing, China, 2019.
  10. Pathak, H.; Tewari, A.; Sankhyan, S.; Dubey, D.; Mina, U.; Singh, V.K.; Jain, N. Direct-seeded rice: Potential, performance and problems—A review. Curr. Adv. Agric. Sci. (Int. J.) 2011, 3, 77–88. [Google Scholar]
  11. Kumar, V.; Ladha, J.K. Direct seeding of rice: Recent developments and future research needs. Adv. Agron. 2011, 111, 297–413. [Google Scholar]
  12. Chen, X.; Tang, Y.; Xie, Y.; Li, S.; Chu, J.; Ao, F.; Peng, W.; Li, H.; Wan, Y. Research advances of rice mechanical direct-seeding technology in China. China Rice 2018, 24, 9–15. [Google Scholar]
  13. Espe, M.; Cassman, K.; Yang, H.; Guilpart, N.; Grassini, P.; Van Wart, J.; Anders, M.; Beighley, D.; Harrell, D.; Linscombe, S. Yield gap analysis of US rice production systems shows opportunities for improvement. Field Crops Res. 2016, 196, 276–283. [Google Scholar] [CrossRef]
  14. Ali, M.A.; Ladha, J.; Rickman, J.; Laies, J. Comparison of different methods of rice establishment and nitrogen management strategies for lowland rice. J. Crop Improv. 2006, 16, 173–189. [Google Scholar] [CrossRef]
  15. Mallareddy, M.; Thirumalaikumar, R.; Balasubramanian, P.; Naseeruddin, R.; Nithya, N.; Mariadoss, A.; Eazhilkrishna, N.; Choudhary, A.K.; Deiveegan, M.; Subramanian, E. Maximizing water use efficiency in rice farming: A comprehensive review of innovative irrigation management technologies. Water 2023, 15, 1802. [Google Scholar] [CrossRef]
  16. Shekhawat, K.; Rathore, S.S.; Chauhan, B.S. Weed management in dry direct-seeded rice: A review on challenges and opportunities for sustainable rice production. Agronomy 2020, 10, 1264. [Google Scholar] [CrossRef]
  17. Wenxia, W.; Yanzhi, Z.; Yongjun, Z.; Ziming, W.; Xueming, T.; Xiaohua, P.; Qinghua, S.; Yanhua, Z. Effects of different mechanical direct seeding patterns on yield and lodging resistance of high-quality late indica rice in south China. Chin. J. Rice Sci. 2020, 34, 46. [Google Scholar]
  18. Liu, K.; Xue, Y.; Lan, Y.; Fu, Y. Agricultural Water Utilization Efficiency in China: Evaluation, Spatial Differences, and Related Factors. Water 2022, 14, 684. [Google Scholar] [CrossRef]
  19. Wang, X.-C.; Klemeš, J.J.; Wang, Y.; Dong, X.; Wei, H.; Xu, Z.; Varbanov, P.S. Water-Energy-Carbon Emissions nexus analysis of China: An environmental input-output model-based approach. Appl. Energy 2020, 261, 114431. [Google Scholar] [CrossRef]
  20. Han, S.; Tian, F.; Gao, L. Current status and recent trend of irrigation water use in China. Irrig. Drain. 2020, 69, 25–35. [Google Scholar] [CrossRef]
  21. Yan, J.; Wu, Q.; Qi, D.; Zhu, J. Rice yield, water productivity, and nitrogen use efficiency responses to nitrogen management strategies under supplementary irrigation for rain-fed rice cultivation. Agric. Water Manag. 2022, 263, 107486. [Google Scholar] [CrossRef]
  22. Zhuang, Y.; Zhang, L.; Li, S.; Liu, H.; Zhai, L.; Zhou, F.; Ye, Y.; Ruan, S.; Wen, W. Effects and potential of water-saving irrigation for rice production in China. Agric. Water Manag. 2019, 217, 374–382. [Google Scholar] [CrossRef]
  23. Raimondi, A.; Quinn, R.; Abhijith, G.R.; Becciu, G.; Ostfeld, A. Rainwater harvesting and treatment: State of the art and perspectives. Water 2023, 15, 1518. [Google Scholar] [CrossRef]
  24. Zhang, S.; Rasool, G.; Guo, X.; Sen, L.; Cao, K. Effects of different irrigation methods on environmental factors, rice production, and water use efficiency. Water 2020, 12, 2239. [Google Scholar] [CrossRef]
  25. Duan, S.-M.; Huang, Y.-D.; Yang, A.-Z.; Wu, W.-G.; Xin, X.; Xu, Y.-Z.; Gang, C. Effect of water stress on growth and yield of rice. Adv. J. Food Sci. Technol. 2016, 11, 537–544. [Google Scholar]
  26. Huang, J.; Hu, T.; Yasir, M.; Gao, Y.; Chen, C.; Zhu, R.; Wang, X.; Yuan, H.; Yang, J. Root growth dynamics and yield responses of rice (Oryza sativa L.) under drought—Flood abrupt alternating conditions. Environ. Exp. Bot. 2019, 157, 11–25. [Google Scholar] [CrossRef]
  27. Gao, S.; Yu, S.; Wang, M.; Cao, R.; Guo, R. Effect of controlled irrigation and drainage on saving water and reducing nitrogen and phosphorus loss in paddy field under alternate drought and flooding condition. Trans. Chin. Soc. Agric. Eng. 2017, 33, 122–128. [Google Scholar]
  28. Guo, X.; Li, X.; Lu, H. Study on dry matter accumulation and nitrogen uptake under alternating drought and flooding stress in rice tillering stage. J. Irrig. Drain. 2015, 34, 20–24. [Google Scholar]
  29. Machekposhti, M.F.; Shahnazari, A.; Yousefian, M.; Ahmadi, M.Z.; Sarjaz, M.R.; Arabzadeh, B.; Akbarzadeh, A.; Leib, B.G. The effect of alternate partial root-zone drying and deficit irrigation on the yield, quality, and physiochemical parameters of milled rice. Agric. Water Manag. 2023, 289, 108546. [Google Scholar] [CrossRef]
  30. Wu, D.-H.; Chen, C.-T.; Yang, M.-D.; Wu, Y.-C.; Lin, C.-Y.; Lai, M.-H.; Yang, C.-Y. Controlling the lodging risk of rice based on a plant height dynamic model. Bot. Stud. 2022, 63, 25. [Google Scholar] [CrossRef] [PubMed]
  31. Li, G.; Zhong, X.; Tian, K.; Huang, N.; Pan, J.; He, T. Effect of nitrogen application on stem lodging resistance of rice and its morphological and mechanical mechanisms. Sci. Agric. Sin 2013, 46, 1323–1334. [Google Scholar]
  32. Chapagain, A.K.; Hoekstra, A.Y. Water Footprints of Nations; Unesco-IHE Institute for Water Education: Delft, The Netherlands, 2004. [Google Scholar]
  33. Zimmer, D. Virtual Water Trade: Proceedings of the International Expert Meeting on Virtual Water Trade. 2003, p. 93. Available online: https://ihedelftrepository.contentdm.oclc.org/digital/collection/p21063coll3/id/10351 (accessed on 5 August 2024).
  34. Cao, X.; Zeng, W.; Wu, M.; Li, T.; Chen, S.; Wang, W. Water resources efficiency assessment in crop production from the perspective of water footprint. J. Clean. Prod. 2021, 309, 127371. [Google Scholar] [CrossRef]
  35. Fang, H.; Wu, N.; Adamowski, J.; Wu, M.; Cao, X. Crop water footprints and their driving mechanisms show regional differences. Sci. Total Environ. 2023, 904, 167549. [Google Scholar] [CrossRef]
  36. Mao, Y.; Liu, Y.; Zhuo, L.; Wang, W.; Li, M.; Feng, B.; Wu, P. Quantitative evaluation of spatial scale effects on regional water footprint in crop production. Resour. Conserv. Recycl. 2021, 173, 105709. [Google Scholar] [CrossRef]
  37. Ruisen, Z.; Xinguang, D.; Yingjie, M. Sustainable water saving: New concept of modern agricultural water saving, starting from development of Xinjiang’s agricultural irrigation over the last 50 years. Irrig. Drain. J. Int. Comm. Irrig. Drain. 2009, 58, 383–392. [Google Scholar] [CrossRef]
  38. Shu, R.; Cao, X.; Wu, M. Clarifying regional water scarcity in agriculture based on the theory of blue, green and grey water footprints. Water Resour. Manag. 2021, 35, 1101–1118. [Google Scholar] [CrossRef]
  39. GB 11894-89; Water Quality—Determination of Total Nitrogen—Alkaline Potassium Persulfate Digestion—UV Spectrophotometric Method. Standards Press of China: Beijing, China, 1986.
  40. HJ 535-2009; Water Quality-Determination of Ammonia Nitroge—Nessler’s Reagent Spectrophotometry. China Environmental Science Press: Beijing, China, 2010.
  41. HJ/T 346-2007; Water Quality-Determination of Nitrate-Nitrogen-Ultraviolet Spectrophotometry. China Environmental Science Press: Beijing, China, 2007.
  42. GB 11893-89; Water Quality-Determination of Total Phosphorus-Ammonium Molybdate Spectrophotometric Method. Standards Press of China: Beijing, China, 1990.
  43. Cao, R.; Gao, S. Influence of drought and flood alternation stress in different growth stages on rice yield and components. J. Drain. Irrig. Mach. Eng. 2019, 37, 639–644. [Google Scholar]
  44. Xue, W.; Otieno, D.; Ko, J.; Werner, C.; Tenhunen, J. Conditional variations in temperature response of photosynthesis, mesophyll and stomatal control of water use in rice and winter wheat. Field Crops Res. 2016, 199, 77–88. [Google Scholar] [CrossRef]
  45. Zhu, R.; Wu, F.; Zhou, S.; Hu, T.; Huang, J.; Gao, Y. Cumulative effects of drought–flood abrupt alternation on the photosynthetic characteristics of rice. Environ. Exp. Bot. 2020, 169, 103901. [Google Scholar] [CrossRef]
  46. Xu, Z.; Jiang, Y.; Jia, B.; Zhou, G. Elevated-CO2 response of stomata and its dependence on environmental factors. Front. Plant Sci. 2016, 7, 657. [Google Scholar] [CrossRef]
  47. Xiong, Z.; Dun, Z.; Wang, Y.; Yang, D.; Xiong, D.; Cui, K.; Peng, S.; Huang, J. Effect of stomatal morphology on leaf photosynthetic induction under fluctuating light in rice. Front. Plant Sci. 2022, 12, 754790. [Google Scholar] [CrossRef]
  48. Ouyang, W.; Struik, P.C.; Yin, X.; Yang, J. Stomatal conductance, mesophyll conductance, and transpiration efficiency in relation to leaf anatomy in rice and wheat genotypes under drought. J. Exp. Bot. 2017, 68, 5191–5205. [Google Scholar] [CrossRef]
  49. Hussain, S.; Khaliq, A.; Ali, B.; Hussain, H.A.; Qadir, T.; Hussain, S. Temperature extremes: Impact on rice growth and development. In Plant Abiotic Stress Tolerance: Agronomic, Molecular and Biotechnological Approaches; Springer: Berlin/Heidelberg, Germany, 2019; pp. 153–171. [Google Scholar]
  50. Shrestha, S.; Mahat, J.; Shrestha, J.; Madhav, K.; Paudel, K. Influence of high temperature stress on rice growth and development. A review. Heliyon 2022, 8, e12651. [Google Scholar] [CrossRef]
  51. Wu, C.; Cui, K.; Fahad, S. Heat stress decreases rice grain weight: Evidence and physiological mechanisms of heat effects prior to flowering. Int. J. Mol. Sci. 2022, 23, 10922. [Google Scholar] [CrossRef]
  52. Xu, Y.; Chu, C.; Yao, S. The impact of high-temperature stress on rice: Challenges and solutions. Crop J. 2021, 9, 963–976. [Google Scholar] [CrossRef]
  53. Vinci, G.; Ruggieri, R.; Ruggeri, M.; Prencipe, S.A. Rice production chain: Environmental and social impact assessment—A review. Agriculture 2023, 13, 340. [Google Scholar] [CrossRef]
  54. Masuda, K. Eco-efficiency assessment of intensive rice production in Japan: Joint application of life cycle assessment and data envelopment analysis. Sustainability 2019, 11, 5368. [Google Scholar] [CrossRef]
Figure 1. Daily meteorological elements during the rice growing season.
Agronomy 14 01747 g001
Figure 2. Variation in plant height (a), stem diameter (b), and tiller number (c) at different growth stages. Note: Letters in the figures indicate the differences between treatments at the same time, and the same letter means no significant difference between treatments.
Agronomy 14 01747 g002
Figure 3. Effect of different irrigation and cultivation patterns on the bending stress of rice stems. Note: The different lowercase letters in the figure indicate significant differences between the treatments in the same stem section (p < 0.05), and there is no significant difference between treatments with the same letter.
Agronomy 14 01747 g003
Figure 4. Transpiration rate of rice at each fertility stage under different treatments. Note: The letters in the figure indicate the differences in the same fertility period under different irrigation and cultivation modes, and there is no significant difference between treatment groups possessing the same letter.
Agronomy 14 01747 g004
Figure 5. Intercellular CO2 concentration in rice at various stages under different treatments. Note: The letters in the figure indicate the differences in the same fertility period under different irrigation and cultivation modes, and there is no significant difference between treatment groups possessing the same letter.
Agronomy 14 01747 g005
Figure 6. Stomatal conductance of rice at various fertility stages under different treatments. Note: The letters in the figure indicate the differences in the same fertility period under different irrigation and cultivation modes, and there is no significant difference between treatment groups possessing the same letter.
Agronomy 14 01747 g006
Figure 7. Net photosynthetic rate of rice at various fertility stages under different treatments. Note: The letters in the figure indicate the differences in the same fertility period under different irrigation and cultivation modes, and there is no significant difference between treatment groups possessing the same letter, the same below.
Agronomy 14 01747 g007
Table 1. Soil physical and chemical properties.
pHSoil TypeBD (g/cm3)SWC (%)WHC (%)SOM (g/kg)TN (mg/kg)TP (mg/kg)
7.11loam1.4043.9030.402.3834.5429.56
Note: BD: bulk density, SWC: saturated water contents, WHC: water holding capacity, SOM: soil organic matter, TN: total nitrogen, TP: total phosphorous.
Table 2. Details of experimental treatments.
TreatmentsIrrigation ModesCultivation Modes
T-FSIShallow water and frequent irrigationTransplanting
T-RCCIRain-catching and controlled irrigationTransplanting
D-FSIShallow water and frequent irrigationDirect-seeded
D-RCCIRain-catching and controlled irrigationDirect-seeded
Table 3. Irrigation water limits at different growth stages.
ModesWater LimitsIrrigation Quantity at Different Growth Stages
RecoveryTilleringJointingBootingFloweringFilling
FSIUpper (mm)30305040400
Lower (mm)1010~60% *10101060~70% *
Rain storage (mm)40100150150800
RCCIUpper (%)3010010010010080
Lower (%)1060~7070~808070/
Rain storage (mm)801202002001000
Note: 1. “mm” indicates the depth of water on the field surface, “%” indicates the percentage of water content of the top 30 cm of soil to the saturated water content of the soil, and “*” indicates that the type of data presentation in this row is different from other data in the same row. Different from other data of the same industry. 2. Irrigation control indexes are high in the front and low in the back at the tillering stage, and low in the front and high in the back at the jointing and booting stage.
Table 4. Effect of different treatments on yield parameters and water production efficiency.
Growth PeriodTreatmentYield (kg/ha)IW
(mm)
Effective Rainfall (mm)IWP (kg/m3)WPE (kg/m3)
Field growth Period T-FSI5525 c1017 a124 b0.54 d0.49 c
T-RCCI4151 d614 c136 a0.68 c0.55 c
D-FSI9031 a795 b116 c1.13 b0.99 b
D-RCCI8088 b530 d136 a1.53 a1.22 a
Whole growth periodT-FSI5525 c1036 a125 b0.53 d0.48 c
T-RCCI4151 d633 c137 a0.66 c0.54 c
D-FSI9031 a795 b116 c1.13 b0.99 b
D-RCCI8088 b530 d136 a1.53 a1.22 a
Note: IW: Irrigation water quantity IWP: Irrigation Water Productivity, WPE: Water Production Efficiency. Lowercase letters indicate differences among the four treatments at the p < 0.05 level in growth periods, respectively.
Table 5. Gray water footprint per unit of rice yield under different treatments.
TreatmentsYield (kg/ha)GWF (mm)GWFg (m3/kg)
Field Growth PeriodWhole Growth PeriodField Growth PeriodWhole Growth Period
T-FSI5525 c36 a45 a0.066 a0.082 a
T-RCCI4151 d12 c20 c0.028 b0.049 b
D-FSI9031 a56 b56 b0.062 a0.062 b
D-RCCI8088 b13 c13 d0.016 b0.016 c
Note: The different lowercase letters in the table indicate significant differences between the treatments for each parameter (p < 0.05).
Table 6. The water footprint of rice unit yield under different treatments.
TreatmentsYield (kg/ha)GWF (mm)GWFg (m3/kg)
Field Growth PeriodWhole Growth PeriodField Growth PeriodWhole Growth Period
T-FSI5525 c923 a943 a1.67 a1.71 a
T-RCCI4151 d602 c623 c1.45 b1.50 b
D-FSI9031 a731 b731 b0.81 c0.81 c
D-RCCI8088 b511 d511 d0.63 d0.63 d
Note: The different lowercase letters in the table indicate significant differences between the treatments for each parameter (p < 0.05).
Disclaimer/Publisher’s Note: The statements, opinions and data contained in all publications are solely those of the individual author(s) and contributor(s) and not of MDPI and/or the editor(s). MDPI and/or the editor(s) disclaim responsibility for any injury to people or property resulting from any ideas, methods, instructions or products referred to in the content.

