Abstract
Biochar is widely used to maintain crop yields and the sustainability of agroecosystems due to its characteristics. However, its effect on vegetable yield and quality in southern acidic soils has not been fully elucidated. The effects of two kinds of biochar application rates (3 t ha−1 and 12 t ha−1) on the nutrient availability, nutrient absorption, yield, and fruit quality of sandy acid oxide soil in South China were studied in a 2-year field experiment using two varieties of wax gourd (Tiezhu No. 2 and Dadao). The results showed that optimized fertilization (OPT, nitrogen, phosphorus, and potassium were reduced by 20.0%, 20.6%, and 21.1%, respectively) did not reduce the yield of the different varieties of wax gourd compared to FP (farmer practice). On the basis of the OPT treatment, the application of biochar increased the yield of Tiezhu No. 2 and Dadao wax gourd by 16.0–27.3% and 7.7–13.3%, respectively. The increase in yield was attributed to the improvement in soil organic carbon content which increased by 4.5–19.7%, nutrient effectiveness (NO3−-N and Olsen-P content enhanced by 23.7–27.0% and 15.3–23.4% in Tiezhu No. 2), and nutrient uptake (N, P, K, Ca, and Mg accumulation increased significantly by 21.1%, 46.1%, 36.8%, 25.7%, and 31.9%, respectively) by the plant after the biochar application. Different types of biochar also have some differences in these three aspects. Specifically, under the same dosage, rice biochar has a more significant effect on increasing the yield of winter melon, and has a better effect on the improvement of soil physical and chemical properties, while sawdust biochar has a more significant effect on nutrient absorption. In addition, the commercial quality, namely hardness and glossiness, and the nutritional quality, namely soluble sugar, soluble protein, VC content, and sugar–acid ratio of wax gourd fruits, were significantly improved after the biochar application. In summary, biochar application on acidic soils in South China could achieve a win–win situation in terms of increasing soil nutrient effectiveness to improve vegetable yield and quality while reducing chemical fertilizer.
1. Introduction
Vegetables are rich in a variety of nutrients (e.g., vitamins, minerals, dietary fiber, etc.) and are indispensable in a human’s daily dietary structure [1]. During the past three decades, global vegetable production and value have increased significantly [2]. As a large producer of vegetables, China produces more than 50% of the world’s vegetables in only 13.0% of its planted area [3]. However, in such highly intensive vegetable production systems, high nutrient inputs are often seen as a cheap safeguard against yield losses, leading to increasing environmental problems such as eutrophication, acidification, and increased greenhouse gas emissions [4,5,6]. It is necessary to optimize nutrient management to reduce environmental risks while guaranteeing vegetable yield and quality.
In intensive vegetable production, several management strategies have been developed to improve vegetable yield and quality, for example, optimizing fertilizer rate, timing, and frequency, applying more efficient fertilizer products, or planting efficient new crop varieties [6,7,8]. Wang et al. [9] developed innovative management practices in vegetable production that could decrease the N application rate by 38%, surplus by 65%, and greenhouse gas emissions by 28% while increasing yield by 17%. However, overemphasis on fertilizer reduction can also reduce vegetable yields [10]. In addition, the latest meta-analysis by Ishfaq et al. [11] showed that fertilization increased crop yield by 30.9% and nutritional quality by 11.9%, and that nutrient management had the greatest effect on the quality of vegetables among different types of crops. Hence, it is necessary to seek more effective system solutions based on optimized nutrient management to achieve higher quality and efficiency in vegetable production.
Biochar is widely used as a soil amendment or organic material in crop production and soil improvement to maintain crop yield and sustainable agroecosystem development [12,13]. Soil structure and nutrient availability can be enhanced by the rich pore structure, nutrients, and carbon (C) of biochar [14,15]. In addition, the application of biochar can improve soil water retention, pH, cation exchange capacity (CEC), and microbial nutrient conversion to increase plant nutrient availability, thereby increasing crop yield [10,16]. The results of previous meta-analyses showed that biochar application increased crop yields by 10% [17], while Ye et al. [18] showed that biochar with inorganic fertilizers resulted in a 48% increase in yield. However, recent analyses by Li et al. [19] showed that there were significant differences in the crop yield-promoting effects of biochar alone or in combination with inorganic fertilizers. This is mainly related to biochar type [20], dosage [21], and inorganic nutrient inputs [22]. Furthermore, the application of biochar can also affect crop quality, but information about the effects of biochar on crop quality is largely scarce. In greenhouse tomatoes, the application of 50 t ha−1 biochar significantly increased fruit soluble solids and soluble sugar content [23]. Wang et al. [9] found that biochar application can significantly increase 12.0% of the water-soluble sugar by adjusting NH4+-N, NO3−-N, and EC (electrical conductivity). High-yield and high-quality vegetable production in South China is an important guarantee for the safety of the food basket in the Greater Bay Area. However, due to the fact that the soil is severely acidified and the simultaneous rain and heat in South China are prone to base ion leaching (e.g., Ca and Mg), the effectiveness of soil nutrients is reduced [24,25]. Therefore, it is important to use biochar to improve the physicochemical properties of acidic soils to enhance vegetable yield and quality.
Wax gourd (Benincasa hispida (Thunb.) Cogn.), as an important member of the Cucurbitaceae family, is widely grown in the tropics due to its high yield, high nutritional value, medicinal properties, and many other characteristics [26,27]. In China, wax gourd is mainly planted in South China over an area of more than 200,000 hectares [28]. However, in recent years, despite the large amount of fertilizer invested in wax gourd production, its yield has remained stagnant [29]. On the one hand, this is related to the fact that the soil in South China is acidic, and the synchronized rain and heat result in a large amount of nutrient leaching loss [25]; on the other hand, the fertilizer application methods and habits of farmers in long-term wax gourd cultivation need to be further improved [27]. Therefore, we assumed that the above problems could be addressed with the appropriate types and dosages of biochar application. To test this hypothesis, this study was conducted to investigate the effects of biochar application on the yield and quality of wax gourd in acidic soils by applying two feedstocks (sawdust and rice) and two dosages (12 t ha−1 and 3 t ha−1) of biochar on the basis of optimized fertilization. The objectives of this study were to (i) clarify the effects of different feedstocks and dosages of biochar on the growth of different varieties of wax gourd; (ii) elucidate the main factors of biochar application to regulate soil physicochemical properties affecting the yield and quality of wax gourd; and (iii) propose a nutrient management strategy for improving the soil environment and nutrient content to realize vegetable quality and efficiency improvement.
2. Materials and Methods
2.1. Experimental Location
Two consecutive years of field trials were conducted from March to June 2022 and 2023 in Baini Town, Guangdong Province, China (23°07′ N, 112°84′ E). The climate in this area is a subtropical oceanic monsoon climate, with an average temperature of 22.5 °C and 23.7 °C and precipitation of 1688.7 mm and 1798.2 mm in 2022 and 2023. The daily temperature and daily precipitation in the growing season of the wax gourd test field are shown in Figure 1. The field soil was a sandy acid oxide soil of pH 5.42 (1:2.5 soil: deionized water), EC 40.5 (1:5 soil: deionized water), with organic matter 18.7 g kg−1, total N 0.55 g kg−1, NH4OAc-K 124.0 mg kg−1, Olsen-P 74.4 mg kg−1, and exchangeable Mg 24.2 mg kg−1 in the topsoil layer (0–20 cm). Based on the observation that different varieties of wax gourd had a robust response trend to biochar for two consecutive years, the mechanism of different biochar feedstocks and dosages on the yield and quality of wax gourd was further explored in 2023.
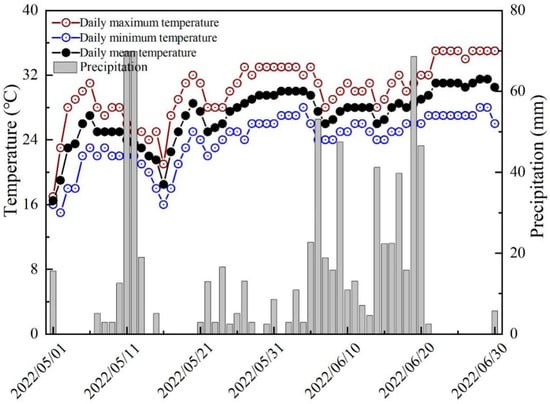
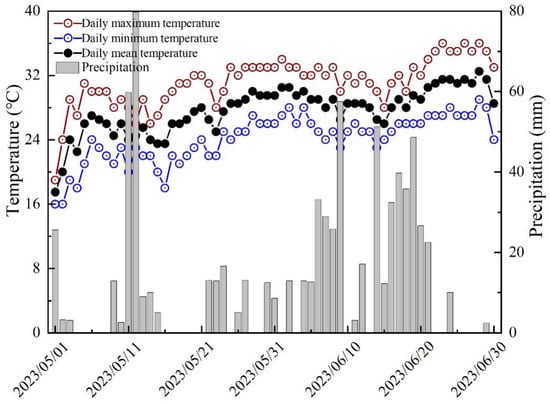
Figure 1.
Rainfall and temperature during the growing period of wax gourd in Baini Town, Foshan City, Guangdong Province, in 2022 and 2023.
2.2. Experimental Design and Field Management
The 2-year field experiment was conducted in a completely randomized block design using five treatments and three replications, planting two varieties of wax gourd (Tiezhu No. 2 and Dadao) from 2022 to 2023. The treatments were as follows: (i) routine fertilization by farmers (FP), with traditional fertilization for this region (350 kg N ha−1, 340 kg P2O5 ha−1, and 380 kg K2O ha−1); (ii) optimized fertilization (OPT), optimizing the amount of fertilization based on wax melon needs and local expert opinions (N = 280 kg ha −1, P2O5 = 270 kg ha −1, K2O = 300 kg ha −1) [6]; (iii) OPT combined with 12 t ha−1 sawdust biochar (OPT + T1); (iv) OPT combined with 12 t ha−1 rice biochar (OPT + T2); and (v) OPT combined with 3 t ha−1 rice biochar (OPT + T3). N (urea, 46% N) was applied in four splits: 30% as basal fertilizer, 20% during the seedling stage, 30% in the early fruiting stage, and 20% at the fruit expansion period. P (superphosphate, 12% P2O5) and K (potassium chloride, 60% K2O) fertilizers were applied manually as basal fertilizers. Biochar was obtained from Sanli New Energy Company, Shangqiu City, Henan Province, China. Commercial biochar is produced by pyrolysis using rice straw and sawdust as raw materials at a temperature of 500 °C, a heating rate of 5–10 °C min−1, and a duration of 4 h. The specific physical and chemical properties of this batch of biochar can be found in Table S1. The specific element content and BET surface area parameters of this batch of biochar are shown in Table S2. The plot was 64 m2, with a length of 40 m and a width of 1.6 m.
Wax gourd seeds were soaked in deionized water for 8 h, wrapped in wet paper, and then placed in a plastic bag to germinate in a dark environment with a constant temperature of 32 °C. The germinated seeds were sown into 72-hole trays for seedlings and transplanted to the field at the three-leaf stage of the wax gourd. Double-row planting was used, and the transplanting spacing was 80 cm. Pest and disease management, as well as herbicide spraying, were performed using local methods.
2.3. Parameter Measurements and Calculations
2.3.1. Sampling and Determination at Maturity
Three uniform plants were collected from each plot at physiological maturity. The fruits, stems, and leaves were separated from the samples. The fresh samples were individually weighed for fresh weight, and then we used the quartering method to take some samples from different parts, killed them at 105 °C for 30 min, and then dried them at 65 °C. The samples of the fresh fruit frozen with liquid nitrogen were taken back to the laboratory and placed in a −80 °C refrigerator for nutritional quality determination. The dry materials were ground into a powder and then analyzed for N content by a C/N elemental analyzer (EMA502, VELP, Usmate Velate, Italy). The P, K, Ca, and Mg contents of the plants were determined by ICP-OES (Avio 550 Max, Perkin Elmer, Waltham, MA, USA) using a mixture of nitric acid and perchloric acid (4:1) for digestion. We calculated the accumulation by multiplying the dry matter of the corresponding plant part with the concentration of the concerned nutrient in the same plant part and summing them.
2.3.2. Determination of Yield and Its Components
Six uniformly representative fruits were randomly selected in each plot; a single fruit weight was measured, and the mean value of the fruit weight was multiplied by the planting density to calculate the yield per unit area. A tape measure was used to measure the longitudinal diameter of the fruit and the transverse diameter of the different parts of the fruit. The mean value was determined as the yield component.
2.3.3. Soil Sample Collection and Determination at Maturity
After harvesting the wax gourd, 0–20 cm of surface soil was collected from 5 to 8 randomly selected points in each plot and mixed thoroughly to obtain a composite sample for analysis. The soil samples collected were air-dried at room temperature and crushed to pass through a 1 mm sieve to determine various chemical properties. Soil pH (1:2.5 soil: deionized water), EC (1:5 soil: DI water), organic C, NH4+-N, NO3−-N, Olsen-P, extractable Ca, and Mg were measured according to the methods described by Sparks et al. [30].
2.3.4. Measurement of Fruit Quality
We used a hardness meter to measure the hardness of the peel, outer, and inner pulp in the center of the fruit. The pulp compactness and peel glossiness were determined by the drainage method and gloss meter (GL0030, TQC, Capelle Aan Den Ijssel, The Netherlands). The fruit soluble sugar and soluble protein contents were determined by anthrone colorimetry [31] and the Caustic Blue [32] method, respectively. The determination of the Vc (Vitamin C) and titratable acid content of the fruits was performed by the UV-Vis spectrophotometry (60 UV-Vis, Cary, NC, USA) [33] and potentiometric titration [34] methods.
2.3.5. Statistical Analysis
Descriptive statistical analyses were performed to assess the ranges of variables and standard errors (SEs). A one-way analysis of variance was performed statistically using the SPSS 18.0 software (SPSS, Chicago, IL, USA). Pearson’s correlation analysis using the ‘corrplot’ package in R (version 4.3.1) examined the relationships between the wax gourd yield and quality against the fruit nutrient content and soil physicochemical properties. The contribution of yield components to yield was predicted using the random forest variable importance model by the ‘randomForest’ package in R (version 4.3.1). The graphics were created using the OriginPro 8.5 software (OriginLab Corp., Northampton, MA, USA).
3. Results
3.1. Yield and Dry Matter Accumulation
A consistent trend in the yield response of wax gourd to increasing biochar was found in 2022 and 2023, but the degree of response varied significantly among the varieties (Table 1). Compared with the FP treatment, the OPT treatment reduced Tiezhu No. 2 and Dadao wax gourd production by 5.9% and 2.2% in 2022 and 10.1% and 5.6% in 2023, respectively, but the difference was not significant. In contrast, the OPT treatment combined with different feedstock materials and biochar dosages can increase the yield of wax gourd. The OPT + T1, OPT + T2, and OPT + T3 treatment yields of Tiezhu No. 2 increased by 17.2%, 12.0%, and 23.7%, respectively, compared with the OPT treatment in 2022, and by 24.4%, 20.0%, and 30.8%, respectively, in 2023, with the OPT + T3 treatment having a significant yield increase. In contrast, while the OPT + T1, OPT + T2, and OPT + T3 treatments increased Dadao production by 7.4%, 5.5%, and 12.7% in 2022 and 13.6%, 9.9%, and 13.9%, respectively, in 2023 compared to the OPT treatments, the differences were not significant.

Table 1.
Effects of the different treatments on the yield of the two wax gourd varieties in 2022 and 2023.
Compared with the FP treatment, the optimized fertilization combined with biochar significantly decreased the proportion of leaf dry matter allocation while increasing the stalk allocation ratio in Tiezhu No. 2. Differently, the optimized fertilization combined with biochar mainly increased the proportion of fruit and stem dry matter in Dadao wax gourd (Figure 2).
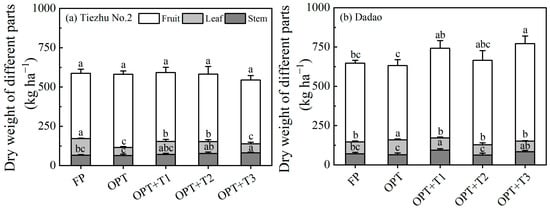
Figure 2.
Effects of the five fertilization treatments on the dry matter distribution of two kinds of wax gourd. The data are means ± SE (n = 6). Different lowercase letters on the columns indicate significant differences within the different treatments (p < 0.05; post hoc test LSD).
3.2. Differences in Yield Composition
The different treatments have different effects on the yield composition of the different varieties of wax gourd (Table 2). Compared with the FP treatment, the OPT treatment reduced the single fruit weight of Tiezhu No. 2 and Dadao wax gourd by 5.7% and 2.2%, respectively, but the difference was not significant. In contrast, the different feedstocks and biochar dosages can increase the single fruit weight of wax gourds. The single fruit weight of Tiezhu No. 2 in the OPT + T1, OPT + T2, and OPT + T3 treatments increased by 16.8%, 11.7%, and 23.7%, respectively, compared with the OPT treatment. Although the single fruit weight of Dadao in the OPT + T1, OPT + T2, and OPT + T3 treatments increased by 6.8%, 4.9%, and 12.3% compared with the OPT treatment, the difference was not significant. In wax gourd fruit diameter indicators, biochar mainly increased the mid-transverse diameter of Tiezhu No. 2 (increased by 9.6–24.9%) and longitudinal diameter of Dadao (improved by 2.2–6.4%) while reducing the bottom transverse diameter of Dadao.
Table 2.
Effects of different treatments on yield components of two wax gourd cultivars.
The results of the correlation analysis showed that the wax gourd yield exhibited positive correlations with the single fruit weight, longitudinal diameter, and top transverse diameter (Figure 3a). Among the different yield components, the single fruit weight and longitudinal diameter were the main contributors to the wax gourd yield, contributing 22.3 and 20.3%, respectively (Figure 3b).
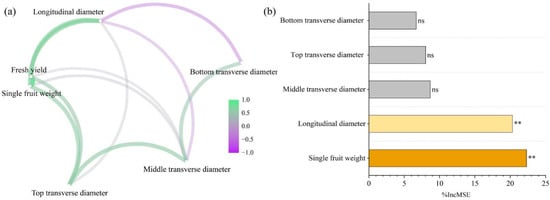
Figure 3.
Correlation analysis between the wax gourd yield and its constituent factors (a) and the analysis of the relative contribution of the yield constituent factors to fresh yield based on random forest (b). The correlation was conducted by using the ‘corrr’ package in the R software. The closer variables represent that these two variables are highly linearly correlated, while the opposite is the case for widely spaced variables. The line color represents the direction of the correlation. The line shading and thickness represent the strength of the relationship. The minimum correlation coefficient required to display a line between the variables is 0.2. ** p < 0.01; ns represents no significant difference.
3.3. Shoot Nutrient Uptake
The different feedstocks and dosages of biochar affected the nutrient content of the fruit and the shoot nutrient uptake of the wax gourd (Table S3 and Figure 4). In wax gourd, more than half of the N, P, K, and Mg are allocated to the fruit, while most of the Ca accumulates with the stalks and leaves, and biochar application facilitates nutrient translocation from the leaves to the fruit (Figure S1). Compared with the FP treatment, the OPT treatment reduced the N, P, K, Ca, and Mg nutrient absorption of Tiezhu No. 2 by 12.2%, 2.2%, 43.1%, 38.9%, and 27.9%, respectively. Compared to OPT, the accumulation of N, P, K, Ca, and Mg was significantly increased by 21.1%, 46.1%, 36.8%, 25.7%, and 20.4% in the OPT + T1 treatment of Tiezhu No. 2. The Ca accumulation in the OPT + T3 treatment and Mg accumulation in the OPT + T2 treatment were significantly increased by 21.9% and 31.9% as compared to OPT. For Dadao wax gourd, there was no significant difference in the absorption of the various nutrients between the FP and OPT treatments. In Dadao wax gourd, only the OPT + T1 treatment had significantly higher P, K, and Ca accumulations than the OPT treatment, whereas there were no significant differences between the treatments for the other nutrient accumulations.
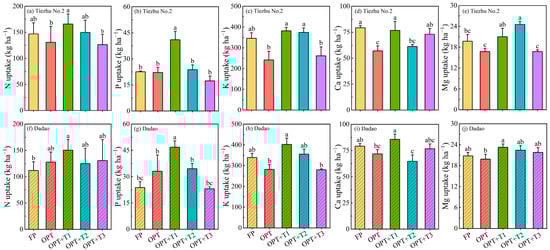
Figure 4.
Differences in nutrient uptake in the stems of the two tested varieties of winter melon under the different treatments. Different lowercase letters mean a significant difference at the 5% level within the different treatments.
3.4. Soil Chemical Properties (and Table 3)
Table 3.
Responses of soil chemical properties to different treatments on two tested varieties.
The optimized fertilization coupled with biochar can adjust soil physical properties (Table 3). The soil organic carbon content increased by 4.5–15.2% and 6.8–19.7% in Tiezhu No. 2 and Dadao wax gourd, respectively, after the biochar application compared with the OPT treatment. Compared with the FP treatment, the OPT, OPT + T1, OPT + T2, and OPT + T3 treatments significantly increased the soil NO3−-N content of Tiezhu No. 2 by 32.4%, 26.8%, 27.0%, and 23.7%, respectively. In Dadao wax gourd, the soil NO3−-N content was 46.3%, 44.7%, 42.9%, and 45.7% higher in the OPT, OPT + T1, OPT + T2, and OPT + T3 treatments than FP. On the contrary, the biochar application reduced the soil NH4 + -N content in the different varieties of wax gourd. Compared with the FP treatment, the OPT, OPT + T1, OPT + T2, and OPT + T3 treatments increased the soil Olsen-P of Tiezhu No. 2 by 23.4%, 15.3%, 16.4%, and 20.2%, respectively. There were no significant differences in the soil pH, EC, or Ex-Mg between the treatments within Tiezhu No. 2 or Dadao wax gourd.
3.5. Quality Differences between Treatments
The different varieties of wax gourd exhibit different responses in terms of commercial quality under the different treatments (Table 4). Compared with the FP treatment, the optimized fertilization combined with biochar significantly reduced the inner pulp hardness by 1.30–1.79 times and outer pulp hardness by 10–41% in Tiezhu No. 2, while the peel hardness increased by an average of 0.3%. Unlike Tiezhu No. 2, the outer pulp hardness of Dadao increased by an average of 7.5% compared with the FP treatment, while there was no significant difference between the treatments for the inner pulp and peel hardness. The glossiness of Tiezhu No. 2 was significantly lower by 29%, 41%, and 24% in the OPT, OPT + T2, and OPT + T3 treatments compared with the FP treatment. The glossiness of Dadao was increased by 8–33% after the biochar application compared with the OPT treatment. There was no significant effect of the different treatments on the compactness of the different varieties of wax gourd.
Table 4.
Effects of the different treatments on the quality of the two wax gourd cultivars.
In nutritional quality, the optimized fertilization reduced the soluble sugar content of Tiezhu No. 2 and Dadao fruits by 26.8% and 47.4% as compared to the FP treatments (Table 4). Tiezhu No. 2 and Dadao fruit soluble sugar content was significantly increased by 39.0–45.2% and 1.9–11.8% after the biochar application compared to the OPT treatment. The optimized fertilization reduced soluble protein, Vc, titratable acid content, and sugar–acid ratio by 21.0%, 2.8%, 6.9%, and 20.7%, respectively, in Tiezhu No. 2; in Dadao fruits, the soluble protein content was significantly lower by 47.7% in the OPT treatment compared with that of FP, whereas the Vc content was significantly higher by 4.4%. Compared with the OPT treatment, Tiezhu No. 2 soluble protein, Vc content, and sugar to acid ratio were significantly increased by 85.1–147.6%, 3.4–6.5%, and 34.7–80.6%, respectively, after the biochar application, while in Dadao fruit, the soluble protein and sugar to acid ratio were significantly increased by 91.3–152.3% and 36.2–78.5%.
3.6. Analysis of Wax Gourd Yield and Quality Drivers
A correlation analysis dissected the relationships between the wax gourd yield and quality against the fruit nutrient content and soil physicochemical properties (Figure 5). Fruit N, K, Mg content, soil organic carbon, and Olsen-P exhibited positive relationships with the wax gourd yield. The soil pH and exchangeable Ca content were negatively correlated with the yield. The wax gourd yield was significantly and positively correlated with the fruit compactness, soluble sugar, and titratable acidity content, while it had a negative relationship with the glossiness, inner pulp and peel hardness, soluble protein, and sugar–acid ratio. Fruit P content mainly increased the glossiness and soluble protein but decreased the titratable acidity. The soluble sugar content was most sensitive to the increase in fruit K content. Increasing fruit Mg content enhanced the compactness, soluble sugar, and titratable acidity content while significantly decreasing the glossiness and inner pulp hardness. Increased soil organic C significantly improved the fruit compactness, soluble sugar, and titratable acidity while reducing the glossiness, inner pulp, and peel hardness. Fruit compactness, soluble sugar, and titratable acidity exhibited a positive correlation with soil Olsen-P, whereas glossiness, pulp hardness, soluble protein, and sugar–acid ratio were negatively correlated with it. Increased fruit glossiness, hardness, soluble protein, and sugar–acid ratio were strongly correlated with the soil exchangeable Ca, whereas the compactness, soluble sugar, and titratable acidity were negatively correlated with the exchangeable Ca.
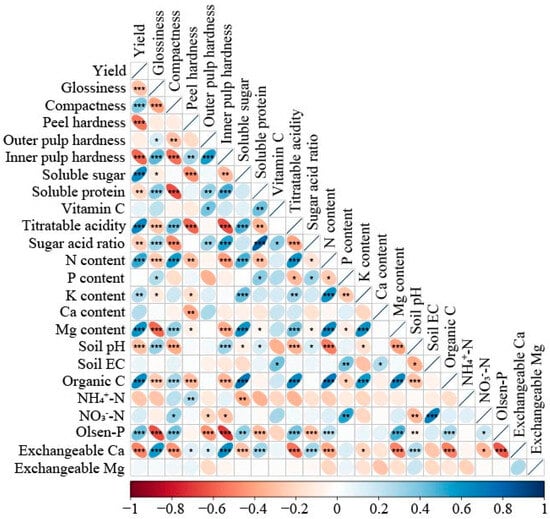
Figure 5.
Correlation analysis of the wax gourd yield and quality with the fruit nutrient content and soil physicochemical properties. The correlation was conducted by using the ‘corrplot’ package in the R software. The ellipse color represents the direction of the correlation. The ellipse shading and thickness represent the strength of the relationship. * p < 0.05; ** p < 0.01; *** p < 0.001.
4. Discussion
In this study, we investigated the effects of different feedstocks and dosages of biochar on the yield and quality, and also evaluated its universality within varieties of wax gourd in the acidic soil of South China. It is worth noting that under the conditions of fertilizer reduction, biochar combined application can improve the yield and quality of winter melon by increasing soil organic carbon, increasing nutrient availability, and promoting crop nutrient absorption. This demonstrates that biochar application on acidic soils can achieve a win–win situation in terms of increasing soil nutrients to improve vegetable yield and quality.
4.1. Biochar Improves Wax Gourd Yield by Regulating Soil Physicochemical Properties
Due to the differences in ecology, climate, soil, and the characteristics of biochar itself, there are obvious differences in the effects of biochar on the growth and development of crops and yields. A comprehensive analysis of crop yield responses to biochar by Bo et al. [35] showed that the average crop yield increase after biochar application ranged from 4.9% to 48.4% globally. During the 2-year experiment, the yield of Tiezhu No. 2 and Dadao wax gourd increased by 16.0–27.3% and 7.7–13.3%, respectively, by applying different feedstocks and biochar dosage (Table 1), which is consistent with the results of previous studies. The improvement in crop yields depends largely on soil nutrient effectiveness, balance, and soil properties [36,37]. Due to its unique properties, biochar can be used as a nutrient source for crops and soil microorganisms, improve the soil environment, maintain soil water, affect the reaction and circulation of nutrients, regulate the activity and metabolism of soil microorganisms, and improve the effectiveness of nutrients, thus stimulating crop growth, improving crop yield and nutrient utilization efficiency [12,13,15,38]. In this study, the optimized fertilization followed by the biochar application significantly increased soil EC, organic C, NH4+-N, NO3−-N, and Olsen-P content compared to the FP treatment (Table 3). Enhancing soil organic carbon and Olsen-P content is strongly associated with increased yield (Figure 5), which is consistent with previous research [39]. In addition, the special surface porous structure of biochar can further adsorb and retain soil nutrients, reduce nutrient loss, and enhance the buffering capacity of the soil, thus promoting crop growth and increasing yields [40,41]. Our research results indicate that the application of biochar increases the yield of wax gourd by increasing its yield composition (Table 2, Figure 3). Meanwhile, the biochar application significantly promoted nutrient accumulation in wax gourd (Figure 4), which is consistent with the previous results [42,43]. Our observations indicated that biochar can improve soil organic carbon content, increase original soil pH (Table S1), and increase nutrient effectiveness in South China, thereby promoting crop nutrient uptake and increasing yields.
4.2. Differential Regulation of Soil Physicochemical Properties by Biochar Feedstock and Application Rate
The effect of biochar on soil physicochemical properties is influenced by various factors, including feedstock characteristics (e.g., feedstock type and particle size), pyrolysis environment (e.g., pyrolysis temperature, heating rate, and residence time), and application rate [44,45]. In spite of this, most of the studies have reported the positive effect of biochar on improving soil physicochemical properties and enhancing soil fertility [46,47,48]. In this study, the different feedstocks of biochar were able to increase the yield of wax gourd, but there were differences in the effects (Table 1). This is closely related to the variations in pore size, pH, CEC, and surface area, as well as the nutrient content of biochar from different feedstocks [49]. Liu et al. [50] also observed the different effects of biochar from different feedstocks on rice growth and yield. In addition, the lower effects of rice straw biochar observed in this study are consistent with the results of Liu et al. [51], who reported that biochar from straw residues had a lower positive impact on crop yields than other feedstocks.
In addition to the feedstocks, the application rate of biochar is also an important factor affecting its effectiveness. The amount of biochar to be applied in agricultural production systems is highly controversial, with recommendations ranging from 100 kg ha−1 to 200 t ha−1 [52,53,54]. The meta-analysis results of Farhangi-Abriz et al. [55] showed that the maximum positive response of different crops to biochar application was observed in the biochar dosage range of 1–10 t ha−1. In this study, the enhancement of wax gourd yield by biochar at application rates of 3 t ha−1 was better than 12 t ha−1 (Table 1). This result is consistent with Liu et al. [51], who found that crop yield tended to decrease with increasing biochar application rates. Similarly, Rondon et al. [56] found that biochar over-application reduced soybean yield. The excessive application of biochar can inhibit plant growth, which is associated with nitrogen fixation and reduced microbial activity and nutrient uptake due to the high volatility and increased levels of toxic and hazardous substances [57]. Although optimal biochar application rates may depend on crop type, biochar characteristics, soil, and climate, the large-scale application of high rates of biochar is virtually unprofitable in conventional agriculture due to the current pricing of biochar [55]. Therefore, determining the optimal application rate and reducing the cost of biochar production is critical to adopting the practice.
4.3. Biochar Improves Wax Gourd Quality by Promoting Nutrient Absorption and Accumulation
The synergistic improvement of yield and quality is a necessary path for the high-quality development of today’s vegetables. Previous studies have noted that breeding, crop and soil management, and fertilization are recognized methods for improving the nutritional quality of agricultural products [58,59]. Although the effect of fertilization on crop quality depends on factors such as nutrient type, crop species, and site conditions, it improved overall crop quality by 11.9% and had the greatest effect on vegetable quality [11]. In this study, the biochar application significantly increased the pulp hardness of Tiezhu No. 2 and the fruit glossiness of the different varieties of wax gourd (Table 4). Fruit pulp hardness was mainly negatively correlated with fruit N, Ca, and Mg content (Figure 5), which was, on the one hand, related to the dilution effect caused by the improved soil nutrient effectiveness to promote fruit expansion after the biochar application (Table 3, Figure 5), and on the other hand, closely related to the reduction in cellular densification by rapid fruit expansion. While Wu et al. [60] observed that biochar application had little effect on tomato fruit shape index and firmness, this inconsistency may be related to the specific experimental conditions and the biochar used in the study.
Several studies have shown that biochar application can improve fruit nutritional quality (e.g., soluble protein, soluble sugar, total acid, and VC content) [61,62]. In this study, the different feedstocks and rates of biochar application significantly increased the soluble sugar, soluble protein, VC content, and sugar–acid ratio of the wax gourd fruits (Table 4). This may be due to the fact that the application of biochar increased the photosynthetic and transpiration rates of leaves and increased the chlorophyll content and leaf area of crops, which in turn facilitated the transport of photosynthetic products to fruits, and improved the efficiency of N, P, and K utilization in plants, which resulted in improved tomato quality [63,64]. Our results also showed that the biochar application increased N, P, and K accumulation in the different varieties of wax gourd and had a tendency to promote nutrient partitioning into the fruit (Figure 4 and Figure S1), which supports the above assertions. Agbna et al. [65] found that biochar increased Vc and soluble sugars in tomatoes, which may be attributed to its ability to improve soil water retention and increase soil nutrients (e.g., alkaline-dissolved N, Olsen-P, and available K). In this study, the soluble sugar content of wax gourd fruits was positively correlated with the soil organic carbon and Olsen-P content, while the relationship between the Vc content and soil physicochemical properties was not significant. An increase in soil NH4+-N content decreased the fruit soluble sugar content, which is in agreement with the results of Ishfaq et al. [11]. In addition, we found that increased Mg content in fruit significantly enhanced soluble sugar content, which was mainly closely related to the promotion of Mg accumulation and transfer to fruit after the biochar application, as Mg is involved in photosynthesis and carbohydrate translocation [66,67]. Collectively, biochar improves fruit quality by increasing soil nutrient effectiveness and promoting nutrient uptake and transfer to the fruit of wax gourd.
5. Conclusions
A field experiment was conducted on the effect of biochar application with different feedstocks and rates on the yield and quality of different varieties of wax gourd. This work demonstrates that the wax gourd yield did not decrease after a proper fertilizer reduction strategy in South China’s open fields. Different feedstocks and amounts of biochar increase yield in different varieties of wax gourd by improving single fruit weight and longitudinal diameter and driving material partitioning to the fruit. The application of biochar can increase wax gourd yields by increasing the soil pH compared to pre-planting soil and improving nutrient availability (e.g., by increasing soil organic carbon, Olson-P, and exchangeable calcium). The fruit quality of wax gourd improved by promoting nutrient uptake and translocation after the biochar application. Therefore, under the conditions of this experiment, with the guarantee of biochar, nitrogen, phosphorus, and potassium fertilizers were reduced by 20.0%, 20.6%, and 21.1%, respectively, and the yield and quality were improved. Specifically, the application of 3 t ha−1 rice biochar has the most comprehensive benefits for the wax gourd yield and quality. This study provides a win–win strategy to improve soil nutrient availability, increase yield and quality, and reduce costly fertilizer applications.
Supplementary Materials
The following supporting information can be downloaded at: https://www.mdpi.com/article/10.3390/agronomy14081750/s1, Figure S1: Effects of five fertilization treatments on nutrient distribution ratio of different parts of two wax melon at maturity stage; Table S1: Differences in physical and chemical properties of biochar; Table S2: Differences in biochar BET surface area parameters and elemental content. Table S3: Variation of nutrient content in fruit of two wax gourd varieties under five fertilization treatments. Refs. [33,34] are cited in Supplementary Materials.
Author Contributions
B.Z. conceived and designed the experiments; Z.L., Y.H., H.L. and T.F. carried out the experiments; J.L. and Z.L. analyzed the data and wrote the work; Y.P., J.C., X.C., Z.S. and L.C. assisted in reviewing the report and analyzing the findings; D.X. and W.G. helped revise the manuscript; and before approving the finished version, all the writers studied the article and discussed the findings. All authors have read and agreed to the published version of the manuscript.
Funding
This work was jointly supported by Basic and Applied Basic Research Foundation of Guangdong Province (2023A1515030283); Training Plan for Young and Middle-Aged Discipline Leaders of GDAAS (R2023PY-JG006); Low carbon agriculture and carbon neutralization Research Center, GDAAS (XT202222); Basic and Applied Basic Research Foundation of Guangdong Province (2022A1515110170). We also appreciate the continued support from the International Magnesium Institute (IMI2018-01), K+S Group.
Data Availability Statement
The data related to this study are all in the article.
Conflicts of Interest
The authors declare no conflicts of interest.
References
- Alemu, T.T. Nutritional contribution of fruit and vegetable for human health: A review. Int. J. Health Policy Plann. 2024, 3, 1–9. [Google Scholar]
- FAO. FAOSTAT. Database-Resources; FAO: Rome, Italy, 2022.
- Wang, X.; Dou, Z.; Shi, X.; Zou, C.; Liu, D.; Wang, Z.; Guan, X.; Sun, Y.; Wu, G.; Zhang, B.; et al. Innovative management programme reduces environmental impacts in Chinese vegetable production. Nat. Food 2021, 2, 47–53. [Google Scholar] [CrossRef] [PubMed]
- Zhang, B.; Li, Q.; Cao, J.; Zhang, C.; Song, Z.; Zhang, F.; Chen, X. Reducing nitrogen leaching in a subtropical vegetable system. Agric. Ecosyst. Environ. 2017, 241, 133–141. [Google Scholar] [CrossRef]
- Wang, X.; Zou, C.; Gao, X.; Guan, X.; Zhang, W.; Zhang, Y.; Shi, X.; Chen, X. Nitrous oxide emissions in Chinese vegetable systems: A meta-analysis. Environ. Pollut. 2018, 239, 375–383. [Google Scholar] [CrossRef] [PubMed]
- Zhang, F.; Liu, F.; Ma, X.; Guo, G.; Liu, B.; Cheng, T.; Liang, T.; Tao, W.; Chen, X.; Wang, X. Greenhouse gas emissions from vegetables production in China. J. Clean. Prod. 2021, 317, 128449. [Google Scholar] [CrossRef]
- Thompson, R.B.; Voogt, W.; Incrocci, L.; Fink, M.; Neve, S.D. Strategies for optimal fertiliser management of vegetable crops in Europe. ISHS Acta Hortic. 2018, 1192, 129–140. [Google Scholar] [CrossRef]
- Tei, F.; Neve, S.D.; Haan, J.D.; Kristensen, H.L.G. Nitrogen management of vegetable crops. Agric. Water Manag. 2020, 240, 106316. [Google Scholar] [CrossRef]
- Wang, F.; Wang, X.; Song, N. Biochar and vermicompost improve the soil properties and the yield and quality of cucumber (Cucumis sativus L.) grown in plastic shed soil continuously cropped for different years. Agric. Ecosyst. Environ. 2021, 315, 107425. [Google Scholar] [CrossRef]
- Kumar, M.; Dutta, S.; You, S.; Luo, G.; Zhang, S.; Show, P.L.; Singh, L.; Tsang, D.C.W. A critical review on biochar for enhancing biogas production from anaerobic digestion of food waste and sludge. J. Clean. Prod. 2021, 305, 127143. [Google Scholar] [CrossRef]
- Ishfaq, M.; Wang, Y.; Xu, J.; Hassan, M.U.; Yuan, H.; Liu, L.; He, B.; Ejaz, I.; White, P.J.; Cakmak, I.; et al. Improvement of nutritional quality of food crops with fertilizer: A global meta-analysis. Agron. Sustain. Dev. 2023, 43, 74. [Google Scholar] [CrossRef]
- Yan, S.; Zhang, S.; Yan, P.; Aurangzeib, M. Effect of biochar application method and amount on the soil quality and maize yield in Mollisols of Northeast China. Biochar 2023, 4, 56. [Google Scholar] [CrossRef]
- Hu, M.; Chen, J.; Liu, Y. Structural properties and adsorption performance relationship towards three categories of lignin and their derived biochar. Bioresour. Technol. 2024, 401, 130712. [Google Scholar] [CrossRef] [PubMed]
- Bai, S.H.; Omidvar, N.; Gallart, M.; Kämper, W.; Tahmasbian, I.; Farrar, M.B.; Singh, K.; Zhou, G.; Muqadass, B.; Xu, C.; et al. Combined effects of biochar and fertilizer applications on yield: A review and meta-analysis. Sci. Total Environ. 2022, 808, 152073. [Google Scholar] [CrossRef] [PubMed]
- Liu, Q.; Meki, K.; Zheng, H.; Yuan, Y.; Shao, M.; Luo, X.; Li, X.; Jiang, Z.; Li, F.; Xing, B. Biochar application in remediating salt-affected soil to achieve carbon neutrality and abate climate change. Biochar 2023, 5, 45. [Google Scholar] [CrossRef]
- He, M.; Xiong, X.; Wang, L.; Hou, D.; Bolan, N.S.; Ok, Y.S.; Rinklebe, J.; Tsang, D.C.W. A critical review on performance indicators for evaluating soil biota and soil health of biochar-amended soils. J. Hazard. Mater. 2021, 414, 125378. [Google Scholar] [CrossRef] [PubMed]
- Biederman, L.A.; Harpole, W.S. Biochar and its effects on plant productivity and nutrient cycling: A meta-analysis. Glob. Chang. Biol. Bioenergy 2013, 5, 202–214. [Google Scholar] [CrossRef]
- Ye, L.; Arbestain, M.C.; Shen, Q.; Lehmann, J.; Singh, B.; Sabir, M. Biochar effects on crop yields with and without fertilizer: A meta-analysis of field studies using separate controls. Soil Use Manag. 2020, 36, 2–18. [Google Scholar] [CrossRef]
- Li, H.; Yan, T.; Fu, T.; Hao, Y.; Li, J.; Tan, Y.; Li, Z.; Peng, Y.; Chen, X.; Chang, J.; et al. Biochar combined with magnesium fertilizer improves cabbage (Brassica oleraceae L.) yield by modulating physicochemical characteristics and the bacterial community in acidic soil. Soil Use Manag. 2023, 39, 1422–1436. [Google Scholar] [CrossRef]
- Khan, T.F.; Salma, M.U.; Hossain, S.A. Impacts of different sources of biochar on plant growth characteristics. Am. J. Plant Sci. 2018, 9, 1922–1934. [Google Scholar] [CrossRef][Green Version]
- Vista, S.P.; Khadka, A. Determining appropriate dose of biochar for vegetables. J. Pharmacogn. Phytochem. 2017, 6, 673–677. [Google Scholar]
- Guo, H.; Chen, L.; Wang, Y.; Li, Q.; Yi, Z. Combined application of biochar and magnesium fertilizer effectively improved the soil environment and the tea quality in southern strongly acidic tea garden. J. Soils Sediments 2023, 23, 2798–2815. [Google Scholar] [CrossRef]
- Zhang, C.; Li, X.; Yan, H.; Ullah, I.; Zuo, Z.; Li, L.; Yu, J. Effects ofirrigation quantity and biochar on soil physical properties, growth Characteristic yield and quality of greenhouse tomato. Agric. Manag. 2020, 241, 106263. [Google Scholar] [CrossRef]
- Guo, J.H.; Liu, X.J.; Zhang, Y.; Shen, J.L.; Han, W.X.; Zhang, W.F.; Christie, P.; Goulding, K.; Vitousek, P.; Zhang, F.S. Significant acidification in major chinese croplands. Science 2010, 327, 1008–1010. [Google Scholar] [CrossRef] [PubMed]
- Agegnehu, G.; Amede, T.; Erkossa, T.; Yirga, C.; Henry, C.; Tyler, R. Extent and management of acid soils for sustainable crop production system in the tropical agroecosystems: A review. Soil Plant Sci. 2021, 71, 852–869. [Google Scholar] [CrossRef]
- Marr, K.L.; Xia, Y.; Bhattarai, N.K. Allozymic, morphological, phenological, linguistic, plant use, and nutritional data of benincasa hispida (Cucurbitaceae). Econ. Bot. 2007, 61, 44–59. [Google Scholar] [CrossRef]
- Zhang, B.; Cakamak, I.; Feng, J.; Yu, C.; Chen, X.; Xie, D.; Wu, L.; Song, Z.; Cao, J.; He, Y. Magnesium deficiency reduced the yield and seed germination in wax gourd by affecting the carbohydrate translocation. Front. Plant Sci. 2020, 11, 797. [Google Scholar] [CrossRef] [PubMed]
- Ma, L.; Liu, Z.; Cheng, Z.; Gou, J.; Chen, J.; Yu, W.; Wang, P. Identification and application of BhAPRR2 controlling peel colour in wax gourd (Benincasa hispida). Front. Plant Sci. 2021, 12, 716772. [Google Scholar] [CrossRef] [PubMed]
- Chen, X.; Chen, X.; Jiao, J.; Zhang, F.; Chen, X.; Li, G.; Song, Z.; Sokolowski, E.; Imas, P.; Magen, H.; et al. Towards balanced fertilizer management in south china: Enhancing wax gourd (Benincasa hispida) yield and produce quality. Sustainability 2022, 14, 5646. [Google Scholar] [CrossRef]
- Sparks, D.L.; Fendorf, S.E.; IV, C.V.T.; Carski, T.H. Kinetic methods and measurements. Methods Soil Anal. 1996, 5, 1275–1307. [Google Scholar] [CrossRef]
- Yemm, E.W.; Willis, A.J. The estimation of carbohydrates in plant extracts by anthrone. Biochem. J. 1954, 57, 508–514. [Google Scholar] [CrossRef] [PubMed]
- Deans, C.A.; Sword, G.A.; Lenhart, P.A.; Burkness, E.; Hutchison, W.D.; Behmer, S.T. Quantifying plant soluble protein and digestible carbohydrate content, using corn (Zea mays) as an exemplar. J. Vis. Exp. 2018, 138, 58164. [Google Scholar]
- Desai, A.P.; Desai, S. UV spectroscopic method for determination of vitamin C (ascorbic acid) content in different fruits in south gujarat region. Int. J. Environ. Sci. Nat. Resour. 2019, 21, 2. [Google Scholar] [CrossRef]
- Volmer, D.A.; Schultz, L.D. Determination of titratable acidity in wine using potentiometric, conductometric, and photometric methods. J. Chem. Educ. 2017, 94, 1296–1302. [Google Scholar] [CrossRef]
- Bo, X.; Zhang, Z.; Wang, J.; Guo, S.; Li, Z.; Lin, H.; Huang, Y.; Han, Z.; Kuzyakov, Y.; Zou, J. Benefits and limitations of biochar for climate-smart agriculture: A review and case study from China. Biochar 2023, 5, 77. [Google Scholar] [CrossRef]
- Liu, J.; Shu, A.; Song, W.; Shi, W.; Li, M.; Zhang, W.; Li, Z.; Liu, G.; Yuan, F.; Zhang, S.; et al. Long-term organic fertilizer substitution increases rice yield by improving soil properties and regulating soilbacteria. Geoderma 2021, 404, 115287. [Google Scholar] [CrossRef]
- Qaswar, M.; Huang, J.; Ahmed, W.; Li, D.; Liu, S.; Zhang, L.; Cai, A.; Liu, L.; Xu, Y.; Gao, J.; et al. Yield sustainability, soil organic carbon sequestration and nutrients balance under long-term combined application of manure and inorganic fertilizers in acidic paddy soil. Soil Tillage Res. 2020, 198, 104569. [Google Scholar] [CrossRef]
- Alkharabsheh, H.M.; Seleiman, M.F.; Battaglia, M.L.; Shami, A.; Jalal, R.S.; Alhammad, B.A.; Almutairi, K.F.; Al-Saif, A.M. Biochar and its broad impacts in soil quality and fertility, nutrient leaching and crop productivity: A review. Agronomy 2021, 11, 993. [Google Scholar] [CrossRef]
- Ibrahim, M.M.; Zhang, H.; Guo, L.; Chen, Y.; Heiling, M.; Zhou, B.; Mao, Y. Biochar interaction with chemical fertilizer regulates soil organic carbon mineralization and the abundance of key C-cycling-related bacteria in rhizosphere soil. Eur. J. Soil Biol. 2021, 106, 103350. [Google Scholar] [CrossRef]
- Liu, M.; Linna, C.; Ma, S.; Ma, Q.; Song, W.; Shen, M.; Song, L.; Cui, K.; Zhou, Y.; Wang, L. Biochar combined with organic and inorganic fertilizers promoted the rapeseed nutrient uptake and improved the purple soil quality. Front. Nutr. 2022, 9, 997151. [Google Scholar] [CrossRef] [PubMed]
- Tan, Z.; Yuan, S.; Hong, M.; Zhang, L.; Huang, Q. Mechanism of negative surface charge formation on biochar and its effect on the fixation of soil Cd. J. Hazard. Mater. 2020, 384, 121370. [Google Scholar] [CrossRef] [PubMed]
- Peng, J.; Han, X.; Li, N.; Chen, K.; Yang, J.; Zhan, X.; Luo, P.; Liu, N. Combined application of biochar with fertilizer promotes nitrogen uptake in maize by increasing nitrogen retention in soil. Biochar 2021, 3, 367–379. [Google Scholar] [CrossRef]
- Xia, H.; Riaz, M.; Zhang, M.; Liu, B.; Li, Y.; El-Desouki, Z.; Jiang, C. Biochar-N fertilizer interaction increases N utilization efficiency by modifying soil C/N component under N fertilizer deep placement modes. Chemosphere 2022, 286, 131594. [Google Scholar] [CrossRef] [PubMed]
- Anand, A.; Kumar, V.; Kaushal, P. Biochar and its twin benefits: Crop residue management and climate change mitigation in India. Renew. Sustain. Energy Rev. 2022, 156, 111959. [Google Scholar] [CrossRef]
- Li, X.; Wu, D.; Liu, X.; Huang, Y.; Cai, A.; Xu, H.; Ran, J.; Xiao, J.; Zhang, W. A global dataset of biochar application effects on crop yield, soil properties, and greenhouse gas emissions. Sci. Data 2024, 11, 57. [Google Scholar] [CrossRef] [PubMed]
- Zhu, X.; Chen, B.; Zhu, L.; Xing, B. Effects and mechanisms of biochar-microbe interactions in soil improvement and pollution remediation: A review. Environ. Pollut. 2017, 227, 98–115. [Google Scholar] [CrossRef] [PubMed]
- Singh, H.; Northup, B.K.; Rice, C.W.; Prasad, P.V.V. Biochar applications influence soil physical and chemical properties, microbial diversity, and crop productivity: A meta-analysis. Biochar 2022, 4, 8. [Google Scholar] [CrossRef]
- Lu, Y.; Gu, K.; Shen, Z.; Tang, C.; Shi, B.; Zhou, Q. Biochar implications for the engineering properties of soils: A review. Sci. Total Environ. 2023, 888, 164185. [Google Scholar] [CrossRef] [PubMed]
- Fungo, B.; Guerena, D.; Thiongo, M.; Lehmann, J.; Neufeldt, H.; Kalbitz, K. N2O and CH4 emission from soil amended with steam-activated biochar. J. Plant Nutr. Soil Sci. 2014, 177, 34–38. [Google Scholar] [CrossRef]
- Liu, Y.; Li, H.; Hu, T.; Mahmoud, A.; Li, J.; Zhu, R.; Jiao, X.; Jing, P. A quantitative review of the effects of biochar application on rice yield and nitrogen use efficiency in paddy fields: A meta-analysis. Sci. Total Environ. 2022, 830, 154792. [Google Scholar] [CrossRef] [PubMed]
- Liu, X.; Zhang, A.; Ji, C.; Joseph, S.; Bian, R.; Li, L.; Pan, G.; Paz-Ferreiro, J. Biochar’s effect on crop productivity and the dependence on experimental conditions—A meta-analysis of literature data. Plant Soil 2013, 373, 583–594.10. [Google Scholar] [CrossRef]
- Zwieten, L.V.; Kimber, S.; Morris, S.; Chan, K.Y.; Downie, A.; Rust, J.; Joseph, S.; Cowe, A. Effects of biochar from slow pyrolysis of papermill waste on agronomic performance and soil fertility. Plant Soil 2010, 327, 235–246. [Google Scholar] [CrossRef]
- Guo, M.; He, Z.; Uchimiya, S.M. Introduction to biochar as an agricultural and environmental amendment. In Agricultural and Environmental Applications of Biochar: Advances and Barriers; Soil Science Society of America, Inc.: Madison, WI, USA, 2016; Volume 63. [Google Scholar] [CrossRef]
- Intani, K.; Latif, S.; Islam, M.; Müller, J. Phytotoxicity of corncob biochar before and after heat treatment and washing. Sustainability 2019, 11, 30. [Google Scholar] [CrossRef]
- Farhangi-Abriz, S.; Torabian, S.; Qin, R.; Noulas, C.; Lu, Y.; Gao, S. Biochar effects on yield of cereal and legume crops using meta-analysis. Sci. Total Environ. 2021, 775, 145869. [Google Scholar] [CrossRef]
- Rondón, M.A.; Lehmann, J.; Ramírez, J.; Hurtado, M. Biological nitrogen fixation by common beans (Phaseolus vulgaris L.) increases with biochar additions. Biol. Fertil. Soils 2007, 43, 699–708. [Google Scholar] [CrossRef]
- Ding, Y.; Liu, Y.; Liu, S.; Li, Z.; Tan, X.; Huang, X.; Zeng, G.; Zhou, L.; Zheng, B. Biochar to improve soil fertility. A review. Agron. Sustain. Dev. 2016, 36, 36. [Google Scholar] [CrossRef]
- Cakmak, K. Agronomic biofortification of cereals with zinc: A review. Eur. J. Soil Sci. 2018, 69, 172–180. [Google Scholar] [CrossRef]
- Ishfaq, M.; Zhong, Y.; Wang, Y.; Li, X. Magnesium limitation leads to transcriptional down-tuning of auxin synthesis, transport, and signaling in the tomato root. Front. Plant Sci. 2021, 12, 802399. [Google Scholar] [CrossRef] [PubMed]
- Wu, Z.; Fan, Y.; Qiu, Y.; Hao, X.; Li, S.; Kang, S. Response of yield and quality of greenhouse tomatoes to water and salt stresses and biochar addition in Northwest China. Agric. Water Manag. 2022, 270, 107736. [Google Scholar] [CrossRef]
- Keabetswe, L.; Shao, G.C.; Cui, J.; Lu, J.; Stimela, T. A combination of biochar and regulated deficit irrigation improves tomato fruit quality: A comprehensive quality analysis. Folia Hortic. 2019, 31, 181–193. [Google Scholar] [CrossRef]
- Abdelghany, A.E.; Dou, Z.; Alashram, M.G.; Eltohamy, K.M.; Elrys, A.S.; Liu, X.; Wu, Y.; Cheng, M.; Fan, J.; Zhang, F. The joint application of biochar and nitrogen enhances fruit yield, quality and water-nitrogen productivity of water-stressed greenhouse tomato under drip fertigation. Agric. Water Manag. 2023, 290, 108605. [Google Scholar] [CrossRef]
- Akhtar, S.S.; Li, G.; Andersen, M.N.; Liu, F. Biochar enhances yield and quality of tomato under reduced irrigation. Agric. Water Manag. 2014, 138, 37–44. [Google Scholar] [CrossRef]
- Zeeshan, M.; Ahmad, W.; Hussain, F.; Ahamd, W.; Numan, M.; Shah, M.; Ahmad, I. Phytostabalization of the heavy metals in the soil with biochar applications, the impact on chlorophyll, carotene, soil fertility and tomato crop yield. J. Clean. Prod. 2020, 255, 120318. [Google Scholar] [CrossRef]
- Agbna, G.H.D.; Ali, A.B.; Bashir, A.K.; Eltoum, F.; Hassan, M.M. Influence of Biochar Amendment on Soil Water Characteristics and Crop Growth Enhancement Under Salinity Stress. Int. J. Eng. Work. 2017, 4, 49–54. [Google Scholar]
- Tränkner, M.; Tavakol, E.; Jákli, B. Functioning of potassium and magnesium in photosynthesis, photosynthate translocation and photoprotection. Physiol. Plant. 2018, 163, 414–431. [Google Scholar] [CrossRef] [PubMed]
- Ishfaq, M.; Wang, Y.; Yan, M.; Wang, Z.; Wu, L.; Li, C.; Li, X. Physiological essence of magnesium in plants and its widespread deficiency in the farming system of China. Front. Plant Sci. 2022, 13, 802274. [Google Scholar] [CrossRef] [PubMed]


Disclaimer/Publisher’s Note: The statements, opinions and data contained in all publications are solely those of the individual author(s) and contributor(s) and not of MDPI and/or the editor(s). MDPI and/or the editor(s) disclaim responsibility for any injury to people or property resulting from any ideas, methods, instructions or products referred to in the content. |
© 2024 by the authors. Licensee MDPI, Basel, Switzerland. This article is an open access article distributed under the terms and conditions of the Creative Commons Attribution (CC BY) license (https://creativecommons.org/licenses/by/4.0/).