Abstract
The intelligent detection of young peaches is the main technology of fruit-thinning robots, which is crucial for enhancing peach fruit quality and reducing labor costs. This study presents the lightweight YOLO-PEM model based on YOLOv8s to achieve high-precision and automatic detection of young “Okubo” peaches. Firstly, the C2f_P module was devised by partial convolution (PConv), replacing all C2f modules in YOLOv8s to achieve the model’s lightweight. Secondly, embedding the efficient multi-scale attention (EMA) module in the lightweight C2f_P_1 module of the backbone network enhanced the feature extraction capability and accuracy for young peaches. Finally, the MPDIoU loss function was utilized to replace the original CIoU loss function, which improved the detection accuracy of the bounding box while speeding up the convergence of the model. The experimental results demonstrate that the YOLO-PEM model achieved an average precision (AP) of 90.86%, F1 score of 86.70%, and model size of 16.1 MB, which was a 1.85% improvement in the AP, 0.85% improvement in the F1 score, and 5.3 MB reduction in the model size compared with YOLOv8s. The AP was 6.26%, 6.01%, 2.05%, 2.12%, and 1.87% higher compared with the other lightweight detection models YOLOv3-tiny, YOLOv4-tiny, YOLOv5s, YOLOv6s, and YOLOv7-tiny, respectively. Furthermore, the FPS of YOLO-PEM was 196.2 f·s-1, which can fulfill the demand for the real-time detection of young peaches. YOLO-PEM effectively detects young peaches in complex orchard environments and can offer a basis for the theoretical design of the vision system of the “Okubo” peach fruit-thinning robot and scientific management of orchards.
1. Introduction
The “Okubo” peach, an excellent peach variety, is widely planted in northern China. Rational fruit thinning is an effective practice in the growth management of peach trees since it enhances fruit quality and extends the lifespan of the plants. Failure to carry out reasonable fruit thinning leads to tree weakness, the shortening of new shoots, a small fruit shape, poor quality, and the formation of large and small year fruit phenomena. Reasonable fruit thinning can reduce the nutrient competition and fruit drop phenomenon and improve the fruit set rate of high-quality commercial fruit [1,2,3]. Peach tree fruit thinning is generally about 40 days after flowering, retaining the fruit thinning part of the thinning dense fruit part; fruit thinning should thin out small fruits, double fruits, deformed fruits, pests and diseases, and leafless fruits to realize the scientific management of a peach orchard.
Currently, the commonly used methods of fruit thinning are artificial fruit thinning, mechanical fruit thinning, and chemical fruit thinning [4]. Artificial fruit thinning is based on production experience; the fruit thinning effect is good but requires a lot of labor and high costs. The chemical fruit thinning cost is low, but the fruit-thinning effect is unstable, and it is easy to cause excessive fruit thinning. Mechanical fruit thinning can reduce labor, but it still requires manual operation [5]. The accurate detection of young peaches is a key part of the design of intelligent fruit-thinning robots, which offers technical assistance for designing the vision system for fruit-thinning robots.
The use of vision technology combined with image processing and artificial intelligence has obvious advantages in detecting fruits, which can be efficiently analyzed [6,7]. However, due to the complex environment of small fruit sizes and similar fruit and leaf colors, traditional machine vision technology makes it challenging to detect young fruits accurately. As the computational power of computers improves and deep learning algorithms have developed rapidly in recent years, convolutional neural networks (CNNs) have shown a strong detection ability in fruit target detection. Target detection algorithms are categorized into two main groups, and the first one is based on regionally generated convolutional network structures, which consist of R-CNNs [8], fast R-CNNs [9], faster R-CNNs [10], and mask R-CNNs [11]. The detection of the target position is treated as a regression problem in the second approach, such as SSD [12] and YOLOv3 [13].
In recent times, many researchers have used the YOLO algorithm for detection models in fruit detection studies, such as for green apple [14], citrus [15], strawberry [16], tomato [17], and pear [18] fruits. To realize the ripeness detection of tomato fruits, Zeng et al. [19] replaced the YOLOv5 backbone network with MobileNetV3 and performed channel pruning on the neck network to achieve a lightweight model and an mAP of 96.9%. Nan et al. [20] utilized the WFE-C4 module and GPF-SPP to achieve the fusion of feature information and detected a variety of dragon fruits during the picking process with an mAP of 86%. In order to implement the detection of citrus fruits at the ripening stage in an orchard, Xu et al. [21] used GhostNet as the backbone of YOLOv4 and DWConv for reducing the parameters, and the ECA module was included to enhance the precision, and the mAP of the improved YOLOv4 for citrus reached 98.21%.
In modern orchard management, some scholars have tested fruits during the thinning period. To enhance the problem of the leakage detection of young apple fruits under occlusion conditions, Jiang et al. [22] introduced the fusion of a non-local attention module in YOLOv4, which was tested to achieve an mAP of 96.9% under severe occlusion conditions and was able to realize the detection of young apple fruits in complex environments. To realize the automatic detection of pear fruits during the fruit-thinning period, Lu et al. [23] proposed a green and tiny target pear fruit detection algorithm, ODL Net. The results of the experiments showed that the precision of ODL Net before and after the fruit-thinning stage reached 56.2% and 65.1%, respectively, and the recall arrived at 61.3% and 70.8%, respectively. To achieve apple detection during fruit thinning, Wang and He [24] used channel pruning to prune YOLOv5s, and the improved YOLOv5s achieved a 95.8% accuracy for apple detection during fruit thinning. Hussain et al. [25] utilized a mask R-CNN for the segmentation of green apples as well as stem segments to detect apples in the fruit-thinning stage and estimated the orientation of green fruits and stems using principal component analysis. The AP values of the model for the overall masking of green apples and stems were 83.4% and 38.9%, respectively.
The current YOLO-based detection model has made some progress in fruit detection at the thinning stage, and the detection effect is sufficient so that it can be used as a guide for young “Okubo” peaches. Simultaneously, the model structure is optimized, the parameters and FLOPs are reduced, the accuracy is improved, and the problems of the large model size and missing fruit recognition under occlusion are solved. In this study, a detection method, YOLO-PEM, for young peaches is proposed due to similar fruit colors and leaves, small fruit sizes, and missing detection in the occlusion of “Okubo” peaches during fruit thinning. The primary contributions of this study are as follows:
(1) PConv was used to design the C2f_P module instead of all C2f in YOLOv8s to lighten the model and enhance the accuracy for young peaches.
(2) The EMA module was embedded into the C2f_P_1 module of YOLO-P to improve the model’s capability to extract the feature information of young peaches, thus improving the detection precision for young peaches.
(3) CIoU was replaced with the MPDIoU boundary loss function to improve the accuracy of the bounding box and speed up the model convergence.
The YOLO-PEM has a smaller size and higher accuracy for young peach detection, which offers technical support for establishing a robotic vision system for “Okubo” peach fruit growth management and thinning.
2. Materials and Methods
2.1. Datasets of Young “Okubo” Peaches
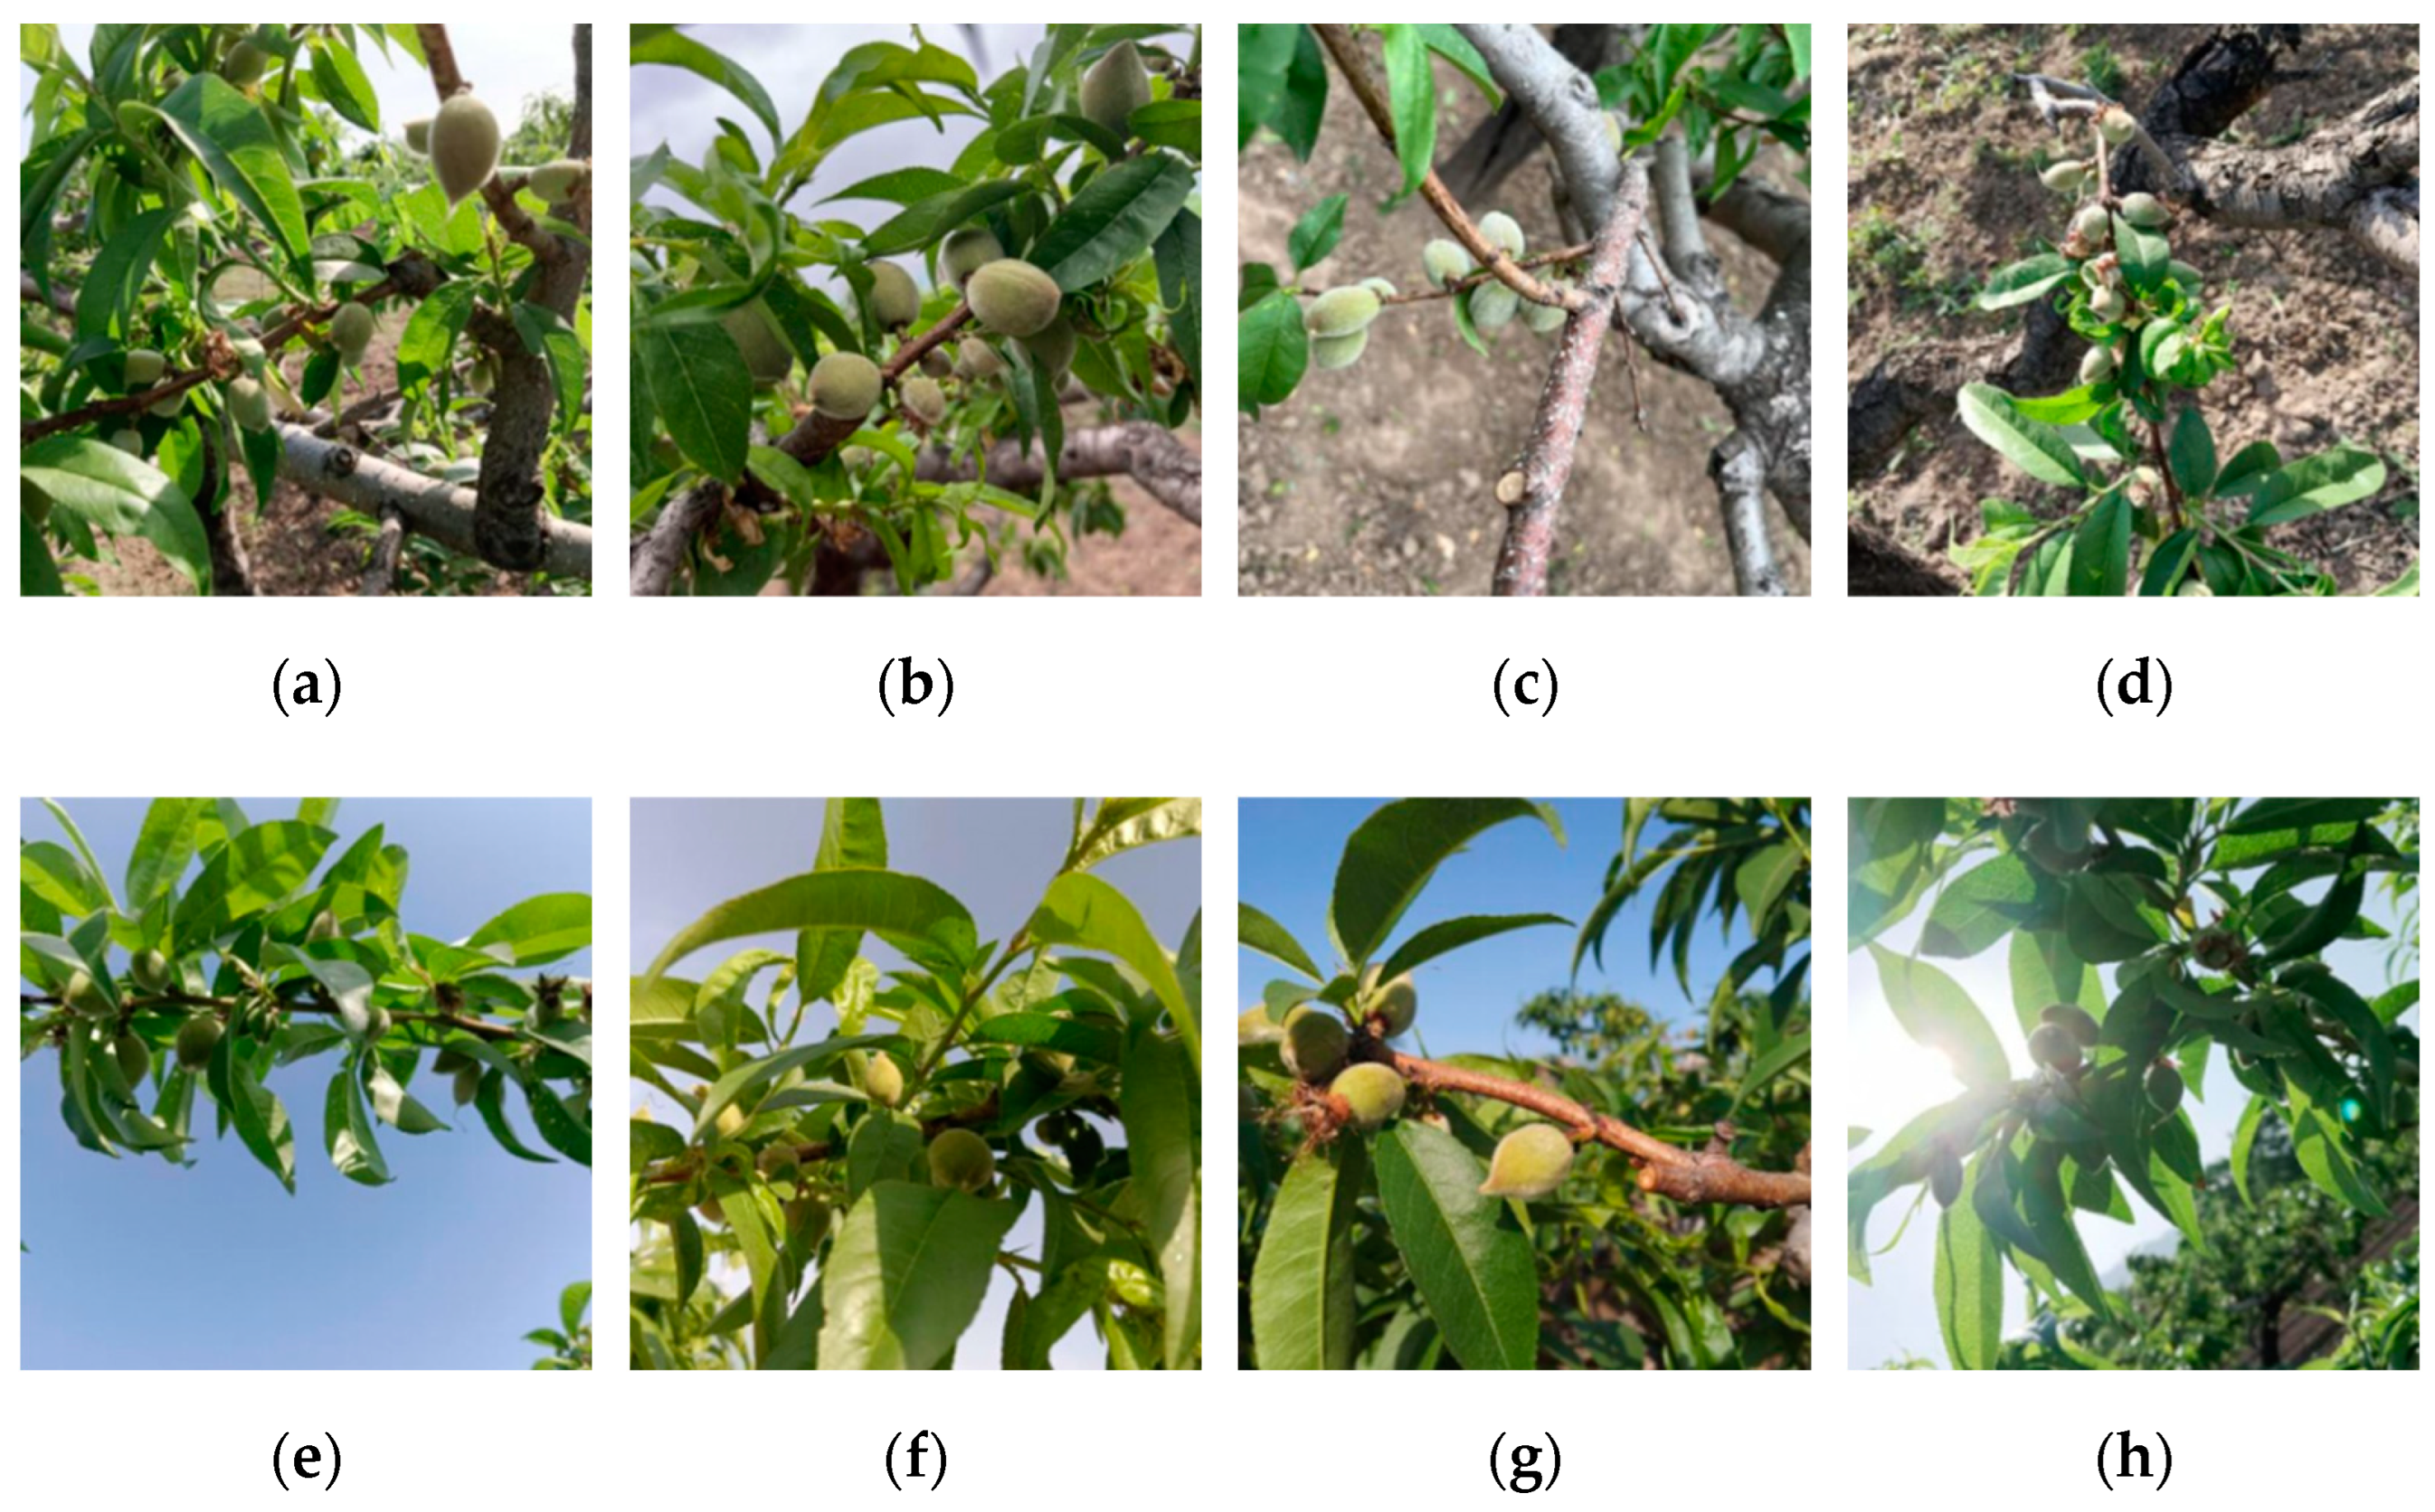
In this study, we obtained images of young “Okubo” peach fruits from a peach orchard in Xishandi Village, Taigu District, Shanxi Province, with a conical shape, a height of about 1.5 m, a row spacing of about 3 m, and a plant spacing of about 2 m. The acquisition time was from 8:00 to 18:00, and the camera model was SONY IMX-703, with a resolution of 3024 × 3024 pixels and a focal length of 35 mm, and the camera’s distance from the young “Okubo” peach fruits was from 0.2 m to 1 m. A total of 2418 images were collected for the dataset, each containing image data of young peaches. Some images in the collected “Okubo” peach dataset are shown in Figure 1.
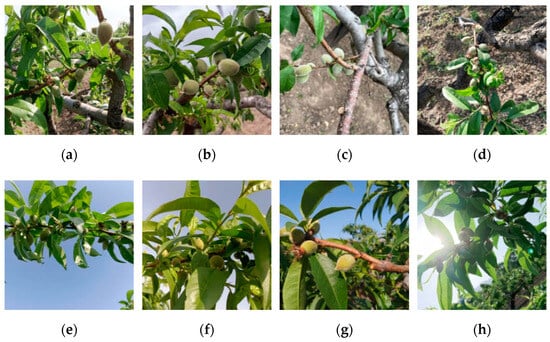
Figure 1.
Images of young fruits. (a) Sunny; (b) cloudy; (c) branch occlusion; (d) cluster; (e) sky background; (f) leaf background; (g) front-lighting; and (h) back-lighting.
In this study, image annotation was performed using the LabelImg 1.8.6 (Tzutalin, Vancouver, BS, Canada) software, which drew the smallest outer rectangular boxes on the young “Okubo” peaches in the images to complete the manual annotation and included as little background information as possible for each young fruit. Considering the working situation and working conditions of the actual fruit-thinning robot, the young fruits of the seriously obstructed “Okubo” peaches were not labeled. The images were labeled as “y_peach”, and a total of 17,247 “Okubo” peach fruits were marked. The labeled dataset was randomly divided into a training set, a verification set, and a test set according to a 7:2:1 ratio. The number of pictures in each dataset and the number of labeled “Okubo” peach larvae are shown in Table 1.

Table 1.
Different datasets of young “Okubo” peach fruit numbers.
2.2. Comparison of the YOLOv8 Model and Performance
YOLOv8, an open-source version of YOLO developed by the Ultralytics company (Washington, DC, USA) on 10 January 2023, represents a state-of-the-art model. Within the backbone network, the C2f module is primarily employed for input feature extraction and draws inspiration from the design concept of ELAN in YOLOv7 [26]. The SPPF module effectively reduces computational effort through convolution and pooling operations while enhancing the backbone network’s receptive field. The FPN+PAN structure [27,28] is used in the neck network section, augmenting the model’s feature fusion ability. Regarding the detection header component, YOLOX’s decoupled detection header [29] is utilized to segregate the regression branch from the prediction branch and expedite model convergence.
YOLOv8 is available in five versions (YOLOv8n, YOLOv8s, YOLOv8m, YOLOv8l, and YOLOv8x). These versions are differentiated according to the depth and width of the network structure. In this study, five versions of YOLOv8 were trained and tested using the constructed “Okubo” young peach fruit dataset. The results are shown in Table 2.
Table 2.
YOLOv8 model performance comparison.
As shown in Table 2, YOLOv8n has the lowest parameters and FLOPs, and the smallest model size than the other YOLOv8 versions (YOLOv8s, YOLOv8m, YOLOv8l, and YOLOv8x). Conversely, the YOLOv8x version demonstrates the highest number of parameters, FLOPs, and the largest model size compared with the other versions of YOLOv8 with the most parameters. The model size of YOLOv8s exceeds that of YOLOv8n by 15.46 MB while achieving a 1.33% improvement in the average precision. Although the AP of YOLOv8s is slightly inferior to that of YOLOv8l by 1%, its model size is only 25.53%. Among the five versions of YOLOv8, YOLOv8n and YOLOv8s exhibit the fewest network layers. Based on an equal number of network layers in both models, YOLOv8s demonstrates a 1.33% higher detection accuracy, thereby better fulfilling the requirements for accurate detection. Furthermore, when compared with YOLOv8m and YOLOv8l, YOLOv8s reduces the number of model layers by 70 and 140, respectively. Considering all evaluation metrics and balancing detection accuracy with model size, YOLOv8s was selected for further enhancement in this study.
2.3. Improved Detection Model for Young “Okubo” Peaches
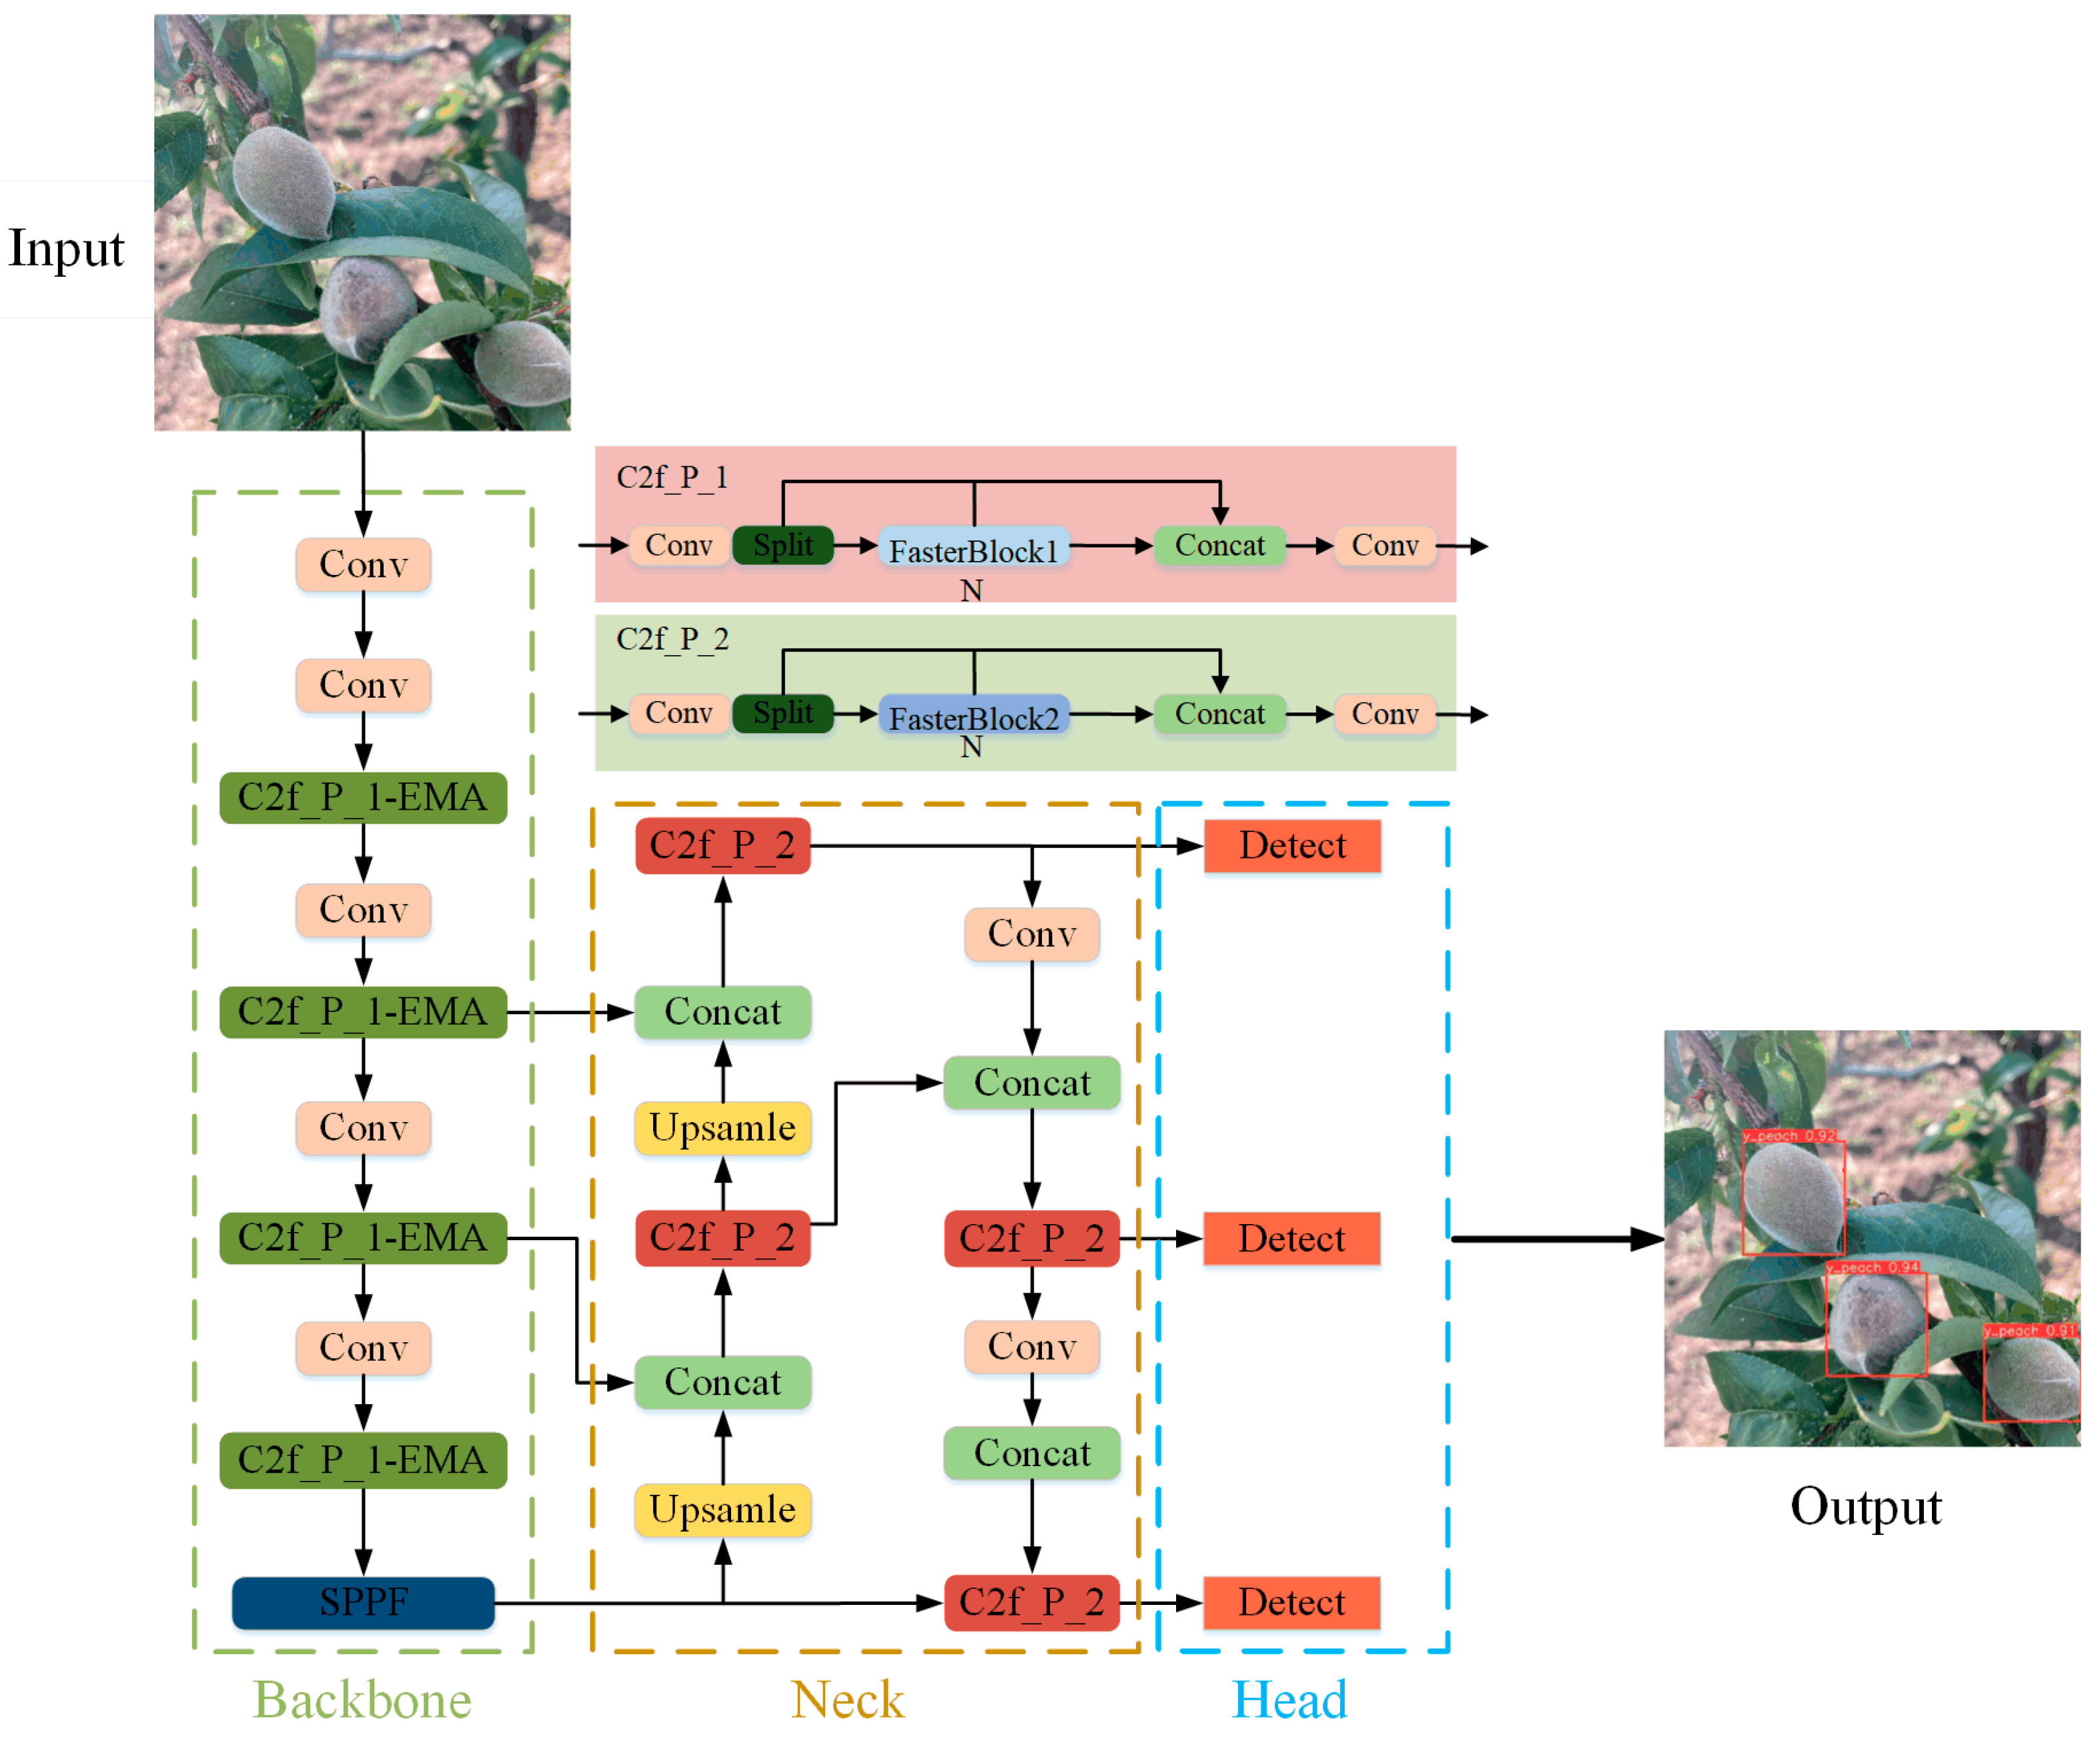
To realize the detection of young “Okubo” peaches in complex environments, this study proposes the YOLO-PEM model based on YOLOv8s, resulting in a reduced model size and improved fruit detection accuracy. The main improvements are the design of the C2f_P module using PConv, the addition of an embedded EMA module in the C2f_P_1 module, and the substitution of CIoU with the MPDIoU bounding loss function. The YOLO-PEM model’s structure is shown in Figure 2.
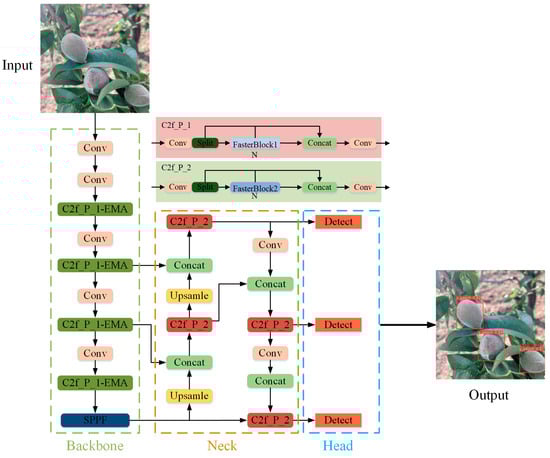
Figure 2.
YOLO-PEM detection model’s structure.
2.3.1. Construction of the Lightweight C2f_P Module
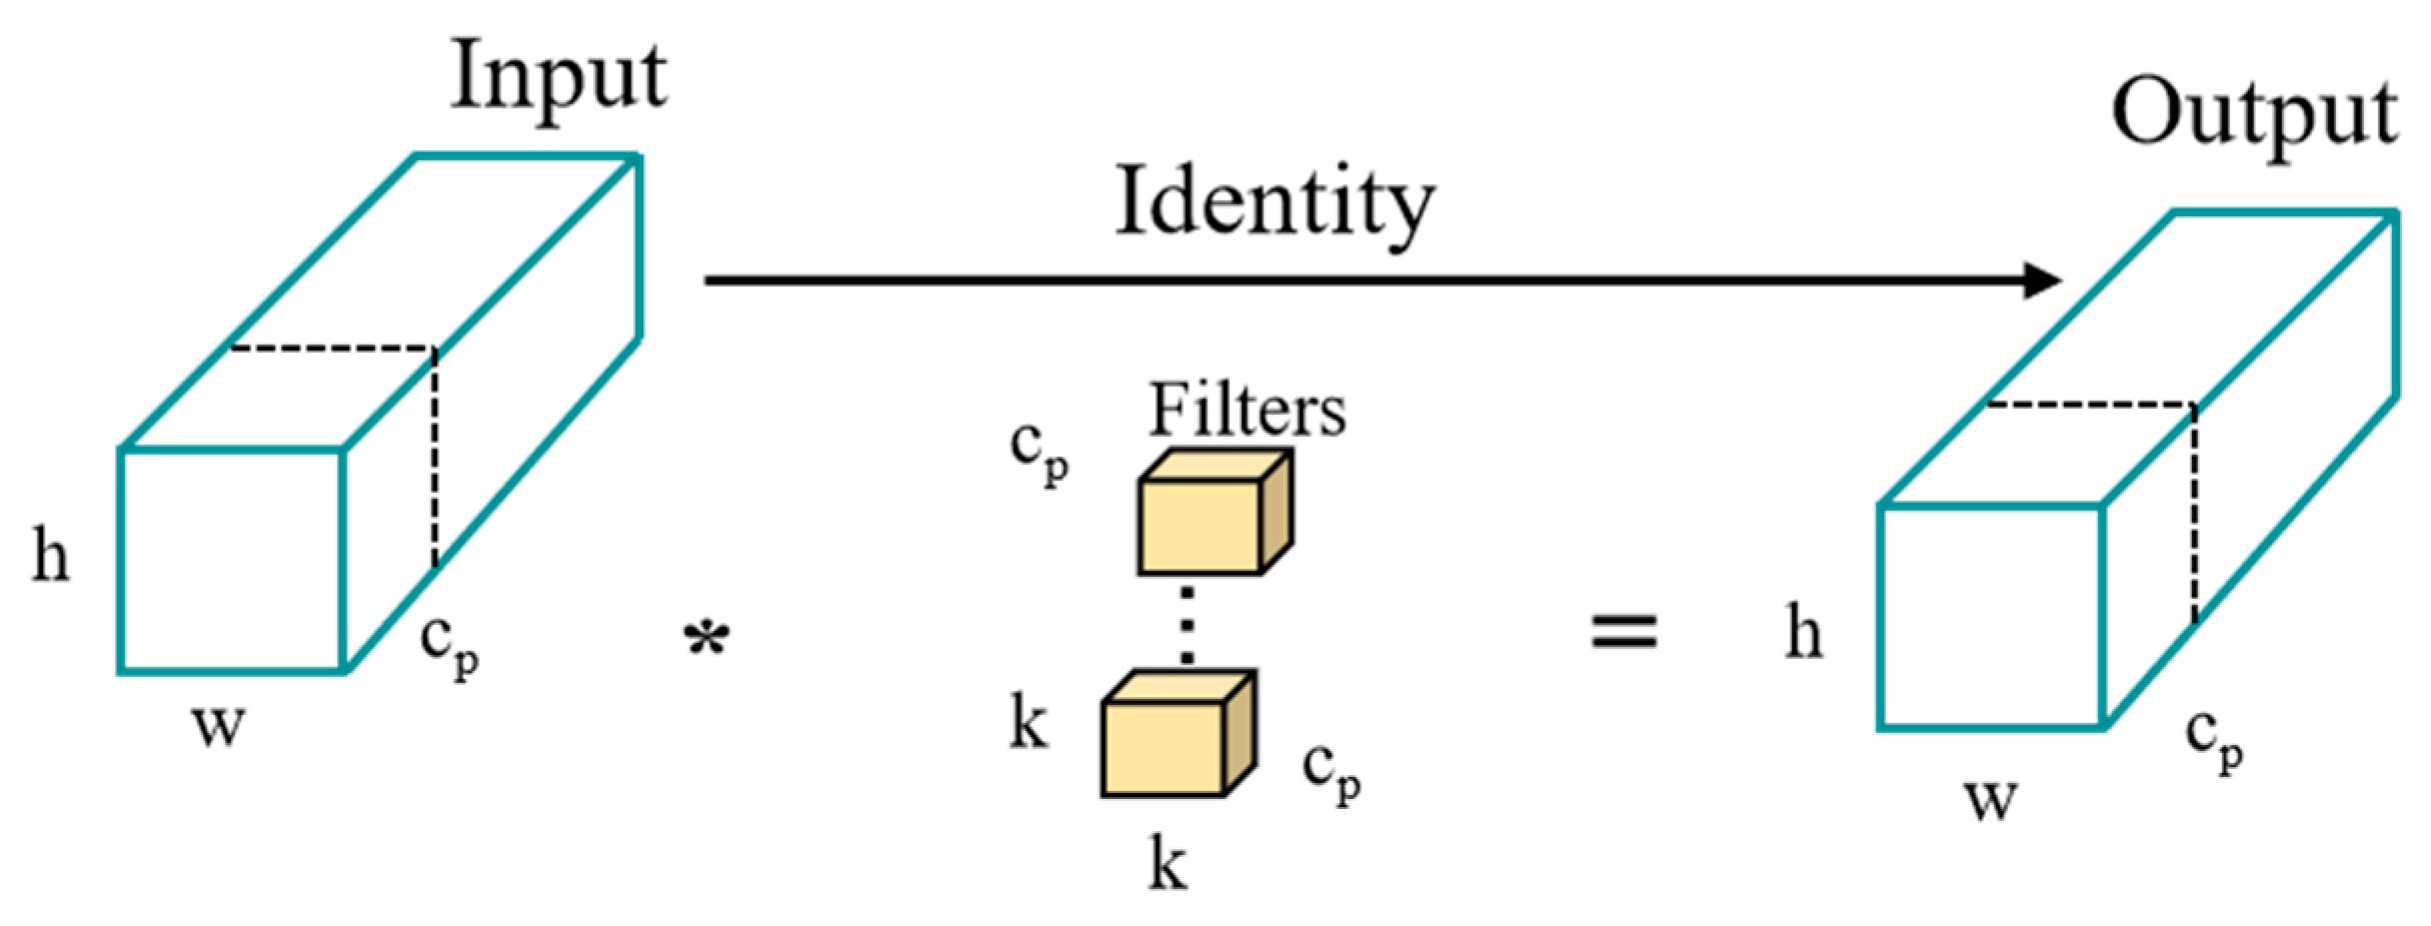
YOLOv8’s C2f module, which incorporates convolution and numerous Bottleneck stacks, surpasses YOLOv5 in its ability to extract information across multiple scales. Nevertheless, this enhanced capability also introduces redundancy in channel information, leading to increased model computation and potentially affecting efficiency. The number of feature mappings per channel increases with the number of network layers. Each channel can contain similar or identical information when dealing with feature maps across multiple channels, leading to potential redundancy. A novel partial convolution (PConv) is suggested by FasterNet [30] as a solution to the issue of redundant network feature data. PConv is shown in Figure 3.
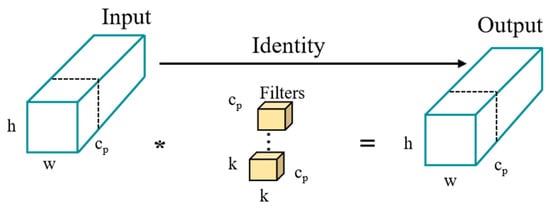
Figure 3.
PConv structure.
To extract the spatial features of the channels while maintaining the integrity of the other channels, PConv only needs to apply convolution operations on a portion of the input feature map’s channels. Assuming that k is the size of the convolution kernel, c indicates the number of input channels, h and w indicate the height and width of the input characteristic map, and cp indicates the channels participating in the convolution.
Assuming that h and w denote the height and width of the input feature map, c denotes the number of input channels, cp denotes the channels involved in the convolution, and k is the size of the convolution kernel. The FLOPs of the PConv module are shown in Formulas (1) and (2) [30].
where r is the convolution rate, and if PConv’s participating convolution rate is 1/4, its FLOPs are just 1/16 of a regular convolution, lowering the detection model’s FLOPs.
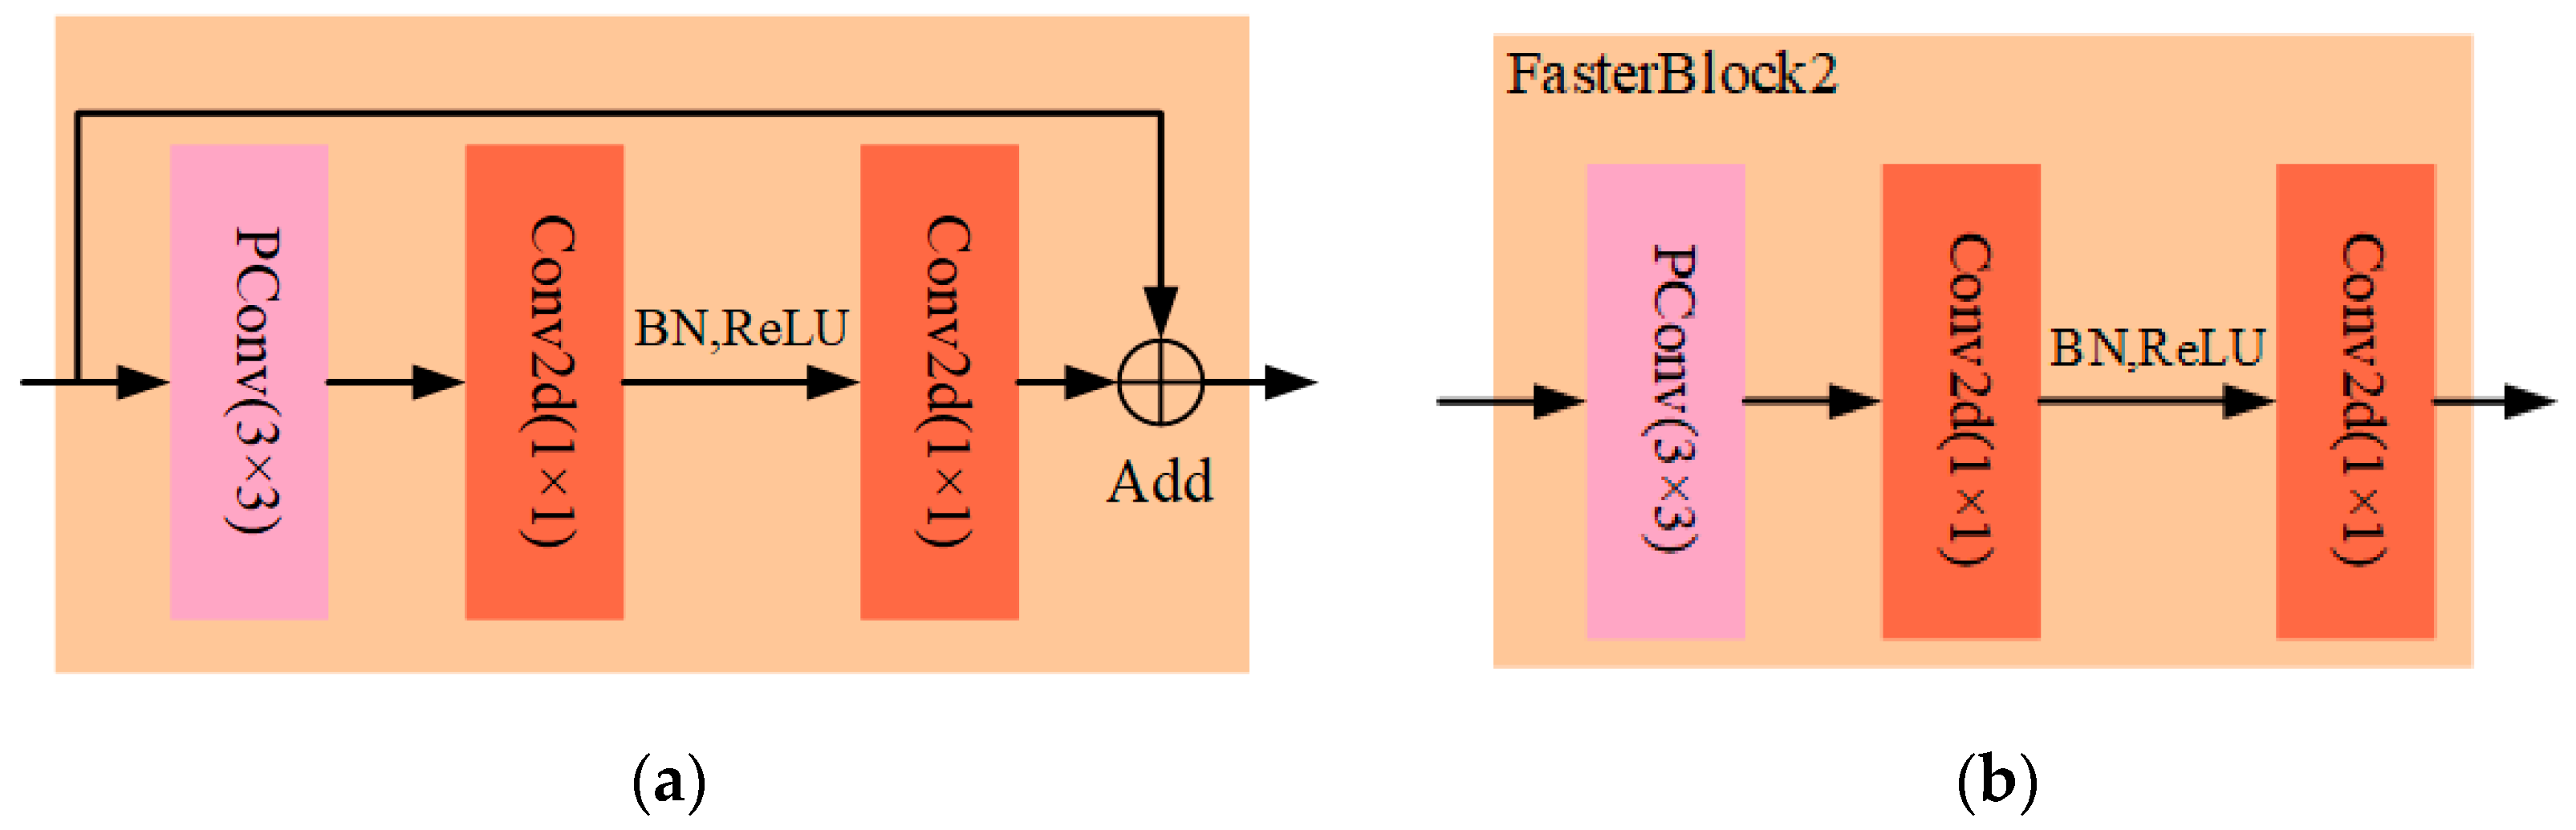
In this study, two FasterBlocks were designed using the PConv structure, as shown in Figure 4. FasterBlock1 was used to replace the Bottleneck in C2f of YOLOv8s’s backbone network and named C2f_P_1, and FasterBlock2 was used to replace the Bottleneck in C2f of YOLOv8s’s neck network and named C2f_P_2. FasterBlock1 had an additional residual structure compared with FasterBlock2, with an additional residual structure. FasterBlock executes a convolution operation on select channels of the input feature maps and then applies a 1 × 1 standard convolution operation. It applies batch normalization (BN) and the ReLU activation function before the final standard convolution to preserve feature diversity and decrease the number of FLOPs. The C2f_P module incorporates two lightweight FasterBlock structures that leverage the partial-processing convolution characteristics of PConv. These optimized structures enable feature extraction without compromising model accuracy or parameters, achieving a lightweight model.
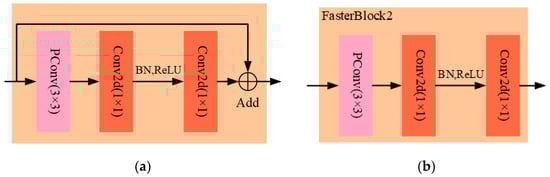
Figure 4.
FasterBlock of the C2f_P module. (a) FasterBlock1; (b) FasterBlock2.
2.3.2. Efficient Multi-Scale Attention Module
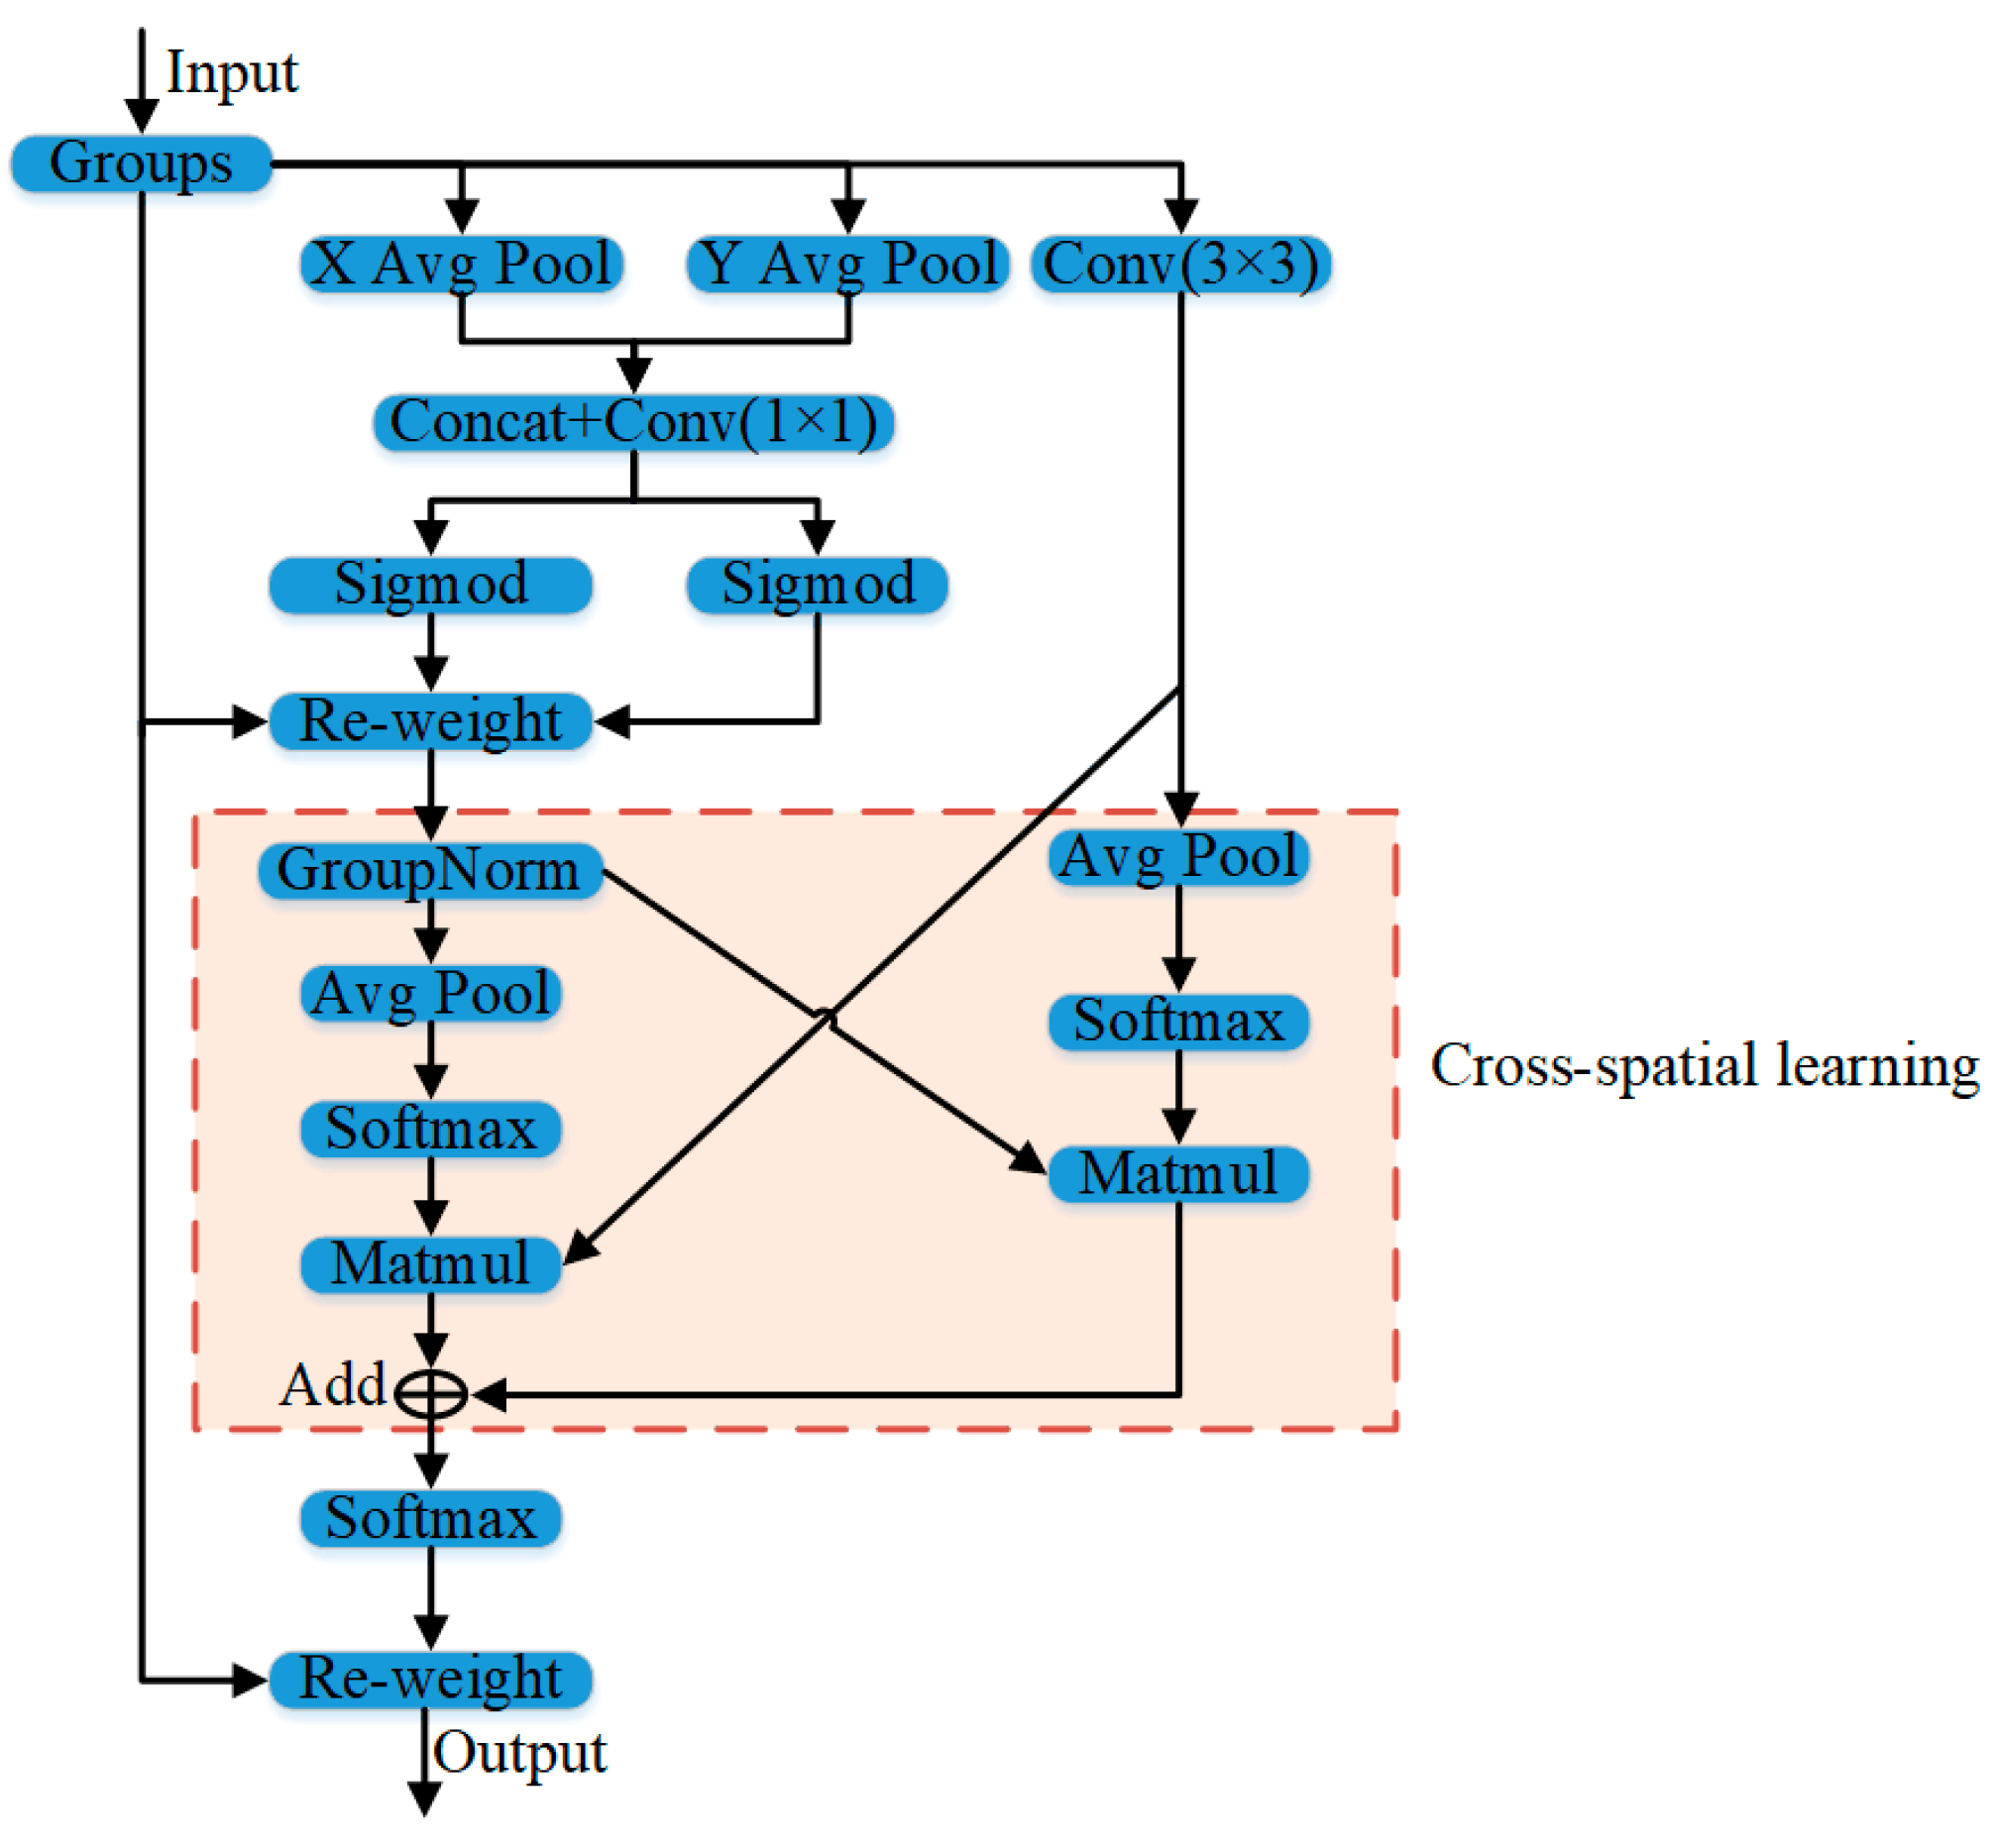
By incorporating the attention mechanism, the neural network can autonomously acquire knowledge and concentrate on significant information in the input, thereby enhancing the model’s performance and generalization. The efficient multi-scale attention (EMA) module is a sophisticated mechanism focusing on details at different scales [31]. In order to reduce the computational load, the EMA module intelligently transforms individual channel information into batch dimensions and splits the channel dimensions into many sub-features while preserving channel-specific information. This methodology guarantees that spatial semantic characteristics are uniformly dispersed within every feature cluster, enhancing efficacy and precision. The structure of EMA is shown in Figure 5.
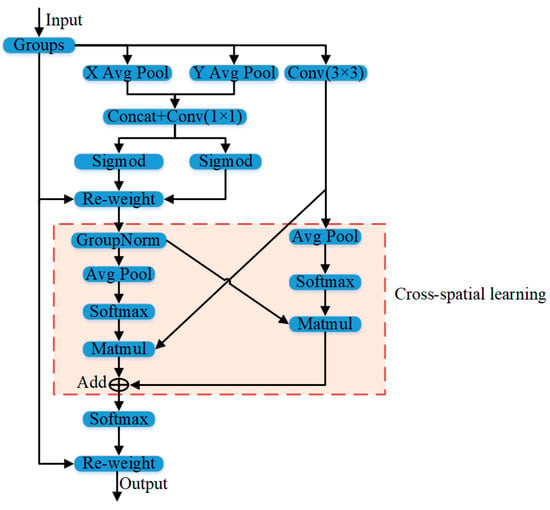
Figure 5.
The EMA module’s structure. The “X Avg Pool” indicates the 1D horizontal global pooling, and the “Y Avg Pool” indicates the 1D vertical global pooling. Conv indicates the convolution operation. Matmul stands for matrix multiplication. GroupNorm represents normalization. Re-weight represents re-weighting. Groups represents grouped convolution. Sigmoid and Softmax are activation functions.
Groups refer to partitioning an input feature map X into multiple sub-feature maps, which allows for the acquisition of semantic feature information at various scales, utilizing inter-channel encoding to modify the significance of numerous channels and retain the accurate spatial structural information inside the channels. The cross-spatial learning section utilizes a strategy for aggregating information across different spatial dimensions to produce a more comprehensive feature aggregation and emphasize the global information of all pixels.
By utilizing the EMA module, the model structure is able to effectively extract feature information by performing input feature maps at many scales. This allows for a more accurate representation of feature information and fully utilizes network channel information. This study incorporated the EMA module within the FasterBlock of the C2f_P_1 module of the YOLO-P model. This integration improves the backbone network by extending its capabilities to provide more valuable multi-scale feature information in a limited capacity. The C2f_P_1-EMA’s structure is shown in Figure 6.
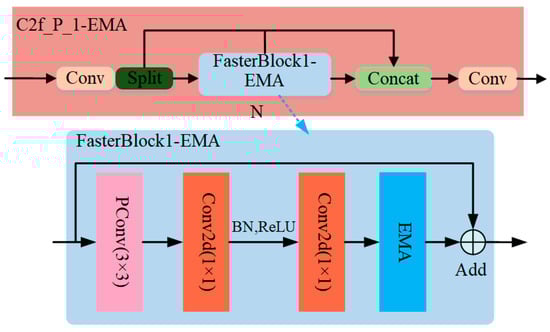
Figure 6.
C2f_P_1-EMA module.
2.3.3. MPDIoU Loss Function
The loss function is an essential component of the detection model, serving a critical role in quantifying the difference between the anticipated and actual bounding boxes. The loss function decreases as the predicted and real frames become closer in distance. The CIoU bounding loss function is utilized in YOLOv8, and the formulas are displayed in (3)–(5) [32]:
where W and H are the width and height of the young fruit prediction boundary box, Wt and Ht are the width and height of the young fruit label boundary box, and Bprd and Bgt are the midpoint of the young fruit prediction boundary box and the label boundary box. The ρ is the Euclidean distance between Bprd and Bgt. The width and height of the smallest outer rectangle of the prediction box and the actual box are denoted as Wc and Hc, respectively. The IoU, or intersection over union, measures their overlap. The CIoU is primarily employed to identify the areas where objects overlap. In this work, the MPDIoU loss function was utilized as a substitute for the CIoU. The MPDIoU is a novel metric for comparing bounding boxes. It calculates the similarity based on the distance between the minimum points of the boxes. This metric considers all the significant aspects included in the current loss functions [33]. The MPDIoU facilitates the comparison of similarity between two detection boxes, regardless of whether they overlap or not, by employing bounding box regression. Hence, the MPDIoU can serve as a substitute approach for calculating the cross-and-merge ratios of all performance indicators in fruit detection.
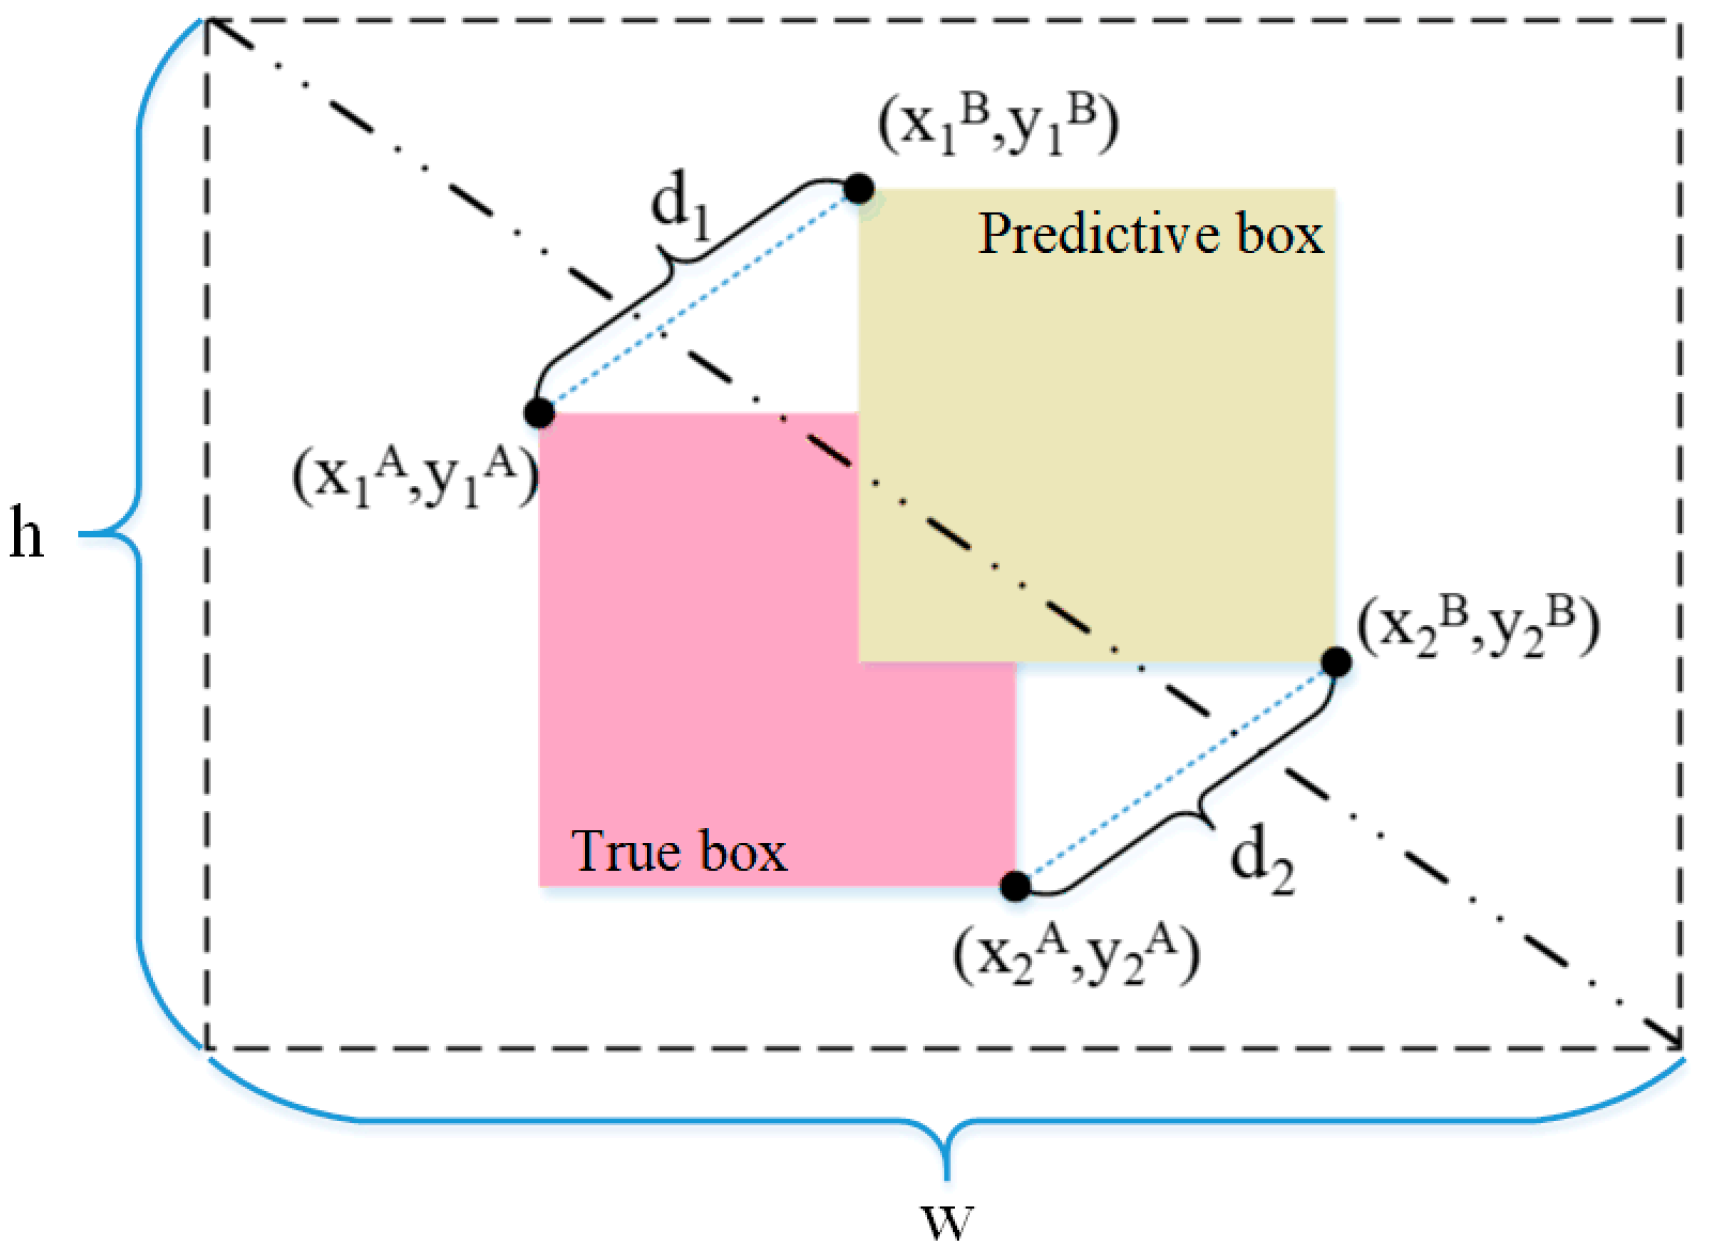
In this research, MPDIoU, a novel boundary box similarity metric grounded on the minimum point distance, was employed as an alternative to the CIoU, comprehensively addressing the boundary box optimization challenge. This advanced metric encapsulates all pertinent factors typically considered within other loss functions, offering a more comprehensive approach to refining object detection boundaries [33]. The MPDIoU simplifies the similarity comparison between two detection boxes, which applies to the overlapping or non-overlapping bounding box regression. Therefore, the MPDIoU can be used as an alternative method for the cross-and-merge ratios of all performance metrics in fruit detection. The computational principle of the MPDIoU is illustrated in Figure 7. It enhances the precision of prediction results and speeds up the convergence of the model’s regression by calculating the minimum point distance between the prediction box and the actual box as a similarity measure. The MPDIoU is calculated as shown in Formulas (6)–(8) [33].
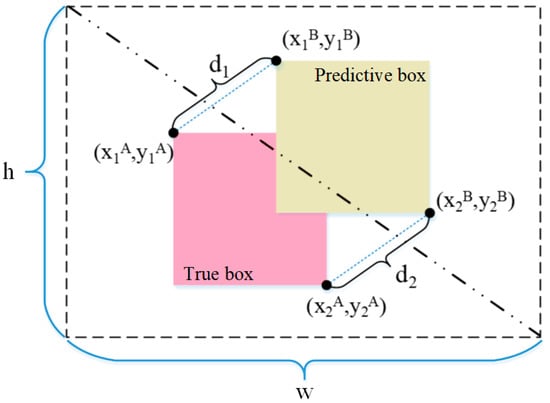
Figure 7.
MPDIoU loss function computation schematic diagram.
The variables d1 and d2 represent the distances between the upper-left and lower-right points of the actual box A and the prediction box B, respectively. w and h are the width and height of the input image, respectively. (x1B, y1B) and (x2B, y2B) are the coordinates of the prediction box’s upper-left and lower-right points, respectively. The formula for when MPDIoU is used as a loss function for the output detection box is shown in (9) [33].
2.4. Experimental Device and Parameters
The computer configuration used was as follows: an AMD Ryzen 7 6800H CPU (3.20 GHz), RAM (16 GB), a solid-state disk (512 GB), an NVIDIA GeForce RTX3070Ti laptop GPU (8GB), and Windows 11. The model training deep learning framework software was Pytorch 1.13.1, CUDA 11.6, and Python 3.8.16. All programming was completed using Pycharm 2022.1.4 (JetBrains, Prague, Czech).
The model training parameters were as follows: an image input size of 640 pixels × 640 pixels, a learning rate of 0.01, a batch size of 8, a weight decay of 0.0005, a momentum of 0.937, 200 iterations, and SGD as the optimizer. All models used the same datasets and training settings.
2.5. Indicators of Model Performance Evaluation
To assess the model’s detection performance accurately, we utilized the precision (P) to determine the accuracy of fruit detection. The recall (R) was used to evaluate the model’s ability to detect all fruits. The F1 score (F1) was calculated as the balanced average of precision and recall, preventing any single value from dominating. Lastly, the average precision (AP) was employed to measure the average precision for a specific category. To ensure the accuracy of “Okubo” peach detection, the IoU threshold for the AP evaluation was set to 0.5. The formulas for the F1 score, AP, precision, and recall are shown in (10)–(13) [13,34].
where TP indicates the number of young “Okubo” peaches in the test image that were correct detections, FP indicates the number of young “Okubo” peaches that were false detections, TN indicates the number of young fruits whose backgrounds were not recognized as young “Okubo” peaches, and FN indicates the number of young “Okubo” peaches that were missed detections. The process of calculating the average precision involved generating the model’s predicted scores, converting them into category labels, and then computing the confusion matrix (TP, FP, TN, and FN) to determine both the precision and recall. Finally, the area under the curve for the precision and recall was calculated as the average precision.
Furthermore, the model’s complexity and detection speed were assessed across five different areas. The computational complexity of the model was evaluated by considering metrics such as the number of floating-point operations per second (FLOPs), the number of parameters, the number of model layers, and the memory occupation of the model. The model’s detection speed was assessed by measuring the number of image detection frames per second (FPS). The formulas are shown in (14)–(16).
K denotes the dimensions of the convolution kernel, Cin indicates the number of input channels, and Cout represents the number of output channels. The variable H × W represents the dimensions of the output feature map.
3. Results and Analysis
3.1. Effects of Different C2f_P Module Positions on Model Performance
To examine the impact of applying the C2f_P module with varying YOLOv8 positions on young “Okubo” peaches, the C2f_P module was substituted with the C2f modules of the YOLOv8 backbone network (denoted as YOLOv8S-B), the C2f module of the neck (denoted as YOLOv8S-N), and the C2f module of all positions (denoted as YOLOv8S-A. The results are displayed in Table 3. As shown in Table 3, adding C2f_P at all three locations improved the AP and F1 score while reducing the number of parameters, FLOPs, and model size compared with YOLOv8s. This implies that the C2f_P module can optimize the model by minimizing unnecessary calculations and memory retrievals. Compared with the YOLOv8s model, YOLOv8s-B enhances the feature extraction ability from the backbone network by 0.68% in terms of the AP and 0.47% in terms of the F1 score. Similarly, YOLOv8s-N enhances the ability of the neck network to combine characteristics, resulting in a 0.91% increase in the average precision (AP) and a 0.12% rise in the F1 score compared with YOLOv8s. Additionally, YOLOv8s-A has a higher AP by 0.12% compared with YOLOv8s-B, while its F1 score is higher than that of YOLOv8s-N by 0.31%, illustrating its advantage in detection accuracy.
Table 3.
The C2f_P module’s model detection effect in different positions.
The model sizes of YOLOv8s-B, YOLOv8s-N, and YOLOv8s-A are 18.8 MB, 18.7 MB, and 16.0 MB, respectively. Among them, YOLOv8s-A exhibits the most lightweight characteristics with the fewest parameters and FLOPs compared with the other two variants. Specifically, in terms of model lightweight, YOLOv8s-A achieves a reduction of 2.82 M in parameters, 7.0 G in FLOPs, and 5.4 MB in model size compared with YOLOv8s.
3.2. The Effect of the Attention Mechanism on the Detection of Young Peaches
In this study, the EMA was embedded inside the FasterBlock of the C2f_P_1 module in the model, which enhanced the backbone network’s ability to extract characteristics. This allowed the impacts of various attention mechanisms to be tested on the detection model’s performance. The model improved by the lightweight C2f_P module is denoted as YOLO-P. To assess the effect of the EMA module on YOLO-P, we examined the effects of BAM, CA, SE, and SimAM on the model’s performance individually. The Bottleneck attention module (BAM) is a channel attention mechanism that adaptively strengthens or weakens the feature responses of different channels [35]. Coordinate attention (CA) integrates channel information and directional position information, which enables the model to accurately detect targets of interest [36]. Squeeze-and-excitation (SE) makes the model pay more attention to the valuable channel information by learning the adaptive channel weights, thus improving the model’s performance ability [37]. SimAM is a non-parametric 3D attention module proposed based on the characteristics of the human brain’s attention mechanism, which improves the computation speed of the attention weights through the resolution calculation of the energy function [38]. The results are shown in Table 4.
Table 4.
Comparison of various attention mechanisms.
Table 4 shows that of the five attention mechanisms introduced, the AP of the model using the EMA module was 90.68%, which was 0.40%, 0.37%, 0.49%, and 0.70% higher than that of BAM, CA, SE, and SimAM, respectively. Compared with YOLO-P, the precision, recall, AP, and F1 score of the model using the EMA module increased by 0.46%, 0.06%, 0.87%, and 0.24%, respectively, and the model size increased by only 0.1 MB. The precision of the model using the EMA module was higher than that of BAM, CA, and SE by 0.83%, 1.41%, and 0.69%, and the recall was higher than that of SimAM by 1.47%. Compared with YOLO-P, the precision of SimAM enhanced by 0.98%, the model size did not grow, but the recall and F1 score of the model decreased by 1.41% and 0.36%, and the detection AP decreased. Hence, in this study, the EMA module was chosen to be integrated into the FasterBlock of the C2f_P module of the YOLO-P lightweight model backbone network. This integration aimed to enhance the extracted feature information of the model backbone network and enhance the accuracy of young fruit detection.
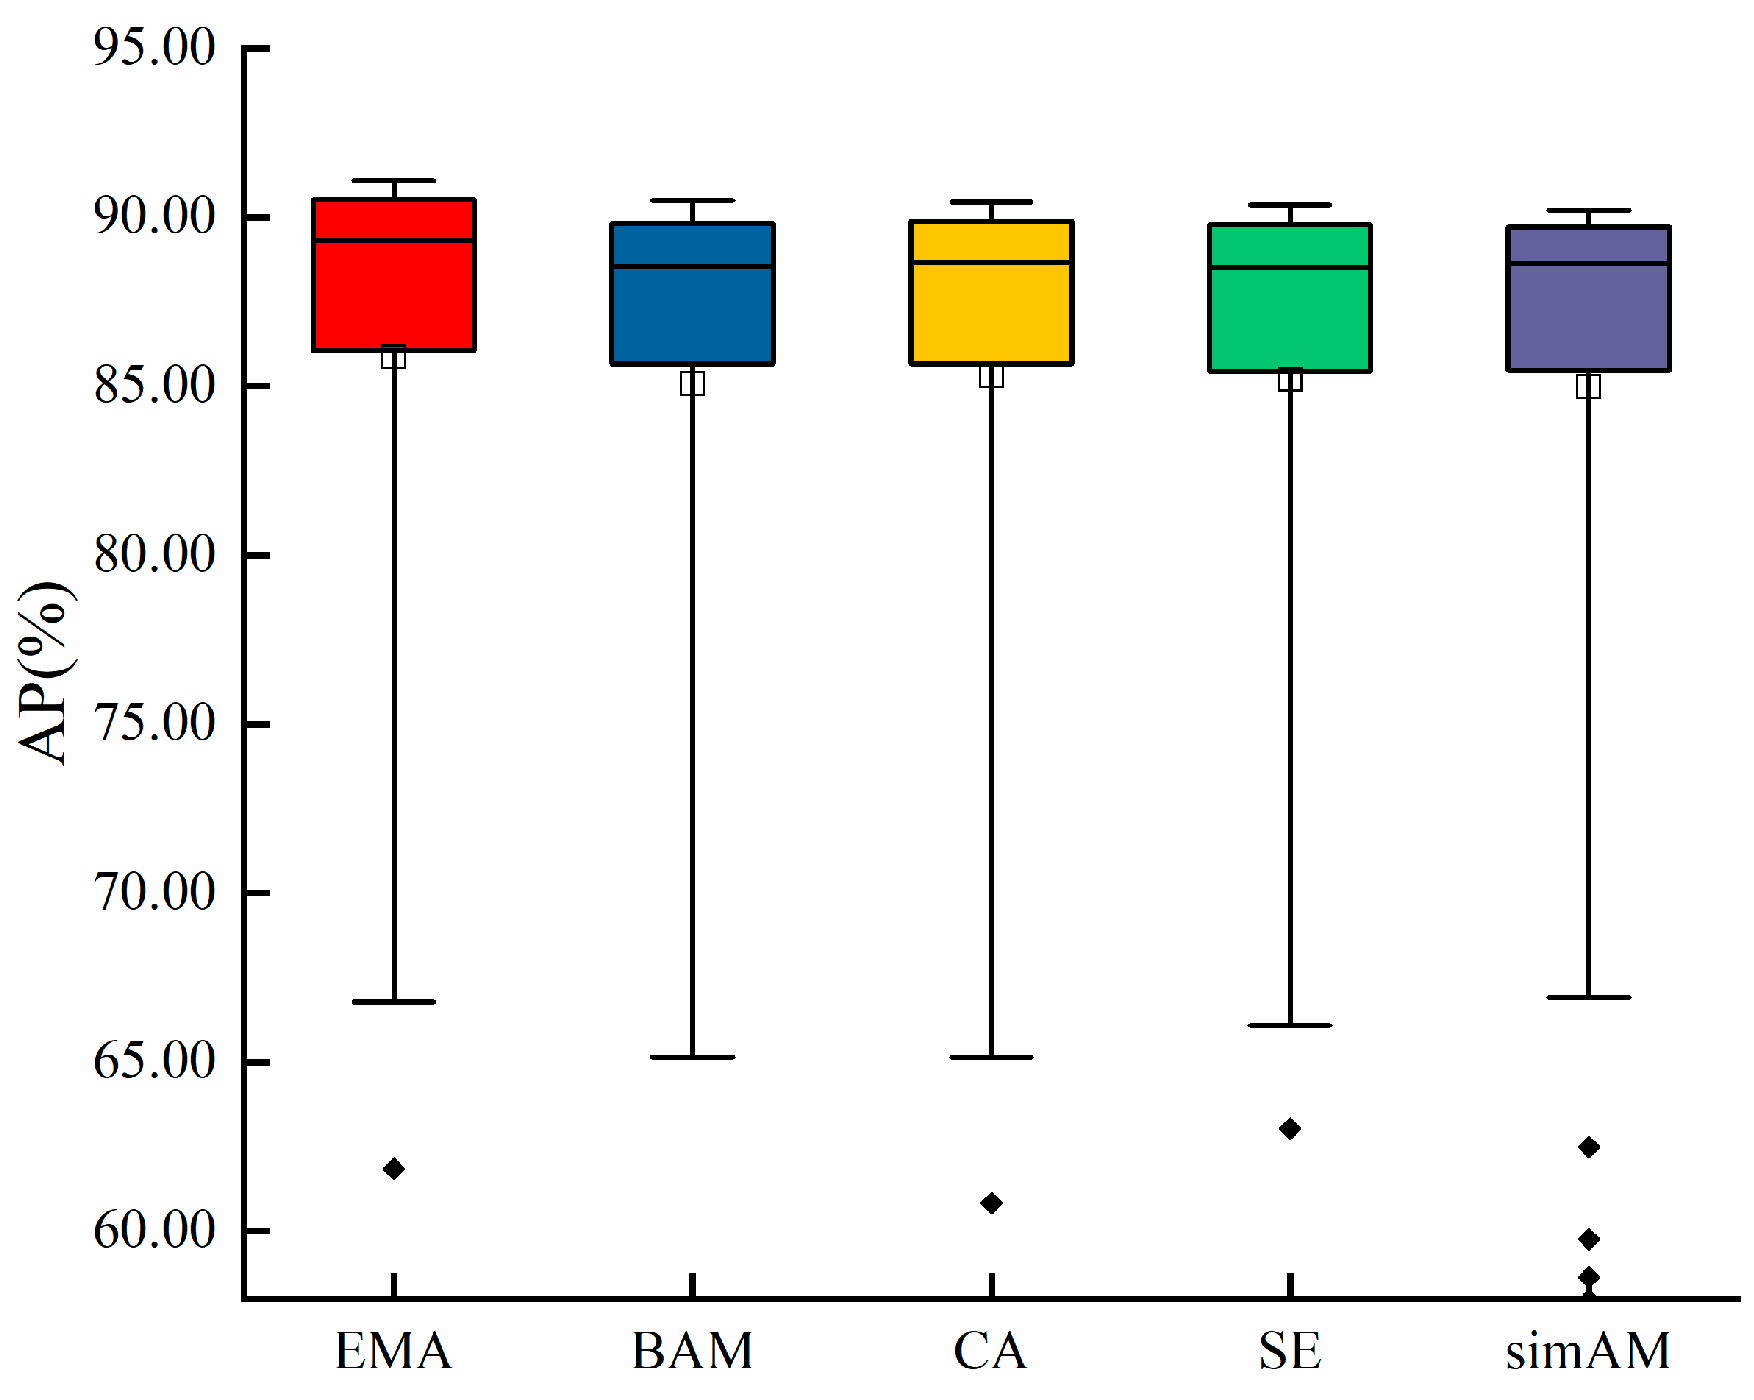
The box plots reflect the discrete and distributed characteristics of a set of data and plot the AP changes of the five attention mechanisms (EMA, BAM, CA, SE, and SimAM) during training, as shown in Figure 8. The EMA has the highest AP during training, and the median and upper quartiles of the AP have higher values than the other four attention mechanisms. The EAM, CA, SE, and SimAM attention mechanisms exhibit outliers, which arise from the model’s failure to converge during the early stage of training, resulting in a low AP. Hence, the EMA module integrated into the C2f_P_1 module of YOLO-P has superior precision in detecting young “Okubo” peaches.
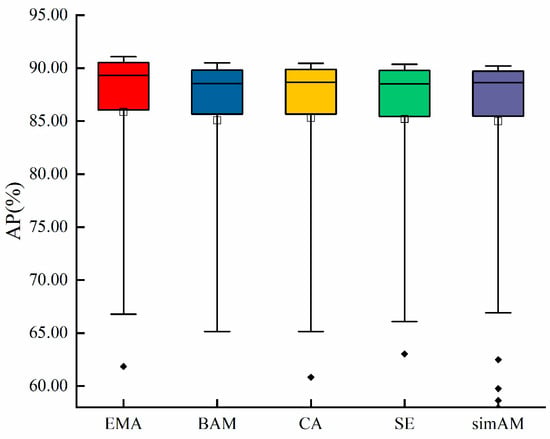
Figure 8.
AP distribution during the training process of five attention mechanisms.
3.3. Performance Comparison of Different Loss Functions
In this study, we substituted the CIoU loss function of YOLOv8s with SIoU [39], EIoU [40], DIoU [32], and MPDIoU to compare their effects on the detection of young “Okubo” peaches. The results of different loss function models are shown in Table 5. The loss value curves that were obtained when using various loss functions for training are displayed in Figure 9. As indicated in Table 5, among the five individual loss function models, the F1 score of the MPDIoU loss function is 86.18%, which is 0.33%, 0.27%, 0.55%, and 0.14% higher than that of CIoU, SIoU, EIoU, and DIoU, respectively. The AP of the MPDIoU loss function is 89.90%, which is 0.89%, 0.82%, 0.55%, and 0.31% higher than that of CIoU, SIoU, EIoU, and DIoU, respectively. The precision of MPDIoU is 0.01%, 0.20%, and 0.30% higher than that of CIoU, SIoU, and DIoU, and 0.24% lower than that of EIoU, but its recall is 1.18% higher. The recall of MPDIoU is 0.59%, 0.33%, and 0.02% higher than that of CIoU, SIoU, and DIoU, respectively.
Table 5.
Test results of different loss function models.
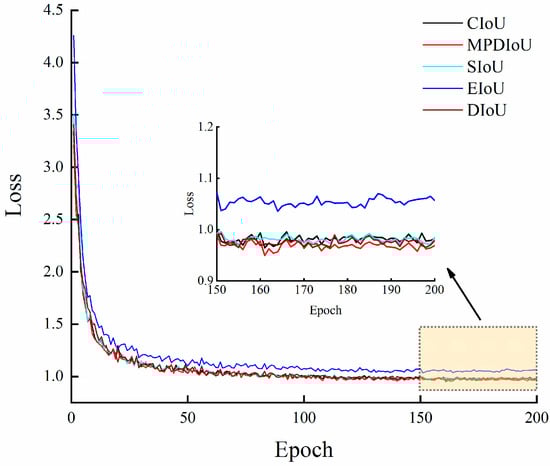
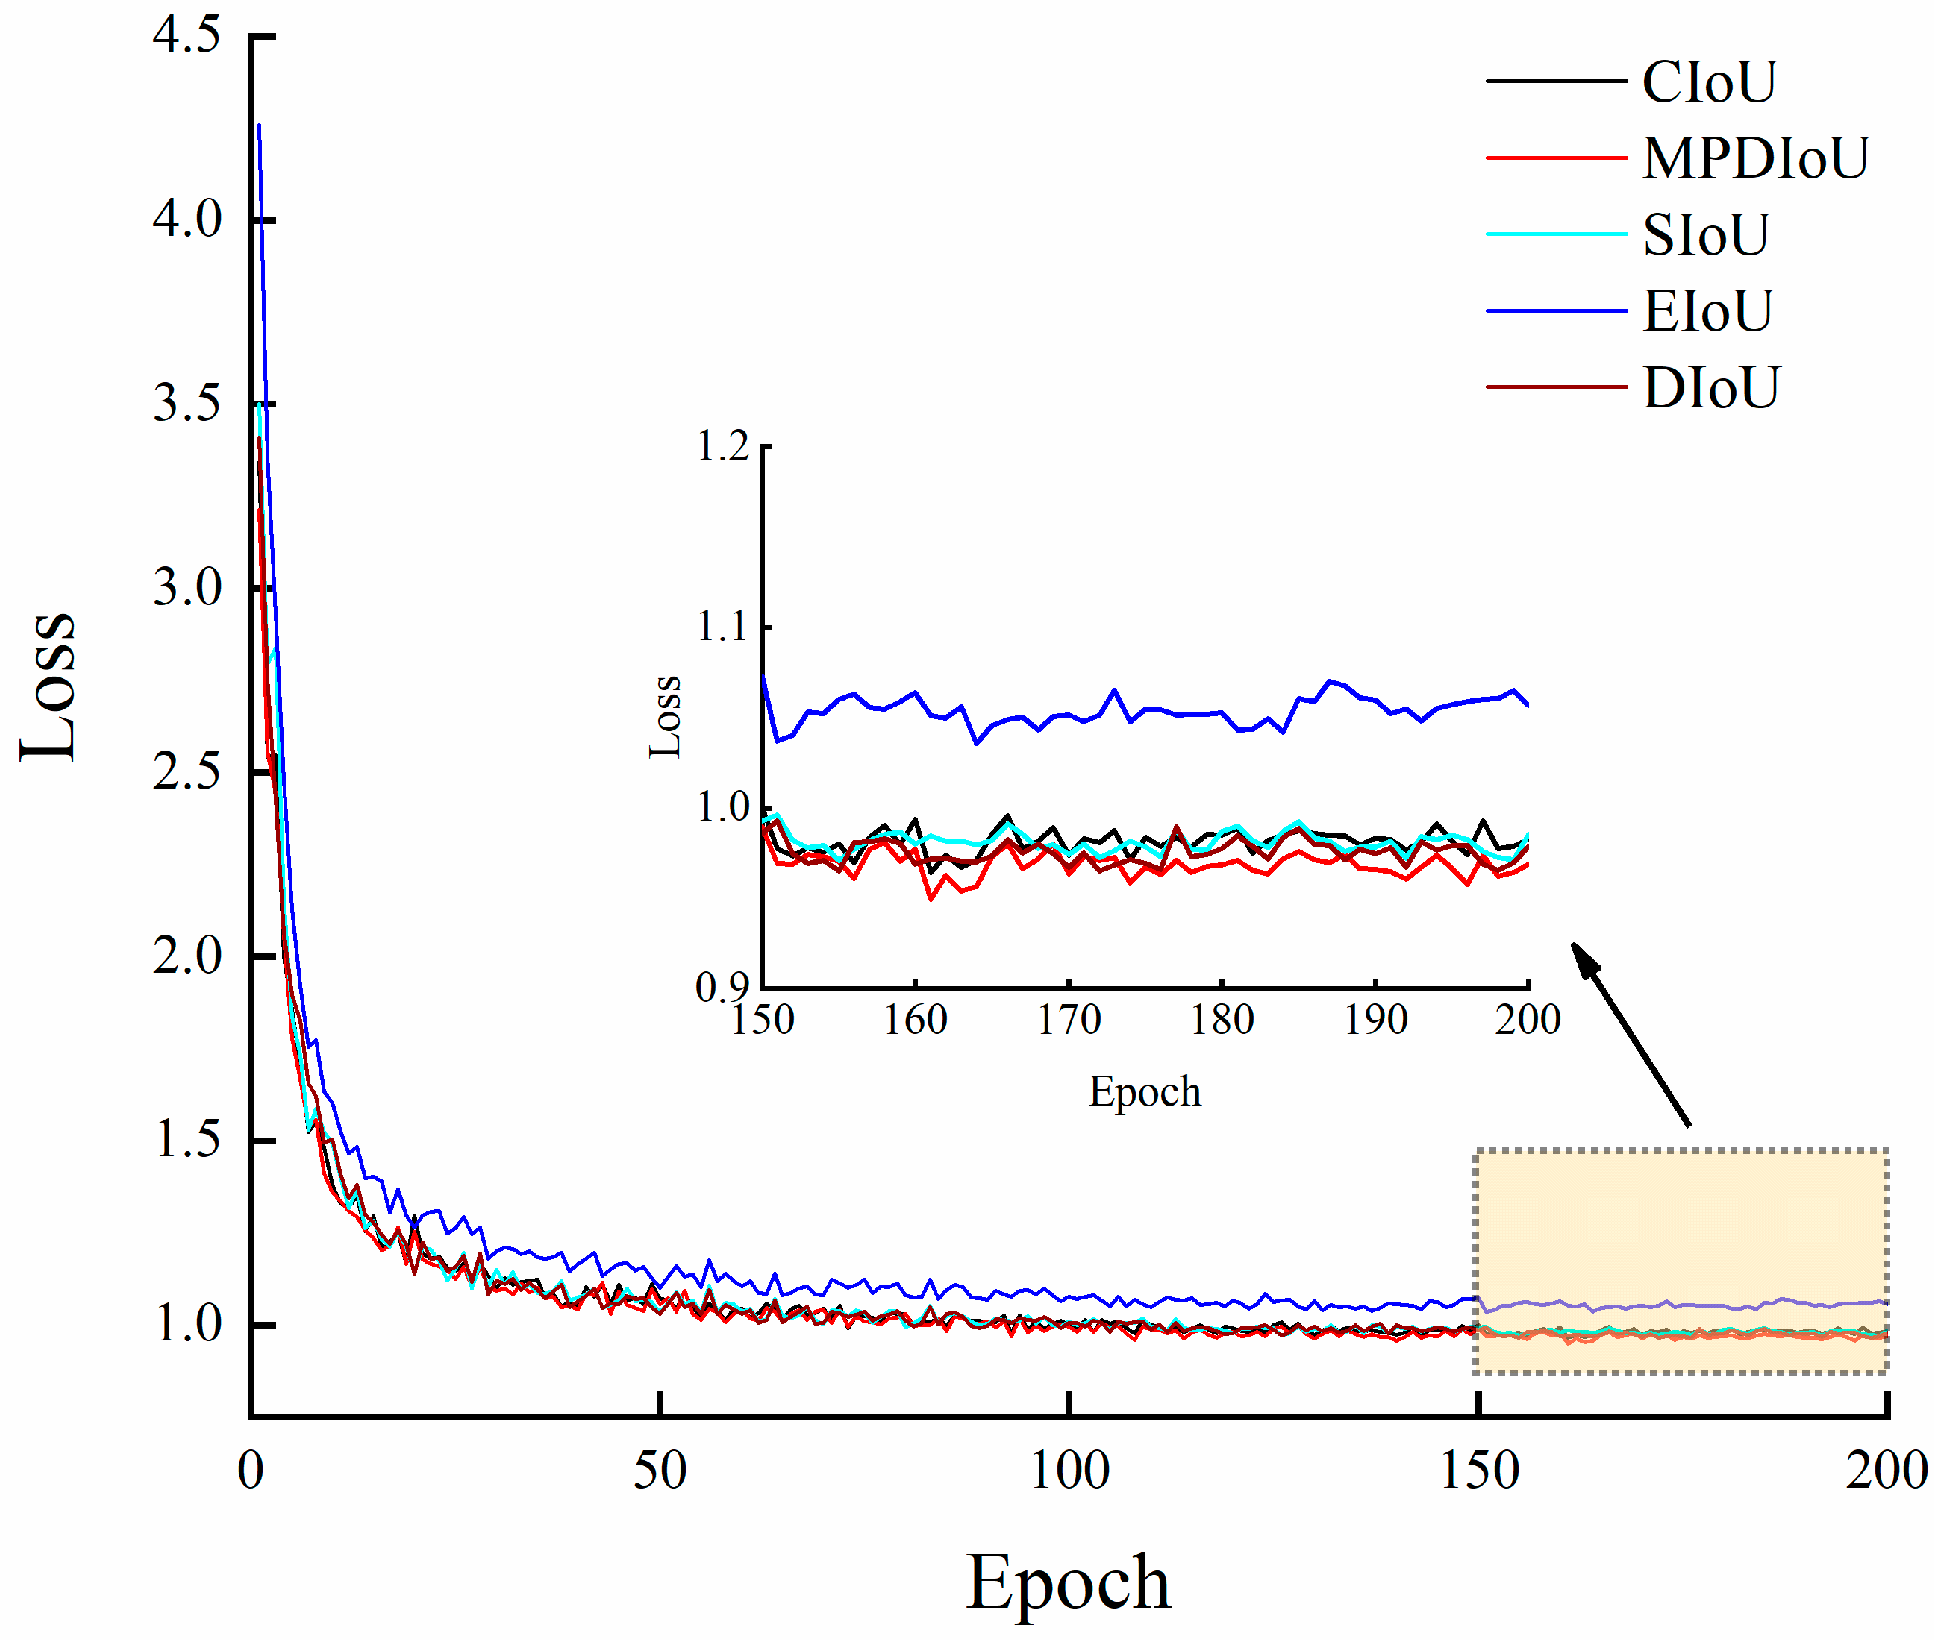
Figure 9.
Diagram of loss value curves during training with various loss functions.
As demonstrated in Figure 9, the loss value tends to change within a specific range after 150 epochs, which indicates that the model converges and there are no over-fitting and under-fitting phenomena. The five types of loss functions, CIoU, SIoU, EIoU, DIoU, and MPDIoU, converge quickly and maintain a lower loss value range change. Still, the MPDIoU loss function has a lower loss value when the model is taught to converge with smaller loss values, and the training effect is improved. In short, the comprehensive advantages of using the MPDIoU loss function for model training are more apparent, and the detection accuracy is the highest.
3.4. Ablation Test
The ablation test was employed to test the effects of the different modules on the model performance by removing some modules and training the model with improved modules under the same parameters. In this study, the addition and combination of different modules were carried out for five sets of tests to confirm the effect of each module. Based on YOLOv8s, the C2f_P module is used for model lightweight; the EMA module improves the backbone network’s capacity to retrieve feature data; and the MPDIoU loss function speeds up model convergence and improves detection accuracy. YOLO-P represents the use of the C2f_P module, YOLO-M stands for the use of the MPDIoU bounding loss function, YOLO-PE represents the use of the C2f_P module and EMA module, YOLO-PM represents the use of C2f_P module and MPDIoU bounding loss function, and YOLO-PEM represents the use of three modules. Table 6 displays the ablation test results.
Table 6.
The results of the ablation test.
As shown in Table 6, the precision of YOLO-PEM is 1.51%, 1.90%, 1.50%, 1.46%, and 2.79% higher than that of YOLOv8s, YOLO-P, YOLO-M, YOLO-PE, and YOLO-PM, respectively. The recall of YOLO-PEM is slightly higher than that of YOLO-P, YOLO-M, YOLO-PE, and YOLO-PM, but YOLO-PEM has significantly higher precision than these models, balancing precision and recall. Compared with YOLOv8s, YOLO-P, YOLO-M, YOLO-PE, and YOLO-PM, the F1 score of the YOLO-PEM model is higher by 0.85%, 0.42%, 0.52%, 0.18%, and 0.70%, and the AP is higher by 1.85%, 1.05%, 0.96%, 1.18%, and 0.73%, respectively.
In terms of lightweight, the model size of YOLO-PEM is decreased by 5.3 MB, the parameters are reduced by 2.81 M, and the counting floating-point number is reduced by 6.6G compared with YOLOv8s. Compared with YOLO-P, YOLO-PEM only raises the model size, FLOPs, and parameters by 0.1 MB, 0.4 G, and 0.01 M, but the AP of the model is raised by 1.05%. Simultaneously, compared with YOLO-PM, the parameters, FLOPs, and size of YOLO-PEM are slightly increased by 0.01 M, 0.4 G, and 0.1 MB, respectively, but the AP of YOLO-PEM is raised by 0.73%. Therefore, YOLO-PEM enhances the detection accuracy for young “Okubo” peaches.
3.5. Detection of Young Peaches by Different Lightweight Detection Models
To confirm the effectiveness of the enhanced model, YOLO-PEM was contrasted and tested against five popular lightweight detection models: YOLOv3-tiny, YOLOv4-tiny [41], YOLOv5s, YOLOv6s [42], and YOLOv7-tiny. The test results of the different models are shown in Table 7.
Table 7.
Test results of young peaches in different detection models.
As shown in Table 7, the AP and F1 score of YOLO-PEM for young peach detection were 90.86% and 86.70%, respectively, with significantly higher accuracy than the other lightweight models. Compared with YOLOv3-tiny, YOLOv4-tiny, YOLOv5s, YOLOv6s, and YOLOv7-tiny, the AP of YOLO-PEM increased by 6.26%, 6.01%, 2.05%, 2.12%, and 1.87%, respectively. In addition, in terms of the F1 score, YOLO-PEM’s was 3.93%, 3.42%, 1.54%, 1.52% and 0.68% higher than that of YOLOv3-tiny, YOLOv4-tiny, YOLOv5s, YOLOv6s, and YOLOv7-tiny, respectively. Secondly, the number of parameters of YOLO-PEM was 0.33 M and 1.31 M lower than that of YOLOv3-tiny and YOLOv6s. Moreover, the YOLO-PEM model achieved a remarkable FPS of 196.2 f·s-1, enabling the efficient real-time detection of fruits during the fruit-thinning stage by the fruit-thinning robot. Notably, while surpassing YOLOv6s in terms of speed and closely approaching YOLOv3-tiny, YOLOv4-tiny, YOLOv5s, and YOLOv7-tiny in performance, the FPS of the YOLO-PEM model was accompanied by a superior detection accuracy compared with the other models investigated herein. These findings highlight that the developed YOLO-PEM model effectively balances both accuracy and speed for detecting young “Okubo” peach fruits. The model’s size is 0.4 MB and 20.5 MB lower than that of YOLOv6s. The size of YOLO-PEM is slimly higher than that of YOLOv5s and YOLOv7-tiny by 2.4 MB and 4.4 MB, respectively, but the AP of the YOLO-PEM model is 2.05% and 1.87% higher than that of the YOLOv5s model, which can better meet the accuracy demand of young peach detection in complex peach orchard environments. The YOLO-PEM has higher detection precision and a lighter model structure than the other detection models in detecting young peaches, which outperforms the accuracy and model size. The YOLO-PEM model can detect young “Okubo” peaches in the complex environment of peach orchards.
3.6. Comparison of YOLO-PEM and YOLOv8s Detection Effects
To confirm the benefits of the YOLO-PEM model in detecting young “Okubo” peaches, several photos of young peaches in the test set were compared with YOLOv8s. Figure 10 displays the results.
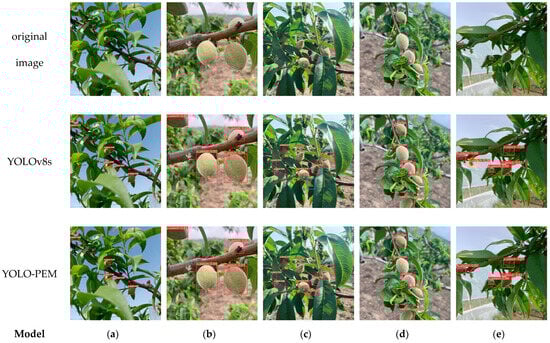
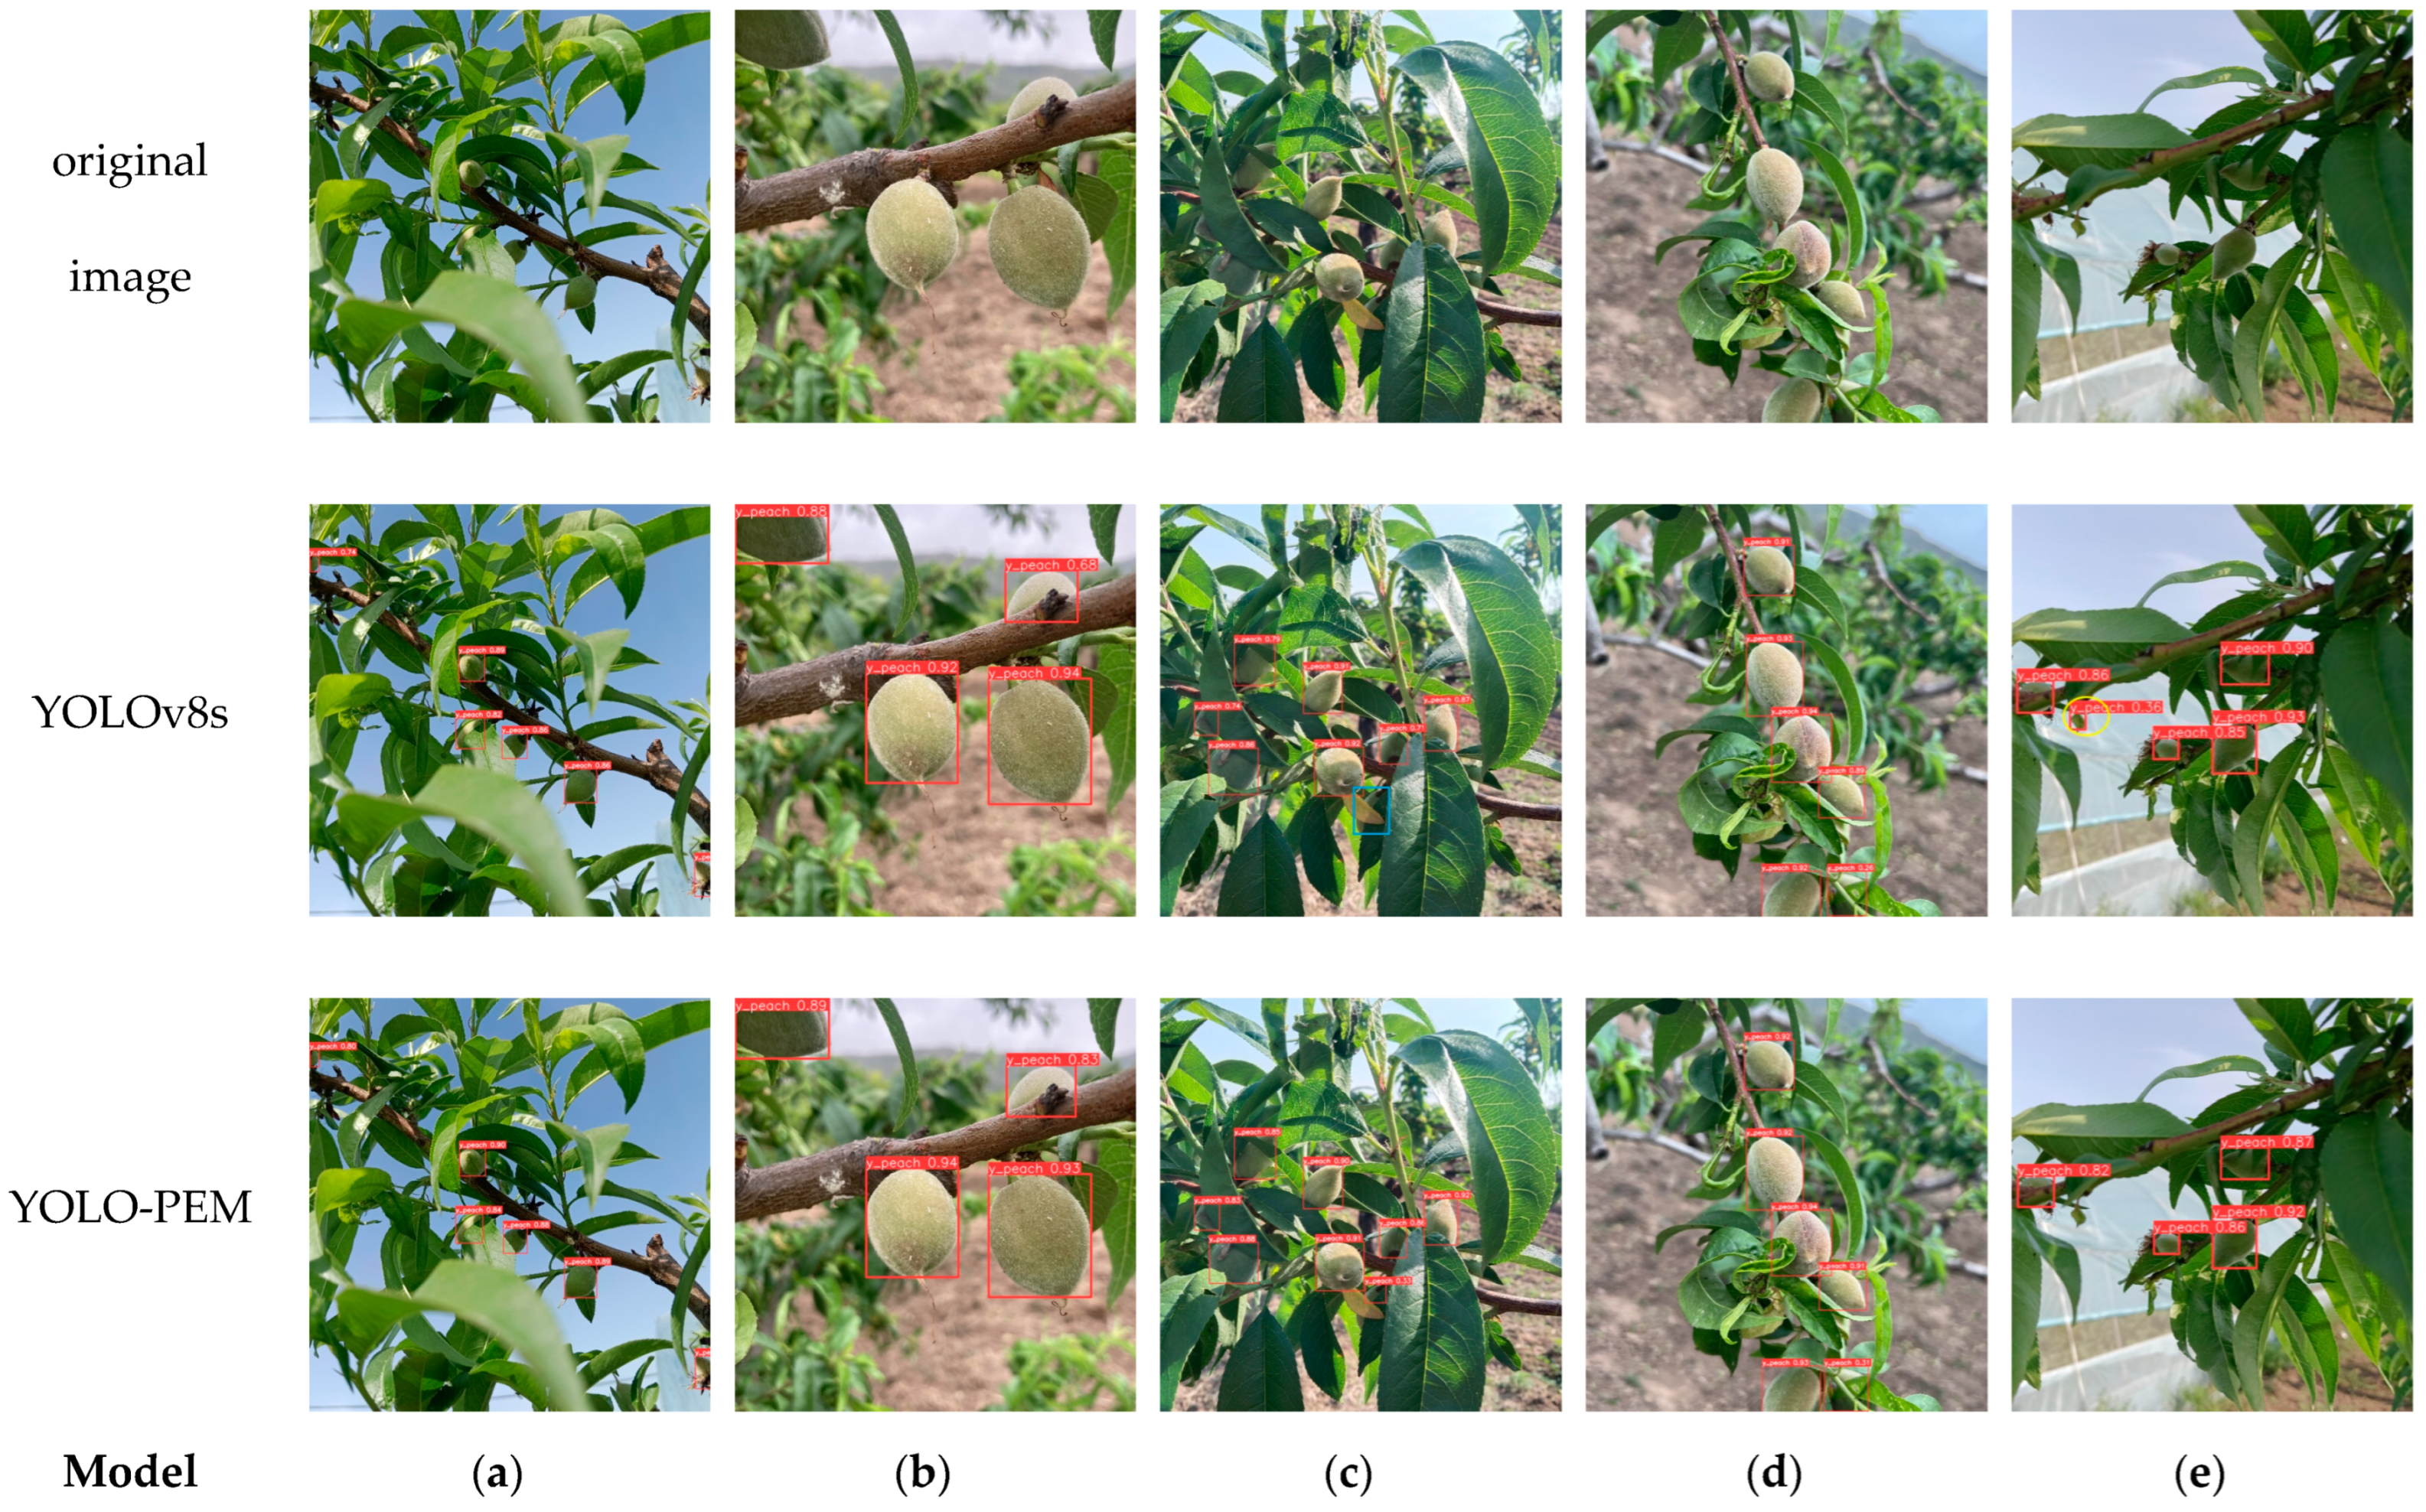
Figure 10.
Detection effect between YOLO-PEM and YOLOv8s. The blue circle is the missed fruit detection, and the yellow circle is the false fruit detection. (a) Sunny; (b) cloudy; (c) occlusion; (d) cluster; (e) backlight.
As displayed in Figure 10, in sunny conditions, the improved YOLO-PEM has a higher precision in detecting young peaches compared with YOLOv8s’s detection effect, and YOLOv8s shows missed detection in severe occlusion. The YOLO-PEM model did not show missed detection in overcast conditions, while YOLOv8s showed missed detection. In the case of shading and string cluster growth, the color of leaves and young peaches were similar, and the YOLO-PEM model had a higher detection accuracy for young peaches than YOLOv8s. In backlight conditions, YOLOv8s had a false detection, identifying leaves as fruits, while the YOLO-PEM model did not have a false detection.
In the actual operating environment, two types of environmental conditions, mainly sunny and cloudy conditions, were used to test the young “Okubo” peaches in both kinds of weather. The YOLO-PEM model was applied to the images of young peaches in the test set in sunny and cloudy conditions, of which 169 images were taken in sunny and 73 images in cloudy conditions. The results of testing different weather conditions are displayed in Table 8.
Table 8.
Comparison of detection effect in two weathers.
As displayed in Table 8, in sunny conditions, the AP and F1 of YOLO-PEM were 1.86% and 0.75% higher than YOLOv8s, respectively. In cloudy conditions, the AP and F1 of the YOLO-PEM model were 1.9% and 1.23% higher for young peaches, respectively, than the YOLOv8s model. In addition, the AP and F1 of young peaches in cloudy conditions were higher than those in sunny conditions, which was due to the fact that in sunny conditions, the collected images had large light variations and uneven light intensity, and the captured images might be overexposed. However, in cloudy conditions, the light variation was slight, the light intensity was uniform, and the pictures were less affected by light.
In order to more intuitively visualize the characteristics of the YOLO-PEM detection of young “Okubo” peaches, this study utilized the GradCAM++ method to generate heat maps and visualize the characteristics of peach fruits, thereby demonstrating the advantage of YOLO-PEM. The brightness of regions in the heat map indicates their impact on the model’s output. The spectrum ranging from blue to red reflects the model’s focus on various locations. Darker shades of red indicate stronger attention, while blue signifies weaker attention. The heat maps of YOLO-PEM and YOLOv8s were compared under various meteorological circumstances, as depicted in Figure 11. The heat map clearly shows that the YOLO-PEM model gives much more attention to the young peach fruits in various weather conditions than YOLOv8s. Additionally, while YOLOv8s only focuses on local fruit features, the YOLO-PEM model can pay greater attention to global fruit features, thereby improving recognition accuracy and offering more advantages.
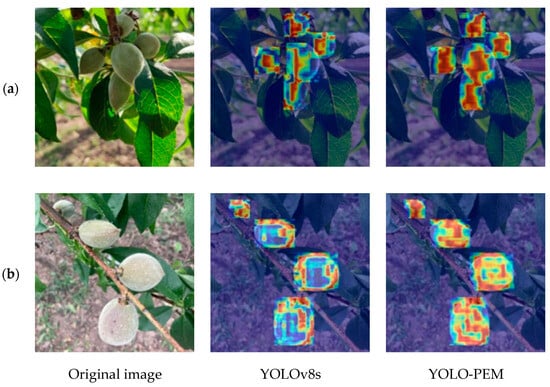
Figure 11.
Heat map visualization. (a) Sunny; (b) cloudy.
4. Discussion
Several researchers have investigated the application of object identification algorithms to identify and detect peaches. Liu et al. [43] introduced an improved iteration of YOLOv7 to accurately detect yellow peaches in the growth phase, resulting in favorable results. Nevertheless, the mAP and F1 scores of the model for yellow peach were 80.4% and 76%, respectively. However, it should be noted that the model has a somewhat big size of 51.9 MB, which suggests that it may not achieve optimal detection accuracy and has excessive dimensions. Assunção et al. [44] employed the MobileDet detection model to identify ripe peaches, achieving only an 88.2% detection accuracy rate. To accurately detect immature small yellow peaches in terms of their quantity and location, Xu et al. [45] introduced an EMA-YOLO model based on YOLOv8. However, EMA-YOLO yielded a modest mAP value of merely 84.1%, thereby exhibiting reduced accuracy alongside increased size dimensions. These limitations impede the effective trade-off between accuracy and size in peach fruit inspection systems, potentially resulting in a sluggish model detection speed as well as imprecise fruit detection during field experiments.
In addition, Mirhaji et al. [46] employed the YOLOv4 algorithm to accurately identify oranges in nocturnal field conditions with varying illumination levels. The model has good detection accuracy for oranges and serves as a valuable reference for nighttime recognition research. Consequently, future investigations can concentrate on capturing images of young “Okubo” peaches during nighttime hours and developing a dedicated detection model specifically tailored for such young fruits. This will establish a visual theoretical foundation for enabling the all-day operation of fruit-picking robots. This study focuses on detecting young “Okubo” peach fruits at the fruit-thinning stage, which provides a reference for intelligent fruit thinning. Li et al. [47] proposed PeachYOLO, a lightweight detection algorithm based on YOLOv8, for the detection of peach fruits in the mature stage. The improved method can offer a reference for subsequent research on the whole-stage peach picking and the identification of the ripening stage of “Okubo” peaches.
This study solely concentrated on identifying spherical fruits such as “Okubo” peaches, while other types of peaches were not considered throughout the detection process. To enhance the comprehensiveness and robustness of the model, forthcoming studies should encompass images of peach fruits exhibiting diverse shapes. Additionally, further research can explore fruit counting methodologies applicable to “Okubo” peaches to facilitate subsequent bagging procedures and yield estimation endeavors. Monitoring and identifying the growth progression of “Okubo” peach fruits can furnish growers with invaluable insights, empowering them to implement rational cultivation practices based on scientific knowledge that augment both yield quantity and quality. Finally, this study tested the fruits and young fruits of “Okubo” peach fruits, and future research can enrich the image dataset and utilize more data feature information. The proposed lightweight model YOLO-PEM is only used for model verification and testing on laptop computers. In future research, the model can be embedded in edge devices for application, for instance, in the vision inspection system and vision-processing chip of a fruit-thinning robot or low-end devices for application.
5. Conclusions
In this study, the YOLO-PEM model was proposed to address the rapid and precise detection of young “Okubo” peaches in complex orchard environments, and an image dataset comprising young peaches was established to train the model. To achieve the model’s lightweight, the C2f_P module was substituted for the C2f of the YOLOv8 neck network and backbone network. The EMA module was embedded into the C2f_P_1 module to enhance the capability of the model to extract features and improve its detection accuracy. CIoU is replaced with the MPDIoU boundary loss function to enhance the accuracy of the bounding box for young peaches and accelerate model convergence. Through an ablation test, the enhanced model’s efficacy was confirmed. The following are this study’s primary conclusions.
To accurately detect young peaches in complex orchard environments, five YOLOv8 version models were compared with a mild difference in the AP. The AP tested by YOLOv8s on the constructed “Okubo” young fruits datasets was 89.01%, and the model size was 21.4 MB, which balanced the accuracy and model size. The influence of various C2f_P module placements on model efficiency and lightweight was studied, and the changes in model parameters, size, FLOPs, and AP were compared. The AP and F1 score of the YOLO-A model with the C2f_P module replacing all C2f modules in YOLOv8 were determined to be 89.81% and 86.28%, respectively. Compared with YOLOv8s, YOLO-A exhibited a reduction of 25.34% in parameters, 25.23% in model size, and 24.65% in FLOPs.
It was discussed how various attention mechanisms affected the model’s performance. EMA was chosen to embed into the C2f_P_1 module, the AP was raised by 0.87%, and the model size was increased by 0.1 MB. A comparison was made between the effects of different bounding loss functions on the detection effect. The model with the highest AP and F1 score, increasing by 0.89% and 0.33%, respectively, was the one that used the MPDIoU loss function.
Compared with YOLOv8s, the average precision of YOLO-PEM was enhanced by 1.85%, the F1 score increased by 0.85%, and the model size decreased by 5.3 MB, thus verifying the effectiveness of the proposed method. To test the advantages of the YOLO-PEM model versus other lightweight models in detecting young peaches, the results show that compared with YOLOv3-tiny, YOLOv4-tiny, YOLOv5s, YOLOv6s, and YOLOv7-tiny, the AP of YOLO-PEM was improved by 6.26%, 6.01%, 2.05%, 2.12%, and 1.87%, respectively. The FPS was 196.2f ·s-1, which could meet the detection requirements in a complex orchard environment.
This present study introduces a novel application scenario of a deep learning object detection model for precisely detecting young “Okubo” peaches in a complex peach orchard environment. In a complex orchard environment, YOLO-PEM’s small size, quick detection speed, and high precision in detecting “Okubo” young fruits can offer technical support for the design of an “Okubo” peach fruit-thinning robot vision system and serve as a foundation for scientific orchard management.
Author Contributions
Conceptualization, J.J., S.Z., and H.S.; methodology, J.J., S.Z., H.S., and R.R.; software, J.J., R.R., and T.C.; writing—original draft preparation, J.J. and R.R.; writing—review and editing, J.J., R.R., H.S., and T.C. All authors have read and agreed to the published version of the manuscript.
Funding
This research was supported by The Key Research and Development Program of Shanxi Province (project no.: 201903D221027) and the Science and Technology Innovation Fund Project of Shanxi Agricultural University (project no.: 2020BQ02).
Data Availability Statement
The data are available upon request from the corresponding authors.
Conflicts of Interest
The authors do not have any conflict of interests in our manuscript.
References
- Barreto, C.F.; Farias, R.d.M.; Zandoná, R.R.; Martins, C.R.; Malgarim, M.B. Influence of the Period of Peach Tree Chemical Thinning on Fruit Quality. J. Agric. Sci. 2019, 11, 141. [Google Scholar] [CrossRef]
- Costa, G.; Botton, A. Thinning in peach: Past, present and future of an indispensable practice. Sci. Hortic.-Amst. 2022, 296, 110895. [Google Scholar] [CrossRef]
- Njoroge, S.M.C.; Reighard, G.L. Thinning time during stage I and fruit spacing influences fruit size of ‘Contender’ peach. Sci. Hortic.-Amst. 2008, 115, 352–359. [Google Scholar] [CrossRef]
- Costa, G.; Botton, A.; Vizzotto, G.J.H.R. Fruit thinning: Advances and trends. Hortic. Rev. 2018, 46, 185–226. [Google Scholar] [CrossRef]
- Schupp, J.R.; Baugher, T.A.; Miller, S.S.; Harsh, R.M.; Lesser, K.M. Mechanical Thinning of Peach and Apple Trees Reduces Labor Input and Increases Fruit Size. HortTechnology 2008, 18, 660–670. [Google Scholar] [CrossRef]
- Hosainpour, A.; Kheiralipour, K.; Nadimi, M.; Paliwal, J.J.H. Quality assessment of dried white mulberry (Morus alba L.) using machine vision. Horticulturae 2022, 8, 1011. [Google Scholar] [CrossRef]
- Azadnia, R.; Kheiralipour, K.J.E.I. Evaluation of hawthorns maturity level by developing an automated machine learning-based algorithm. Ecol. Inform. 2022, 71, 101804. [Google Scholar] [CrossRef]
- Girshick, R.; Donahue, J.; Darrell, T.; Malik, J. Rich feature hierarchies for accurate object detection and semantic segmentation. In Proceedings of the 2014 IEEE Conference on Computer Vision and Pattern Recognition, Columbus, OH, USA, 23–28 June 2014; pp. 580–587. [Google Scholar] [CrossRef]
- Girshick, R. Fast r-cnn. In Proceedings of the IEEE International Conference on Computer Vision, Santiago, Chile, 7–13 December 2015; pp. 1440–1448. [Google Scholar] [CrossRef]
- Ren, S.; He, K.; Girshick, R.; Sun, J. Faster R-CNN: Towards Real-Time Object Detection with Region Proposal Networks. IEEE Trans. Pattern Anal. Mach. Intell. 2017, 39, 1137–1149. [Google Scholar] [CrossRef]
- He, K.; Gkioxari, G.; Dollár, P.; Girshick, R. Mask r-cnn. In Proceedings of the IEEE International Conference on Computer Vision, Honolulu, HI, USA, 21–26 July 2017; pp. 2961–2969. [Google Scholar] [CrossRef]
- Liu, W.; Anguelov, D.; Erhan, D.; Szegedy, C.; Reed, S.; Fu, C.-Y.; Berg, A.C. SSD: Single Shot MultiBox Detector. In Proceedings of the Computer Vision–ECCV 2016: 14th European Conference, Amsterdam, The Netherlands, 11–14 October 2016; pp. 21–37. [Google Scholar] [CrossRef]
- Redmon, J.; Farhadi, A. Yolov3: An incremental improvement. arXiv 2018, arXiv:1804.02767. [Google Scholar] [CrossRef]
- Jia, W.K.; Liu, M.Y.; Luo, R.; Wang, C.J.; Pan, N.N.; Yang, X.B.; Ge, X.T. YOLOF-Snake: An Efficient Segmentation Model for Green Object Fruit. Front. Plant Sci. 2022, 13, 765523. [Google Scholar] [CrossRef]
- Chen, S.; Xiong, J.; Jiao, J.; Xie, Z.; Huo, Z.; Hu, W. Citrus fruits maturity detection in natural environments based on convolutional neural networks and visual saliency map. Precis. Agric. 2022, 23, 1515–1531. [Google Scholar] [CrossRef]
- An, Q.L.; Wang, K.; Li, Z.Y.; Song, C.Y.; Tang, X.Y.; Song, J. Real-Time Monitoring Method of Strawberry Fruit Growth State Based on YOLO Improved Model. IEEE Access 2022, 10, 124363–124372. [Google Scholar] [CrossRef]
- Wang, C.Y.; Wang, C.F.; Wang, L.L.; Wang, J.; Liao, J.P.; Li, Y.H.; Lan, Y.B. A Lightweight Cherry Tomato Maturity Real-Time Detection Algorithm Based on Improved YOLOV5n. Agronomy 2023, 13, 2106. [Google Scholar] [CrossRef]
- Sun, H.; Wang, B.Q.; Xue, J.L. YOLO-P: An efficient method for pear fast detection in complex orchard picking environment. Front. Plant Sci. 2023, 13, 1089454. [Google Scholar] [CrossRef] [PubMed]
- Zeng, T.H.; Li, S.Y.; Song, Q.M.; Zhong, F.L.; Wei, X. Lightweight tomato real-time detection method based on improved YOLO and mobile deployment. Comput. Electron. Agric. 2023, 205, 107625. [Google Scholar] [CrossRef]
- Nan, Y.L.; Zhang, H.C.; Zeng, Y.; Zheng, J.Q.; Ge, Y.F. Intelligent detection of Multi-Class pitaya fruits in target picking row based on WGB-YOLO network. Comput. Electron. Agric. 2023, 208, 107780. [Google Scholar] [CrossRef]
- Xu, L.; Wang, Y.; Shi, X.; Tang, Z.; Chen, X.; Wang, Y.; Zou, Z.; Huang, P.; Liu, B.; Yang, N.; et al. Real-time and accurate detection of citrus in complex scenes based on HPL-YOLOv4. Comput. Electron. Agric. 2023, 205, 107590. [Google Scholar] [CrossRef]
- Jiang, M.; Song, L.; Wang, Y.; Li, Z.; Song, H. Fusion of the YOLOv4 network model and visual attention mechanism to detect low-quality young apples in a complex environment. Precis. Agric. 2022, 23, 559–577. [Google Scholar] [CrossRef]
- Lu, Y.Q.; Du, S.; Ji, Z.; Yin, X.; Jia, W.K. ODL Net: Object detection and location network for small pears around the thinning period. Comput. Electron. Agric. 2023, 212, 108115. [Google Scholar] [CrossRef]
- Wang, D.D.; He, D.J. Channel pruned YOLO V5s-based deep learning approach for rapid and accurate apple fruitlet detection before fruit thinning. Biosyst. Eng. 2021, 210, 271–281. [Google Scholar] [CrossRef]
- Hussain, M.; He, L.; Schupp, J.; Lyons, D.; Heinemann, P. Green fruit segmentation and orientation estimation for robotic green fruit thinning of apples. Comput. Electron. Agric. 2023, 207, 107734. [Google Scholar] [CrossRef]
- Wang, C.-Y.; Bochkovskiy, A.; Liao, H.-Y.M. YOLOv7: Trainable bag-of-freebies sets new state-of-the-art for real-time object detectors. In Proceedings of the 2023 IEEE/CVF Conference on Computer Vision and Pattern Recognition (CVPR), Vancouver, BC, Canada, 17–24 June 2023; pp. 7464–7475. [Google Scholar] [CrossRef]
- Lin, T.-Y.; Dollár, P.; Girshick, R.; He, K.; Hariharan, B.; Belongie, S. Feature pyramid networks for object detection. In Proceedings of the 2017 IEEE Conference on Computer Vision and Pattern Recognition (CVPR), Honolulu, HI, USA, 21–26 July 2017; pp. 2117–2125. [Google Scholar] [CrossRef]
- Liu, S.; Qi, L.; Qin, H.; Shi, J.; Jia, J. Path aggregation network for instance segmentation. In Proceedings of the IEEE Conference on Computer Vision and Pattern Recognition, Salt Lake City, UT, USA, 18–22 June 2018; pp. 8759–8768. [Google Scholar] [CrossRef]
- Ge, Z.; Liu, S.; Wang, F.; Li, Z.; Sun, J. Yolox: Exceeding yolo series in 2021. arXiv 2021, arXiv:2107.08430. [Google Scholar] [CrossRef]
- Chen, J.; Kao, S.-H.; He, H.; Zhuo, W.; Wen, S.; Lee, C.-H.; Chan, S.-H.G. Run, Don’t walk: Chasing higher FLOPS for faster neural networks. In Proceedings of the 2023 IEEE/CVF Conference on Computer Vision and Pattern Recognition (CVPR), Vancouver, BC, Canada, 17–24 June 2023; pp. 12021–12031. [Google Scholar] [CrossRef]
- Ouyang, D.; He, S.; Zhang, G.; Luo, M.; Guo, H.; Zhan, J.; Huang, Z. Efficient multi-scale attention module with cross-spatial learning. In Proceedings of the ICASSP 2023–2023 IEEE International Conference on Acoustics, Speech and Signal Processing (ICASSP), Rhodes Island, Greece, 4–10 June 2023; pp. 1–5. [Google Scholar] [CrossRef]
- Zheng, Z.; Wang, P.; Liu, W.; Li, J.; Ye, R.; Ren, D. Distance-IoU loss: Faster and better learning for bounding box regression. In Proceedings of the AAAI Conference on Artificial Intelligence, Philadelphia, PA, USA, 7–12 February 2020; Association for the Advancement of Artificial Intelligence (AAAI): New York, NY, USA, 2020; Volume 34, pp. 12993–13000. [Google Scholar] [CrossRef]
- Ma, S.; Xu, Y. Mpdiou: A loss for efficient and accurate bounding box regression. arXiv 2023, arXiv:2307.07662. [Google Scholar] [CrossRef]
- Lin, T.-Y.; Goyal, P.; Girshick, R.; He, K.; Dollár, P. Focal loss for dense object detection. In Proceedings of the IEEE International Conference on Computer Vision, Honolulu, HI, USA, 21–26 July 2017; pp. 2980–2988. [Google Scholar] [CrossRef]
- Park, J.; Woo, S.; Lee, J.-Y.; Kweon, I.S. Bam: Bottleneck attention module. arXiv 2018, arXiv:1807.06514. [Google Scholar] [CrossRef]
- Hou, Q.; Zhou, D.; Feng, J. Coordinate attention for efficient mobile network design. In Proceedings of the 2021 IEEE/CVF Conference on Computer Vision and Pattern Recognition (CVPR), Nashville, TN, USA, 20–25 June 2021; pp. 13713–13722. [Google Scholar] [CrossRef]
- Hu, J.; Shen, L.; Sun, G. Squeeze-and-excitation networks. In Proceedings of the IEEE Conference on Computer Vision and Pattern Recognition, Salt Lake City, UT, USA, 18–22 June 2018. [Google Scholar] [CrossRef]
- Yang, L.; Zhang, R.-Y.; Li, L.; Xie, X. SimAM: A Simple, Parameter-Free Attention Module for Convolutional Neural Networks. In Proceedings of the 38th International Conference on Machine Learning, Virtual, 18–24 July 2021; Volume 139, pp. 11863–11874. [Google Scholar]
- Gevorgyan, Z. SIoU loss: More powerful learning for bounding box regression. arXiv 2022, arXiv:2205.12740. [Google Scholar] [CrossRef]
- Zhang, Y.F.; Ren, W.Q.; Zhang, Z.; Jia, Z.; Wang, L.; Tan, T.N. Focal and efficient IOU loss for accurate bounding box regression. Neurocomputing 2022, 506, 146–157. [Google Scholar] [CrossRef]
- Bochkovskiy, A.; Wang, C.-Y.; Liao, H.-Y.M. Yolov4: Optimal speed and accuracy of object detection. arXiv 2020, arXiv:2004.10934. [Google Scholar] [CrossRef]
- Li, C.; Li, L.; Jiang, H.; Weng, K.; Geng, Y.; Li, L.; Ke, Z.; Li, Q.; Cheng, M.; Nie, W. YOLOv6: A single-stage object detection framework for industrial applications. arXiv 2022, arXiv:2209.02976. [Google Scholar] [CrossRef]
- Liu, P.; Yin, H. YOLOv7-Peach: An Algorithm for Immature Small Yellow Peaches Detection in Complex Natural Environments. Sensors 2023, 23, 5096. [Google Scholar] [CrossRef]
- Assunção, E.; Gaspar, P.D.; Alibabaei, K.; Simões, M.P.; Proença, H.; Soares, V.N.G.J.; Caldeira, J.M.L.P. Real-Time Image Detection for Edge Devices: A Peach Fruit Detection Application. Future Internet 2022, 14, 323. [Google Scholar] [CrossRef]
- Xu, D.; Xiong, H.; Liao, Y.; Wang, H.; Yuan, Z.; Yin, H. EMA-YOLO: A Novel Target-Detection Algorithm for Immature Yellow Peach Based on YOLOv8. Sensors 2024, 24, 3783. [Google Scholar] [CrossRef] [PubMed]
- Mirhaji, H.; Soleymani, M.; Asakereh, A.; Mehdizadeh, S.A.J.C. Fruit detection and load estimation of an orange orchard using the YOLO models through simple approaches in different imaging and illumination conditions. Comput. Electron. Agric. 2021, 191, 106533. [Google Scholar] [CrossRef]
- Li, T.; Chen, Q.; Zhang, X.; Ding, S.; Wang, X.; Mu, J. PeachYOLO: A Lightweight Algorithm for Peach Detection in Complex Orchard Environments. IEEE Access 2024, 12, 96220–96230. [Google Scholar] [CrossRef]


Disclaimer/Publisher’s Note: The statements, opinions and data contained in all publications are solely those of the individual author(s) and contributor(s) and not of MDPI and/or the editor(s). MDPI and/or the editor(s) disclaim responsibility for any injury to people or property resulting from any ideas, methods, instructions or products referred to in the content. |
© 2024 by the authors. Licensee MDPI, Basel, Switzerland. This article is an open access article distributed under the terms and conditions of the Creative Commons Attribution (CC BY) license (https://creativecommons.org/licenses/by/4.0/).