Article

Effect of Water Tank Size and Supply on Greenhouse-Grown Kidney Beans Irrigated by Rainwater in Cold and Arid Regions of North China

1
College of Agronomy, Hebei Agricultural University, Baoding 071000, China
2
College of Information Science and Engineering, Hebei North University, Zhangjiakou 075132, China
*
Authors to whom correspondence should be addressed.
These authors contributed equally to this work.
Agronomy 2024, 14(8), 1767; https://doi.org/10.3390/agronomy14081767
Submission received: 14 May 2024 / Revised: 31 July 2024 / Accepted: 7 August 2024 / Published: 12 August 2024
(This article belongs to the Section Farming Sustainability)

Abstract

:
In response to water scarcity in the Bashang area of northwest Hebei Province, a cold and arid region in north China, and to address the diminishing groundwater levels caused by pumping irrigation, this study investigated the impact of rainwater tank size and water supply on kidney beans production in greenhouses under various precipitation scenarios to determine the production potential and development strategies for regional precipitation resources. Under the background of average annual precipitation, kidney bean yield increased with increasing reservoir volume and shorter irrigation cycles. Under a 4-day irrigation cycle, the water demand satisfaction rate of kidney beans reached 100% water demand when the rainwater tank size was 15.7 m3. Against the wide variation in multi-year regional precipitation from 1992 to 2023, the annual effect of rainwater harvest was simulated using precipitation data collected 20 years with an 80% precipitation guarantee rate. The average minimum yield reduction rate obtained was 9.4%, and the corresponding minimum rainwater tank size was 29.5 m3. By superimposing the rainwater harvested in the shed and nonshed areas, the volume of the reservoir without yield reduction could be reduced to 20.0 m3. The sum of discharged and inventory water was much greater than the water scarcity in each water supply situation. Simulating and analyzing the effect of the relationship between rainwater tank size and water supply on rainwater harvesting in regional farmland by year provides important data affecting the construction of regional rainwater storage facilities and water supply efficiency. To achieve a high, stable yield of kidney beans grown in a greenhouse with shed film and shed area rainwater harvesting in north China, 2.6 m3 supplementary groundwater irrigation is still needed during the annual growing season.

1. Introduction

Water is the fundamental source of life and an indispensable natural resource for agricultural production [1]. As a major agricultural country, 61.2–63.6% of China’s water resources are used for farmland irrigation annually [2]. By 2030, the projected total water consumption in China will increase to approximately 600 billion m3. Although the proportion of water usage for agricultural irrigation will decrease to some extent, it will remain the predominant usage [3]. According to a water footprint analysis, the agricultural water stress index (the ratio of the total crop water footprint to agricultural water resource availability during a given period) has increased from 0.32 in 2000 to 0.49 [4]. Therefore, the comprehensive expansion of water resources and advancement of water-saving technology are critical research directions for the sustainable development of society.
The Bashang area in northwest Hebei Province is a major vegetable production base in China encompassing an annual planting area of over 40,000 hm2, which constitutes 6.6% of the total vegetable area in Hebei Province [5]. Regional vegetable production plays a pivotal role in rural revitalization and significantly promotes agricultural development in the cold and arid regions of north China. However, the Bashang region faces water scarcity issues, with an average annual precipitation of 382.5 mm and a coefficient of variation for precipitation of 28.0% during the growing season. Wide variations in rainfall result in an unpredictable water supply [6]. Annual groundwater extraction in the region amounts to approximately 220 million m3, with overextraction totaling approximately 50 million m3. More than 85.0% of the extracted water is used for vegetable irrigation. Large-scale overexploitation in the cold and arid regions of north China has caused various adverse economic and environmental impacts, including diminishing groundwater levels, land subsidence, and reduced river flow. In turn, these changes have created an increasingly serious conflict between water scarcity and environmental degradation [7]. Therefore, the innovation of “open source and throttling” based on rainwater resources and efficient utilization of rainwater storage systems has become a crucial factor for agricultural development in these regions.
The practice of rainwater harvesting (Rainwater Harvesting, RWH) [8,9,10,11] is an efficient and sustainable approach to managing agricultural water resources. RWH alleviates the pressure on water resources and reduces the need for the extensive construction of water source facilities. It also contributes to erosion control and management of peak flood discharge [12]. Agricultural RWH for irrigation [13] effectively mitigates the impact of drought on crop production and reduces groundwater overexploitation, thus playing a crucial role in agricultural development in semi-arid regions [14]. In recent years, the rapid changes in the global climate, which mainly manifest as increased temperatures, altered rainfall patterns, and an increased frequency of extreme weather events, have resulted in very uneven rainfall patterns. The spatiotemporal relationship between characteristics of crop irrigation demand and variations in annual precipitation must be analyzed. Rainwater harvesting and utilization systems [15], which are widely used domestically and internationally [16], typically employ continuous simulation methods to simulate the size of the rainwater collecting tank and the effect of varying water supply, while considering the stochastic nature of rainfall and equilibrium dynamics within storage units. Petit-Boix et al. [17] assessed the efficiency of water storage tanks based on volume reliability and water-saving efficacy. A reservoir volume is considered optimal when an increase in tank size has less than 1% impact on water supply reliability (total volume of rainwater supplied/total volume of daily water demand). Wu et al. [18] found that the interception, water supply satisfaction rate, and water demand satisfaction rate increase with reservoir volume for different precipitation patterns (wet, normal, and low). At this point, all rainfall can be effectively harvested without waste, and a further increase in rainwater tank size will have no effect. The rainwater tank design should encompass a comprehensive analysis of stormwater management benefits [19], water supply capacity, and reliability [20] of the rainwater harvesting and utilization system. Rashid et al. [21] conducted a life cycle assessment to determine the reliability of components of various rainwater harvesting systems, including water tanks, roof sizes, water pumps, and different annual rainfall patterns. They found that 70% of the life cycle impact occurred during the operation of RWH systems using pumps. Pumping operations produce 6.5 times more CO2 equivalent than water pipe systems. The most environmentally feasible solutions identified were RWH systems with tank capacities of 2 and 3 m3 without pumps, as well as RWH systems with a 2 m3 rainwater tank under a 150 m2; roof with a pump. Furthermore, excessive or insufficient irrigation frequency and quota can affect water use efficiency and crop yield composition [22,23]. Wan et al. [24] reported that a 3-day irrigation cycle implemented throughout the entire growth stage of radishes enhanced root development, reduced cracking rates and evapotranspiration, and promoted nutritional growth, thereby improving radish quality. Many studies have investigated RWH agricultural utilization systems, most of which were aimed at reservoir volume design [25,26] or optimization of irrigation methods [27,28]. Nevertheless, research on optimization theory and the design of the RWH system, as well as supply and farmland water-saving irrigation, is relatively insufficient. This study analyzed the water supply and demand relationship in the cold and arid regions of north China based on the atmospheric precipitation conditions in Bashang, analyzed the rainwater tank size of the RWH system, and simulated the production effects of different rainwater storage methods according to the water-saving irrigation mode of greenhouse kidney beans. Ultimately, this study sought to provide references for the utilization of blue hydrating resources of green water and water-saving irrigation systems [29] on farmland.

2. Materials and Methods

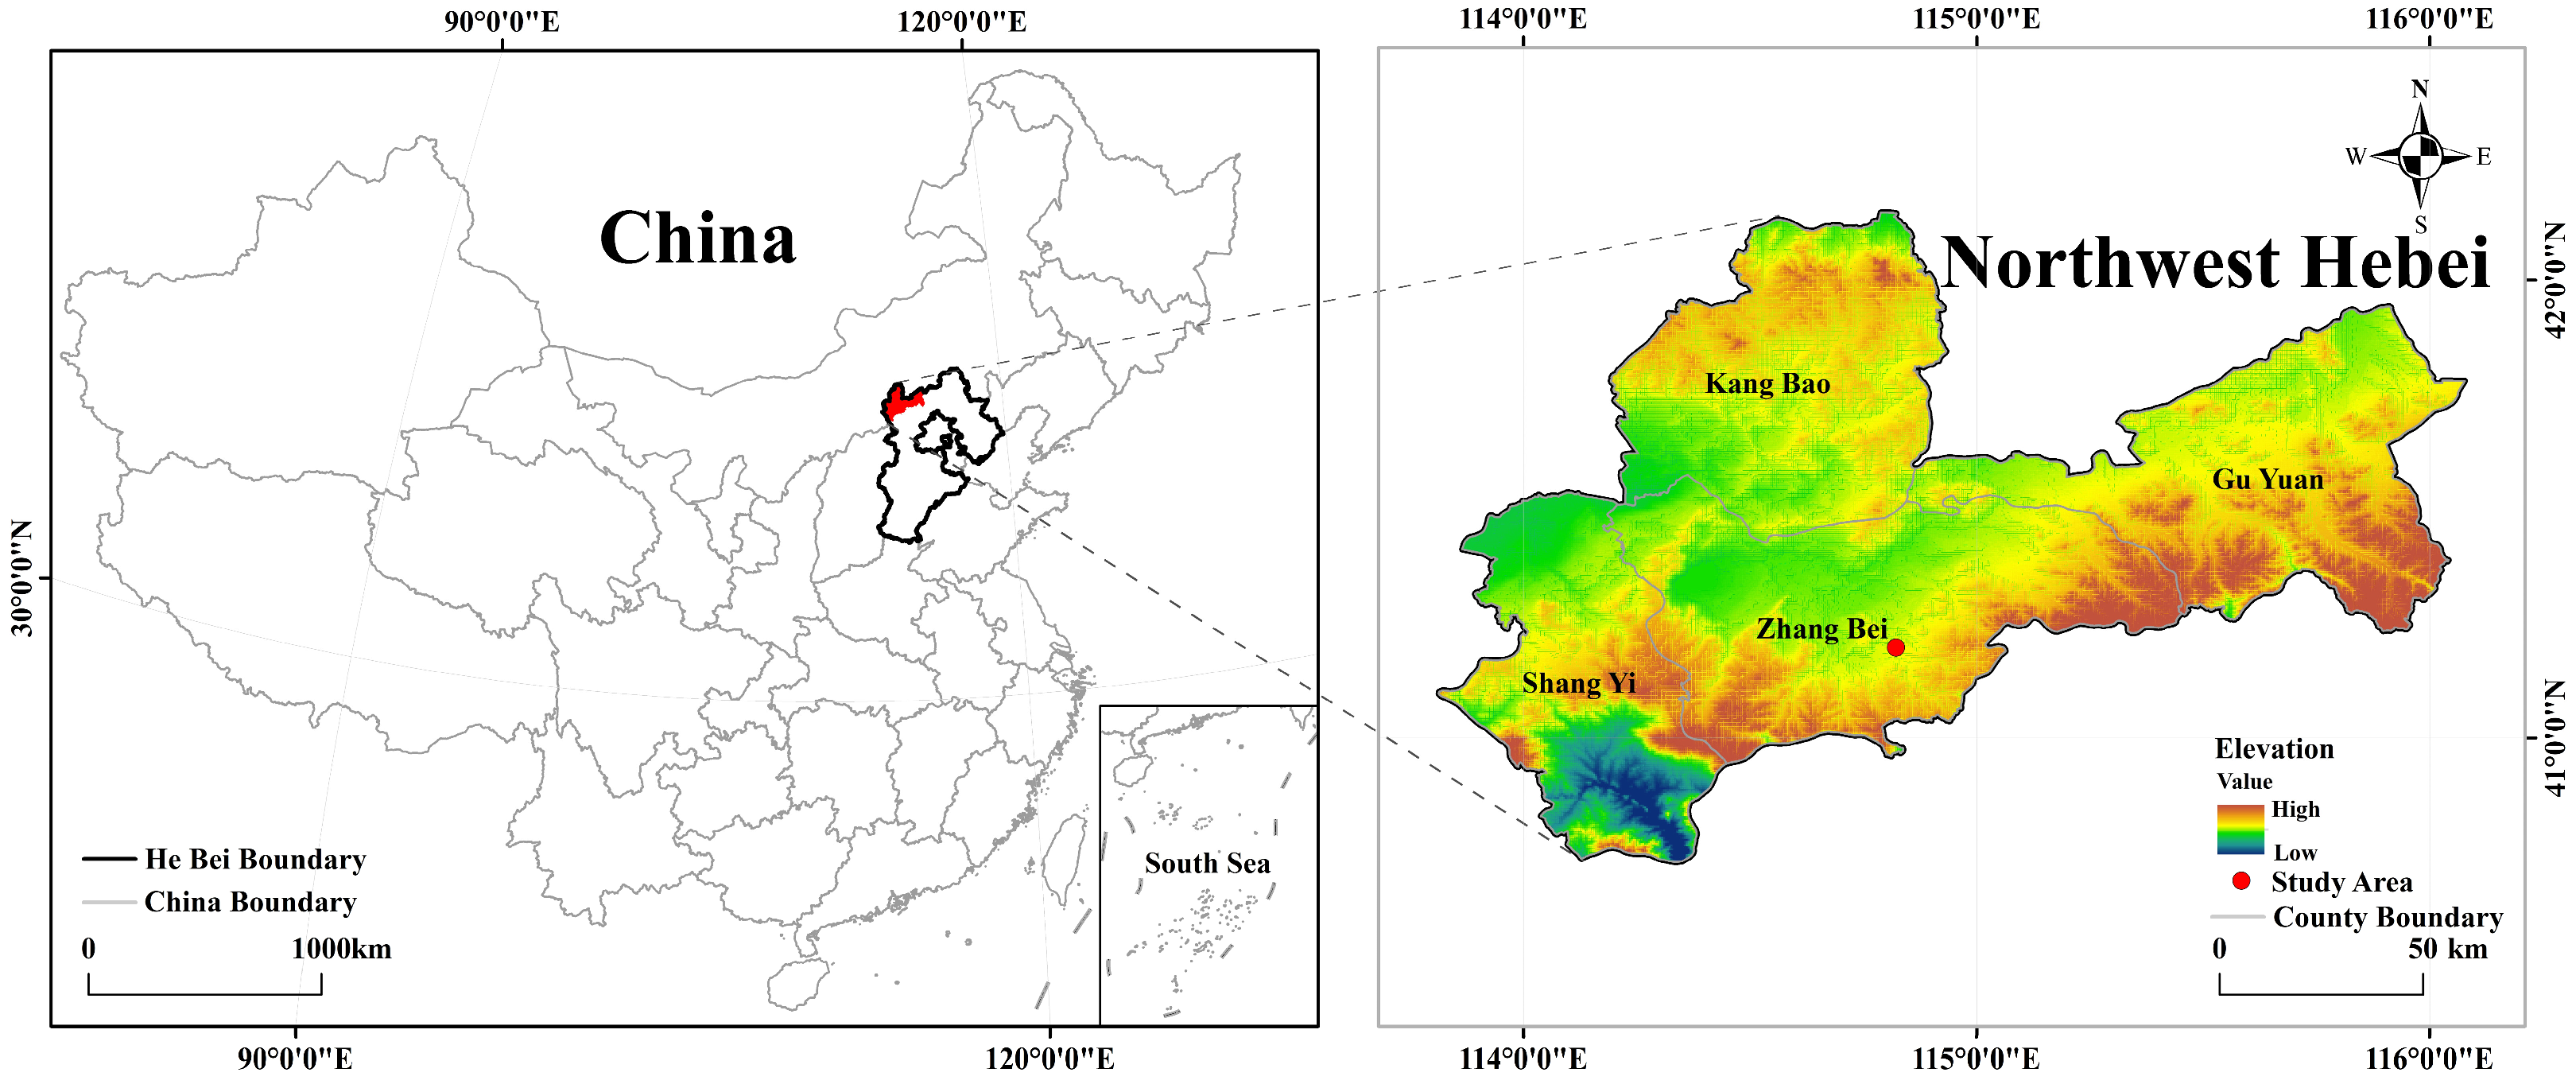
2.1. Overview of the Study Area

This study was conducted at Zhangbei Key Field Observation and Experiment Station of Agricultural Resources and Ecological Environment, Ministry of Agriculture and Rural Affairs in Zhangjiakou City, Hebei Province, China (41°09′ N, 114°42′ E), which is located in an alpine and semiarid ecological region in north China. The test area has an altitude of 1420 m and an average annual precipitation of 382.5 mm. From April to September, precipitation accounted for 80% of the annual total, while potential evapotranspiration [30] was measured at 804.1 mm. The ratio between precipitation and evapotranspiration is 0.489, indicating a degree of dryness (potential evapotranspiration/precipitation) of 2.0. The average annual temperature is 3.9 °C with a frost-free stage lasting for approximately 130 days. The cumulative temperature reaching or exceeding 10 °C is 2426.3 °C, and the daily temperature difference average is 15 °C. The annual sunshine duration is approximately 2900 h. A map of the location is shown in Figure 1.

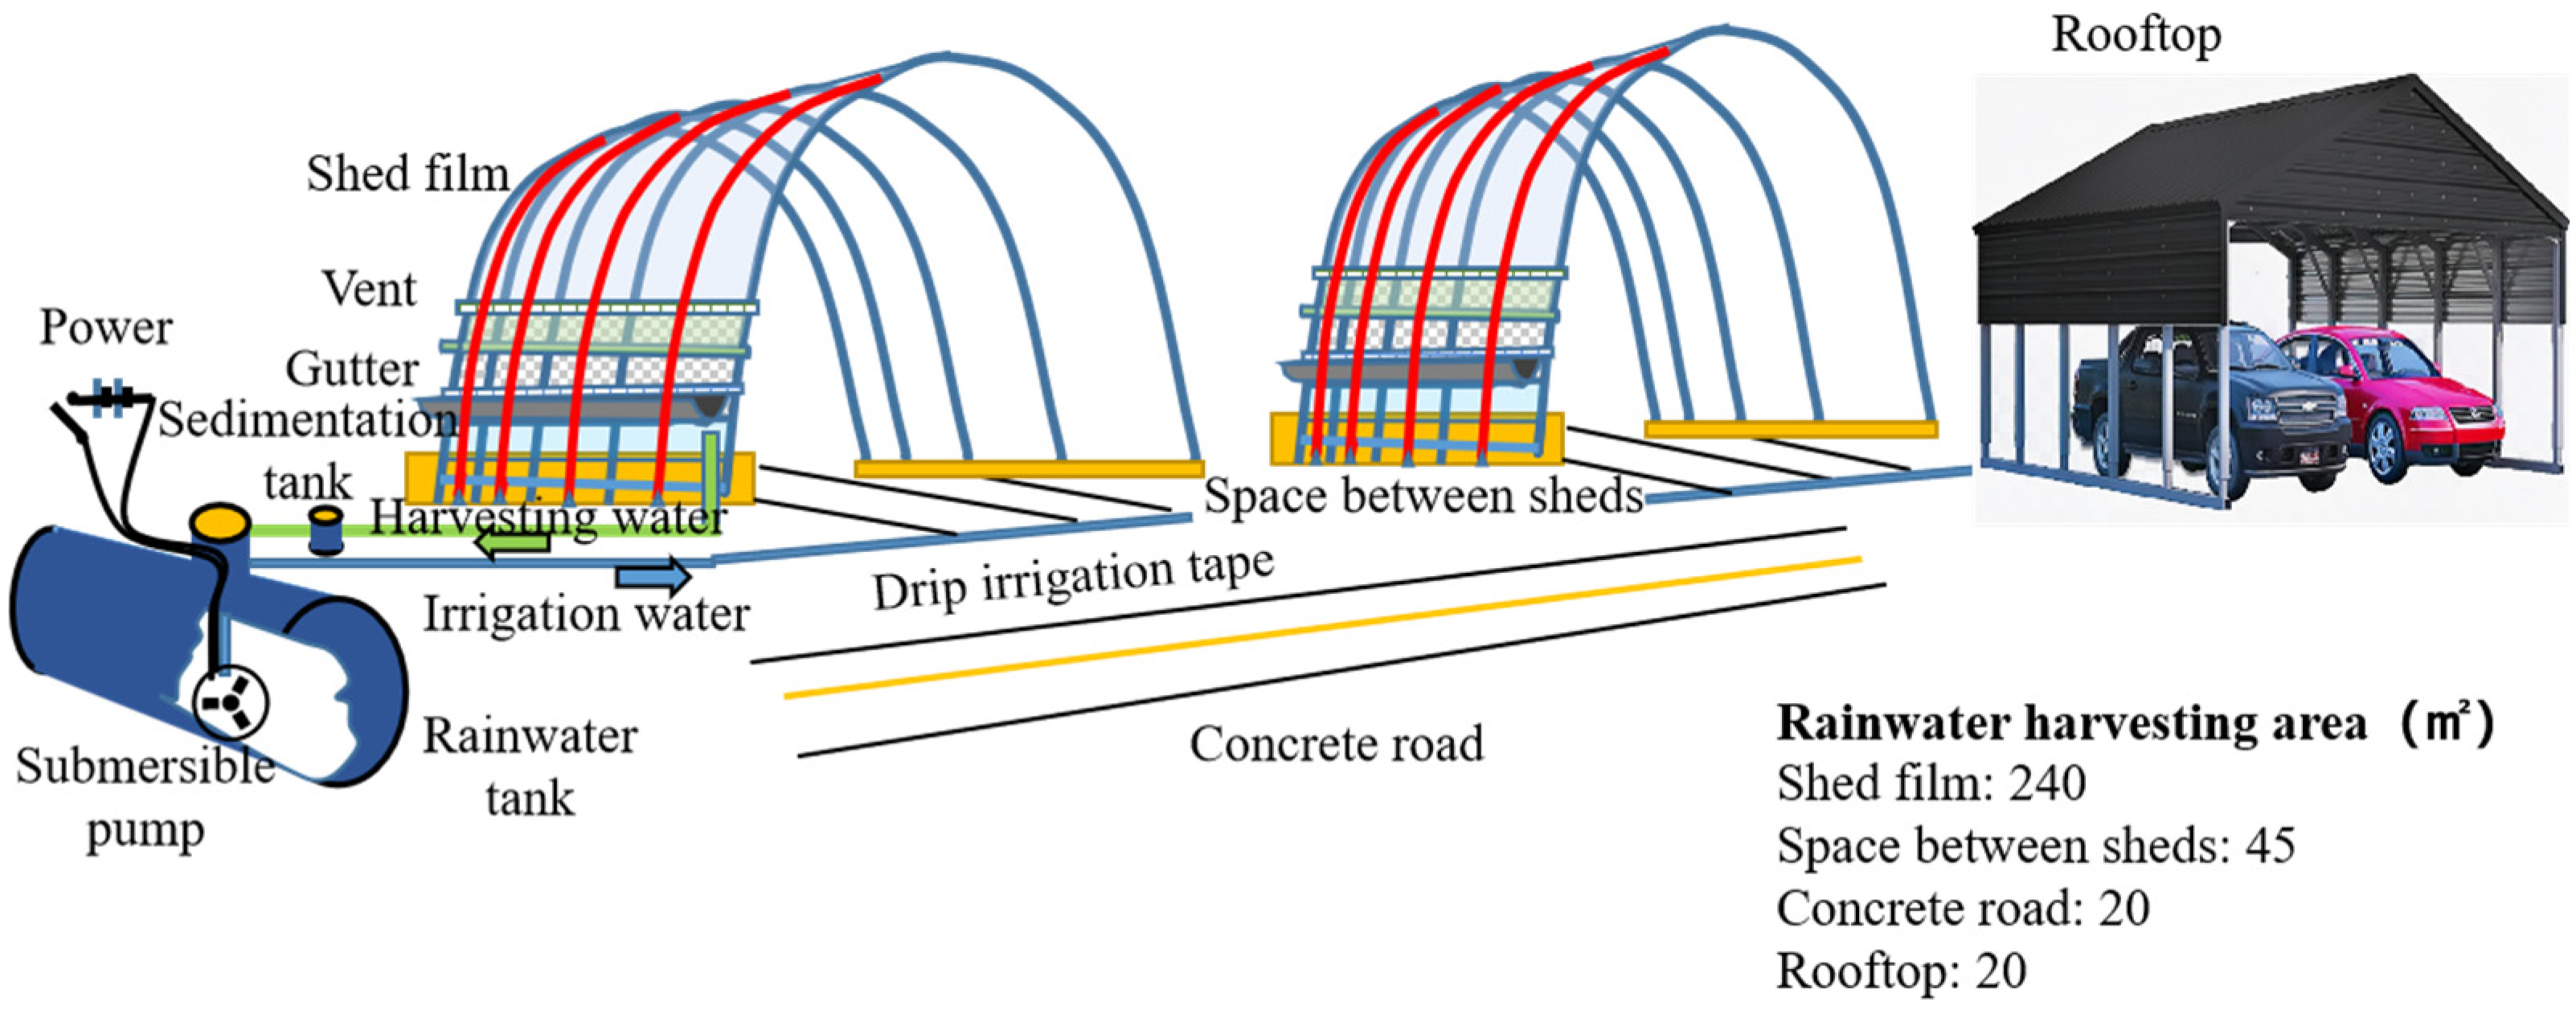
2.2. Rainwater Storage System

This test simulated the production of kidney beans in greenhouses. The RWH surface mainly consisted of shed film, space between sheds, concrete road surfaces, and building roofs, among others. The RWH system used in the greenhouses is shown in Figure 2. A gutter was mounted on the framework at the lower end of the greenhouse air outlet. Rainwater that falls onto the surface of the greenhouse would flow through the gutter, water transmission pipe, and precipitation filter device into a storage reservoir, before irrigating the kidney bean plot inside the greenhouse through a drip irrigation system. To ensure efficient water harvesting, the gutter is installed with a 2‰ slope (the ratio of slope length to height).

2.3. Data and Methods

2.3.1. Calculation of Rainwater Harvesting

To facilitate the comparison and calculation of irrigation-related parameters, such as precipitation, irrigation volume, and soil moisture content, the rainwater harvesting volume is expressed by the amount of water (m3) harvested over a 240 (m2) greenhouse area.
The rainwater harvesting rate (%) refers to the ratio of the total amount of rainwater harvested to the total amount of rainfall in any given period.
ψ = Q 1 Q 2 × 100 %
where Q1 represents the total amount of rainwater harvested (m3) and Q2 represents the total amount of precipitation (m3).
The coefficient of variation (%) is the ratio of the standard deviation to the mean, which is a statistic that measures the degree of variation of each observation in the data.
C v = σ μ × 100 %
where σ is the standard deviation, μ is the average value, and the specific unit depends on the variable.
Based on actual production experience, the RWH volume in this study included recoverable rainfall during the crop growth stage, as well as rainwater harvested within 60 days before planting the crop. The latter serves as the essential water supply for kidney beans during transplantation. The shed film rainwater harvesting rate [31] measured in this study was 89.1%, whereas the rainwater harvesting rate at the rooftop was 90.3%. In the present study, the rainwater harvesting rates of the shed film, shed coverings, hardened roads within the shed area, and rooftop were 85.0%, 75%, 75%, and 90%, respectively. Each value fell within the range specified in the “Technical Specification for Rainwater Harvesting, Storage, and Utilization Engineering” (GB-T50596-2010) [32].

2.3.2. Rainwater Tank Size

In this study, rainwater was harvested for greenhouse production. Similar to the calculation of RWH, the tank sizes of water storage facilities were expressed by the volume of water (m3) harvested over a 240 (m2) greenhouse area.
For this experiment, a reference rainwater tank size of 8.0 m3, which is 1.5 times the maximum cumulative rainfall for 5 consecutive days during the growing season, was proposed for the reservoir. The minimum rainwater tank size without discharged water under a certain irrigation stage for all evaluation years was considered as the maximum rainwater tank size. Based on this, the representative storage capacities of 8.0, 9.0, 10.0, 12.0, 15.7, and 53.2 m3 were used to simulate and analyze the influence of rainwater tank size on the water supply effect in kidney bean fields under specific precipitation scenarios [33].

2.3.3. Crop Irrigation Stage

Based on the results of a study on the impact of various irrigation gradients on temporal and spatial water consumption characteristics, yield, and the water use efficiency of kidney bean fields in greenhouses assessed in the Zhangbei Experiment Station water-saving irrigation experiment, 80% of the soil field’s water capacity was chosen as the reference irrigation scheme. Greenhouse kidney beans were cultivated using ridging covered with black mulch and drip irrigation under the film. The ridge spacing was 1 m, with one row planted in each ridge, two plants in each hole, and a hole spacing of 30 cm. Water was supplied using drip irrigation emitters spaced 25 cm apart. Transplanting took place on June 8th, with harvesting ending on September 3th 2022–2023. The greenhouse kidney beans were irrigated nine times throughout the growth stage. The parameters for each stage are shown in Table 1.
The irrigation stages of 14, 20, 35, and 88 times were established based on the reference stage of 9 irrigation times (Table 1). When the total number of irrigations was 88 times (high-frequency irrigation), the maximum irrigation quota per event is 3.5 mm, which will not exceed the field capacity or cause field loss. The water requirements of kidney beans are assumed to be constant across different irrigation cycles and tank sizes, so the simulation considers the effects of irrigation times (irrigation cycle) on the rainwater tank size and water supply of kidney bean fields.

2.3.4. Statistical Analysis of Rainfall

The daily rainfall data reported by the Zhangbei Meteorological Station for the 25-year period from 1992 to 2023 were used. Statistical analysis revealed that the coefficient of variation for regional precipitation during the crop growing season [34] was 28.0%.
The average rainfall over the past 25 years was used as the baseline for categorizing annual precipitation. Three years with near-average rainfall were selected to represent normal years, 3 years with the least rainfall were used to represent dry periods, and 3 years with the most rainfall represent wet periods [35].
Rainfall was estimated in three ways: (1) by taking the daily arithmetic average of the total rainfall over 25 years; (2) affected by extreme dry years, the annual precipitation over the past 25 years was ranked from the highest to the lowest. The top 80% of 25 annual precipitation data were selected [36]; (3) by analyzing the annual rainfall throughout the 25-year period.

2.3.5. Evaluation of Rainwater Tank Size and Production Effects under Different Water Supply Scenarios

If the sum of the amount of water stored in the reservoir after the last irrigation and the rainwater harvested between the last and next irrigation time points is more than the rainwater tank size:
Water   supply   satisfaction   rate   ( % )   S i = R D i × 100 %
where R (m3) is the design rainwater tank size of the reservoir, and Di (m3) is the water demand for stage i.
If the sum of the total water volume stored in the tank after the last irrigation and the rainwater harvested from subsequent irrigations is less than the rainwater tank size:
Water   supply   satisfaction   rate   ( % )   S i = V i 1 D i × 100 %
where Vi−1 (m3) is the sum of the amount of water stored in the tank after irrigation from the previous period and the rainwater collected during the last and next irrigation time points.
If the sum of the amount of water stored in the reservoir after the last irrigation and the rainwater harvested between the last and next irrigation time points is less than the amount of water required during this stage, then water scarcity will occur:
Water   scarcity   ( m 3 )   L i = D i V i 1
Water   demand   satisfaction   rate   ( % )   N i = D i L i D i × 100 %
When Vi−1 > Di, then Ni < Si; when Vi−1Di, then Ni = Si [37].
If the sum of the amount of water stored in the reservoir after the last irrigation and the rainwater harvested between the last and next irrigation time points is greater than the rainwater tank size, water discharge will occur:
A i = m = 1 t ( V i , m R )
where Vi,m (m3) represents the sum of the amount of water stored in the reservoir before the m rainfall of this stage and the rainwater harvested of the m rainfall, and t (time) is the rainfall time. If Vi,m is less than R after the m rainfall, the volume of water discharged after this rainfall is calculated as 0 m3.
Yield   reduction   rate   ( % )   y i = ( 1 Y i D i ) × K y × 100 %
where yi is the yield reduction rate (%) during the i growth stage; Y i is the volume of rainwater irrigated in the i growth stage (m3). When water is scarce during the growth stage, Y i represents Di − Li. When there is no water scarcity, Y i represents D i ; K y is the yield response coefficient of the influence of water scarcity on kidney bean growth. The K y of kidney bean recommended by the Food and Agriculture Organization [38] was adopted, as shown in Table 2.
Yield   reduction   over   the   whole   growth   stage   ( % )   y = [ 1 i = 1 4 ( 1 y i ) ] × 100 %
where 4 is the growth stage number of kidney beans.
The relationship between precipitation resource supply and kidney bean demand in greenhouses was analyzed based on the principle of water balance [39] using the continuous simulation method [40] according to the Yield Before Spillage principle [41]. The specific simulation process is as follows: (1) The optimal water-saving irrigation scheme was determined based on the research results of a preliminary water-saving irrigation experiment for kidney beans at the experimental station, and the optimal irrigation quantity and time data table were obtained; (2) The initial volume N0 of the storage reservoir was determined based on the precipitation in April and May over 25 years, with the current water storage V calculated according to crop water demand Di and harvested rainwater; (3) Normal RWH occurs when V < R; otherwise overflow occurs (7); (4) The water supply satisfaction rate, water demand satisfaction rate, and kidney bean yield reduction rate were calculated during each irrigation stage using (3), (4), (6), (8), and (9), respectively; (5) Steps 1 to 4 were repeated; (6) Based on the optimized irrigation stage Im, the RWH area was expanded and steps 1 to 4 were repeated to determine the effect of storage and water supply over a span of 20 years with an 80% rainfall guarantee rate, providing a reference for kidney bean harvesting in greenhouses located in cold and arid areas of north China.

2.3.6. Simulation Method

Using Python programming, the effects of rainwater tank size and kidney bean field production under different water supply scenarios were simulated.

3. Results

3.1. Impact of Rainwater Tank Size on Water Demand Satisfaction for Kidney Bean Fields

Based on the average daily rainfall of 25 years, the greenhouse reference irrigation stage for kidney beans (Table 1) was used to simulate and analyze the impact of rainwater tank size on water supply satisfaction rate, discharged water quantity, and yield reduction rate for greenhouse kidney bean fields (Figure 3). As rainwater tank size increased, the satisfaction rate of rainwater storage supply to kidney bean fields increased significantly, while the corresponding yield reduction rates and discharged water quantity decreased. When the rainwater tank size reached 15.7 m3, the discharged water volume became zero, while the corresponding water supply satisfaction rate and yield reduction rate remaining unchanged at 104.1% and 1.8%, respectively. The water demand satisfaction rate during the growth stage was 99.2%, with a water scarcity of only 0.5 m3. Therefore, under average annual precipitation and reference irrigation system conditions, along with RWH for 60 days before transplantation, a minimum rainwater tank size of 15.7 m3 is required to eliminate the discharged water volume and achieve near equilibrium between water supply and demand.
The effects of reservoir volume on the water supply satisfaction rate, water demand satisfaction rate, water scarcity volume, water discharge volume, and yield reduction rate of greenhouse-grown kidney beans were simulated and analyzed (Table 3). Clearly, a rainwater tank size of V2 can effectively store all rainfall during the stage from 60 days before transplanting to the end of harvesting. The volume of water harvested before transplanting was 9.4 m3, resulting in a total water supply of 56.4 m3, which slightly exceeded the water demand of 54.1 m3. However, under the reference irrigation scheme, 2.7 m3 of rainfall harvested during the last irrigation stage was not utilized for irrigation, leading to a deficit of 0.5 m3 and a yield reduction of 1.8%. Compared with V2, V1 produced 6.4 m3 of discharge water in the first three irrigation stages of the kidney bean growth stage, with most of the water discharged during the first stage. Furthermore, the discharged water volume accumulated throughout the entire harvest stage was 7.8 m3, which equates to a difference between the capacities of the two rainwater tanks. The expanded size of V2 can accommodate V1’s water discharge.
The average daily RWH volume during the kidney bean growth stage fluctuated widely at the study site by 0.0–1.4 m3 over 25 years, with the heaviest rainfall occurring from 10 July to 25 July (Figure 4) and averaging at 0.7 m3/d. With a rainwater tank size of 8.0 m3, the water supply exceeded the demand by 2.9 times before July 3, based on pre-transplantation water supply and low water consumption intensity during the seedling stage. However, as water consumption intensity increased and water supply decreased, average daily dissipation surpassed average daily rainfall, leading to a gradual decrease in the water demand satisfaction rate, which dropped to 63.0–67.9% after 7 August. The greenhouse kidney beans experienced a water scarcity of 8.2 m3 and discarded 6.4 m3 during the growth stage, resulting in a yield reduction rate of up to 29.1%.

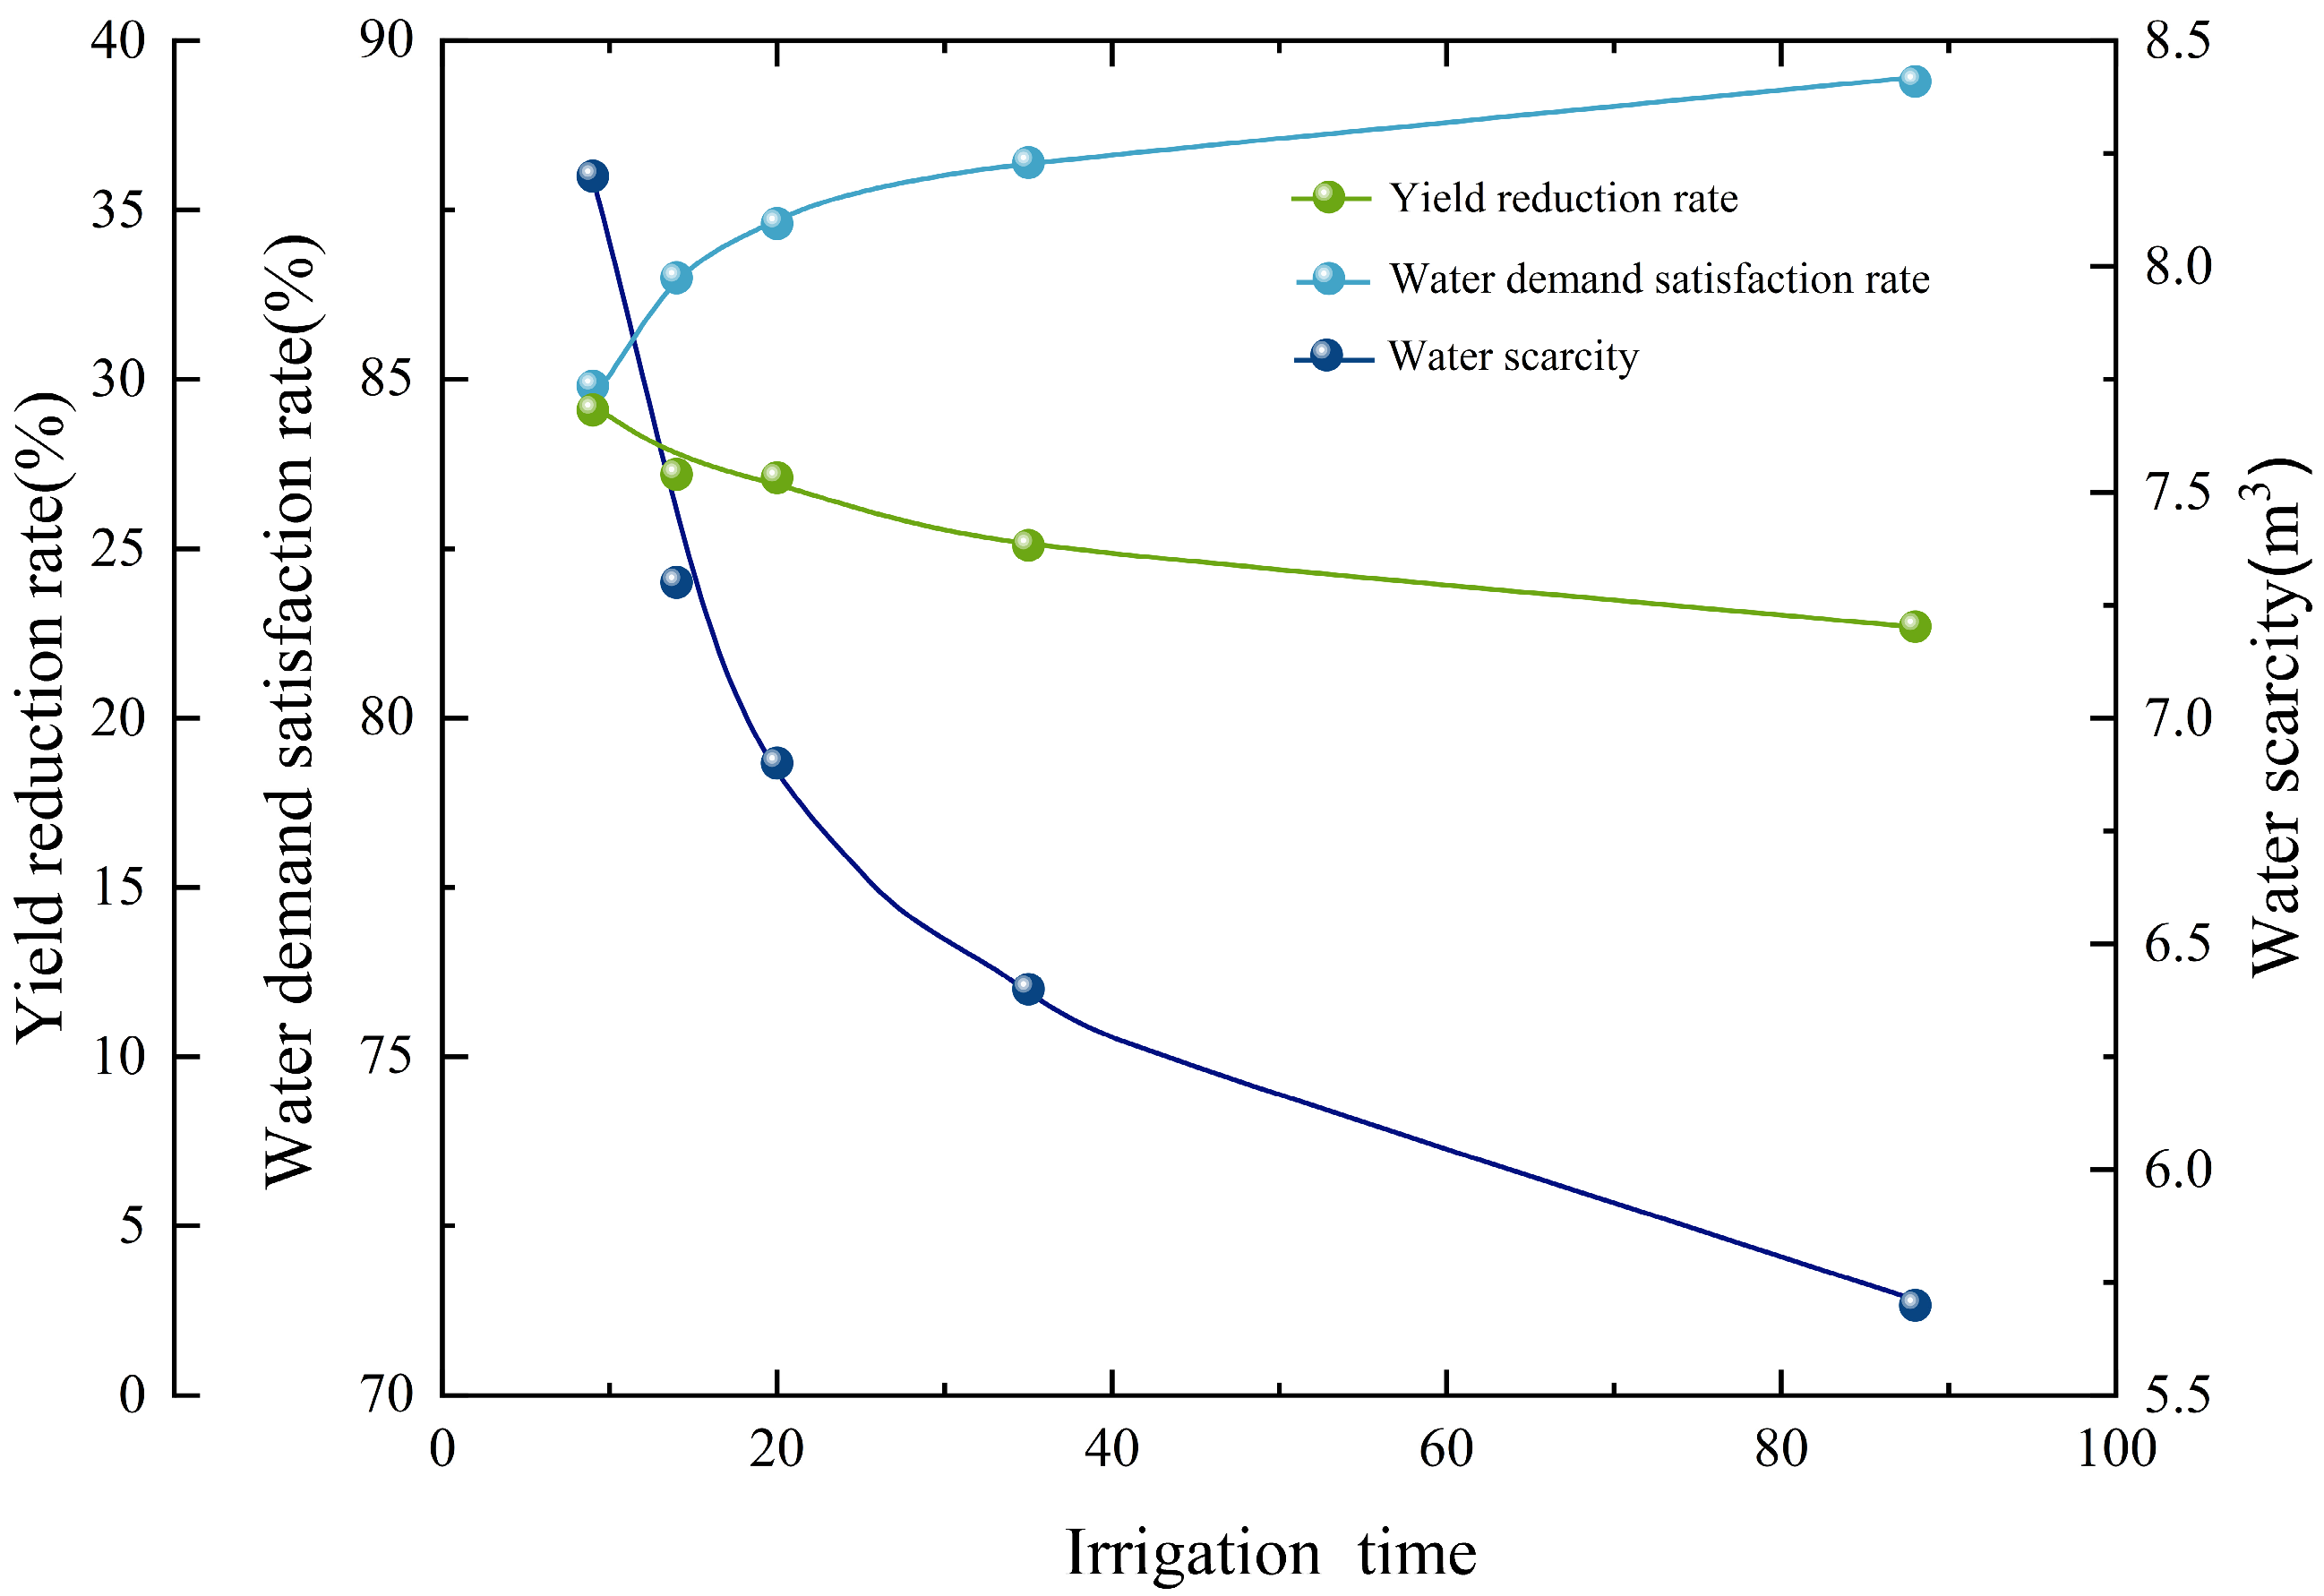
3.2. Impact of Irrigation Frequency on The Water Demand Satisfaction Rate of Kidney Bean Fields

The study simulated and analyzed the effects of irrigation frequency on the water demand satisfaction rate and yield reduction rate of kidney bean fields in greenhouses based on the average daily rainfall of 25 years. As irrigation frequency and rainwater tank size increased, the water demand satisfaction rate gradually reached 100%, whereas the water scarcity volume and yield reduction rate decreased to 0 (Table 4). Using 8.0 m3 and 12 m3 rainwater tanks, when the irrigation frequency increased from nine to 88 times, the water scarcity volume decreased by 2.5 m3 and the water demand satisfaction rate increased by 4.5 percentage points. Because of the shortened irrigation stage, the single irrigation quota decreased, resulting in a sharp reduction in single water scarcity. Furthermore, because of the continuous shortening of the last irrigation stage with the increase in irrigation frequency, more rainwater was stored to supply crops; thus, the water demand satisfaction rate of kidney beans during the growth stage increased.
During the growth stage, water was mostly discharged during the early period, when there was no water shortage. Therefore, the discharge volume only changed with the rainwater tank size but did not change with the increase of irrigation frequency.
Using the 8.0 m3 rainwater tank, the yield reduction rate of kidney beans during the growing stage was 22.7% at an irrigation frequency of 88 times, which was lower by 6.4 percentage points than that at an irrigation frequency of nine irrigation times. Using the 12.0 m3 rainwater tank, the yield reduction rate decreased by 9.8 percentage points with the increase in irrigation frequency. Irrigation frequency and reservoir volume affected the water supply. However, compared with irrigation frequency, the yield reduction rate was more sensitive to the change in rainwater tank size.
When the rainwater tank size was 8.0 m3, as the irrigation cycle was shortened and the irrigation frequency during the growing stage increased from nine to 88 times, the water demand satisfaction rate of kidney beans increased from 84.9% to 89.4%, and the yield reduction rate decreased from 29.1% to 22.7% (Figure 5). Statistical analysis revealed that the relationship between irrigation frequency (x) and yield reduction (y) exhibited a quadratic curve: y = 0.0012x2 − 0.191x + 30.275 (R2 = 0.9737).
The shortening of the irrigation cycle increases the reuse rate of the rainwater tank size, leading to a decrease in the required rainwater tank size for guaranteed yield [42]. This reduction helps lower construction costs but also increases the expenses for irrigation operations and results in shallower wet soil layers after irrigation. Determining the appropriate irrigation cycle should take into account RWH and utilization engineering, and the crop’s agronomic demands.

3.3. Effect of Rainwater Tank Size and Water Supply under Partial Annual Rainfall

The minimum reservoir volume and water supply effect without water discharge were simulated and analyzed based on data on 25 years of annual precipitation, using a 4-day irrigation cycle (Table 5). Three distinct precipitation scenarios representing dry, normal, and wet years were chosen, each consisting of three typical years. The average values of the minimum reservoir volume without discharged water were 10.6, 19.7, and 42.7 m3 for dry, normal, and wet years, respectively. The corresponding yield reduction rates were 70.5%, 14.2%, and 0%, respectively. These results highlight significant differences in rainfall water supply across different years. The rainfall water supply varies greatly between years with different precipitation levels. In the same dry year, substantial differences were observed in the temporal distribution of precipitation during the growth stages in 1997, 2002, and 2022, leading to a 39.5% difference in the yield reduction rate. Despite a 14.3 mm increase in rainfall during the growing stage of 2022 compared to 2002, the yield reduction rate in 2022 was 26.4% higher than that in 2002, mainly because rainwater collected before transplanting had a greater impact on the yield reduction rate, and the rainfall during the growing stage of kidney beans in 2022 mainly occurred during the early and middle stages, when water from the rainwater tank was sufficient. In contrast, rainfall during the growth stage in 2012 was 236.0 mm, which is 55.9 mm more than that in 2000; however, because it was primarily concentrated in the early and middle stages, the kidney bean yield reduction rate only increased by a mere 8.4 percentage points compared to 2000. Therefore, the concrete analysis of the correlation between rainwater tank size and water supply impact in various years is crucial for the development of regional rainwater storage facilities and the enhancement of water supply efficiency.
During a 4-day irrigation cycle, the rainwater tank size and water supply effect under the two scenarios of 25 years of annual precipitation for all years and 20 years of annual precipitation under an 80% guarantee rate were simulated and analyzed (Table 6). Consistent with the results of the annual average precipitation scenario, the yield reduction rate, water scarcity volume, and discharge of kidney beans all decreased with an increase in rainwater tank size. The comparison showed that under the 25-year average precipitation scenario, the minimum rainwater tank size needed to achieve no discharged water was 15.7 m3, whereas it needed to be as high as 53.2 m3 under the 20-year precipitation scenario with an 80% guarantee rate and the 25-year precipitation scenario for all years, a 3.39-fold difference. The yield reduction rate increased from the annual average precipitation scenario of 0.0% to 9.4% and 18.6% in the multi-year average precipitation scenario. Table 6 shows that the minimum average yield reduction was 9.4%, and the corresponding rainwater tank size was 29.5 m3 under the annual precipitation scenario of an 80% guaranteed rate. Therefore, storage capacity and water supply regulation for annual farmland production can only be designed according to the natural rainfall and temporal distribution of each year.

3.4. Influence of An Expanding Water Source on Rainwater Tank Size and Water Supply

Shed film rainwater harvesting is the main way. At the same time, rainwater harvesting surfaces such as the space between sheds, concrete roads, and the rooftop are superimposed for rainwater harvesting [43,44]. The influence of rainwater tank size and the effect of the water supply on the greenhouse rainwater kidney bean production system is simulated and analyzed, as shown in Table 7. Given the background of 20 years, during which the irrigation stage is 4 days long and there is an 80% interannual precipitation guarantee rate, the yield of kidney beans irrigated only by shed film rainwater harvesting will decrease regardless of the size of the rainwater tank (Table 6). When the yield reduction rate of the growing stage of kidney beans was 10%, the water scarcity of the kidney bean field was 2.8 m3, the water discharged was 5.9 m3, and the corresponding rainwater tank size was 20.3 m3. With the same yield reduction rate of 10%, when rainwater is jointly harvested from runoff surfaces such as the shed film, the space between sheds, concrete roads, and the rooftop, the discharged water of the kidney bean field increases to 26.4 m3, and the rainwater tank size can be reduced to 13.5 m3. The results showed that the rainwater tank size of kidney beans could be rapidly reduced by the development and utilization of rainwater harvesting water sources outside the shed film. However, due to the influence of rainfall harvesting and rainfall timing, water scarcity will inevitably occur, resulting in a decrease in production.
Table 7 shows that at yield reduction rates of 10% and 15%, the volume of rainwater discarded was 5.9 and 8.0 m3, respectively, with the remaining water in the storage reservoir after kidney bean harvesting at 4.9 and 3.8 m3, respectively. The total is 3.9 and 3.1 times the water scarcity volume, respectively. Upon successive superimposition of runoff harvesting from different surfaces around the shed area, minimal change was observed in inventory water volume, whereas a rapid increase in discharged water volume occurred. The results demonstrate that the total volume of water harvested around the shed area could fully satisfy the irrigation demand for kidney bean cultivation. However, even with a scarcity of only 2.9 or 4.1 m3, a yield reduction rate of 10% or 15% would still occur.

4. Discussion

4.1. Minimum Rainwater Tank Size of Water Storage Facilities

Rainwater harvesting can reduce soil erosion, alleviate regional waterlogging, and improve agricultural productivity, acting as an efficient soil and water conservation system [45]. The rate of rainwater harvesting, the slope of the gutter, and the size of the rainwater harvesting tank are critical parameters in the design of a rainwater storage system. According to GB-T50596-2010 [32], the recommended harvesting rate for shed film rainwater in areas with rainfall between 250 and 500 mm is 85–90%. The harvesting rate of shed film rainwater observed in this study was 89.1%, which meets the relatively high level stipulated by the national standards. Li et al. [46] demonstrated that the rainwater harvesting rate of the RFRH system was 87%, with better utilization during light rain (<5 mm). In this study, the rainwater harvesting rate was 89.1%, effectively utilizing rainfall above 0.06996 mm, and the positive impact is evident. The tank size for rainwater harvesting is designed to maintain the flow balance between rainwater harvesting and water demand [47]. Jing et al. [48] used the continuous simulation method and found that the rainwater retention rate, water demand satisfaction rate, and water supply guarantee rate increased with an increase in reservoir volume. However, the increasing speed gradually slowed down, and the results of this experiment were similar. However, as the rainwater tank size increases, the scale and cost of construction increase correspondingly. Furthermore, with the increasing land cost, optimizing the size of the rainwater harvesting tank is essential. Guan et al. [49] established a reservoir water supply benefit evaluation model (RWSBEM) based on the energy analysis theory. They found that the ecological water supply benefit of water tanks is the largest, whereas the agricultural water supply benefit is the smallest, and the cost increases rapidly with increases in the size of the rainwater tank. Imteaz et al. [50] proposed the concept of water balance modeling, indicating that the optimal tank size can be determined based on roof size and rainwater demand and can be represented by a single generalized equation. The findings indicate that for a 150 m2 roof area in dry and normal rainfall years, the optimal water tank size was 30,000 liters, which resulted in a 50% reduction compared with the commonly used Rippl method. This means that determining the minimum storage capacity to meet specific water supply demands should consider factors such as farmland water demand for expected crop yield, reservoir construction costs [51], and available supplementary water sources. Based on the analysis presented in this paper, further improvements are needed to optimize the rainwater tank size in this scenario.

4.2. Enhanced Utilization of Multi-Year Precipitation Data

The annual average meteorological value represents the general climate characteristics of the region, and the more accumulation of meteorological data, the better the representation [52]. However, in the face of wide interannual fluctuations in monsoon climate regions, farmland production will be significantly influenced by temporal and spatial factors and precipitation quantity in the current year [53,54]. In arid and semi-arid areas, crop productivity is sensitive to seasonal changes in meteorological variables such as precipitation, soil moisture, temperature, and evaporation [55,56]. Therefore, rain-fed farming production should only be simulated and analyzed according to annual precipitation scenarios. In this study, the yield reduction rate of kidney bean production in annual simulations increased from 0% to 18.6% under the 25-year fractional annual precipitation scenario, highlighting the importance of using annual precipitation data. Therefore, adopting annual meteorological data based on years with an 80% guaranteed rate [57] is considered a practical method of analyzing and utilizing meteorological data to ensure agricultural stability amidst climatic changes.

4.3. Selected Crop Irrigation Scheme

Rational rainwater harvesting patterns and irrigation strategies are crucial for optimizing the yield and water use efficiency of kidney beans. Low- and high-frequency irrigation can decrease the number of plant reproductive organs and increase the rate of flower bud shedding. Once a certain irrigation frequency and quota are reached, continued irrigation will lead to decreased crop yield and water utilization rate. Therefore, 4 days/time (in this study, it is the middle irrigation frequency) is selected as the optimal irrigation frequency for kidney beans, which can effectively improve the water supply satisfaction rate and yield of kidney beans, ensuring the normal transpiration and growth of kidney beans.
In general, the water requirement of kidney beans is constant across irrigation cycles and tank sizes [58]. Du et al. [59] set three different types of irrigation frequencies for peppers: 5, 10, and 15 d, and the irrigation times were 13, 7, and 5, respectively. Based on the practical water demand of vegetable cultivation in a local facility, the total amount of irrigation was 22.8 L (liters) per treatment, the design principle of which is analogous to this study. Puertolas et al. [60] treated tomato and basil with three different irrigation frequencies of 1 day/time, 0.5 day/time, and 3 day/time, and the irrigation amount of different treatments was consistent (75% of that received by a well-watered treatment-WW). The study found that the 0.5 day/time irrigation frequency and the 3 day/time irrigation frequency reduced evapotranspiration by 80% and 70%, respectively, compared with the WW irrigation treatment. This suggests that the 3 day/session irrigation frequency reduces water use to a greater extent, despite the similar amount of irrigation, which is extremely close to the 4 day/session irrigation frequency chosen in this study.
Wang et al. [61] found that, in terms of the day before irrigation, the dry area treated with an irrigation frequency of 8 days/time (low-frequency irrigation) was much larger than that treated with 4 days/time, a large arid area appeared before each irrigation in the later period, and the temporary dry area before irrigation may cause water stress in potatoes. As far as the day after irrigation is concerned, the lower the irrigation frequency, the larger the wet zone. A larger wet zone lasts longer, which will affect soil aeration. These two factors may explain the decrease in potato yield under less frequent treatments, so the irrigation frequency of 1 day/time (high-frequency irrigation) is the optimal irrigation treatment. In this study, 4 days/time was the optimal irrigation frequency for kidney beans. The reason for the difference in results may be that the ideal conditions for potato growth require high and constant soil water potential and soil oxygen diffusion rate, while kidney beans like moderately moist soil, and high-frequency irrigation will lead to anaerobic respiration in the root layer, which is detrimental to the invigoration of kidney beans. In addition, the irrigation cost will increase as the frequency of irrigation increases, and considering the cost and benefits of an irrigation project when determining a suitable irrigation frequency is necessary.

4.4. Supplementary Water Source to Ensure Stable Agricultural Production

In light of the spatial and temporal mismatch between crop water demand and rainfall supply, the regulation of rainwater storage reservoirs has become essential to ensuring a stable crop yield [62]. Apart from selecting drought-tolerant crops [63] and enhancing soil moisture retention [64], utilizing reservoir water for irrigation can help stabilize and improve farmland water conditions. In areas lacking surface water resources, groundwater extraction is a common method of replenishing farmland water supply [65]. Yan et al. [66] found that through rainwater harvesting and supplementary irrigation of rice, rainfall-adapted irrigation reduces the irrigation frequency and the total irrigation water by 43% compared to traditional irrigation and nitrogen fertilization patterns. These findings indicate that rainfall-adapted irrigation improves the storage and utilization capacity of rainwater. Rainfall-adapted irrigation also increases root length, root and shoot biomass, net photosynthetic rate, crop growth rate, nitrogen accumulation, percentage of productive tillers, harvest index, and nitrogen harvest index. The current study revealed that even with a maximum rainwater tank size of 53.2 m3 in a year with an 80% precipitation guarantee rate, greenhouse kidney bean production still experienced an annual water shortfall of 2.5 m3. The timing and magnitude of this shortfall varied significantly from year to year. However, the end-of-harvest inventory water reached a high of 10.4m3, which was 4.2 times the water scarcity incurred. Therefore, maintaining the balance between water production and consumption across the entire greenhouse area and judicious use of groundwater sources can supplement fluctuating irrigation needs met by storage reservoirs to ensure high yields in rainwater-fed kidney bean production systems.

5. Conclusions

The water supply and demand of greenhouse kidney bean production in northwest Hebei province increased with reservoir volume and a reduced irrigation cycle under the annual average precipitation scenario. The simulation analysis showed that under the optimized 4-day irrigation cycle, when the rainwater tank size reached 15.7 m3, all the rainfall during the growth stage and 60 days before the transplant of kidney beans could be effectively harvested, with a water discharge volume of 0, a water demand satisfaction rate of 100%, and a yield reduction rate of 0%. Considering the variability in regional precipitation, average annual rainfall is not a scientific guide to production. This study selected 20 years with an 80% precipitation guarantee rate to simulate the water supply effect of rainwater. The results showed that the average minimum yield reduction rate was 9.4%, corresponding to a minimum rainwater tank size of 29.5 m3. The size of the rainwater tank without yield reduction can be reduced to 20 m3 by superimposing the space between greenhouses, hardening roads, and roofs. However, any further reductions in the size of the rainwater tank would increase yield reduction rates. The total of discharged and inventory water under each scenario exceeded the water scarcity volume. Therefore, appropriately increasing the rainwater tank size and irrigation frequency, as well as exploring methods for utilizing discharged and inventory water, can enhance the water supply satisfaction rate of kidney beans and lead to a higher yield.

Author Contributions

Conceptualization, L.Z. and J.Z. (Jizong Zhang); methodology, L.Z.; software, Z.W.; validation, H.L., L.Z. and J.Z. (Jizong Zhang); formal analysis, L.Z.; resources, H.L.; data curation, M.S.; writing—original draft preparation, M.S. and L.Z.; writing—review and editing, L.Z. and J.Z. (Jianheng Zhang); visualization, J.R.; supervision, Y.H.; project administration, J.Z. (Jizong Zhang); funding acquisition, J.Z. (Jizong Zhang). All authors have read and agreed to the published version of the manuscript.

Funding

This study was funded by the National Key Research and Development Program of China. Foundation of China (2021YFD1901104-5).

Data Availability Statement

Data are contained within the article.

Acknowledgments

The authors would like to express our gratitude to Mickey, the Engineering Management Master at Johns Hopkins University, for his technical support in Python language programming.

Conflicts of Interest

The authors declare no conflicts of interest.

References

  1. Karimidastenaei, Z.; Avellán, T.; Sadegh, M.; Kløve, B.; Haghighi, A.T. Unconventional water resources: Global opportunities and challenges. Sci. Total Environ. 2022, 827, 154429. [Google Scholar] [CrossRef] [PubMed]
  2. Song, P.; Wang, X.; Wang, C.; Lu, M.; Chen, L.; Kong, L.; Lei, X.; Wang, H. Analysis of Agricultural Water Use Efficiency Based on Analytic Hierarchy Process and Fuzzy Comprehensive Evaluation in Xinjiang, China. Water 2020, 12, 3266. [Google Scholar] [CrossRef]
  3. Wu, B.; Tian, F.; Zhang, M.; Piao, S.; Zeng, H.; Zhu, W.; Liu, J.; Elnashar, A.; Lu, Y. Quantifying global agricultural water appropriation with data derived from earth observations. J. Clean. Prod. 2022, 358, 131891. [Google Scholar] [CrossRef]
  4. Xinchun, C.; Mengyang, W.; Xiangping, G.; Yalian, Z.; Yan, G.; Nan, W.; Weiguang, W. Assessing water scarcity in agricultural production system based on the generalized water resources and water footprint framework. Sci. Total Environ. 2017, 609, 587–597. [Google Scholar] [CrossRef]
  5. Wang, Y.; Liu, Y.; Qiao, L.; An, N. Development status, problems and suggestions of organic vegetable industry in Bashang area of Hebei Province. China Veg. 2022, 5, 5–10. (In Chinese) [Google Scholar]
  6. Guo, F.-X.; Wang, Y.-P.; Hou, T.-T.; Zhang, L.-S.; Mu, Y.; Wu, F.-y. Variation of soil moisture and fine roots distribution adopts rainwater collection, infiltration promoting and soil anti-seepage system (RCIP-SA) in hilly apple orchard on the Loess Plateau of China. Agr. Water Manag. 2021, 244, 106573. [Google Scholar] [CrossRef]
  7. Xu, Y.; Mo, X.; Cai, Y.; Li, X. Analysis on groundwater table drawdown by land use and the quest for sustainable water use in the Hebei Plain in China. Agr. Water Manag. 2005, 75, 38–53. [Google Scholar] [CrossRef]
  8. Rahman, A.; Snook, C.; Haque, M.M.; Hajani, E. Use of design curves in the implementation of a rainwater harvesting system. J. Clean. Prod. 2020, 261, 121292. [Google Scholar] [CrossRef]
  9. Zhong, Q.; Tong, D.; Crosson, C.; Zhang, Y. A GIS-based approach to assessing the capacity of rainwater harvesting for addressing outdoor irrigation. Landsc. Urban Plan. 2022, 223, 104416. [Google Scholar] [CrossRef]
  10. Gu, X.-b.; Li, Y.-n.; Du, Y.-d.; Yin, M.-h. Ridge-furrow rainwater harvesting with supple-mental irrigation to improve seed yield and water use efficiency of winter oilseed rape (Brassica napus L.). J. Integr. Agr. 2017, 16, 1162–1172. [Google Scholar] [CrossRef]
  11. Jiang, Z.-y.; Li, X.-y.; Ma, Y.-j. Water and Energy Conservation of Rainwater Harvesting System in the Loess Plateau of China. J. Integr. Agr. 2013, 12, 1389–1395. [Google Scholar] [CrossRef]
  12. Islam, S.; Lefsrud, M.; Adamowski, J.; Bissonnette, B.; Busgang, A. Design, Construction, and Operation of a Demonstration Rainwater Harvesting System for Greenhouse Irrigation at McGill University, Canada. HortTechnology 2013, 23, 220–226. [Google Scholar] [CrossRef]
  13. Liu, X.; Zhang, L.; Wu, P.; Deng, H. A new small-scale system of rainwater harvesting combined with irrigation for afforestation in mine area: Optimizing design and application. J. Environ. Manag. 2022, 322, 116129. [Google Scholar] [CrossRef] [PubMed]
  14. Campisano, A.; Butler, D.; Ward, S.; Burns, M.J.; Friedler, E.; DeBusk, K.; Fisher-Jeffes, L.N.; Ghisi, E.; Rahman, A.; Furumai, H.; et al. Urban rainwater harvesting systems: Research, implementation and future perspectives. Water Res. 2017, 115, 195–209. [Google Scholar] [CrossRef] [PubMed]
  15. Luo, W.; Chen, M.; Kang, Y.; Li, W.; Li, D.; Cui, Y.; Khan, S.; Luo, Y. Analysis of crop water requirements and irrigation demands for rice: Implications for increasing effective rainfall. Agric. Water Manag. 2022, 260, 107285. [Google Scholar] [CrossRef]
  16. Demuzere, M.; Coutts, A.M.; Göhler, M.; Broadbent, A.M.; Wouters, H.; van Lipzig, N.P.M.; Gebert, L. The implementation of biofiltration systems, rainwater tanks and urban irrigation in a single-layer urban canopy model. Urban Clim. 2014, 10, 148–170. [Google Scholar] [CrossRef]
  17. Petit-Boix, A.; Devkota, J.; Phillips, R.; Vargas-Parra, M.V.; Josa, A.; Gabarrell, X.; Rieradevall, J.; Apul, D. Life cycle and hydrologic modeling of rainwater harvesting in urban neighborhoods: Implications of urban form and water demand patterns in the US and Spain. Sci. Total Environ. 2018, 621, 434–443. [Google Scholar] [CrossRef] [PubMed]
  18. Wu, C.; Li, F.; Feng, P.; Liu, C.; Wang, X. Rainwater harvesting and utilization in facility 657 agriculture and optimization of tomato irrigation stage. Trans. Chin. Soc. Agric. Eng. 2021, 37, 153–162. (In Chinese) [Google Scholar]
  19. Marco, Z.; Elena, A.; Anna, S.; Silvia, T.; Andrea, C. Spatio-temporal cross-validation to predict pluvial flood events in the Metro-politan City of Venice. J. Hydrol. 2022, 612, 128150. [Google Scholar] [CrossRef]
  20. Shadmehri Toosi, A.; Danesh, S.; Tousi, E.G.; Doulabian, S. Annual and seasonal reliability of urban rainwater harvesting system under climate change. Sustain. Cities Soc. 2020, 63, 102427. [Google Scholar] [CrossRef]
  21. Rashid, A.R.M.; Bhuiyan, M.A.; Pramanik, B.; Jayasuriya, N. Life cycle assessment of rain-water harvesting system components—To determine environmentally sustainable design. J. Clean. Prod. 2021, 326, 129286. [Google Scholar] [CrossRef]
  22. Qu, F.; Zhang, Q.; Jiang, Z.; Zhang, C.; Zhang, Z.; Hu, X. Optimizing irrigation and fertilization frequency for greenhouse cucumber grown at different air temperatures using a comprehensive evaluation model. Agr. Water Manag. 2022, 273, 107876. [Google Scholar] [CrossRef]
  23. Feng, Z.; Miao, Q.; Shi, H.; Feng, W.; Li, X.; Yan, J.; Liu, M.; Sun, W.; Dai, L.; Liu, J. Simulation of water balance and irrigation strategy of typical sand-layered farmland in the Hetao Irrigation District, China. Agr. Water Manag. 2023, 280, 108236. [Google Scholar] [CrossRef]
  24. Wan, S.; Kang, Y. Effect of drip irrigation frequency on radish (Raphanus sativus L.) growth and water use. Irrig. Sci. 2006, 24, 161–174. [Google Scholar] [CrossRef]
  25. Schuster-Wallace, C.; Dickson-Anderson, S.; Papalexiou, S.; Ganzouri, A.E. Design and Application of the Tank Simulation Model (TSM): Assessing the Ability of Rainwater Harvesting to Meet Domestic Water Demand. J. Environ. Inform. 2022, 40, 16–29. [Google Scholar] [CrossRef]
  26. Campisano, A.; Modica, C. Appropriate resolution timescale to evaluate water saving and retention potential of rainwater harvesting for toilet flushing in single houses. J. Hydroinform. 2015, 17, 331–346. [Google Scholar] [CrossRef]
  27. Feng, X.-y.; Pu, J.-x.; Liu, H.-j.; Wang, D.; Liu, Y.-h.; Qiao, S.-t.; Lei, T.; Liu, R.-h. Effect of fertigation frequency on soil nitrogen distribution and tomato yield under alternate partial root-zone drip irrigation. J. Integr. Agr. 2023, 22, 897–907. [Google Scholar] [CrossRef]
  28. Guang, J.; Shao, X.; Miao, Q.; Yang, X.; Gao, C.; Ding, F.; Yuan, Y. Effects of Irrigation Amount and Irrigation Frequency on Flue-Cured Tobacco Evapotranspiration and Water Use Efficiency Based on Three-Year Field Drip-Irrigated Experiments. Agronomy 2019, 9, 624. [Google Scholar] [CrossRef]
  29. Valcárcel, M.; Lahoz, I.; Campillo, C.; Martí, R.; Leiva-Brondo, M.; Roselló, S.; Cebol-la-Cornejo, J. Controlled deficit irrigation as a water-saving strategy for processing tomato. Sci. Hortic. 2020, 261, 108972. [Google Scholar] [CrossRef]
  30. Xiang, K.; Li, Y.; Horton, R.; Feng, H. Similarity and difference of potential evapotranspiration and reference crop evapotranspiration—A review. Agr. Water Manag. 2020, 232, 106043. [Google Scholar] [CrossRef]
  31. Zhang, S.; Guo, Y. Stormwater Capture Efficiency of Bioretention Systems. Water Resour. Manag. 2014, 28, 149–168. [Google Scholar] [CrossRef]
  32. GB/T50596; Rainwater Harvesting, Storage, and Utilization Project 2010. National Standard of the People’s Republic of China: Beijing, China, 2010. (In Chinese)
  33. Khaledi-Alamdari, M.; Majnooni-Heris, A.; Fakheri-Fard, A.; Russo, A. Probabilistic climate risk assessment in rainfed wheat yield: Copula approach using water requirement satisfaction index. Agr. Water Manag. 2023, 289, 108542. [Google Scholar] [CrossRef]
  34. Peel, M.C.; McMahon, T.A.; Finlayson, B.L. Variability of annual precipitation and its relationship to the El Niño–Southern Oscillation. J. Clim. 2002, 15, 545–551. [Google Scholar] [CrossRef]
  35. Qi, P.; Tang, X.; Xu, Y.J.; Cui, Z.; Sun, J.; Zhang, G.; Wu, Y.; Jiang, M. Optimizing environmental flow based on a new optimization model in balancing objectives among river ecology, water supply and power generation in a high-latitude river. J. Environ. Manag. 2023, 342, 118261. [Google Scholar] [CrossRef] [PubMed]
  36. Christina, M.; Jones, M.R.; Versini, A.; Mézino, M.; Le Mézo, L.; Auzoux, S.; Soulié, J.C.; Pos-er, C.; Gérardeaux, E. Impact of climate variability and extreme rainfall events on sugarcane yield gap in a tropical Island. Field Crop. Res. 2021, 274, 108326. [Google Scholar] [CrossRef]
  37. Masupha, T.E.; Moeletsi, M.E. The use of Water Requirement Satisfaction Index for assessing agricultural drought on rain-fed maize, in the Luvuvhu River catchment, South Africa. Agr. Water Manag. 2020, 237, 106142. [Google Scholar] [CrossRef]
  38. Allen, R.G.; Pereira, L.S.; Raes, D. Crop evapotranspiration. In FAO Irrigation and Drainage Paper; Springer: Berlin/Heidelberg, Germany, 1998; p. 56. [Google Scholar]
  39. Sample, D.J.; Liu, J. Optimizing rainwater harvesting systems for the dual purposes of water supply and runoff capture. J. Clean. Prod. 2014, 75, 174–194. [Google Scholar] [CrossRef]
  40. Guizani, M. Storm Water Harvesting in Saudi Arabia: A Multipurpose Water Management Alternative. Water Resour. Manag. 2016, 30, 1819–1833. [Google Scholar] [CrossRef]
  41. Devkota, J.; Schlachter, H.; Apul, D. Life cycle based evaluation of harvested rainwater use in toilets and for irrigation. J. Clean. Prod. 2015, 95, 311–321. [Google Scholar] [CrossRef]
  42. Mermoud, A.; Tamini, T.D.; Yacouba, H. Impacts of different irrigation schedules on the water balance components of an onion crop in a semi-arid zone. Agr. Water Manag. 2005, 77, 282–295. [Google Scholar] [CrossRef]
  43. Abdulla, F.A.; Al-Shareef, A.W. Roof rainwater harvesting systems for household water supply in Jordan. Desalination 2009, 243, 195–207. [Google Scholar] [CrossRef]
  44. Nachshon, U.; Netzer, L.; Livshitz, Y. Land cover properties and rain water harvesting in urban environments. Sustain. Cities Soc. 2016, 27, 398–406. [Google Scholar] [CrossRef]
  45. Salem, H.M.; Valero, C.; Muñoz, M.Á.; Gil-Rodríguez, M.; Barreiro, P. Effect of reservoir tillage on rainwater harvesting and soil erosion control under a developed rainfall simulator. Catena 2014, 113, 353–362. [Google Scholar] [CrossRef]
  46. Li, X.-Y.; Gong, J.-D.; Wei, X.-H. In-situ rainwater harvesting and gravel mulch combination for corn production in the dry semi-arid region of China. J. Arid Environ. 2000, 46, 371–382. [Google Scholar] [CrossRef]
  47. Di Chiano, M.G.; Marchioni, M.; Raimondi, A.; Sanfilippo, U.; Becciu, G. Probabilistic Approach to Tank Design in Rainwater Harvesting Systems. Hydrology 2023, 10, 59. [Google Scholar] [CrossRef]
  48. Jing, X.; Zhang, S. Volume calculation and analysis of rainwater collection and utilization reservoir in Beijing. Water Resour. Prot. 2017, 33, 91–97. (In Chinese) [Google Scholar]
  49. Guan, X.; Jiang, P.; Meng, Y.; Qin, H.; Lv, H. Study on Production, Domestic and Ecological Benefits of Reservoir Water Supply Based on Emergy Analysis. Processes 2020, 8, 1435. [Google Scholar] [CrossRef]
  50. Imteaz, M.A.; Shadeed, S. Superiority of water balance modelling for rainwater harvesting analysis and its application in deriving generalised equation for optimum tank size. J. Clean. Prod. 2022, 342, 130991. [Google Scholar] [CrossRef]
  51. Okoye, C.O.; Solyalı, O.; Akıntuğ, B. Optimal sizing of storage tanks in domestic rainwater harvesting systems: A linear programming approach. Resour. Conserv. Recy. 2015, 104, 131–140. [Google Scholar] [CrossRef]
  52. van der Wiel, K.; Bintanja, R. Contribution of climatic changes in mean and variability to monthly temperature and precipitation extremes. Commun. Earth Environ. 2021, 2, 1. [Google Scholar] [CrossRef]
  53. Ekwueme, B.; Agunwamba, J. Trend Analysis and Variability of Air Temperature and Rain-fall in Regional River Basins. Civil Eng. J. 2021, 7, 816–826. [Google Scholar] [CrossRef]
  54. Haque, M.M.; Rahman, A.; Samali, B. Evaluation of climate change impacts on rainwater harvesting. J. Clean. Prod. 2016, 137, 60–69. [Google Scholar] [CrossRef]
  55. Gidey, E.; Dikinya, O.; Sebego, R.; Segosebe, E.; Zenebe, A. Analysis of the long-term agricultural drought onset, cessation, duration, frequency, severity and spatial extent using Vegetation Health Index (VHI) in Raya and its environs, Northern Ethiopia. Environ. Syst. Res. 2018, 7, 13. [Google Scholar] [CrossRef]
  56. Ribeiro, A.F.S.; Russo, A.; Gouveia, C.M.; Páscoa, P. Modelling drought-related yield losses in Iberia using remote sensing and multiscalar indices. Theor. Appl. Climatol. 2019, 136, 203–220. [Google Scholar] [CrossRef]
  57. Zhou, Z.; Liu, Y.; Zhang, M.; Zhang, T.; Wang, Y. Effect of agroclimatic resources change on 675 dry crops in Longdong Yuan. Chin. Agric. Sci. Bull. 2023, 39, 55–60. (In Chinese) [Google Scholar]
  58. Chang, J.; Kan, Y.; Wang, Y.; Huang, Q.; Chen, L. Conjunctive Operation of Reservoirs and Ponds Using a Simulation-Optimization Model of Irrigation Systems. Water Resour. Manag. 2017, 31, 995–1012. [Google Scholar] [CrossRef]
  59. Du, L.; Zheng, Z.; Li, T.; Zhang, X. Effects of irrigation frequency on transportation and accumulation regularity of greenhouse soil salt during different growth stages of pepper. Sci. Hortic. 2019, 256, 108568. [Google Scholar] [CrossRef]
  60. Puértolas, J.; Albacete, A.; Dodd, I.C. Irrigation frequency transiently alters whole plant gas exchange, water and hormone status, but irrigation volume determines cumulative growth in two herbaceous crops. Environ. Exp. Bot. 2020, 176, 104101. [Google Scholar] [CrossRef]
  61. Wang, F.-X.; Kang, Y.; Liu, S.-P. Effects of drip irrigation frequency on soil wetting pattern and potato growth in North China Plain. Agr. Water Manag. 2006, 79, 248–264. [Google Scholar] [CrossRef]
  62. Li, Y.-H.; Tung, C.-P.; Chen, P.-Y. Stormwater Management toward Water Supply at the Community Scale—A Case Study in Northern Taiwan. Sustainability 2017, 9, 1206. [Google Scholar] [CrossRef]
  63. Sadok, W.; Lopez, J.R.; Smith, K.P. Transpiration increases under high-temperature stress: Potential mechanisms, trade-offs and prospects for crop resilience in a warming world. Plant Cell Environ. 2021, 44, 2102–2116. [Google Scholar] [CrossRef] [PubMed]
  64. Kool, D.; Tong, B.; Tian, Z.; Heitman, J.L.; Sauer, T.J.; Horton, R. Soil water retention and hydraulic conductivity dynamics following tillage. Soil Till. Res. 2019, 193, 95–100. [Google Scholar] [CrossRef]
  65. Stahn, H.; Tomini, A. On conjunctive management of groundwater and rainwater. Resour. Energy Econ. 2017, 49, 186–200. [Google Scholar] [CrossRef]
  66. Yan, J.; Wu, Q.; Qi, D.; Zhu, J. Rice yield, water productivity, and nitrogen use efficiency responses to nitrogen management strategies under supplementary irrigation for rain-fed rice cultivation. Agr. Water Manag. 2022, 263, 107486. [Google Scholar] [CrossRef]
Figure 1. Location of the research area.
Agronomy 14 01767 g001
Figure 2. Greenhouse rainwater harvesting, storage, and utilization system.
Agronomy 14 01767 g002
Figure 3. Rainwater tank size under the average daily rainfall of 25 years and reference irrigation scheme scenario-water supply effect.
Agronomy 14 01767 g003
Figure 4. Water demand satisfaction rate of the 8.0 m3 rainwater tank of the kidney bean greenhouse.
Agronomy 14 01767 g004
Figure 5. Influence of irrigation cycle (irrigation frequency) on water supply for an 8.0 m3 rainwater tank.
Agronomy 14 01767 g005
Table 1. Irrigation water quantity and consumption intensity at the different growth stages of greenhouse-grown kidney beans.
StageStart Date–End DateDuration (d)Irrigation Depth (1) (cm)Irrigation
Quota (2) (mm)
Unit Water
Consumption (mm·d−1)
I6.08–6.26192011.40.6
II6.27–7.0374013.82.0
III7.04–7.1294018.82.1
IV7.13–7.22104031.03.1
V7.23–7.3084026.03.3
VI7.31–8.0784027.43.4
VII8.08–8.1694034.03.8
VIII8.17–8.2594031.93.5
IX8.26–9.0394031.33.5
Irrigation stage6.08–9.038840225.62.6
(1) Irrigation depth refers to the planned wetting depth of irrigating the soil. (2) Irrigation quota refers to the water requirement of the kidney bean plant.
Table 2. Yield response coefficient of greenhouse kidney beans at different growth stages.
Growth StageStart Date–End DateDay (d)Ky(1)
Seeding stage6.08–7.03260.2
Flowering—fruit stage7.04–7.22191.1
Fruiting stage7.23–8.16250.75
Picking stage8.17–9.03180.6
Total time6.08–9.03881.15
(1) Ky: yield response coefficient.
Table 3. Annual average precipitation of 25 years and rainwater tank size and water supply effect under the reference irrigation stage (1).
ItemIrrigation Stage
StageIIIIIIIVVVIVIIVIIIIXI–IX
Start date–End date
(m.dd–m.dd)
6.08–6.266.27–7.037.04–7.127.13–7.227.23–7.307.31–8.078.08–8.168.17–8.258.26–9.046.08–9.03
Water demand (m3)2.73.34.57.46.26.68.27.77.554.1
RWH volume (m3)7.73.85.46.86.14.54.95.12.747.0
Supply rate (2) (%)V1292.1241.3177.1107.4118.6109.863.063.967.989.8
V2343.0434.1330.2211.5242.7227.6157.9125.694.0104.1
Demand rate (3) (%)V1100.0100.0100.0100.0100.0100.063.063.967.984.9
V2100.0100.0100.0100.0100.0100.0100.0100.094.099.2
Water scarcity (m3)V10.00.00.00.00.00.03.02.82.48.2
V20.00.00.00.00.00.00.00.00.50.5
Water discharge (m3)V15.00.50.80.00.00.00.00.00.06.4
V20.00.00.00.00.00.00.00.00.00.0
Yield reduction
rate (%)
V10.00.010.820.529.1
V20.00.00.01.81.8
(1) V1, 8 m3 rainwater tank; V2, 15.7 m3 rainwater tank, which is the minimum rainwater tank size that can effectively harvest rainfall throughout the whole growth stage without water discharge under the background of average annual rainfall. (2) Supply rate: the water supply satisfaction rate. (3) Demand rate: the water demand satisfaction rate.
Table 4. Effect of rainwater tank size and water supply on different irrigation cycles under average annual precipitation.
Tank Size (m3)Irrigation Times (Time)Supply Rate (%)Demand Rate
(%)
Water Discharge (m3)Water Scarcity (m3)Yield Reduction Rate (%)
8.09.089.884.97.88.229.1
14.089.886.57.87.327.2
20.089.887.37.86.927.1
35.089.888.27.86.425.1
88.089.889.47.85.722.7
12.09.097.292.33.74.216.6
14.097.293.33.73.312.9
20.097.294.73.72.911.3
35.097.295.63.72.49.3
88.097.296.83.71.76.8
15.79.0104.199.20.00.51.8
14.0104.1100.00.00.00.0
20.0104.1100.00.00.00.0
35.0104.1100.00.00.00.0
88.0104.1100.00.00.00.0
Table 5. Minimum rainwater tank size of undiscarded water under a 4d irrigation cycle in different rainfall years-water supply effect.
ScenariosTypical YearGrowth Rainfall (m3)Water Storage (1) (m3)Minimum Size (2) (m3)Water Scarcity (m3)Supply Rate (%)Yield Reduction Rate (%)
Dry year199718.06.76.132.940.688.0
200230.111.017.214.467.748.5
202233.63.28.422.758.774.9
Normal year200043.215.920.43.897.214.8
200552.612.520.01.3105.84.5
201256.611.918.65.9110.923.2
Wet year1994102.110.553.20.0179.80.0
199587.94.633.50.0146.60.0
199860.819.441.40.0131.30.0
(1) Water storage: the volume of rainwater stored before transplanting. (2) Minimum size: the volume of the rainwater tank without discarding water.
Table 6. Analysis of the effect of rainwater tank size and water supply under a 4-day irrigation cycle (1).
Precipitation Statistical MethodRainwater Tank Size (m3)Supply Rate (%)Demand Rate (%)Water Scarcity (m3)Water Discharge (m3)Water (2) Inventory (m3)Yield Reduction Rate (%)
25 years of mean daily precipitation15.7104.1100.00.00.02.20.0
20-year precipitation at 80% probability (3)8.080.878.711.517.71.841.1
9.083.280.910.416.41.936.7
10.085.583.09.215.12.032.8
12.089.786.67.312.82.429.0
29.5109.495.42.52.28.29.4
53.2113.495.42.50.010.49.4
25 years of annual precipitation (4)8.075.573.814.215.51.648.3
9.077.875.913.114.31.744.5
10.079.977.912.013.11.840.9
12.083.981.410.110.92.039.9
29.5100.989.75.61.86.718.6
53.2104.189.75.60.08.518.6
(1) The content of this section is based on the analysis of three rainfall statistical types. (2) The water inventory refers to the water remaining in the rainwater tank after the kidney bean’s entire growth stage. (3) Arithmetic average is performed after 20 years of calculation of each index, rainwater except rainwater tank size. (4) Arithmetic average is performed after 25 years of calculation of each index and rainwater, excluding rainwater tank size.
Table 7. Effect of rainwater tank size and water supply on rainwater harvesting in the shed area with an 80% precipitation guarantee rate (1),(2).
Area (3)Area (4) RatioHarvesting
rate
(%)
Stacking Water Collection in Sequence
10% Yield Reduction Rate15% Yield Reduction Rate
Size (5)Tank
Size
Water
Scarcity
Water
Discharge
InventoryTank
Size
Water
Scarcity
Water
Discharge
Inventory
(m3)(m3)(m3)(m3)(m3)(m3)(m3)(m3)(m3)
Shed1.085.0-20.32.85.94.917.03.88.03.8
Shed space0.275.0-15.42.816.44.613.53.918.43.7
Road0.175.022.014.52.720.74.713.03.622.54.0
Rooftop 0.190.020.013.52.826.44.712.03.728.13.9
(1) Rainwater harvesting volume: the volume of rainwater harvested 60 days before planting and during the entire growth stage of kidney beans. (2) The data in this table were analyzed based on rain collection in the superimposed shed area and an irrigation cycle of 4 days. (3) The rooftop is made of a colored steel material, which has a higher rainwater harvesting rate than other materials. The road refers to a concrete road surface between sheds. The shed space refers to the space between sheds. (4) The Area ratio is the ratio of the areas of the different components to the area of the shed. (5) Size: tank size required to achieve no yield reduction.
Disclaimer/Publisher’s Note: The statements, opinions and data contained in all publications are solely those of the individual author(s) and contributor(s) and not of MDPI and/or the editor(s). MDPI and/or the editor(s) disclaim responsibility for any injury to people or property resulting from any ideas, methods, instructions or products referred to in the content.

