Abstract
Accurate information regarding crop evapotranspiration (ETc) and its components is essential for proper water management. Salinity has become increasingly serious in many parts of the world, affecting the use of saline water in irrigation for various biochemical processes, hence the importance of understanding the effects of soil and water salinity on ETc. This study aimed to determine the transpiration (Tr) and soil evaporation (Es) components that constitute ETc in tomatoes irrigated by drip irrigation and to investigate the effects of irrigation water salinity levels on ETc and its components, as well as on the crop coefficient (Kc) used to determine ETc. In addition, the reference evapotranspiration (ETo) values determined by the measurements obtained with the lysimeter system were compared with the ETo values calculated using the Almeria (ETo_Alm), FAO Radiation (ETo_FAO-Rad), and Hargreaves (ETo_Harg) models. During the spring growing period of 2022, tomatoes were cultivated under four different irrigation water salinity levels: S0 = 0.7 (control), S1 = 2.5 (low), S2 = 5.0 (medium), and S3 = 7.5 (high) dS m−1. The Tr values in S0, S1, and S2 treatments were measured by the sap flow method. Radiation-based ETo prediction models had strong relationships with lysimeter-measured ETo values (R2 > 0.977 and RMSE < 0.53 mm). The results indicated that increasing salinity levels led to a decrease in both Tr and ETc while causing an increase in Es. In the S0, S1, and S2 treatments, Es accounted for 16.3, 45.0, and 36.2%, respectively. Actual Kc values also decreased with increasing salinity. The results indicate that different actual Kc values can be used when calculating evapotranspiration in decision-making processes in greenhouse tomato production in Antalya and when irrigation water with different salinity levels is used. Additionally, actual ETc responses of tomatoes to salinity can be used to manage saline water in irrigation scheduling.
1. Introduction
Over the last two decades, the global demands for crop production have increased significantly to meet the needs of the rapidly increasing human population [1]. Therefore, water use for agricultural purposes faces increasing competition from non-agricultural uses associated with the lowering of water table levels due to overexploitation of groundwater, overuse of surface water, water pollution, and soil salinization. All these factors threaten the sustainability of agricultural production and require the improvement of irrigation water-saving policies and practices [2].
In agricultural lands, almost all irrigation water is consumed through crop evapotranspiration (ETc), which combines two important phenomena occurring simultaneously in a planted area: transpiration (Tr) and evaporation from the soil (Es) [3], since the amount of water used by plants for metabolic processes is insignificant. The ETc knowledge is an important basis for optimizing irrigation water management strategies and improving crop water efficiency [4] and is necessary for sustainable development and environmentally friendly water management in the Mediterranean region [5].
The soil water balance method [6], weighed lysimeters [7], and sap flow measurement along with micro lysimeters [8] have been widely used to directly measure plant ETc [9]. For a more comprehensive review of these methods, please refer to the literature, including the work by Allen et al. (2011) [10], which provides an extensive overview of alternative techniques. However, direct measurements of ETc are costly and laborious. Therefore, many climate-based models have been developed to predict ETc. The most commonly used models include the Penman-Monteith [11], the Priestley-Taylor [12], the Shuttle-Wallace [13], and the FAO56-crop coefficient (FAO_Kc-ETo) [14].
The FAO_Kc-ETo is the most widely used model in practice for estimating crop water requirements. The model is based on the formula ETc = ETo × Kc [15], which is the product of reference evapotranspiration (ETo) and the crop coefficient (Kc) [16]. ETo represents the evapotranspiration rate from a standardized reference crop, typically grass, under ideal water management and no-stress conditions [15] and can be estimated by numerous models developed using various climatic variables and levels of detail [17]. In general, Kc is estimated as the ratio of ETc to ETo and reflects the comprehensive influence of plant physiology between the reference surface and the real plant at different growth stages [15]. Kc is affected by management strategies like irrigation scheduling as well as plant characteristics at different growth stages, such as leaf area index, leaf physiological characteristics, and plant height [15].
The Kc can be determined by two approaches: single or dual. In the single approach, crop transpiration and evaporation from the soil are combined into a single Kc coefficient, while in the dual approach, Kc is divided into two separate coefficients; one is the basal plant coefficient (Kcb), which represents the transpiration of the plant, and the other is the soil-water evaporation coefficient (Ke), which represents the evaporation on the soil surface and is expressed as Kc = Kcb + Ke [15]. This method, which uses separate estimates of plant and soil elements in the crop coefficient, allows both elements to be observed independently and compared with each other [18]. In FAO 56 [15], Kc and Kcb values are provided in tabular form, corresponding to the three growth stages (initial, mid-season, and late or end of season) of various plants. In addition to the Kc and Kcb values provided by FAO 56 [15], recent updates to these values for several vegetable crops have been published [19], which offer revised estimates and more accurate data for current applications.
The FAO_Kc-ETo method can also be applied to greenhouse plants, where ETo is estimated from the microclimate inside or outside the greenhouse [20]. It was demonstrated that the FAO56-PM equation with a constant aerodynamic resistance of 295 s m−1 is applicable in greenhouses due to the low wind speed [7], and this approach was used to calculate ETo under greenhouse conditions in numerous studies [8,11,21].
Es and Tr have different functions within the agricultural system. Tr is associated with plant growth and yield and plays an important role in photosynthesis and dry matter accumulation in plants. Therefore, it requires more attention [22]. In contrast, Es is generally considered to be a water consumption that has no effect on yield formation and should be reduced as much as possible through plant management practices [23], which can be achieved through agricultural land management, such as applying mulch and using appropriate irrigation techniques [24]. Tr is significantly affected by microclimate and often correlates well with solar radiation, vapor pressure deficit, and air temperature, provided that soil moisture is sufficient [25]. However, the strength of the correlation between plant Tr and microclimate variables can vary depending on the type of plant, the conditions under which it is grown, the moisture content of the soil, and the agricultural methods used [26].
Sap flow sensors are widely used to measure plant transpiration [25]. If the variation in water storage in plants is negligible on a daily scale, then the daily total sap flow is equal to the Tr of the plant [27]. Accurate determination of ETc and its components is critical for developing efficient and sensitive irrigation scheduling and increasing water use efficiency in greenhouses [23].
Lack of precipitation and drought in many parts of the world have reduced the surface water supply for irrigation purposes. This frequently encourages the use of saline water for irrigation [28], which can further increase salt accumulation near the soil surface [29]. Approximately 20% of the world’s irrigated agricultural lands are negatively affected by soil salinization [30], a major environmental problem that threatens agriculture worldwide [31]. Problems related to soil salinization are exacerbated by increasing population and industry, degradation of the natural environment, poor irrigation practices, and climate changes [32]. As a result, the abiotic stresses and resulting nutritional imbalances triggered in plants can negatively affect yield and growth [33]. Improving plant acclimation to abiotic stresses is critical to meet the increasing food demand in sustainable agriculture, especially in an environment where salt water is increasingly used for irrigation in arid and semi-arid regions of the world [33].
Short-term exposure of plants to high salt concentrations causes osmotic stress, making it difficult for the roots to absorb water [34]. This leads to water deficiency, ion imbalance, ion toxicity, or a combination of any of these adverse factors [35]. Salinity-induced water uptake loss is regulated through plant transpiration by reducing stomatal opening and aperture [36]. This reduction is caused by the decrease in soil water potential [37]. Proper irrigation scheduling is fundamental for maximizing yield, and it requires a good understanding of the plant’s response to soil water status [38] and the plant’s tolerance to salinity [39]. In addition, Minhas et al. (2020) [40] provide a detailed study on managing salinity in irrigated agriculture, including a thorough analysis of crop evapotranspiration and water management issues related to salinity.
Tomato (Solanum lycopersicum L.) is a widely cultivated vegetable worldwide, with an annual production of 1.89 × 10⁸ metric tons [41] and an important greenhouse crop in the semi-arid regions of the Mediterranean countries. In these regions, soil and groundwater salinity is a serious problem that affects tomato yield and quality [42]. Although tomatoes are moderately sensitive to salinity and can tolerate soil salinity (EC of saturated paste extract (ECe)) up to 2.0 dS m−1, their growth and yield are reduced at salinity above this level [43].
Numerous studies have been conducted on the calculation/measurement of ETc and its components in tomatoes irrigated with drip irrigation, as well as the effect of soil salinity on ETc. Möller and Assouline (2007) [44] calculated ETo values inside the greenhouse using the FAO 56 method [15], while Fernandez et al. (2010) [7] measured them in drainage-type lysimeters. Both studies concluded that the ETo value varied between 1 and 4 mm day−1. Eliades and Orphanos (1986) [45] determined the ETc of tomatoes in an unheated greenhouse in southern Cyprus using drainage-type lysimeters and found that the potential evapotranspiration varied between 0.5 and 6.7 mm day−1 in tomatoes by multiplying the evaporation from the pan placed outside the greenhouse by coefficients that varied throughout the season. In southern Italy, Quaglietta-Chiaranda and Zerbi (1981) [46] determined the water consumption of tomatoes to be 545 mm in the drainage-type lysimeter in the greenhouse, where the highest yield was obtained by irrigating when the cumulative Class A Pan evaporation was 20 mm. Zhao et al. (2013) [47] found that the water requirements of tomatoes irrigated with drip irrigation under greenhouse conditions increased with growth and decreased in the late-season growth stage, causing the daily ETc to vary between 1.5 and 4.2 mm day−1, and they concluded that mid-season and late-season Kc values, measured as 1.01 and 0.61, respectively, were 5% and 8% lower than the values recommended by FAO. Gallardo et al. (2013) [48] reported that the seasonal water requirements of tomatoes grown in greenhouses in spring and fall were 231 and 260 mm, respectively, and that the initial period, maximum, and late season Kc values were 0.2, 1.4, and 1.0, respectively. Harel et al. (2014) [49] found the Kc of tomatoes grown in greenhouses in Israel to be 0.3–1.0 in winter and 0.2–0.9 in summer for the period between seedling planting and first fruit harvest and 0.8 in both seasons for the last period. In China, the seasonal ETc of tomatoes was found to vary between 249.1 and 388.0 mm under greenhouse conditions, where irrigation was scheduled according to the different levels of pan evaporation [6]. In addition, Gong et al. (2020) [50] determined the dual Kc values of tomatoes by comparing the ETo calculated with different models with the use of sap flow sensors combined with a micro-lysimeter system in one experimental year and the ETc values measured with a weighed lysimeter system in the other experimental year. They reported that the ETc was 345 mm during the entire growth phase for tomatoes irrigated with drip irrigation.
Gong et al. (2020) [51] conducted another study focusing on ETc and Kc values in greenhouse tomatoes under both full and limited water conditions. They determined that the total seasonal ETc ranged from 310 to 350 mm under full irrigation. In addition, they proposed an individual crop coefficient model for predicting ETc that considers factors such as leaf senescence, soil water stress, and canopy cover percentage. In another study, researchers measured the ETc of drip-irrigated tomatoes grown in greenhouses with weighing lysimeters, Es with micro lysimeters, and Tr with a sap flow monitoring system and found that the total seasonal ETc of tomatoes was 315.1–350.8 mm, of which 15.4–26.5% was of Es [23]. It is important to note that the ETc and Kc values presented in these studies are indicative of and influenced by the type of greenhouse used (e.g., plastic vs. glass), particularly due to differences in material transmissivity. Additionally, the internal conditions of the greenhouse, such as temperature and humidity, further impact the ETc.
Regarding salinity, Maggio et al. (2004) [52] compared tomato plants irrigated with 171 mM NaCl and control treatment, observing a decrease in leaf area, root turgor pressure, and root density, and stated that ETc decreased with increasing irrigation water salinity. Tomato plants irrigated with a nutrient solution with a salinity of 9.1 dS m−1 consumed 40% less water than control-irrigated plants, and reductions in plant water uptake with increasing salinity varied between 3.5% and 5% per 1 dS m−1 among different tomato varieties [53]. Yang et al. (2020) [54] reported that while leaf photosynthesis rate, transpiration rate, and stomatal conductance remained unchanged up to an irrigation water salinity of 2 dS m−1; ETc decreased as salinity increased due to reductions in photosynthesis and transpiration rates.
Antalya province accounts for 38% of Türkiye’s greenhouse agricultural area, which totals 82,000 hectares. Tomatoes are the most commonly cultivated crop in greenhouses, accounting for 45% of the total area [55]. In the Mediterranean Region of Türkiye, 20.9% of the irrigation water supply is provided by groundwater [56], with the electrical conductivity (EC) measurements of such waters employed in Antalya’s greenhouses fluctuating between 0.85 dS m−1 and 4.1 dS m−1 in the winter month of November, and between 0.83 dS m−1 and 4.4 dS m−1 during the summer month of June. Evaluations conducted on the soil and the water used for irrigation in Demre’s greenhouses, located in Antalya, revealed that the salinity is categorized within a range from moderate to high range [57].
To enhance water use efficiency through precise irrigation practices and automation in modern irrigated agriculture, it is crucial to separately determine the Tr and Es components of the ETc, as well as understand the effects of salinity on evapotranspiration in the decision-making process for irrigation at varying salinity levels. Therefore, this study aimed to assess the effects of different irrigation water salinity levels on ETc and Kc values by separately evaluating the Tr and Es components in spring tomato cultivation in Mediterranean-type greenhouses. Additionally, this study aimed to test the suitability of radiation-based methods in calculating reference crop evapotranspiration (ETo).
2. Materials and Methods
2.1. Experimental Area
This study was carried out in the spring 2022 growing season in a Mediterranean-type greenhouse with a lysimeter system in Akdeniz University Agricultural Research and Implementation Area in Antalya (TR Türkiye, 36°53′15″ N latitude, 30°38′53″ E longitude; 12 m altitude a.s.l.). The greenhouse had a gothic roof design with a 4 m gutter height and a 6 m ridge height. It was 9.60 m wide and 25 m long and oriented in a north–south direction. It was naturally ventilated from both the side and roof and covered with polyethylene. It was covered with a three-layer polyethylene film of 180 μm thickness with a visible light transmission of 87–89% (Tarım Kredi İmece Plastik A.Ş., Antalya, Türkiye). The greenhouse was unheated and constructed from steel, which is typical of Mediterranean-type greenhouses found in the region. The lysimeters (15 in total) located inside the greenhouse had inner dimensions of 2.70 × 1.85 m and a depth of 0.80 m. It consisted of a top layer of 60 cm of soil and a bottom layer of 20 cm of gravel.
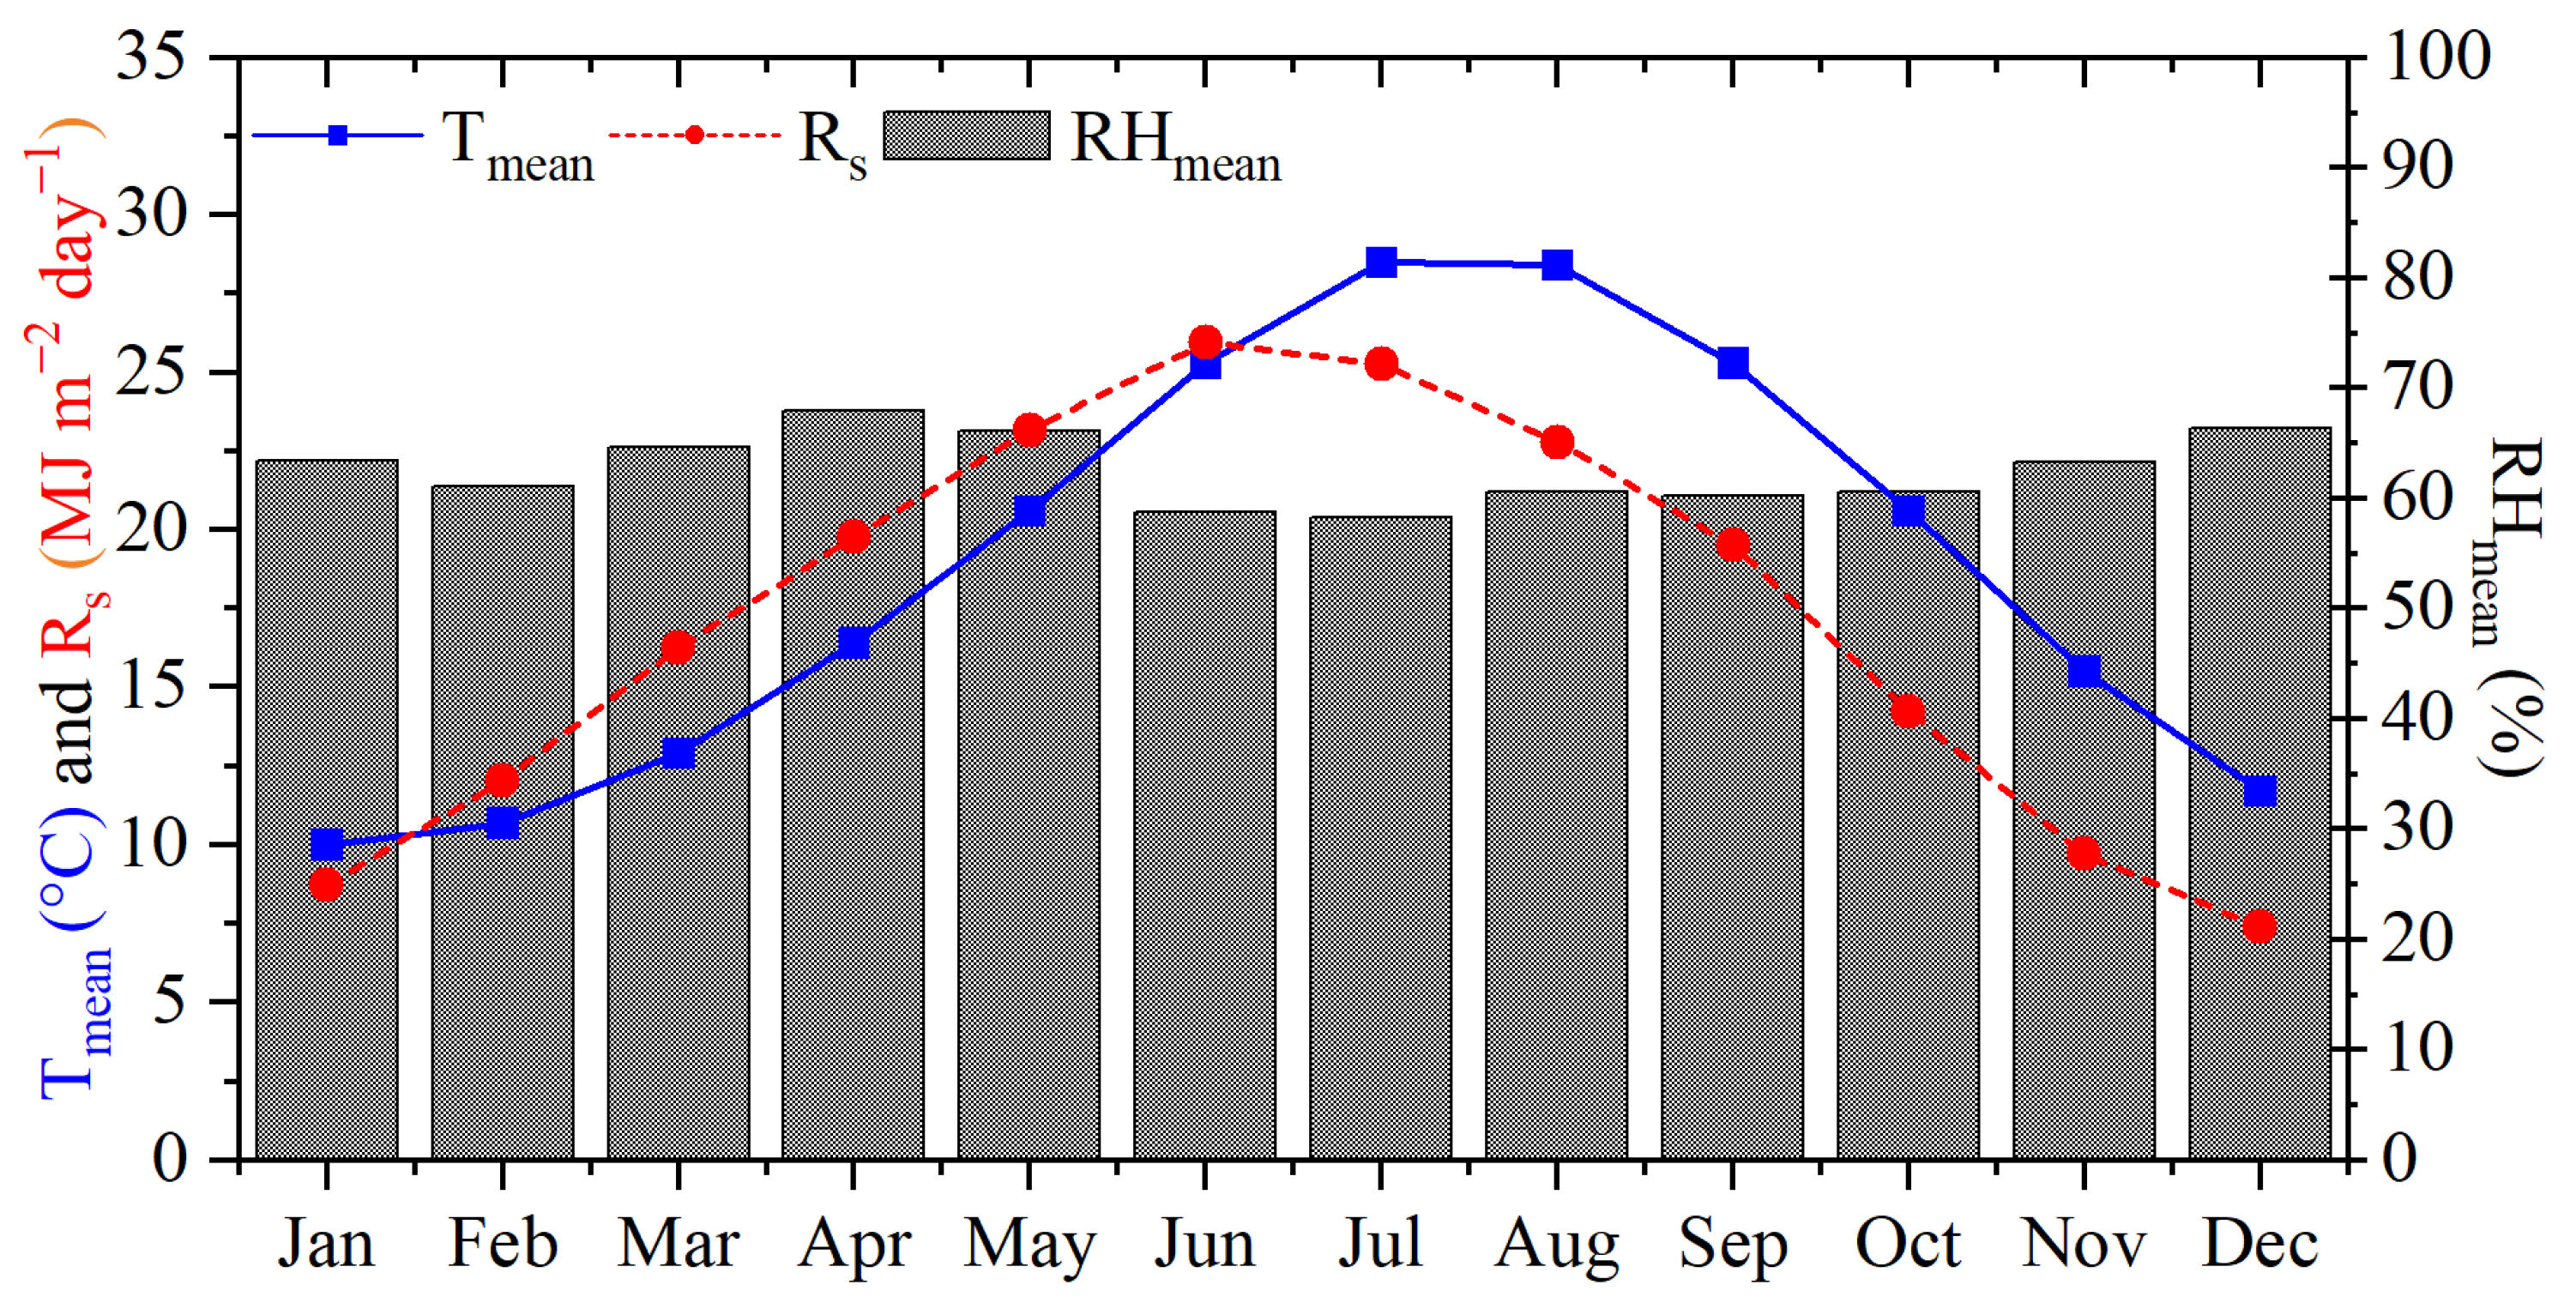
The region is characterized by a Mediterranean climate, experiencing warm, arid summers and rainy winters. Over the long term, the mean annual temperature stands at 18.8 °C, with the coldest and warmest monthly averages being 10.0 °C in January and 28.5 °C in July, as per the 2024 data from the Turkish State Meteorological Service (MGM 2024) (Figure 1).
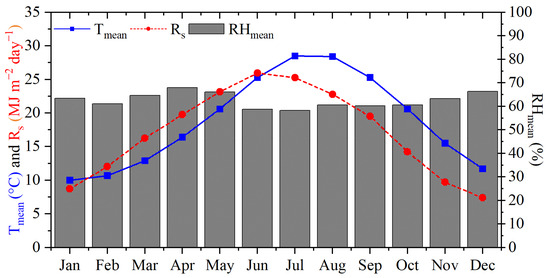
Figure 1.
Long-term climate data for the Antalya Region. Tmean is the average monthly temperature (°C), Rs is the average monthly solar radiation (MJ m−2 day−1), and RHmean is the average monthly relative humidity (%).
2.2. Experimental Conditions, Design and Treatments
This study was conducted between 25 February and 27 June 2022 (122 days) and was arranged as a randomized complete block design with three replications for each salinity treatment. The experiment assessed four levels of irrigation water salinity (S), each characterized by distinct electrical conductivities (ECi): S0 = 0.7 dS m−1 (control), S1 = 2.5 dS m−1 (low), S2 = 5.0 dS m−1 (moderate), and S3 = 7.5 dS m−1 (high). For all salinity treatments, the sodium adsorption rate (SAR) was kept as close as possible to that of the tap water source to eliminate the influence of the SAR on the results. For this purpose, the desired electrical conductivity values (ECw) were prepared in the irrigation water for each treatment by mixing calculated amounts of CaCl2, MgSO4, and NaCl salts, and the ECw values of the treatments were checked in the laboratory [58].
The soil was identified as a silty-clay loam consisting of 51% silt, 28% clay, and 21% sand with a bulk density of 1.38 g cm−3. Additionally, the EC of soil determined by saturation extract was 0.5 dS m−1, with field capacity and permanent wilting point measured at 31% and 14%, respectively. Lysimeter plots were irrigated with a drip irrigation system. The drip irrigation system was configured to ensure that each crop row was serviced by one lateral equipped with pressure-compensating drippers. These drippers discharged water at a rate of 2 L h−1 under a pressure of 0.1 MPa and with a spacing of 0.2 m. The soil water pressure was observed using tensiometers (SR Series, Irrometer Company Inc., Riverside, CA, USA). After calibrating these instruments for the specific characteristics of lysimeter soils, they were installed uniformly in all lysimeter plots on 24 February 2022. The instruments were positioned proximal to the lateral pipes and located 0.10 m from the dripper at a depth of 20 cm. Irrigation applications were performed to replenish soil moisture levels to field capacity when tensiometer readings reached 20 cb (equivalent to 20% depletion of available water) at a depth of 0.60 m in the soil profile. The regulation of the amount of irrigation water was performed using both the water meter integrated into the primary pipeline and the individual valves assigned to each plot. To determine the amount of irrigation water distributed to the lysimeter plots, Equation (1) was used.
where I is the amount of irrigation water (L), Pv(FC) is the field capacity of the soil (cm3 cm−3), Pv(AW) is the available water content in the soil (cm3 cm−3), Ds is the soil depth (mm), A is the parcel area (m2), and Pa is the wetted area percentage (%).
The ÖZKAN F1 variety of tomatoes, which is commonly grown in Antalya, was cultivated in this experiment. The tomato seedlings were planted in lysimeter plots at intervals of 0.60 × 0.50 m. Once the tomato seedlings reached a height of 0.40 m, they were trained on a single stem and supported by ropes. New side shoots were periodically removed throughout the growing period. After eight clusters were formed, the top shoots of the plants were pruned. Leaf pruning was performed according to the method recommended by [59] and in accordance with local growers. The first leaf pruning operation was conducted on 9 May 2022, followed by 6 June 2022. To reduce the light intensity and temperature inside the greenhouse, whitening applications were applied on 22 April 2022 and 28 April 2022. For pollination, Bombus bees (NATUPOL Beehive, Koppert Türkiye, Antalya, Turkey) were placed in the greenhouse.
2.3. Measurements
The greenhouse’s microclimate was monitored using a climate station positioned centrally above the crop canopy. This station was equipped with air temperature (PT100 1/3 Class B, Pessl Instruments, Weiz, Austria), relative humidity (Rotronic hygrometer IN-1, Pessl Instruments, Weiz, Austria), solar radiation sensors (LI-200SZ-IM506D, Pessl Instruments, Weiz, Austria), and net radiation (CNR4, Kipp & Zonen, Delft, The Netherlands). Net radiation data were recorded using a CR1000X data logger (Campbell Scientific, Inc., Logan, UT, USA) with a measuring interval of 5 min and a logging interval of 60 min. All other data were collected through an iMETOS 3.3 data logger (Pessl Instruments, Weiz, Austria) using the same measuring and logging intervals. Quality assessment and control of weather data have been carried out using the Python package agweather-qaqc python [60].
To determine the reference evapotranspiration (ETo), the Tifway Sport Bermudagrass variety, known for its adaptability to greenhouse environments, was cultivated in three lysimeters within the greenhouse. Cultural practices were applied to the grasses based on the characteristics of a standard grass, as recommended by the authors of [15]. The amounts of ETo and ETc were calculated by using the equation for the water balance given in Equation (2) [7].
where ETo is the reference evapotranspiration, (mm), ETc is the crop evapotranspiration (mm) measured between two measurement dates, (SWCt0 − SWCt1) is the change in soil water content between two measurement dates (mm), I is the irrigation water (mm), and D is the total amount of water drained between two measurement dates (mm).
If any, the quantity of drainage water was recorded on a daily basis from the lysimeters. Since this study was conducted in a drainage-type lysimeter, weekly calculations of ETo and ETc values were performed to ensure more accurate results. The mean values of ETo and ETc were derived from lysimeters located at different locations within the greenhouse. To mitigate any potential edge effects, the same plants were cultivated in pots placed between the lysimeters.
ETo was also estimated using three different models commonly used in greenhouses [17], namely the Almeria (ETo_Alm) [7], FAO24-Radiation (ETo_FAO-Rad) [61], and Hargreaves (ETo_Harg) [62] models, which are given in Equations (3)–(5), respectively.
where ETo is the reference evapotranspiration (mm day−1), JD is the Julian days, Rs is the solar radiation (MJ m−2 day−1), Δ is the slope of the saturation vapor pressure temperature relationship (kPa °C−1), γ is the psychrometric constant (kPa °C−1), RH is mean air relative humidity (%), Ud is daytime wind speed (m s−1), Tmax is the maximum daily temperature (°C), Tmin is the minimum daily temperature (°C), and Tavg is the mean daily temperature (°C).
To estimate the plant transpiration, rates of sap flow (Fs, g h−1) of individual plants were measured using the stem heat balance (SHB) technique [63,64]. Fs was continuously monitored on 2–3 plants per treatment, once the plants reached a stem diameter close to sensor one (around 12 mm—25 April 2022) and till the end of the experimental period (growing season) using SHB sap flow sensors (Dynamax Inc., Houston, TX, USA) of stem diameter SGEX13. Sensors were not installed on plants in the S3 treatment due to the data logger’s inadequate capacity for collecting sap flow system data. The sensors were mounted at a height of 0.30–0.40 m above the collar and installed following the manufacturer’s instructions (cfr. https://youtu.be/s7Zz5aNApLI, accessed on 25 July 2024).
Sap flow sensor data were gathered every 30 s using a datalogger (model CR1000, Campbell Scientific Inc., Logan, UT, USA), and the averages over 15 min periods were documented. The sap flow rates (Fs) were derived from the collected data by applying the formulas provided by Baker and van Bavel (1987) [64], utilizing the datalogger’s companion software, PC400 version 4.7 (Campbell Scientific Inc., Logan, UT, USA).
To calculate the Tr per unit of ground area (Tr, mm day−1) for each treatment, the Tr of the entire plant was estimated by summing the Fs contributions from all stems (in the case under consideration, the plants were single stems). The sap flow rate per unit of stem area (Fi; g m−2 h−1) for the ith stem was obtained by dividing its Fs rate (Fsi; g h−1) by the stem area (Asi; m2). The sum of all Fi was multiplied by the ratio of the average stem area at 0.40 m of ten plants per treatment (As-avg; m2) to the ground surface area per plant (SA; m2). Finally, the result was transformed to kg m−2 h−1 and, therefore, to mm of water column per hour (mm h−1), as follows in Equation (6) [65]:
where i = stem number and n = the number of stems per plant. Subsequently, the hourly Tr was cumulated for each day to calculate the daily Tr per unit of ground area (Tr; mm day−1). Additionally, the stem cross-sectional area (As) and its average (As-avg) were determined at a height of 0.40 m using a dendrometer caliper. The SA was predicted based on the plant density of 3 plants m−2. Soil evaporation (E) values were calculated by subtracting Tr values from ETc.
The crop coefficient (Kc) values were calculated as the average over measurement periods using the ETo and ETc values collected from the lysimeters within the greenhouse, as shown in Equation (7) [15].
where Kc is the crop coefficient, ETo is the reference crop evapotranspiration (mm), and ETc is the crop evapotranspiration (mm). Throughout the manuscript, crop evapotranspiration and the crop coefficient in the control treatment (S0) are expressed as ETc and Kc, respectively, whereas under salt stress, they are referred to as actual ETc and Kc, respectively.
To monitor soil salinity, soil samples were collected from the lysimeters monthly throughout the study. Saturated extracts were prepared with each soil sample passed through a 2 mm sieve in air-dry form, and ECe was measured with an EC meter [66].
2.4. Statistical Analysis
The mean differences among the data obtained from different irrigation water salinity levels were assessed using a one-way analysis of variance (ANOVA) after verifying for normality and homoscedasticity through the Shapiro–Wilk and Levene tests, respectively. Subsequently, multiple comparisons (LSD) were performed at a significance level of p < 0.05 to examine these mean differences.
A two-sample t-test was used to compare the ETo values measured from the lysimeter with those predicted by the models. Additionally, a scatter plot was generated to illustrate the distribution of the measured and predicted ETo data around the 1:1 line through linear regression analysis, as detailed in Equation (8).
where y is the measured ETo, x is the predicted ETo, and a is the slope of the fitted line.
The predictive performance of ETo was evaluated using the coefficient of determination (R2) and root mean square error (RMSE) as described in Equations (9) and (10).
where n is the number of observations, Xi is the predicted ETo, Yi is the measured ETo, is the average of the predicted ETo, and Ῡi is the average of the measured ETo. R2 and NSE values equal to 1 and RMSE values equal to 0 indicate the best possible regression relationship. Statistical analyses were performed, and figures were formed using OriginPro v2024 (OriginLab Corporation, Northampton, MA, USA).
3. Results and Discussion
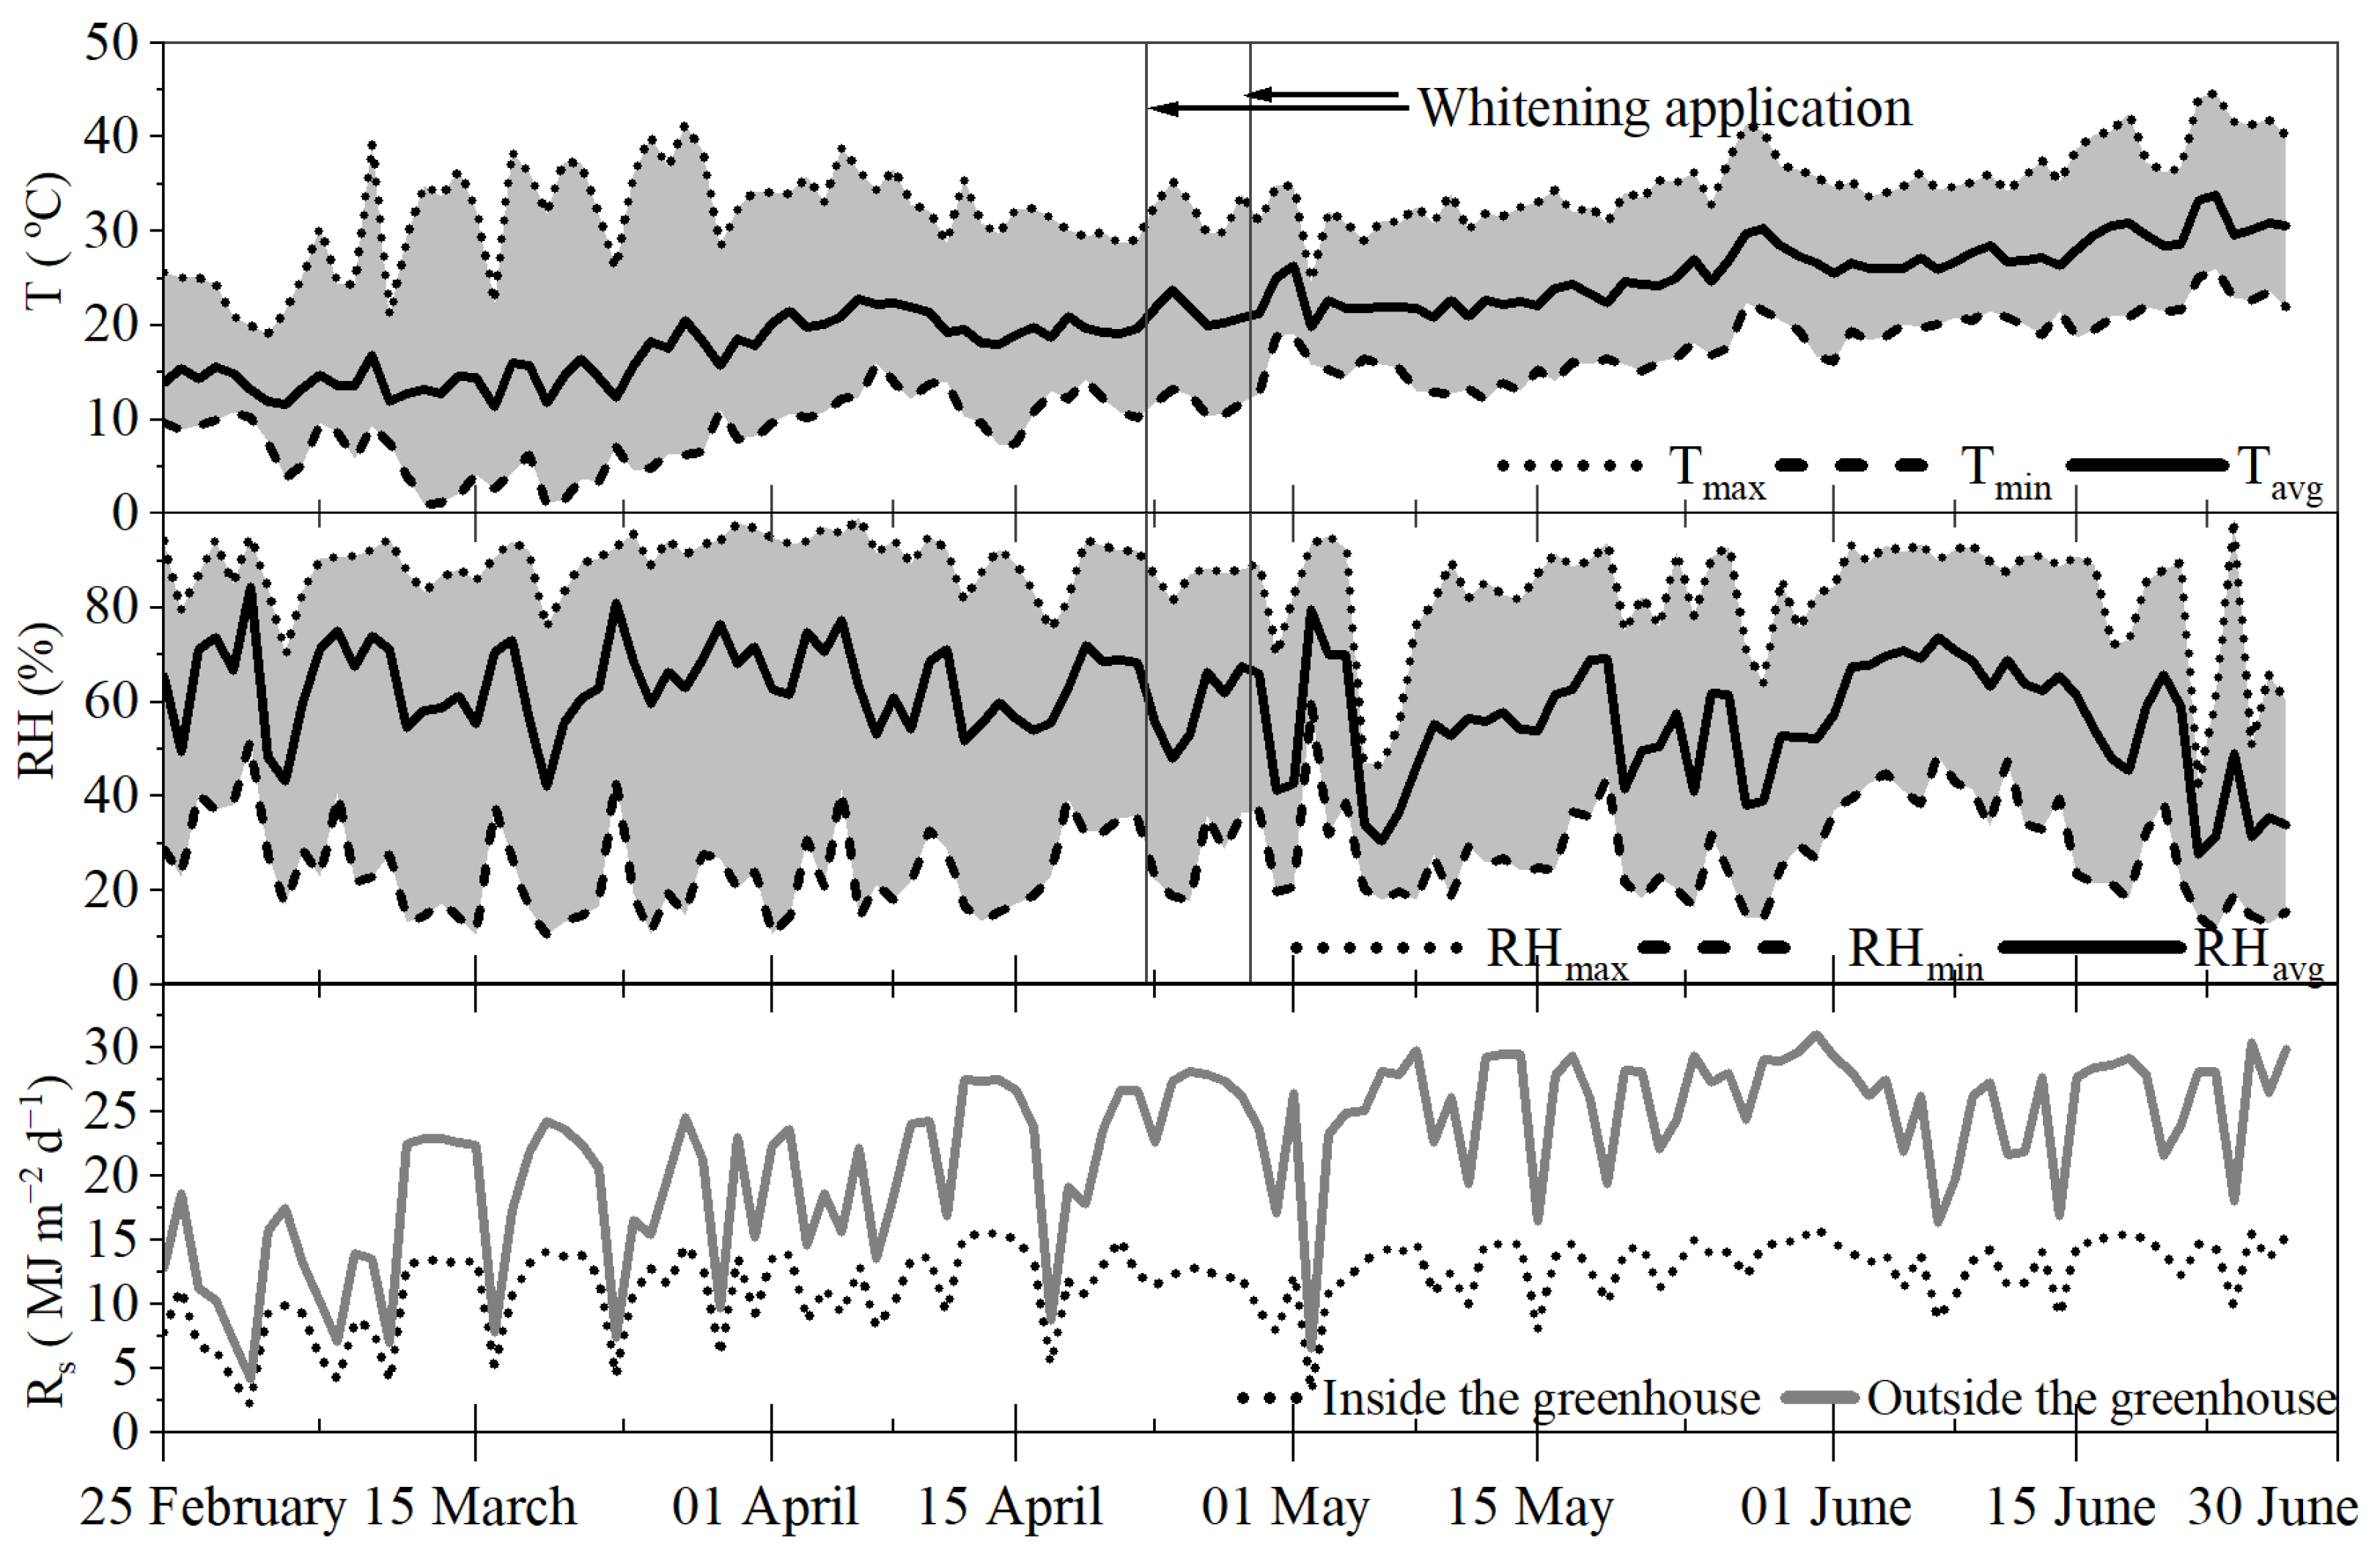
Figure 2 shows the temperatures (Tmax, Tmin, and Tavg) and relative humidity (RHmax, RHmin, and RHavg) inside the greenhouse during the cropping period, as well as the average daily solar radiation inside and outside the greenhouse.
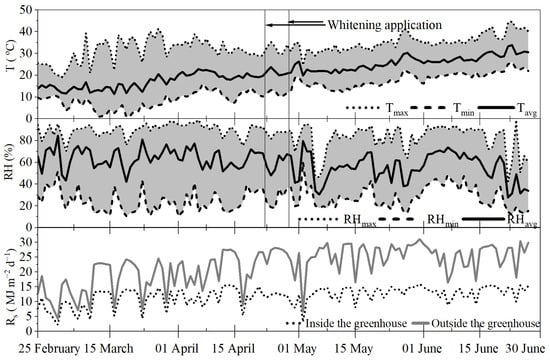
Figure 2.
Diurnal variations in greenhouse temperature (T), relative humidity (RH), and solar radiation (Rs) throughout the cropping period.
The data indicated a consistent increase in both T and Rs throughout the cropping period, which was consistent with the expected pattern for the spring season.
3.1. Soil Salinity
The statistical analysis results of irrigation water salinity and sampling time on soil salinity throughout the experimental period are presented in Table 1.

Table 1.
Comparative assessment of soil salinity responses to varied irrigation water salinity levels and temporal sampling intervals during the cropping period.
Statistical analysis of the soil salinity data showed that there was an interaction between the sampling time (T) and irrigation water salinity level (S) as the main factors (p < 0.01). For this reason, in the evaluation of soil salinity results, each factor was not considered separately but was evaluated as a two-way interaction of the main factors. Naturally, soil salinity increases in parallel with an increase in irrigation water salinity levels. During the cropping period, soil salinity tended to increase more dramatically, especially under moderate and high water salinity treatments [67]. At the beginning of the experiment, the soil in each lysimeter was subjected to leaching to ensure homogeneity in the growing environment, but it was determined that there were slight variations in soil salinity levels at the beginning of the season among the irrigation water salinity treatments. Despite this, sharp differences in the soil salinity values among all irrigation water salinity treatments emerged on 26 April 2022. This significant difference in soil salinity levels among treatments was also observed at the end of the growing season (27 June 2022). Due to increasing salt accumulation in the soil over time, the highest soil salinity values (7.32 and 7.90 dS m−1) were determined on 27 June 2022 under S2 and S3 treatments, without any statistical difference between them (Table 1). It was calculated that soil salinity increased by 3.87, 4.16, 4.79, and 4.12 times under the high, medium, low, and control irrigation water salinity treatments, respectively. At the end of the growing period, soil salinity under S1, S2, and S3 treatments were 1.54, 2.65, and 2.86 times, respectively, of the S0 (control) treatment.
During the growing season, irrigation water salinity was observed to increase significantly towards the end of the growing season compared to the initial sampling date under different conditions categorized as control, low, medium, and high. In scenarios without sufficient leaching, soil salinity tended to increase progressively, even with low-salinity irrigation water [68]. This was attributed to the accumulation of salts in the root zone, as plant uptake of salts is minimal relative to the amount introduced into the soil. In parallel, under non-leaching conditions, soil salinity increased with increasing irrigation volume, which resulted in reduced salinity in the irrigation water itself [69]. Another study showed that at the end of the growing season, the electrical conductivity of the soil extract (ECe) under irrigation water with salinities of 0.6, 2.0, 3.0, 4.0, and 6.0 dS m−1 was 1.73, 2.50, 3.42, 4.11, and 8.38 dS m−1 respectively [54].
3.2. Comparison of Measured and Estimated Reference Evapotranspiration Values
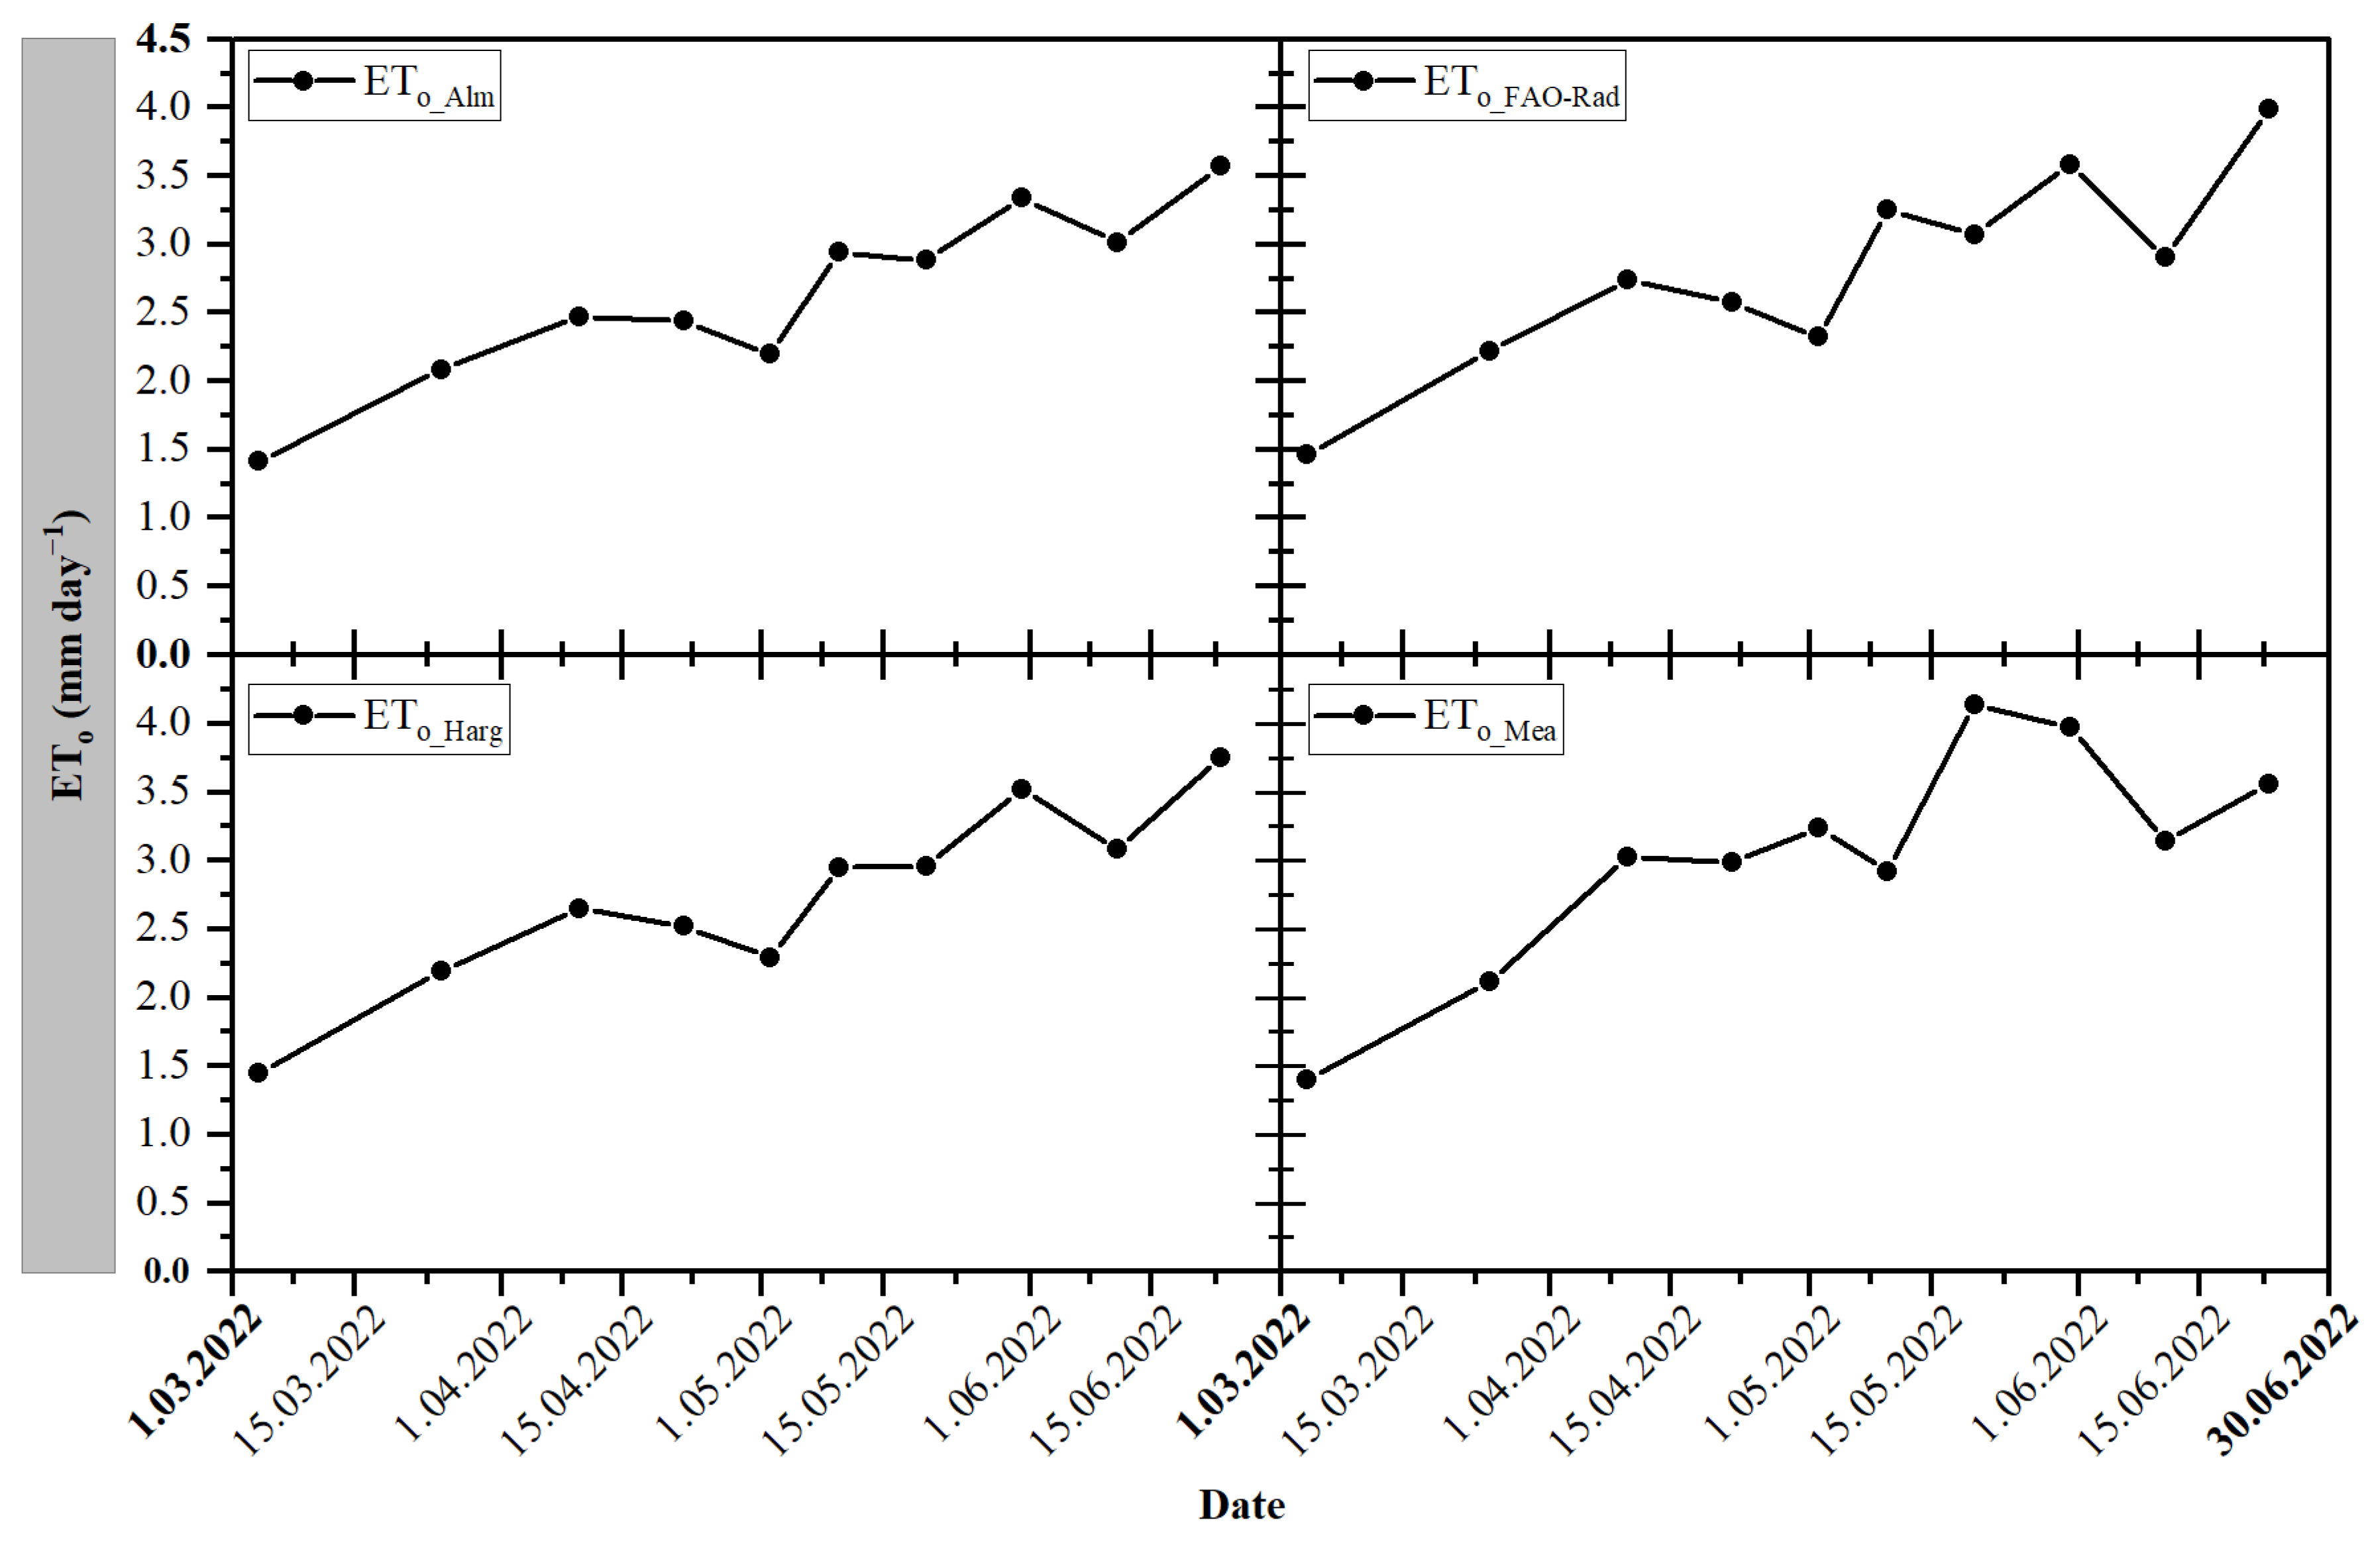
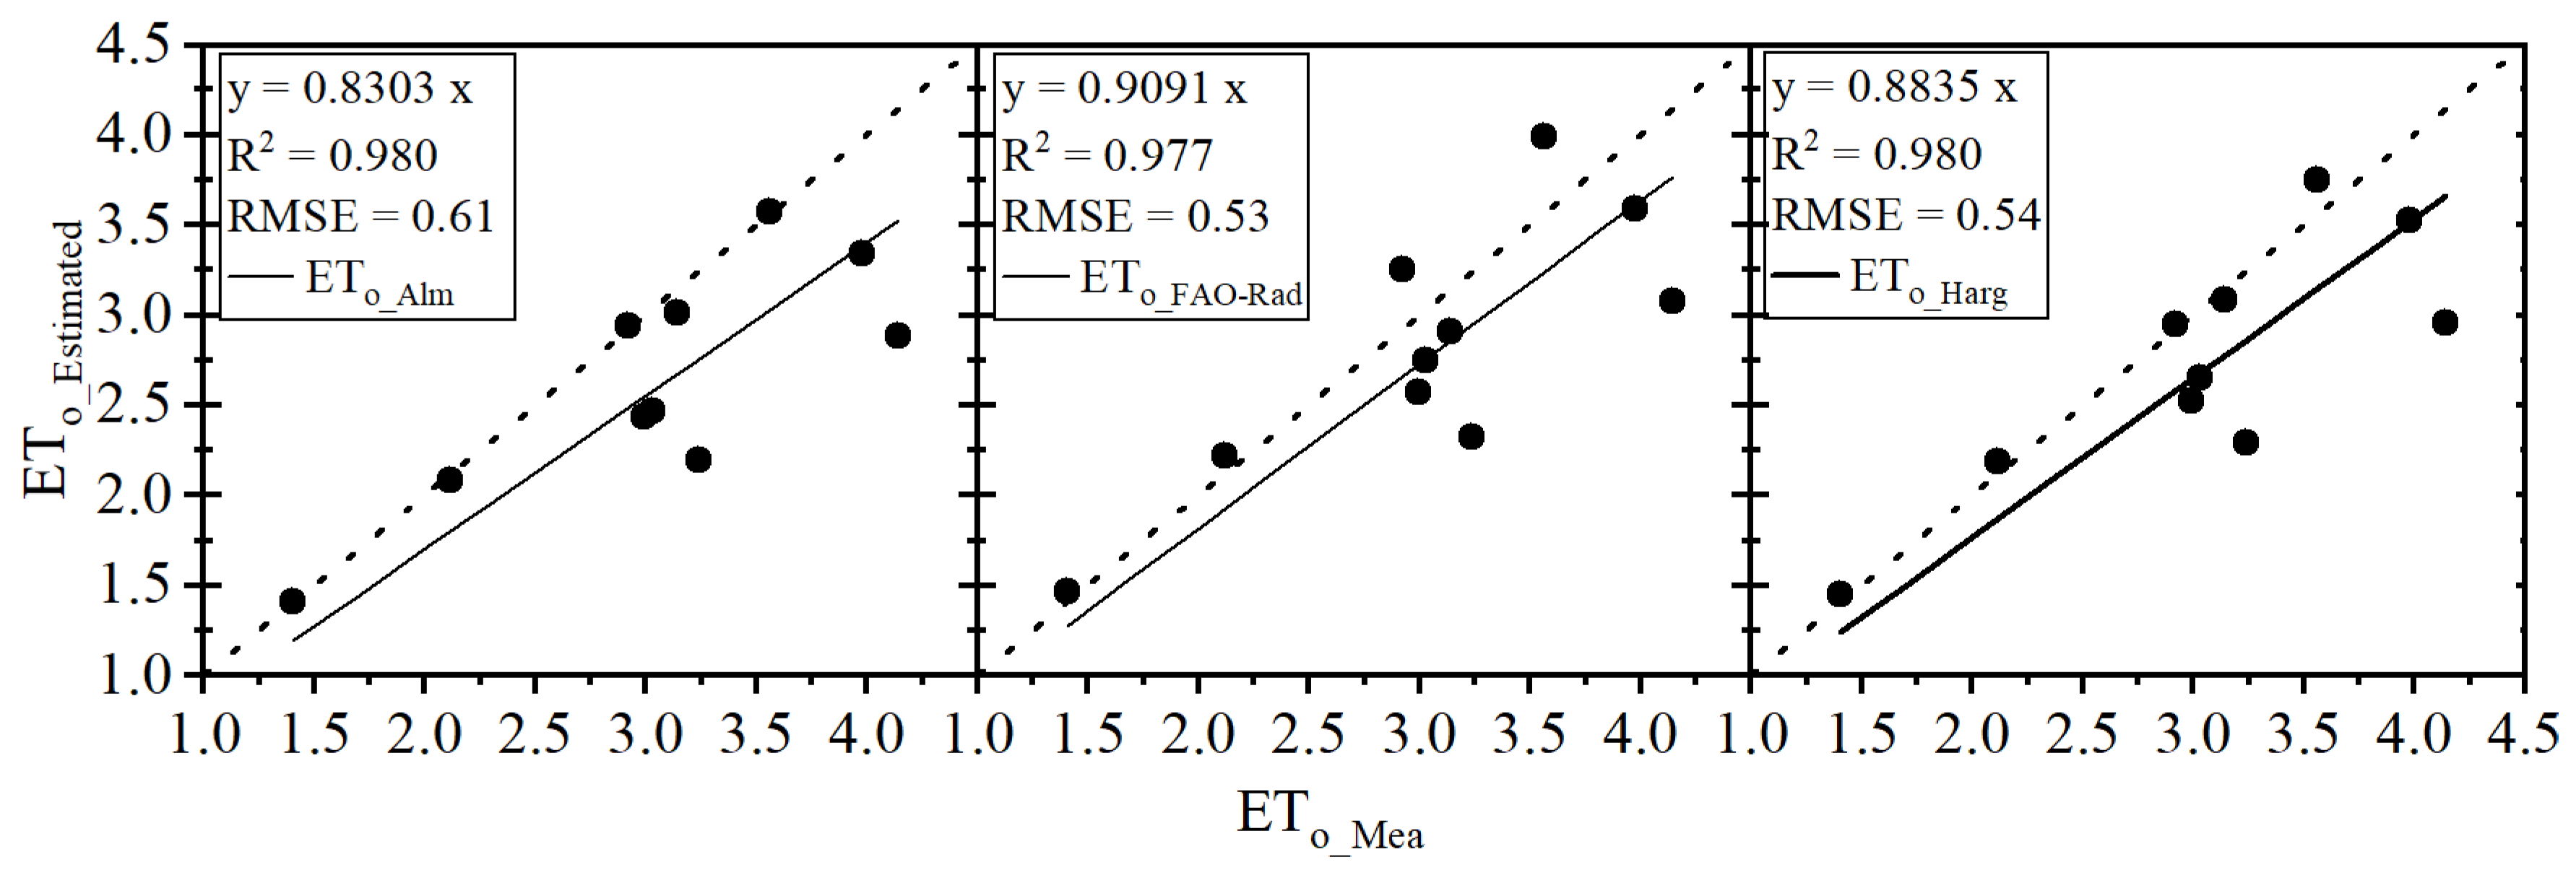
The ETo values measured on lysimeters and those predicted by models during the growing season of tomatoes cultivation under greenhouse conditions are shown in Figure 3. The relationships between the ETo values measured in the greenhouse (ETo_Mea) and those calculated using the Almeria (ETo_Alm), FAO Radiation (ETo_FAO-Rad), and Hargreaves (ETo_Harg) models during the growing season are in Figure 4.
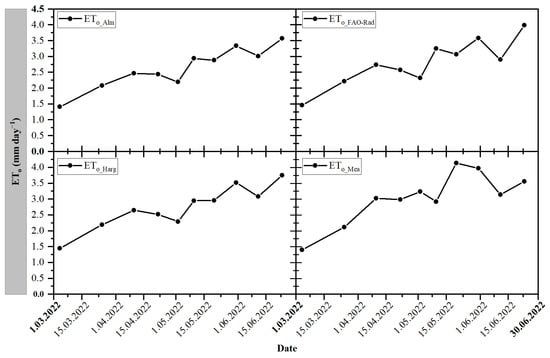
Figure 3.
Reference crop evapotranspiration (ETo) values measured (ETo_Mea) and calculated with Almeria (ETo_Alm), FAO Radiation (ETo_FAO-Rad), and Hargreaves (ETo_Harg) models during the growing season of tomato in the greenhouse.
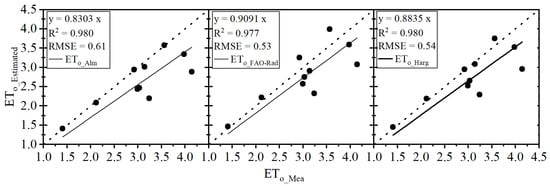
Figure 4.
Average daily reference crop evapotranspiration (ETo) relationships during the growing season, measured (ETo_Mea) and calculated with the Almeria (ETo_Alm), FAO Radiation (ETo_FAO-Rad), and Hargreaves (ETo_Harg) models. The dashed lines represent the 1/1 line of the graph, and the solid lines indicate the slope line.
The daily mean ETo values, both measured and calculated by the Almeria, FAO Radiation, and Hargreaves models, showed similar upward trends throughout the growing season. The measured ETo values varied between 1.41 and 4.14 mm day−1, while the ETo values calculated with the models varied between 1.41 and 3.99 mm day−1 (Figure 3). Generally, the daily ETo value, which reached its maximum in the second half of May, increased again at the end of the season after a slight decrease. The R2 values of the relationships between the measured ETo values and the ETo values estimated by the Almeria, FAO Radiation, and Hargreaves models using the climate values measured in the greenhouse were 0.980, 0.977 and 0.980, respectively, and the RMSE were 0.61 mm, 0.53 mm, and 0.54 mm, respectively. (Figure 4). It can be concluded that the R2 values of all three models are close to each other because they are based on radiation. Additionally, given the results about the good correlations obtained among ETo measured and ETo from models, a very interesting result is that all the models underestimate the ETo measured, but FAO Radiation and Hargreaves are closer than Almeria to 1.
These findings are consistent with Möller and Assouline (2007) [44], who determined that the ETo value inside the greenhouse varies between 1 and 4 mm day−1 from measured meteorological data. It is also consistent with those of Fernandez et al. (2010) [7], who found that ETo values measured in Spain, under similar conditions as in our study, varied from just under 1 mm day−1 in the winter and rising to about 4 mm day−1 during the summer. Finally, they were also consistent with the findings of Gong et al. (2020) [50], who found the daily ETo values to be 3.22 mm d−1 as an average of two experimental years.
On the other hand, the plastic cover of the greenhouse was coated with whitening substances on April 22 and 28. This treatment was applied to shield the plants from solar damage and diminish the internal Tavg and Rs within the greenhouse (Figure 2), which explains the relative decrease in the ETo after the second half of May. Möller and Assouline (2007) [44] used the FAO-56 [15] method to calculate the ETo. Fernandez et al. (2010) [7] compared the values measured in drainage-type lysimeters in a greenhouse with the values they found by calculation and concluded that the best ranking method was FAO 56 Penman-Monteith with a constant aerodynamic resistance (ra) of 150 s m−1, FAO 24 Pan with a constant pan coefficient of 0.79, and the locally calibrated Radiation and Hargreaves Method. Gong et al. (2020) [50] found that Radiation and Pan evaporation models tend to overestimate ETo values, whereas the Penman-Monteith and Priestley-Taylor models provide more accurate predictions for ETo. They concluded that considering its robustness and simplicity, the Priestley-Taylor model would be recommended for estimating ETo for greenhouse tomatoes. Since solar radiation is the most important factor affecting evapotranspiration in the Mediterranean region, it is understandable that radiation-based methods generally provide more accurate results for calculating evapotranspiration. An important advantage of the Hargreaves equation is that it requires fewer climate parameters than other equations [17].
3.3. Measured Crop Evapotranspiration (ETc) and Transpiration (Tr)
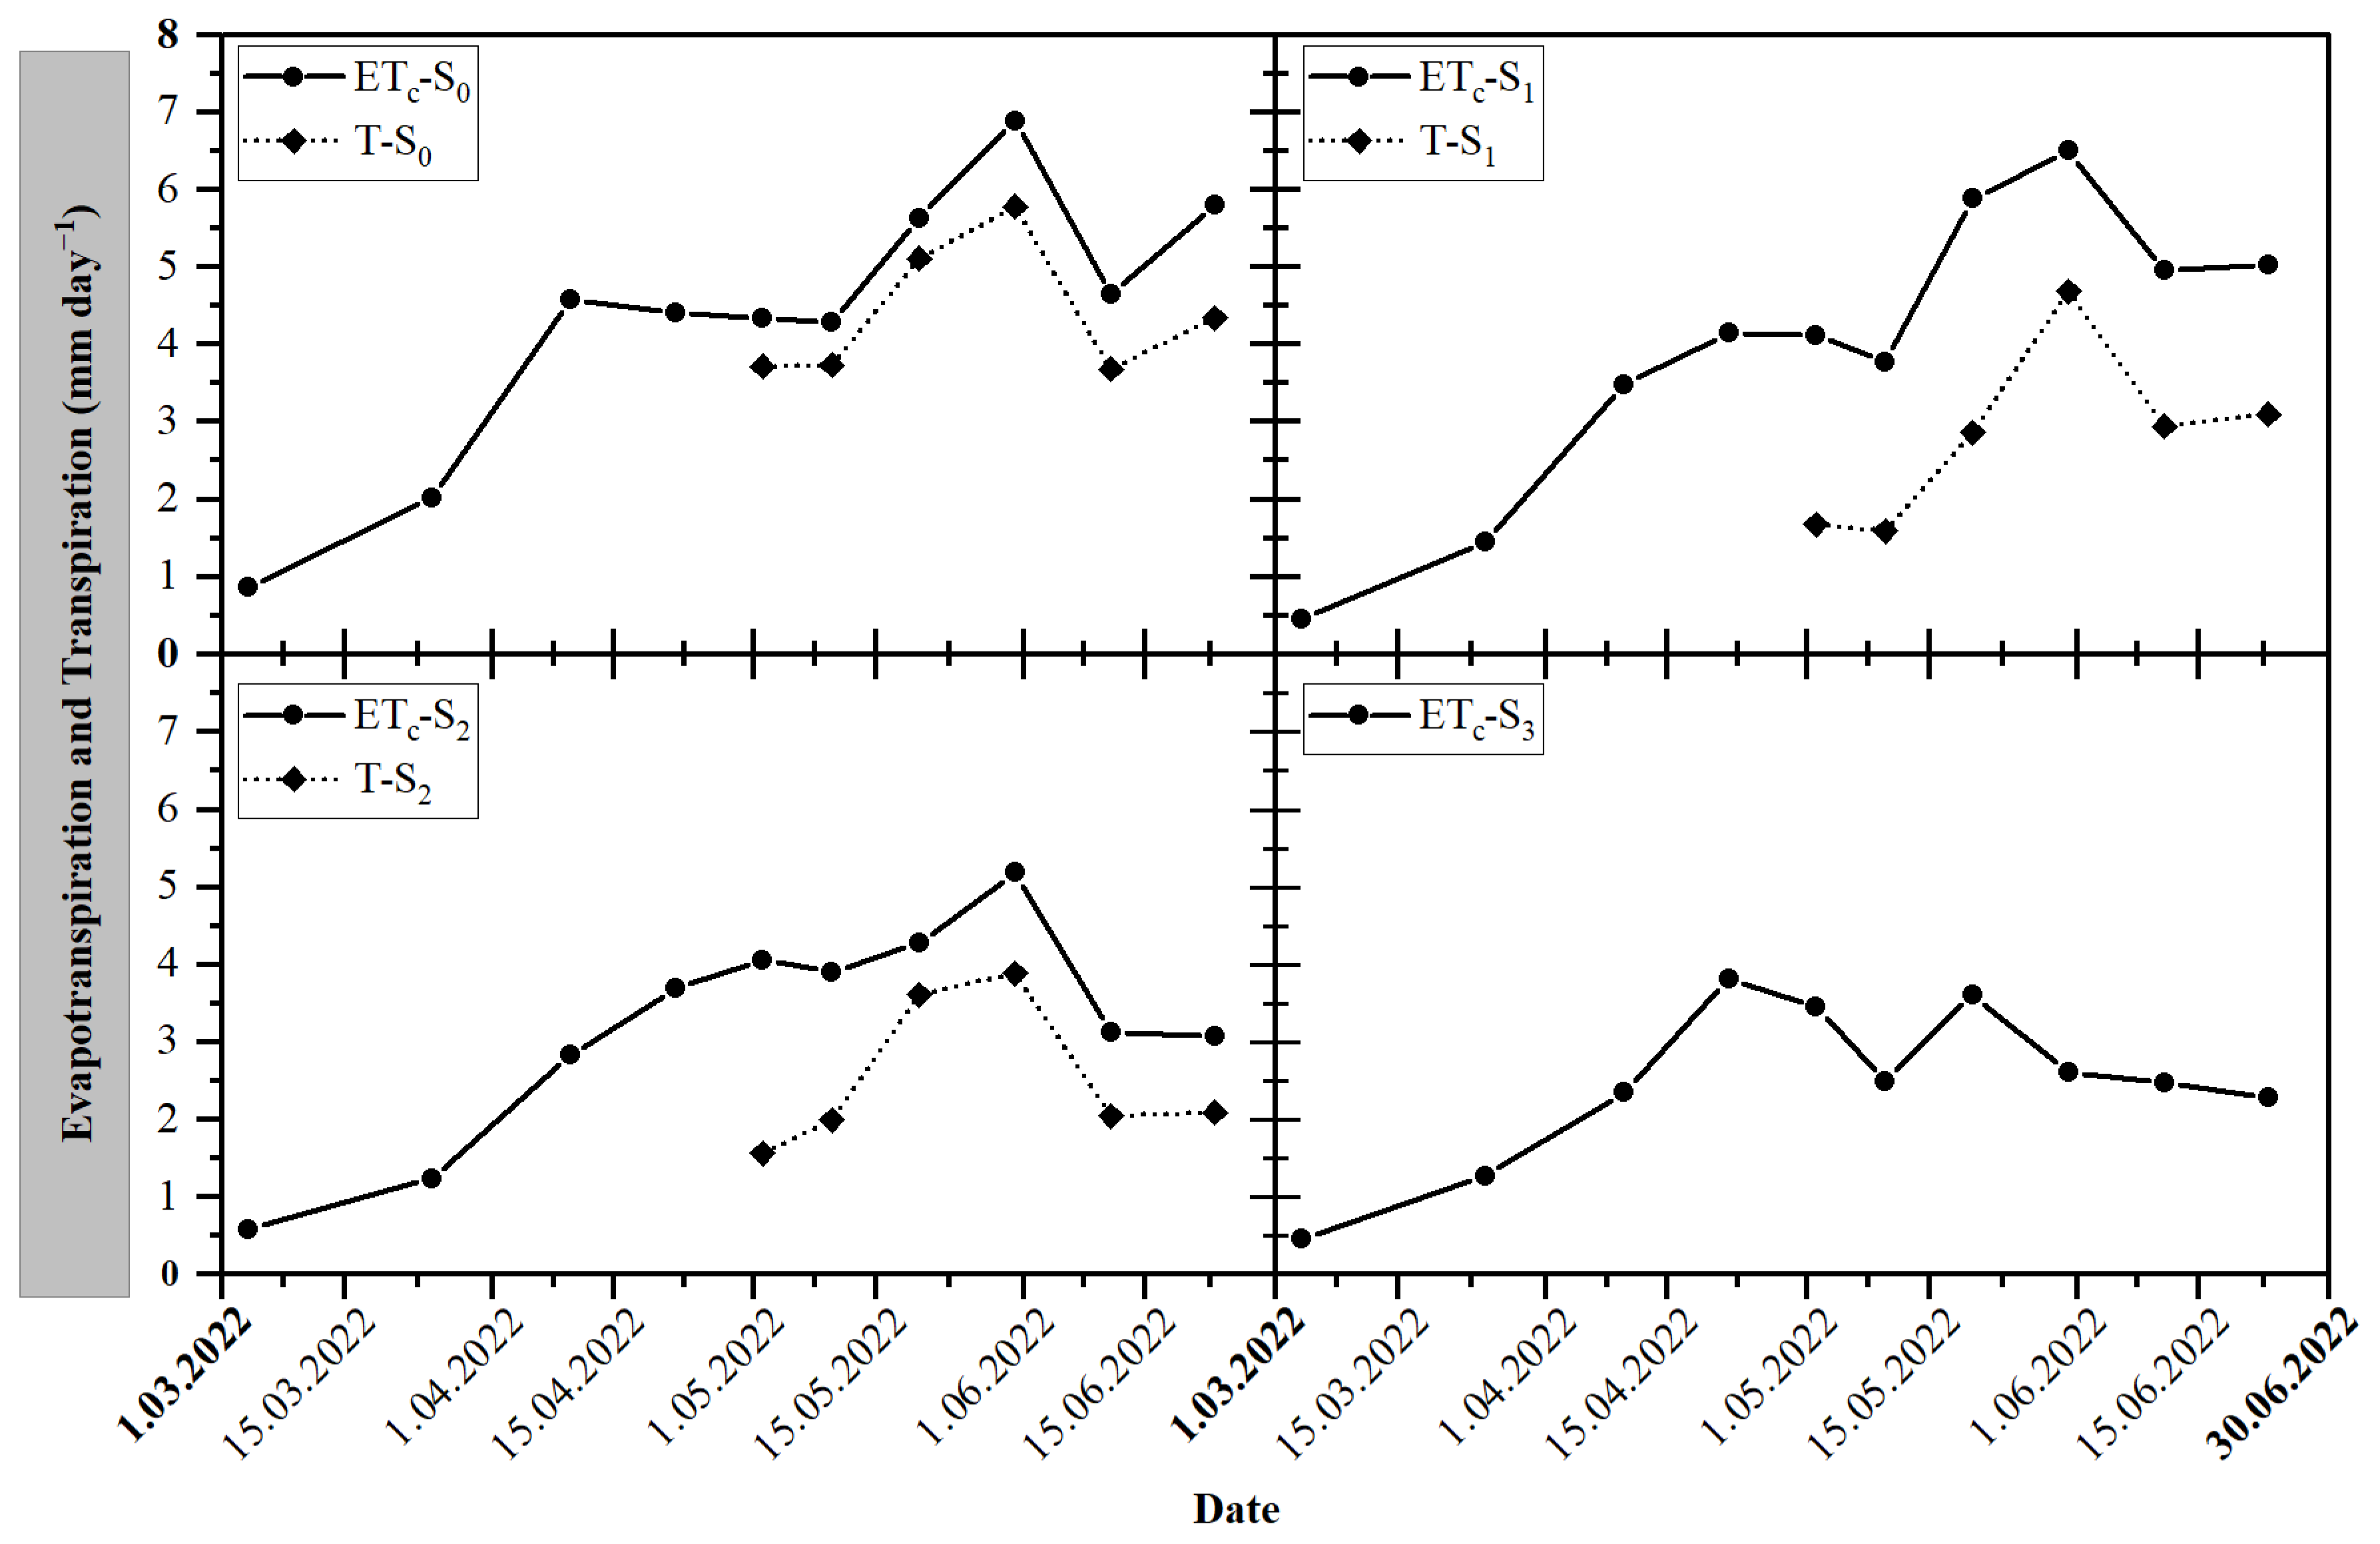
The seasonal daily actual ETc and Tr values of tomatoes at different irrigation water salinities are illustrated in Figure 5. Average daily actual ETc, Tr values, and proportional values of ETc components measured for tomatoes grown under different irrigation water salinities are presented in Table 2.
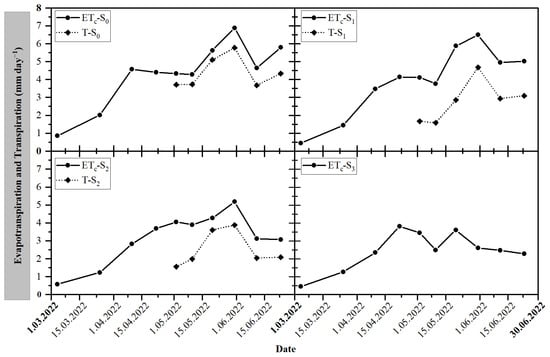
Figure 5.
Seasonal daily actual crop evapotranspiration (ETc) and transpiration (Tr) values of tomatoes under different irrigation water salinities. The S0, S1, S2, and S3 represent the irrigation water levels of 0.7, 2.5, 5.0, and 7.5 dS m−1, respectively.
Table 2.
Throughout the growing season, the transpiration rate (Tr/ETc) and the evaporation rate from the soil (Es/ETc) of tomatoes under different irrigation water salinities. The S0, S1, S2, and S3 represent the irrigation water levels of 0.7, 2.5, 5.0, and 7.5 dS m−1, respectively.
As shown in Figure 2, the increase in plant growth and incoming Rs resulted in a corresponding rise in the average daily actual ETc across all salinity treatments. This trend persisted until the end of the growing period, reaching a peak around June, as depicted in Figure 5. The seasonal average of the actual ETc values varied between 2.48 and 4.35 mm day−1, depending on the irrigation water salinity treatments. The highest average daily actual ETc throughout the season was observed under control conditions (S0 = 0.7 dS m−1), and the lowest average daily actual ETc was observed under high irrigation water salinity (S3 = 7.5 dS m−1) (Figure 5). The daily average actual ETc for low (S1), moderate (S2), and high (S3) irrigation water salinity treatments compared to control (S0) treatment decreased by 8, 26, and 43%, respectively.
Table 2 and Figure 5 indicate that the transpiration rates (Tr/ETc) observed for the control, low, and moderate salinity treatments were 83.68%, 55.00%, and 63.82%, respectively, while the evaporation rate from the soil (Es/ETc) was determined as 16.32, 45.00, and 36.18%. In other words, in general, as salinity increased, the Tr component of actual ETc decreased, and evaporation from the soil increased. With the increase in salinity levels of irrigation water, a decrease in Tr/ETc is observed; however, no clear trend has emerged. Interestingly, in the S2 treatment, an increase in the Tr/ETc was observed, contrary to the expected decrease. Moreover, the decline in the Tr/ETc under the S1 treatment is notably sharp. Actually, the increase observed in the S2 treatment compared to the S1 is due to the sharp decline in the S1 treatment. Tr occurs through the leaves. The leaf area indices for the S1 and S2 treatments do not show a sharp decline when compared to the S0 treatment or when compared to each other. Similarly, there is no significant difference in stomatal conductance between the saline irrigation water treatments [67]. On the other hand, Yang et al. (2022) [70] stated that Tr can be strongly affected by the ambient microclimate, while other researchers [25,71] reported that, in most cases, plant transpiration is well correlated with solar radiation, vapor pressure deficit, and air temperature under adequate soil water conditions. The extant scientific literature offers limited studies addressing the transpiration response of tomatoes or other vegetable crops under greenhouse cultivation. To our knowledge, information on tomato transpiration under saline conditions is scarce. Therefore, further research is needed on the partitioning of Tr on vegetables in general and saline irrigation waters in particular.
In different studies, it has been reported that the seasonal ETc of greenhouse tomatoes varies between 231 and 545 mm [6,23,48,50], and the daily ETc value varies between 0.5 and 6.7 mm day−1 [45,47]. The seasonal total and daily average ETc values under the control irrigation water salinity treatment in this study were within this range (Figure 5). ETc may vary depending on characteristics such as greenhouse growing periods and indoor air conditioning differences. Low-cost, unheated, and naturally ventilated plastic greenhouses, which are common in countries with a Mediterranean climate where the average annual temperature is 10–20 °C, are affected by external weather conditions [67]. Therefore, Rs and Tavg are the driving forces that influence crop growth and increase ETc. However, the use of saline water in irrigation results in a decrease in Tr [72], which ultimately leads to a decrease in ETc. The Tavg and Rs showed an increasing trend from the beginning to the end of the cropping period (Figure 2), causing most of the seasonal ETc to occur during the second half of the spring season [67]. Although there is a similar increasing trend in all salinity treatments, this increasing trend slows as salinity increases. Increasing Tavg and Rs in the last quarter of the cropping period, increased evaporation demand, and continued saline water applications throughout the growing season led to salt accumulation in the plant root zone. Therefore, under medium and high water salinity treatments, tomato plants could not uptake sufficient water from the root zone, causing the daily average of the actual ETc to decrease, thereby decreasing the seasonal total actual ETc (Table 2 and Figure 4). This indicates that increasing salt in the plant root zone and increasing evaporation demand due to greenhouse climate are two factors that constantly affect each other. The physiological drought effect caused by salinity has led to the evaporation of water that cannot be taken up by the crop and used in transpiration as salinity increases. Tomatoes are a moderately salt-sensitive crop, and irrigation with saline water negatively affects their growth and actual ETc [70]. Cumulative crop water uptake was found to decrease with increasing NaCl concentrations in the nutrient solution, and the differences between the treatments increased over time after salinization [73]. It was reported that tomato plants irrigated with a salinity nutrient solution of 9.1 dS m−1 consumed 40% less water than control irrigated plants, and among tomato varieties, the decreases in plant water uptake with increasing salinity varied between 3.5% and 5% per unit salinity [53]. The close negative correlation between plant water consumption and EC revealed that as EC increases, less water is used [54].
In light of the physiological impact of salinity, which can be characterized as a form of physiological drought, it is evident that the soil salinity levels remained consistent with the seasonal ETc values across all salinity treatments. The reduction in water uptake has been attributed to a decline in the hydraulic conductivity of the root system [74] and lower water availability [40]. Furthermore, plants are known to undergo osmotic adaptation mechanisms, characterized by an elevation in solute concentration and a consequent reduction in water potential, aimed at mitigating osmotic imbalances and maintaining cellular turgor [75]. Indeed, studies have demonstrated a linear reduction in evapotranspiration rates in tomato plants in response to alterations in the electrical conductivity of the irrigation water [76,77].
Gong et al. (2019) [21] concluded that under greenhouse conditions, the cumulative soil evaporation in drip-irrigated tomatoes accounted for 25% of the total ETc over the entire growth period, with a gradual reduction observed as canopy cover increased. In a separate study, Gong et al. (2020) [50] employed various measurement techniques, including weighing lysimeters for ETc, micro lysimeters for Es, and a sap flow monitoring system for Tr. Their findings indicated that the Es component constitutes approximately 15.4–26.5% of the total seasonal ETc of tomatoes.
In our study, the Es component, derived by deducting Tr measured via the sap flow method from ETc measured in lysimeters, constituted approximately 16.32% of ETc under the control salinity. This proportion increased due to the evaporation of water that remained unavailable for plants owing to salinity stress, reaching 45.00% and 36.18% in low and medium salinity conditions, respectively. Various methodologies have been used to compute the Es and Tr components of the ETc in prior studies. Zhang et al. (2013) [78] used SIMDualKc, Gong et al. (2019) [21] adopted the Shuttleworth–Wallace Dual vegetation coefficient, and Gong et al. (2021) [23] used the Priestley–Taylor model. Consequently, the Es component of ETc is expected to exhibit variability under diverse environmental contexts, including the influence of different modeling techniques and variations between open-field and greenhouse conditions. Furthermore, the effect of pruning towards the conclusion of the growing season may also be significant. As a matter of fact, the importance of irrigation frequency and plant cover in controlling Es has been emphasized [78]. Notably, Es represents a physical process that is closely correlated with soil moisture dynamics [79]. Nevertheless, the distinct responses of evaporation and yield to osmotic and ionic stresses remain incompletely elucidated [54].
3.4. Change in Crop Coefficient (Kc) Values
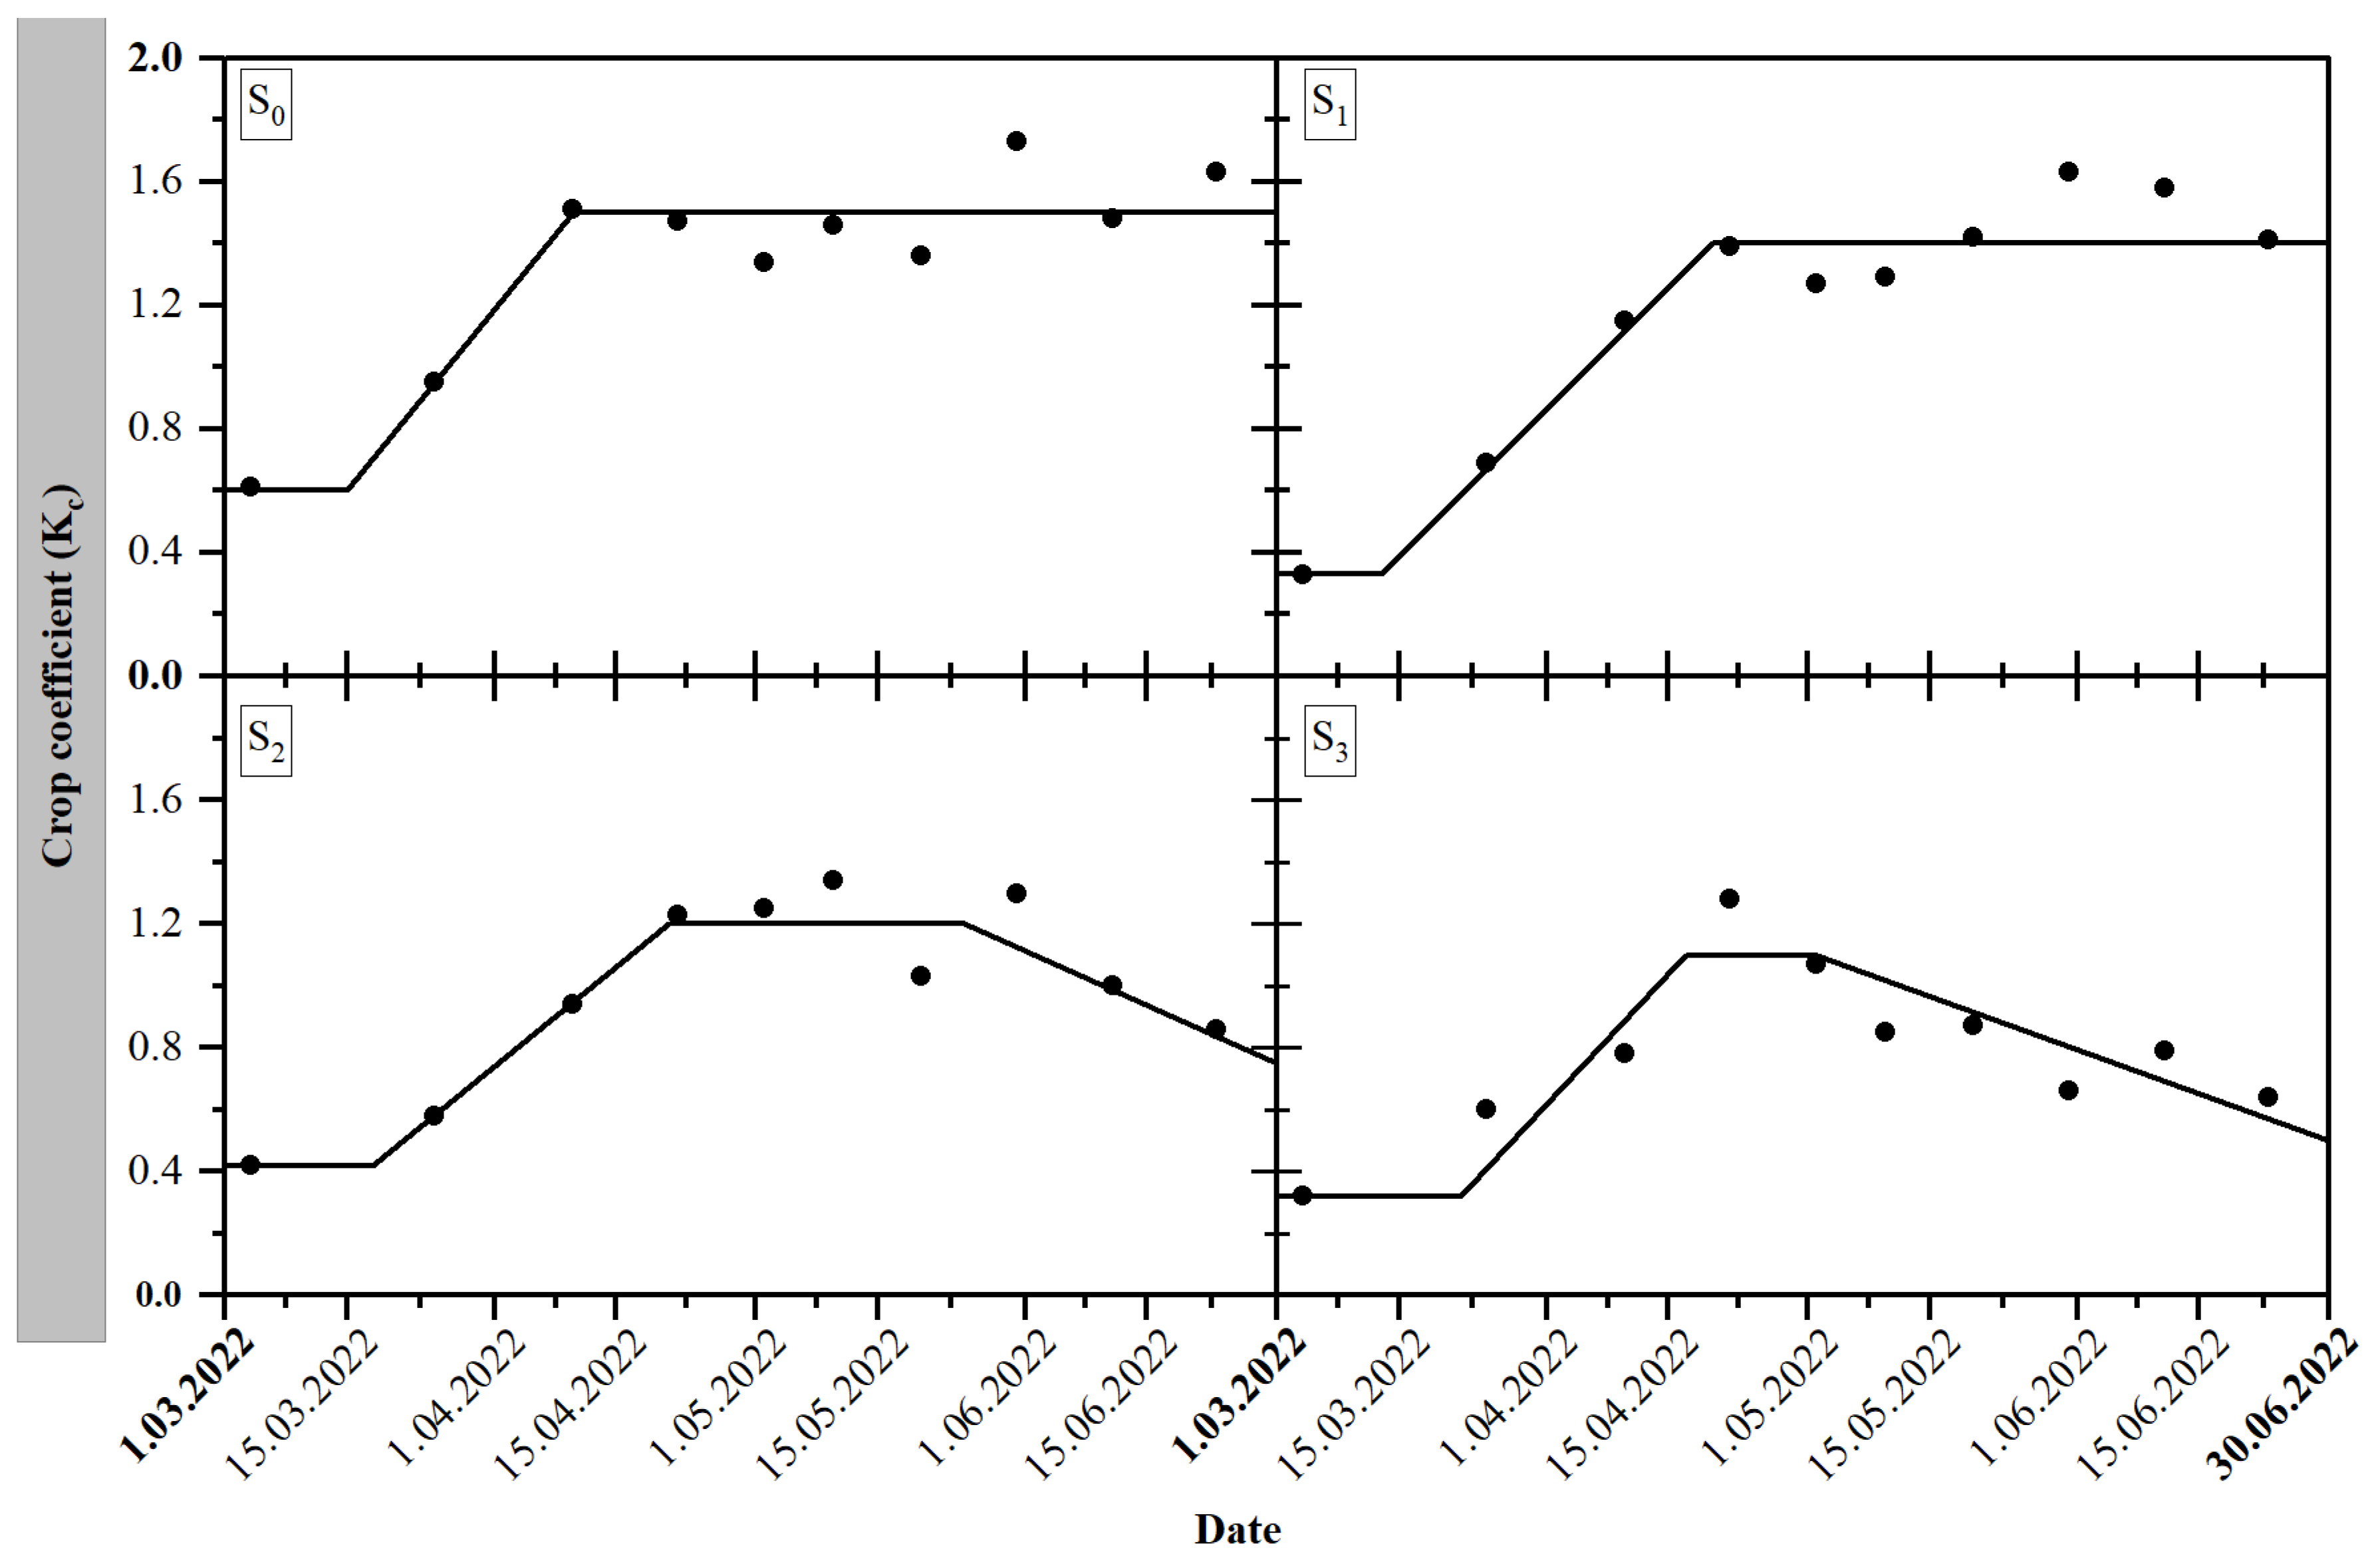
The variation in actual Kc values of tomatoes during the cropping period under different irrigation water salinity treatments is given in Figure 6.
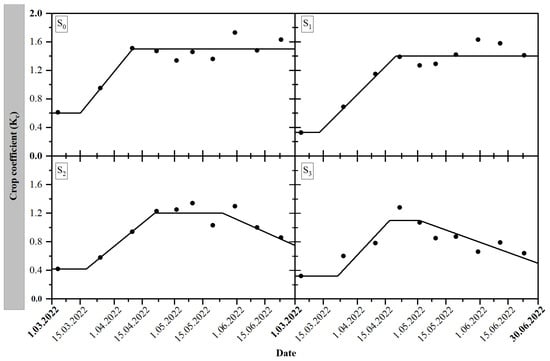
Figure 6.
Change in Kc values of tomatoes under different irrigation water salinities treatments during the growing season. The S0, S1, S2, and S3 represent the irrigation water levels of 0.7, 2.5, 5.0, and 7.5 dS m−1, respectively.
The change in actual Kc values with irrigation water salinity had the same tendency as the change in actual ETc. Under S0, S1, S2, and S3 treatments, the lowest actual Kc values were 0.61, 0.33, 0.42, and 0.32, respectively, whereas the highest values were 1.73, 1.63, 1.34, and 1.28, respectively. The actual Kc values decreased with increasing salinity (Figure 6). The Kc values recommended for outdoor-field tomatoes in FAO56 [15] are given as 0.60, 1.15, and 0.70–0.90 for the beginning, middle, and late periods, respectively. Gallardo et al. (2013) [48] found that under greenhouse conditions in Almeria (Spain), tomatoes had Kc values of 0.2, 1.4, and 1.0 at the initial, maximum, and end-of-season stages, respectively. In their study, Harel et al. (2014) [49] observed Kc values ranging from 0.3 to 1.0 in winter and 0.2 to 0.9 in summer between seedling planting and first fruit harvest, with a consistent value of 0.8 for both seasons in the final growth stage. Zhao et al. (2013) [47] reported Kc values of 1.01 for the mid-season and 0.61 for the late season. Gong et al. (2020) [51] measured Kc values of 0.53, 1.13, and 0.90 for the early, middle, and late stages, respectively, under full irrigation conditions. As can be seen, the Kc values obtained in our study were higher than the mentioned values. Orgaz et al. (2005) [80] determined Kc values for the mid-season and final growth stages of common greenhouse plants (melon, green beans, watermelon, and pepper) under Mediterranean conditions as 0.2, 1.1–1.4, and 0.9–1.2, respectively. They stated that the reason for the high Kc values may be due to the fact that the plants supported with a string are more open-structured and taller, regular pruning creates open canopies, leaf area indexes are higher, and the radiation rate emitted in the greenhouse is high. In a previous study, high LAI values were obtained for the tomatoes [67]. The LAI is a plant characteristic that represents the rate of photosynthesis within the plant canopy, transpiration levels, and overall plant growth, thereby influencing Kc values [15]. Climate conditions can notably influence canopy development rates, particularly during the spring, when weekly temperatures can vary across years. Furthermore, row spacing and plant density after thinning also affect the canopy development rate [81]. Additionally, most plants grown out of season in the greenhouse have to be harvested without being exposed to low temperatures, which causes the maximum Kc values to decrease due to market concerns [48]. Consequently, this accounts for the higher Kc values observed at the end of the season.
In our study, while the decrease in actual Kc values with increasing salinity was not evident at the beginning of the season, actual Kc differences under different salinity treatments became evident towards the end of the season. This phenomenon can be explained by the fact that the physiological drought effect increases over time with the accumulation of salts in the soil, which slows down the plant’s water uptake. As salinity increased, there was a corresponding decrease in actual Kc values, with a similar trend observed in ETc. The seasonal average actual Kc values were determined as 1.35, 1.22, 1.00, and 0.79 in S0, S1, S2, and S3 treatments, respectively. Actual Kc was mainly affected by salinity, greenhouse climate, and phenological stage. A reduction in actual Kc values is indicative of a decrease in actual ETc, which is reflected in a deceleration in plant growth and a less dense canopy [82]. In the context of a high irrigation water salinity treatment, the relatively constant Kc value observed throughout the growing season suggests that plants are affected by high salinity. The differences in the initial crop growth stage and development stage durations between the control (S0) and treatments (S1, S2, and S3) (Figure 6). These differences were attributed to the varying salinity levels of the irrigation water used in each treatment. While plant growth continued until the end of the growing season in both the S0 and S1 treatments, the impact of increased salinity in the S2 and S3 treatments resulted in progressively shorter development stages. Salinity levels negatively affected the crop growth rate, leading to earlier maturation and reduced development periods in the higher salinity treatments (S2 and S3).
A significant limitation of this study is the application of various approaches to estimate the ETo under greenhouse conditions. Unlike open field environments, greenhouses present unique microclimatic conditions, including controlled humidity and significantly lower wind speeds, which affect the accuracy and applicability of standard Kc adjustment formulas, such as those discussed by Allen et al. (2011) [10] and Pereira et al. (2020) [83]. These formulas generally do not exceed the Kc values of 1.20–1.30 in arid and semi-arid climates under open field conditions. However, in greenhouses, the lack of standardization in ETo estimation methods and the presence of local advection conditions or the “clothesline effect” can lead to higher Kc values. The reliance of this study on lysimeter grass ET as a benchmark for comparing various ETo equations highlights the need to develop and validate specific Kc values tailored to greenhouse conditions. Future research should focus on establishing standardized methods for ETo estimation in greenhouses to improve the accuracy of the Kc values and their applicability in controlled environments.
This study provides an in-depth evaluation of different ETo estimation methods in greenhouse environments and offers important insights into their effectiveness and constraints. We believe that several factors mitigate these potential limitations. First, the experiment was conducted under controlled greenhouse conditions to minimize the variability that can arise from external factors, thereby enhancing the consistency and reliability of our results. Second, high-tech sensors were used for monitoring and measurement purposes. These advanced sensors provide high precision and accuracy, thereby ensuring the quality and reproducibility of the collected data. Third, our study focused on tomatoes, which are an annual crop. Because tomatoes are replanted in each growing season, there are no cumulative effects that might vary year by year, as could be the case with perennial crops. However, a notable limitation of this study is that it was conducted within a single crop season. Therefore, under different climatic conditions, the corresponding results may differ from those of the experimental season and do not fully support the conclusions drawn. Expanding the dataset to include multiple crop seasons and varying climatic conditions would provide more robust support for these results. The findings of this study are an initial step towards understanding ETo estimation methods under greenhouse conditions, and further research is necessary to generalize these results across different environments and growing seasons.
4. Conclusions
This study focused on the effects of irrigation water salinity on the Tr and Es components of actual ETc as well as actual Kc values in tomatoes irrigated with the drip irrigation method during the spring growing season. Additionally, the study compared several radiation-based methods used to compute reference evapotranspiration. During the growing period, the average indoor and outdoor temperature and solar radiation generally exhibited an upward trend, influenced by seasonal variations. Soil salinities consistently showed a sharp increase under moderate (5 dS m−1) and high (7.5 dS m−1) treatments, while there was a relatively lower increase under the control (0.7 dS m−1) and low (2.5 dS m−1) treatments. Significant differences in soil salinity under saline irrigation began to exist in the middle of the season. All irrigation water salinity levels caused varying degrees of increase in soil salinity. At the end of the growing season, soil salinity was significantly different among the irrigation water salinity treatments.
Although there was a highly significant linear relationship between the actual ETo values measured on lysimeters under greenhouse conditions and the ETo values calculated by the radiation-based Almeria, FAO Radiation, and Hargreaves models (R2 > 0.977 and RMSE < 0.53 mm), there was no significant difference between the prediction methods of these models. In comparison to the control treatment, the daily average ETc values for the S1, S2, and S3 treatments exhibited reductions of 8%, 26%, and 43%, respectively. In general, the Tr component of actual ETc decreased, and the Es component from the soil increased with increasing water salinity levels throughout the season. The Es/ETc for S0, S1, and S2 treatments were determined as 16.32%, 45.00%, and 36.18%. Kc values followed the same trend as daily actual ETc. As salinity increased, plant coefficient values decreased.
It is, therefore, important to ensure that the correct amount of water is used for irrigation with saline water sources. The ETc of greenhouse tomatoes is highly affected by climatic conditions inside the greenhouse. Therefore, it can be concluded that the Kc values calculated on a local (experimental) basis can be used perfectly in irrigation management applications such as precision irrigation and automation of irrigation, thus making rational use of fresh and saline irrigation water possible and high irrigation efficiency can be achieved.
Author Contributions
Conceptualization, D.B., A.K. and A.N.; methodology, C.K., G.E.A. and R.B.; software, C.K.; validation, C.K., D.B. and A.K.; formal analysis, C.K. and G.E.A.; investigation, C.K., G.E.A. and D.B.; resources, D.B., R.B. and A.N.; data curation, C.K.; writing—original draft preparation, R.B.; writing—review and editing, A.K., C.K., D.B., G.E.A. and A.N.; visualization, C.K. and R.B.; supervision, A.N. and D.B.; project administration, D.B.; funding acquisition, A.N. All authors have read and agreed to the published version of the manuscript.
Funding
This research was funded by the Partnership for Research and Innovation in the Mediter-ranean Area (PRIMA) project: iGUESS-MED “Innovative Greenhouse Support System in the Mediterranean Region: efficient fertigation and pest management through IoT based climate control”. Grant Agreement number: 1916. The PRIMA programme is supported by the European Union under the Horizon 2020 Framework for Research and Innovation.
Data Availability Statement
The datasets analyzed during the current study are available from the corresponding author upon reasonable request.
Conflicts of Interest
The authors declare no conflicts of interest.
References
- Savary, S.; Akter, S.; Almekinders, C.; Harris, J.; Korsten, L.; Rötter, R.; Waddington, S.; Watson, D. Mapping disruption and resilience mechanisms in food systems. Food Secur. 2020, 12, 695–717. [Google Scholar] [CrossRef] [PubMed]
- Fang, Q.X.; Ma, L.; Green, T.R.; Yu, Q.; Wang, T.D.; Ahuja, L.R. Water resources and water use efficiency in the North China Plain: Current status and agronomic management options. Agric. Water Manag. 2010, 97, 1102–1116. [Google Scholar] [CrossRef]
- Kool, D.; Kustas, W.P.; Ben-Gal, A.; Lazarovitch, N.; Heitman, J.L.; Sauer, T.J.; Agam, N. Energy and evapotranspiration partitioning in a desert vineyard. Agric. For. Meteorol. 2016, 218, 277–287. [Google Scholar] [CrossRef]
- Lin, F.F.; Qiu, L.F.; Deng, J.S.; Shi, Y.Y.; Chen, L.S.; Wang, K. Investigation of SPAD meter-based indices for estimating rice nitrogen status. Comput. Electron. Agric. 2010, 715, 60–65. [Google Scholar] [CrossRef]
- Lazzara, P.; Rana, G. The use of crop coefficient approach to estimate actual evapotranspiration: A critical review for major crops under Mediterranean climate. Ital. J. Agrometeorol. 2010, 15, 25–39. [Google Scholar]
- Liu, H.; Duan, A.; Li, F.; Sun, J.; Wang, Y.; Sun, C. Drip Irrigation Scheduling for Tomato Grown in Solar Greenhouse Based on Pan Evaporation in North China Plain. J. Integr. Agric. 2013, 12, 520–531. [Google Scholar] [CrossRef]
- Fernández, M.D.; Bonachela, S.; Orgaz, F.; Thompson, R.; López, J.C.; Granados, M.R.; Gallardo, M.; Fereres, E. Measurement and estimation of plastic greenhouse reference evapotranspiration in a Mediterranean climate. Irrig. Sci. 2010, 28, 497–509. [Google Scholar] [CrossRef]
- Gong, X.; Liu, H.; Sun, J.; Gao, Y.; Zhang, X.; Jha, S.K.; Zhang, H.; Ma, X.; Wang, W. A proposed surface resistance model for the Penman-Monteith formula to estimate evapotranspiration in a solar greenhouse. J. Arid Land 2017, 9, 530–546. [Google Scholar] [CrossRef]
- Zhang, B.; Xu, D.; Liu, Y.; Li, F.; Cai, J.; Du, L. Multi-scale evapotranspiration of summer maize and the controlling meteorological factors in north China. Agric. For. Meteorol. 2016, 216, 1–12. [Google Scholar] [CrossRef]
- Allen, R.G.; Pereira, L.S.; Howell, T.A.; Jensen, M.E. Evapotranspiration Information Reporting: I. Factors Governing Measurement Accuracy. Agric. Water Manag. 2011, 98, 899–920. [Google Scholar] [CrossRef]
- Qiu, R.; Kang, S.; Du, T.; Tong, L.; Hao, X.; Chen, R.; Chen, J.; Li, F. Effect of convection on the Penman-Monteith model estimates of transpiration of hot pepper grown in solar greenhouse. Sci. Hortic. 2013, 160, 163–171. [Google Scholar] [CrossRef]
- Valdés-Gómez, H.; Ortega-Farías, S.; Argote, M. Evaluation of the water requirements for a greenhouse tomato Crop using the Priestley-Taylor method. Chil. J. Agric. Res. 2009, 69, 3–11. [Google Scholar]
- Huang, S.; Yan, H.; Zhang, C.; Wang, G.; Acquah, S.J.; Yu, J.; Li, L.; Ma, J.; Opoku Darko, R. Modeling evapotranspiration for cucumber plants based on the Shuttleworth-Wallace model in a Venlo-type greenhouse. Agric. Water Manag. 2020, 228, 105861. [Google Scholar] [CrossRef]
- Wang, P.; Li, S.; Chen, Q.; Li, X.-Y.; Liu, S.; Wu, X.; Yang, X.; Xu, Z. A novel method for simulating the dynamics of the single and dual maize crop coefficients in an arid ecosystem. Eur. J. Agron. 2023, 142, 126688. [Google Scholar] [CrossRef]
- Allen, R.G.; Pereira, L.S.; Raes, D.; Smith, M. Crop Evapotranspiration: Guidelines for Computing Crop Water Requirements; FAO: Roma, Italy, 1998. [Google Scholar]
- Katerji, N.; Rana, G. Modelling evapotranspiration of six irrigated crops under Mediterranean climate conditions. Agric. For. Meteorol. 2006, 138, 142–155. [Google Scholar] [CrossRef]
- Karaca, C.; Tezcan, A.; Buyuktas, K.; Buyuktas, D.; Bastug, R. Equations developed to estimate evapotranspiration in greenhouses. Yuz. Yıl Univ. J. Agric. Sci. 2018, 28, 482–489. [Google Scholar] [CrossRef]
- Paço, T.A.; Ferreira, M.I.; Conceição, N. Peach orchard evapotranspiration in a sandy soil: Comparison between eddy covariance measurements and estimates by the FAO 56 approach. Agric. Water Manag. 2006, 85, 305–313. [Google Scholar] [CrossRef]
- Pereira, L.S.; Paredes, P.; López-Urrea, R.; Hunsaker, D.J.; Mota, M.; Mohammadi Shad, Z. Standard Single and Basal Crop Coefficients for Vegetable Crops, an Update of FAO56 Crop Water Requirements Approach. Agric. Water Manag. 2021, 243, 106196. [Google Scholar] [CrossRef]
- Harmanto; Salokhe, V.M.; Babel, M.S.; Tantau, H.J. Water requirement of drip irrigated tomatoes grown in greenhouse in tropical environment. Agric. Water Manag. 2005, 71, 225–242. [Google Scholar] [CrossRef]
- Gong, X.; Liu, H.; Sun, J.; Gao, Y.; Zhang, H. Comparison of Shuttleworth-Wallace model and dual crop coefficient method for estimating evapotranspiration of tomato cultivated in a solar greenhouse. Agric. Water Manag. 2019, 217, 141–153. [Google Scholar] [CrossRef]
- Katsoulas, N.; Stanghellini, C. Modelling Crop Transpiration in Greenhouses: Different Models for Different Applications. Agronomy 2019, 9, 392. [Google Scholar] [CrossRef]
- Gong, X.; Qiu, R.; Ge, J.; Bo, G.; Ping, Y.; Xin, Q.; Wang, S. Evapotranspiration partitioning of greenhouse grown tomato using a modified Priestley–Taylor model. Agric. Water Manag. 2021, 247, 106709. [Google Scholar] [CrossRef]
- Allen, R.G.; Pereira, L.S.; Smith, M.; Raes, D.; Wright, J.L. FAO-56 Dual Crop Coefficient Method for Estimating Evaporation from Soil and Application Extensions. J. Irrig. Drain. Eng. 2005, 131, 2–13. [Google Scholar] [CrossRef]
- Hanping, M.; Ullah, I.; Jiheng, N.; Javed, Q.; Azeem, A. Estimating tomato water consumption by sap flow measurement in response to water stress under greenhouse conditions. J. Plant Interact. 2017, 12, 402–413. [Google Scholar] [CrossRef]
- Hayat, M.; Iqbal, S.; Zha, T.; Jia, X.; Qian, D.; Bourque, C.P.-A.; Khan, A.; Tian, Y.; Bai, Y.; Liu, P.; et al. Biophysical control on nighttime sap flow in Salix psammophila in a semiarid shrubland ecosystem. Agric. For. Meteorol. 2021, 300, 108329. [Google Scholar] [CrossRef]
- Brito, P.; Lorenzo, J.R.; González-Rodríguez, Á.M.; Morales, D.; Wieser, G.; Jiménez, M.S. Canopy transpiration of a semi arid Pinus canariensis forest at a treeline ecotone in two hydrologically contrasting years. Agric. For. Meteorol. 2015, 201, 120–127. [Google Scholar] [CrossRef]
- Fernández-García, N.; Martínez, V.; Carvajal, M. Effect of salinity on growth, mineral composition, and water relations of grafted tomato plants. J. Plant Nutr. Soil Sci. 2004, 167, 616–622. [Google Scholar] [CrossRef]
- Duan, R.; Fedler, C.B. Salt management for sustainable degraded water land application under changing climatic conditions. Environ. Sci. Technol. 2013, 17, 10114. [Google Scholar] [CrossRef] [PubMed]
- Qadir, M.; Quillérou, E.; Nangia, V.; Murtaza, G.; Singh, M.; Thomas, R.J.; Drechsel, P.; Noble, A.D. Economics of salt-induced land degradation and restoration. Nat. Resour. Forum 2014, 38, 282–295. [Google Scholar] [CrossRef]
- Hazell, P.; Wood, S. Drivers of change in global agriculture. Philos. Trans. R. Soc. B Biol. Sci. 2008, 363, 495–515. [Google Scholar] [CrossRef]
- Massaretto, I.L.; Albaladejo, I.; Purgatto, E.; Flores, F.B.; Plasencia, F.; Egea-Fernández, J.M.; Bolarin, M.C.; Egea, I. Recovering tomato landraces to simultaneously improve fruit yield and nutritional quality against salt stress. Front. Plant Sci. 2018, 9, 1778. [Google Scholar] [CrossRef]
- Baath, G.S.; Shukla, M.K.; Bosland, P.W.; Steiner, R.L.; Walker, S.J. Irrigation water salinity influences at various growth stages of Capsicum annuum. Agric. Water Manag. 2017, 179, 246–253. [Google Scholar] [CrossRef]
- Munns, R.; Tester, M. Mechanisms of salinity tolerance. Annu. Rev. Plant Biol. 2008, 59, 651–681. [Google Scholar] [CrossRef]
- Zhao, S.; Zhang, Q.; Liu, M.; Zhou, H.; Ma, C.; Wang, P. Regulation of plant responses to salt stress. Int. J. Mol. Sci. 2021, 22, 4609. [Google Scholar] [CrossRef]
- Albaladejo, I.; Meco, V.; Plasencia, F.; Flores, F.B.; Bolarin, M.C.; Egea, I. Unravelling the strategies used by the wild tomato species Solanum pennellii to confront salt stress: From leaf anatomical adaptations to molecular responses. Environ. Exp. Bot. 2017, 135, 1–12. [Google Scholar] [CrossRef]
- Poór, P.; Borbély, P.; Czékus, Z.; Takács, Z.; Ördög, A.; Popović, B.; Tari, I. Comparison of changes in water status and photosynthetic parameters in wild type and abscisic acid-deficient sitiens mutant of tomato (Solanum lycopersicum cv. Rheinlands Ruhm) exposed to sublethal and lethal salt stress. J. Plant Physiol. 2019, 232, 130–140. [Google Scholar] [CrossRef]
- Li, J.; Song, J.; Li, M.; Shang, S.; Mao, X.; Yang, J.; Adeloye, A.J. Optimization of irrigation scheduling for spring wheat based on simulation-optimization model under uncertainty. Agric. Water Manag. 2018, 208, 245–260. [Google Scholar] [CrossRef]
- Theiveyanathan, S.; Benyon, R.G.; Marcar, N.E.; Myers, B.J.; Polglase, P.J.; Falkiner, R.A. An irrigation-scheduling model for application of saline water to tree plantations. For. Ecol. Manag. 2004, 193, 97–112. [Google Scholar] [CrossRef]
- Minhas, P.S.; Ramos, T.B.; Ben-Gal, A.; Pereira, L.S. Coping with Salinity in Irrigated Agriculture: Crop Evapotranspiration and Water Management Issues. Agric. Water Manag. 2020, 227, 105832. [Google Scholar] [CrossRef]
- FAOSTAT Crops and Livestock Products. Available online: https://www.fao.org/faostat/en/#data/QCL (accessed on 7 August 2023).
- Cuartero, J.; Fernández-Muñoz, R. Tomato and salinity. Sci. Hortic. 1998, 78, 83–125. [Google Scholar] [CrossRef]
- Shalhevet, J.; Yaron, B. Effect of soil and water salinity on tomato growth. Plant Soil 1973, 39, 285–292. [Google Scholar] [CrossRef]
- Möller, M.; Assouline, S. Effects of a shading screen on microclimate and crop water requirements. Irrig. Sci. 2007, 25, 171–181. [Google Scholar] [CrossRef]
- Eliades, G.; Orphanos, P.I. Irrigation of tomatoes grown in unheated greenhouses. J. Hortic. Sci. 1986, 61, 95–101. [Google Scholar] [CrossRef]
- Quaglietta Chiarandà, F.; Zerbi, G. Effect of irrigation regimen on yield and water consumption of greenhouse tomato grown in lysimeters. Acta Hortic. 1981, 119, 179–190. [Google Scholar] [CrossRef]
- Zhao, W.; Li, J.; Wang, Z.; Li, Y. Engineer Developing crop coefficients and pan coefficient for greenhouse-grown tomato under drip irrigation. In Proceedings of the ASABE (American Society of Agricultural and Biological Engineers) Annual International Meeting Presentation, Kansas City, MO, USA, 21–24 July 2013; American Society of Agricultural and Biological Engineers: Kansas City, MO, USA, 2013. [Google Scholar]
- Gallardo, M.; Thompson, R.B.; Fernández, M.D. Water requirements and irrigation management in Mediterranean greenhouses: The case of the southeast coast of Spain. In Good Agricultural Practices for Greenhouse Vegetable Crops—Principles for Meditterranean Climate Areas; Baudoin, W., Nono-Womdim, R., Lutaladio, N., Hodder, A., Castilla, N., Leonardi, C., De Pascale, S., Qaryouti, M., Eds.; Food and Agriculture Organization of the United Nations: Rome, Italy, 2013; pp. 109–136. [Google Scholar]
- Harel, D.; Sofer, M.; Broner, M.; Zohar, D.; Gantz, S. Growth-Stage-Specific Kc of greenhouse tomato plants grown in semi-arid mediterranean region. J. Agric. Sci. 2014, 6, 132–142. [Google Scholar] [CrossRef]
- Gong, X.; Wang, S.; Xu, C.; Zhang, H.; Ge, J. Evaluation of several reference evapotranspiration models and determination of crop water requirement for tomato in a solar greenhouse. HortScience 2020, 55, 244–250. [Google Scholar] [CrossRef]
- Gong, X.; Qiu, R.; Sun, J.; Ge, J.; Li, Y.; Wang, S. Evapotranspiration and crop coefficient of tomato grown in a solar greenhouse under full and deficit irrigation. Agric. Water Manag. 2020, 235, 106154. [Google Scholar] [CrossRef]
- Mori, M.; Amato, M.; Di Mola, I.; Caputo, R.; Quaglietta Chiarandà, F.; Di Tommaso, T. Productive behaviour of “cherry”-type tomato irrigated with saline water in relation to nitrogen fertilisation. Eur. J. Agron. 2008, 29, 135–143. [Google Scholar] [CrossRef]
- Reina-Sánchez, A.; Romero-Aranda, R.; Cuartero, J. Plant water uptake and water use efficiency of greenhouse tomato cultivars irrigated with saline water. Agric. Water Manag. 2005, 78, 54–66. [Google Scholar] [CrossRef]
- Yang, H.; Du, T.; Mao, X.; Shukla, M.K. Modeling tomato evapotranspiration and yield responses to salinity using different macroscopic reduction functions. Vadose Zone J. 2020, 19, e20074. [Google Scholar] [CrossRef]
- TUIK Greenhouse agricultural area. Available online: https://biruni.tuik.gov.tr/medas/?kn=92&locale=tr (accessed on 22 May 2024).
- TUIK Water and Wastewater Statistics. Available online: https://data.tuik.gov.tr/Bulten/Index?p=Water-and-Wastewater-Statistics-2020-37197&dil=2 (accessed on 22 May 2024).
- Sönmez, İ.; Kaplan, M. Determination of salinity of soil and irrigation waters of greenhouses in Demre region. Akdeniz Üniversitesi Ziraat Fakültesi Derg. 2004, 17, 155–160. [Google Scholar]
- Kurunc, A. Effects of water and salinity stresses on growth, yield, and water use of iceberg lettuce. J. Sci. Food Agric. 2021, 101, 5688–5696. [Google Scholar] [CrossRef] [PubMed]
- Ildır, M.İ.; Aktaş, H. Effect of different type of pruning on the yield and quality of greenhouse tomato production. Süleyman Demirel Üniversitesi Fen Bilim. Enstitüsü Derg. 2018, 22, 1241–1248. [Google Scholar] [CrossRef]
- Dunkerly, C.; Huntington, J.L.; McEvoy, D.; Morway, A.; Allen, R.G. Agweather-Qaqc: An Interactive Python Package for Quality Assurance and Quality Control of Daily Agricultural Weather Data and Calculation of Reference Evapotranspiration. J. Open Source Softw. 2024, 9, 6368. [Google Scholar] [CrossRef]
- Doorenboos, J.; Pruitt, W.O. Guidelines for predicting crop water requirements, Irrigation and Drainage Paper 24. L. Water Dev. Div. FAO Rome 1977, 24, 179. [Google Scholar]
- Hargreaves, G.H.; Samani, Z.A. Estimating potential evapotranspiration. J. Irrig. Drain. Div.-ASCE 1982, 108, 225–230. [Google Scholar] [CrossRef]
- Sakuratani, T. A heat balance method for measuring water flux in the stem of intact plants. J. Agric. Meteorol. 1981, 37, 9–17. [Google Scholar] [CrossRef]
- Baker, J.M.; van Bavel, C.H.M. Measurement of mass flow of water in the stems of herbaceous plants. Plant Cell Environ. 1987, 10, 777–782. [Google Scholar] [CrossRef]
- Navarro, A.; Scotto di Covella, F.; Cacini, S.; Sodini, M.; Traversari, S.; Venezia, A.; Massa, D. Testing sap-flow sensors to predict irrigation of soilless tomato fertigated with saline water. Acta Hortic. 2023, 639–646. [Google Scholar] [CrossRef]
- Carter, M.R.; Gregorich, E.G.; Pennock, D.; Yates, T.; Braidek, J. Soil Sampling and Methods of Analysis, 2nd ed.; CRC Press: Boca Raton, FL, USA, 2007; ISBN 9780849335860. [Google Scholar]
- Karaca, C.; Aslan, G.E.; Buyuktas, D.; Kurunc, A.; Bastug, R.; Navarro, A. Effects of salinity stress on drip-irrigated tomatoes grown under Mediterranean-type greenhouse conditions. Agronomy 2023, 13, 36. [Google Scholar] [CrossRef]
- Hanson, B.R.; Grattan, S.R.; Fulton, A. Agricultural Salinity and Drainage; Department of Land, Air and Water Resources, University of California: Davis, CA, USA, 2006; ISBN 160107946X. [Google Scholar]
- Kurunc, A.; Unlukara, A.; Cemek, B. Salinity and drought affect yield response of bell pepper similarly. Acta Agric. Scand. Sect. B Soil Plant Sci. 2011, 61, 514–522. [Google Scholar] [CrossRef]
- Yang, L.; Liu, H.; Tang, X.; Li, L. Tomato evapotranspiration, crop coefficient and irrigation water use efficiency in the winter period in a sunken Chinese solar greenhouse. Water 2022, 14, 2410. [Google Scholar] [CrossRef]
- Deng, Y.; Wu, S.; Ke, J.; Zhu, A. Effects of meteorological factors and groundwater depths on plant sap flow velocities in karst critical zone. Sci. Total Environ. 2021, 781, 146764. [Google Scholar] [CrossRef] [PubMed]
- Dudley, L.M.; Ben-Gal, A.; Shani, U. Influence of plant, soil, and water on the leaching fraction. Vadose Zone J. 2008, 7, 420–425. [Google Scholar] [CrossRef]
- Romero-Aranda, M.R.; Jurado, O.; Cuartero, J. Silicon alleviates the deleterious salt effect on tomato plant growth by improving plant water status. J. Plant Physiol. 2006, 163, 847–855. [Google Scholar] [CrossRef] [PubMed]
- Rodriguez, P.; Dell’Amico, J.; Morales, D.; Sanchez Blanco, M.J.; Alarcon, J.J. Effects of salinity on growth, shoot water relations and root hydraulic conductivity in tomato plants. J. Agric. Sci. 1997, 128, 439–444. [Google Scholar] [CrossRef]
- Lv, X.; Chen, S.; Wang, Y. Advances in understanding the physiological and molecular responses of sugar beet to salt stress. Front. Plant Sci. 2019, 10, 1431. [Google Scholar] [CrossRef] [PubMed]
- Ben-Gal, A.; Karlberg, L.; Jansson, P.; Shani, U. Temporal robustness of linear relationships between production and transpiration. Plant Soil 2003, 251, 211–218. [Google Scholar] [CrossRef]
- Shani, U.; Ben-Gal, A.; Tripler, E.; Dudley, L.M. Plant response to the soil environment: An analytical model integrating yield, water, soil type, and salinity. Water Resour. Res. 2007, 43, W08418. [Google Scholar] [CrossRef]
- Zhang, B.; Liu, Y.; Xu, D.; Zhao, N.; Lei, B.; Rosa, R.D.; Paredes, P.; Paço, T.A.; Pereira, L.S. The dual crop coefficient approach to estimate and partitioning evapotranspiration of the winter wheat–summer maize crop sequence in North China Plain. Irrig. Sci. 2013, 31, 1303–1316. [Google Scholar] [CrossRef]
- Naveen-Gupta; Eberbach, P.L.; Humphreys, E.; Balwinder-Singh; Sudhir-Yadav; Kukal, S.S. Estimating soil evaporation in dry seeded rice and wheat crops after wetting events. Agric. Water Manag. 2019, 217, 98–106. [Google Scholar] [CrossRef]
- Orgaz, F.; Fernández, M.D.; Bonachela, S.; Gallardo, M.; Fereres, E. Evapotranspiration of horticultural crops in an unheated plastic greenhouse. Agric. Water Manag. 2005, 72, 81–96. [Google Scholar] [CrossRef]
- Grattan, S.R.; Bowers, W.; Dong, A.; Snyder, R.L.; Carroll, J.J.; George, W. New crop coefficients estimate water use of vegetables, row crops. Calif. Agric. 1998, 52, 16–21. [Google Scholar] [CrossRef]
- Bhantana, P.; Lazarovitch, N. Evapotranspiration, crop coefficient and growth of two young pomegranate (Punica granatum L.) varieties under salt stress. Agric. Water Manag. 2010, 97, 715–722. [Google Scholar] [CrossRef]
- Pereira, L.S.; Paredes, P.; Hunsaker, D.J.; López-Urrea, R.; Mohammadi Shad, Z. Standard Single and Basal Crop Coefficients for Field Crops. Updates and Advances to the FAO56 Crop Water Requirements Method. Agric. Water Manag. 2021, 243, 106466. [Google Scholar] [CrossRef]
Disclaimer/Publisher’s Note: The statements, opinions and data contained in all publications are solely those of the individual author(s) and contributor(s) and not of MDPI and/or the editor(s). MDPI and/or the editor(s) disclaim responsibility for any injury to people or property resulting from any ideas, methods, instructions or products referred to in the content. |
© 2024 by the authors. Licensee MDPI, Basel, Switzerland. This article is an open access article distributed under the terms and conditions of the Creative Commons Attribution (CC BY) license (https://creativecommons.org/licenses/by/4.0/).