Article

Seasonal Photosynthetic and Water Relation Responses of Three Cool Temperate Garden Shrubs to Drought Stress

1
Institute of Forestry and Pomology, Beijing Academy of Agriculture and Forestry Sciences, Beijing 100093, China
2
Beijing Yanshan Forest Ecosystem Observation and Research Station, Beijing 100093, China
3
College of Forestry, Shenyang Agricultural University, Shenyang 110161, China
*
Authors to whom correspondence should be addressed.
These authors contributed equally to this work.
Agronomy 2024, 14(8), 1772; https://doi.org/10.3390/agronomy14081772
Submission received: 3 July 2024 / Revised: 26 July 2024 / Accepted: 8 August 2024 / Published: 13 August 2024
(This article belongs to the Special Issue Innovations in Urban Horticulture)

Abstract

:
The globally increasing frequency of extreme drought events exacerbates the contradiction between the supply of water and the demand for high-quality urban greening. However, the mechanism of the response of urban shrubs to drought stress remains unclear. In this study, three typical urban shrubs (Euonymus japonicus, golden vicary [Ligustrum × vicaryi], and Japanese purple barberry [Berberis thunbergii var. atropurpurea]) that are used for greening in northern China were exposed to three levels of water (full irrigation, natural rain-fed, and extreme drought) in different periods of the growing season (April to May, June to July, and August to September) to investigate the responses of leaf water potential and photosynthetic parameters. The main results were as follows: (1) all the leaf water potentials (Ψ) and photosynthetic parameters (Pn) showed a typical linear relationship along the water gradient in the middle of the growing season. Extreme drought decreased the photosynthetic rates by 1.26~11.03 μmol·m−2·s−1 compared with the irrigated groups. However, the responses were less pronounced in the early and late growing seasons. (2) Different shrubs responded with different intensities and mechanisms. B. thunbergii var. atropurpurea showed clear anisohydric behavior throughout the whole growing season, while L. × vicaryi and E. japonicus showed stronger isohydric behavior during the early and late growing seasons. These findings are important to improve the sustainability of maintenance of ornamental plants from the scope of the efficient utilization of urban water resources.

1. Introduction

According to the United Nations Economic and Social Commission (UNESCO) for Asia and the Pacific [1], the Asian region is facing severe water scarcity with approximately 85% of the groundwater already withdrawn for irrigation, and the overuse will be exacerbated by continual population growth [1]. Global climate models predict a significant increase in the frequency and intensity of drought as a result of anthropogenic climate warming in this century, which further exacerbates the tension between water supply and demand [2,3]. The shortage of irrigation water will not only limit agricultural development but also affect the construction and management of urban greenery. Urban green spaces are dominated by natural or artificial landscapes composed of trees, shrubs, and herbaceous ground covers [4]. Increasing temperatures and decreasing precipitation simultaneously exacerbate the soil moisture stress, which becomes a major limiting factor that affects the normal growth of urban trees [5]. Drought stress reduces the growth of plants by decreasing photosynthesis, assimilate partitioning, growth, and water relations [6,7], and its mechanisms differ significantly among the species of trees [8]. In urban greening, shrubs are widely used because of their small size, flexible application scenarios, and high resistance to stress [9]. However, in a recent global review, observations of shrubs accounted for only approximately 2% of the 7763 observation datasets [10], with limited attention paid to urban shrubs [11]. Thus, related research on shrubs is urgently needed.
The leaf water potential (Ψ), photosynthetic rate (Pn), and stomatal conductance (GS) are all sensitive to drought stress [12,13,14] and can reflect the degree of atmospheric drought, as well as the intensity of drought tolerance in plants. Under drought stress conditions, plants close their stomata to reduce water loss [15], but this simultaneously reduces growth [8] and even photosynthetic activity, which leads to plant death [16]. Some studies have shown that plants tend to grow normally under conditions of mild drought stress [17]. Therefore, to effectively conserve water, previous researchers and agriculturalists will reduce the amount of irrigation, so that the crop is exposed to some level of water stress for a specific portion or the entire growing period, which is called the deficit irrigation (DI) strategy [18]. For example, regulated DI practices that reduced irrigation by 10–20% promoted the growth and yield of fruit in peach (Prunus persica) and apple (Malus domestica) trees [19,20]. Tribulato et al. (2019) utilized a pot experiment to show that water deficit treatments of 10% and 20% in the water contents did not result in any significant influences on any physiological characteristics, such as the Pn or Gs, or morphological characteristics, such as the biomass, of Mediterranean shrubs [21]. However, there has been little research that addresses the effects of DI on outdoor shrubs used for greening.
The responses of plants to drought stress may differ at different times of the growing season. Many studies have explored the effects of drought early in the growing season (usually in the spring). For example, early spring drought has been found to stimulate the Pn throughout the growing season in a forest ecosystem [22], but it may also reduce summer productivity by increasing the rates of the transpiration ratio (Tr), which reduces the contents of soil water during the summer [23,24]. Changes in the length and timing of the growing season may ultimately alter the accumulation of carbon (C) and forest productivity of species [25,26]. Especially, compared to chaparral species, research has shown shifts in chaparral cover types and species during the drought, which can significantly impact water and carbon cycling. Reduced spring precipitation may limit the growth of urban greening grasses by delaying plant phenology [27,28,29]. Alternatively, precipitation in the late growing season (usually the summer or autumn) has also been shown to be critical for the growth of vegetation [30]. One study reported that summer drought may limit the uptake of C by plants and their growth during the peak growing season by reducing the availability of soil moisture and the leaf water potential [31]. In addition, based on differences in the physiology and life history, different plant functional groups may respond differently to changes in precipitation [32,33]. For example, in some plant species, a water deficit reduces the stomatal apertures to maintain the leaf water potential, which is referred to isohydric behavior, whereas in other plants, stomatal apertures remain unchanged under a water deficit, which is referred to anisohydric behavior [34]. Since the 1960s, the variation in precipitation in northern China has differed significantly by season [35], but few studies have explored how the variation in the seasonal timing of drought affects the various relevant metrics in the shrubs used for greening.
Therefore, in order to reveal the differences in the responses of three common typical urban species of shrubs used for greening (Euonymus japonicus, golden vicary [Ligustrum × vicaryi], and Japanese purple barberry [Berberis thunbergii var. atropurpurea]) in northern China to drought stress in different periods of the growing season, a field experiment with a soil moisture gradient was established in the early, middle, and late growing seasons. The pre-dawn water potential (Ψpd), mid-day water potential (Ψmd), and photosynthetic parameters of the leaves were measured, and the following questions were tested:
(a)
Is there seasonality in the effect of drought stress on the leaf Ψ and photosynthetic parameters in the shrubs used for greening?
We hypothesized that the leaf Ψ and photosynthetic parameters may be affected the most significantly by drought stress in the mid-summer season, with less pronounced decreases in the early and late growing seasons;
(b)
What are the differences in adaptive and responsive mechanisms of different shrubs used for greening to water deficit during the growing season?
We expected that the species with more flexible drought-adaptive mechanisms will be more resistant to drought.

2. Materials and Methods

2.1. Study Site

The study site was located in the experimental field of the Institute of Forestry and Pomology, Beijing Academy of Agriculture and Forestry Sciences (39°58′01″ N, 116°13′02″ E), Beijing, China. Beijing has a typical temperate semi-humid continental monsoon climate with hot and wet summers, cold and dry winters, and short springs and autumns. The average annual sunshine hours range included 2000 to 2800, and the annual frost-free period is 180–200 d. The average annual rainfall is approximately 483.9 mm, and the seasonal distribution of precipitation is uneven with 80% of the annual precipitation concentrated in the summer months of June to August and heavy rainfalls in July and August. According to climate records, Beijing had 305 d, 277 d, and 276 d of rainless days in 2020, 2021, and 2022, respectively, and the longest consecutive drought periods without rainfalls were 46 d, 20 d, and 22 d, respectively [36].

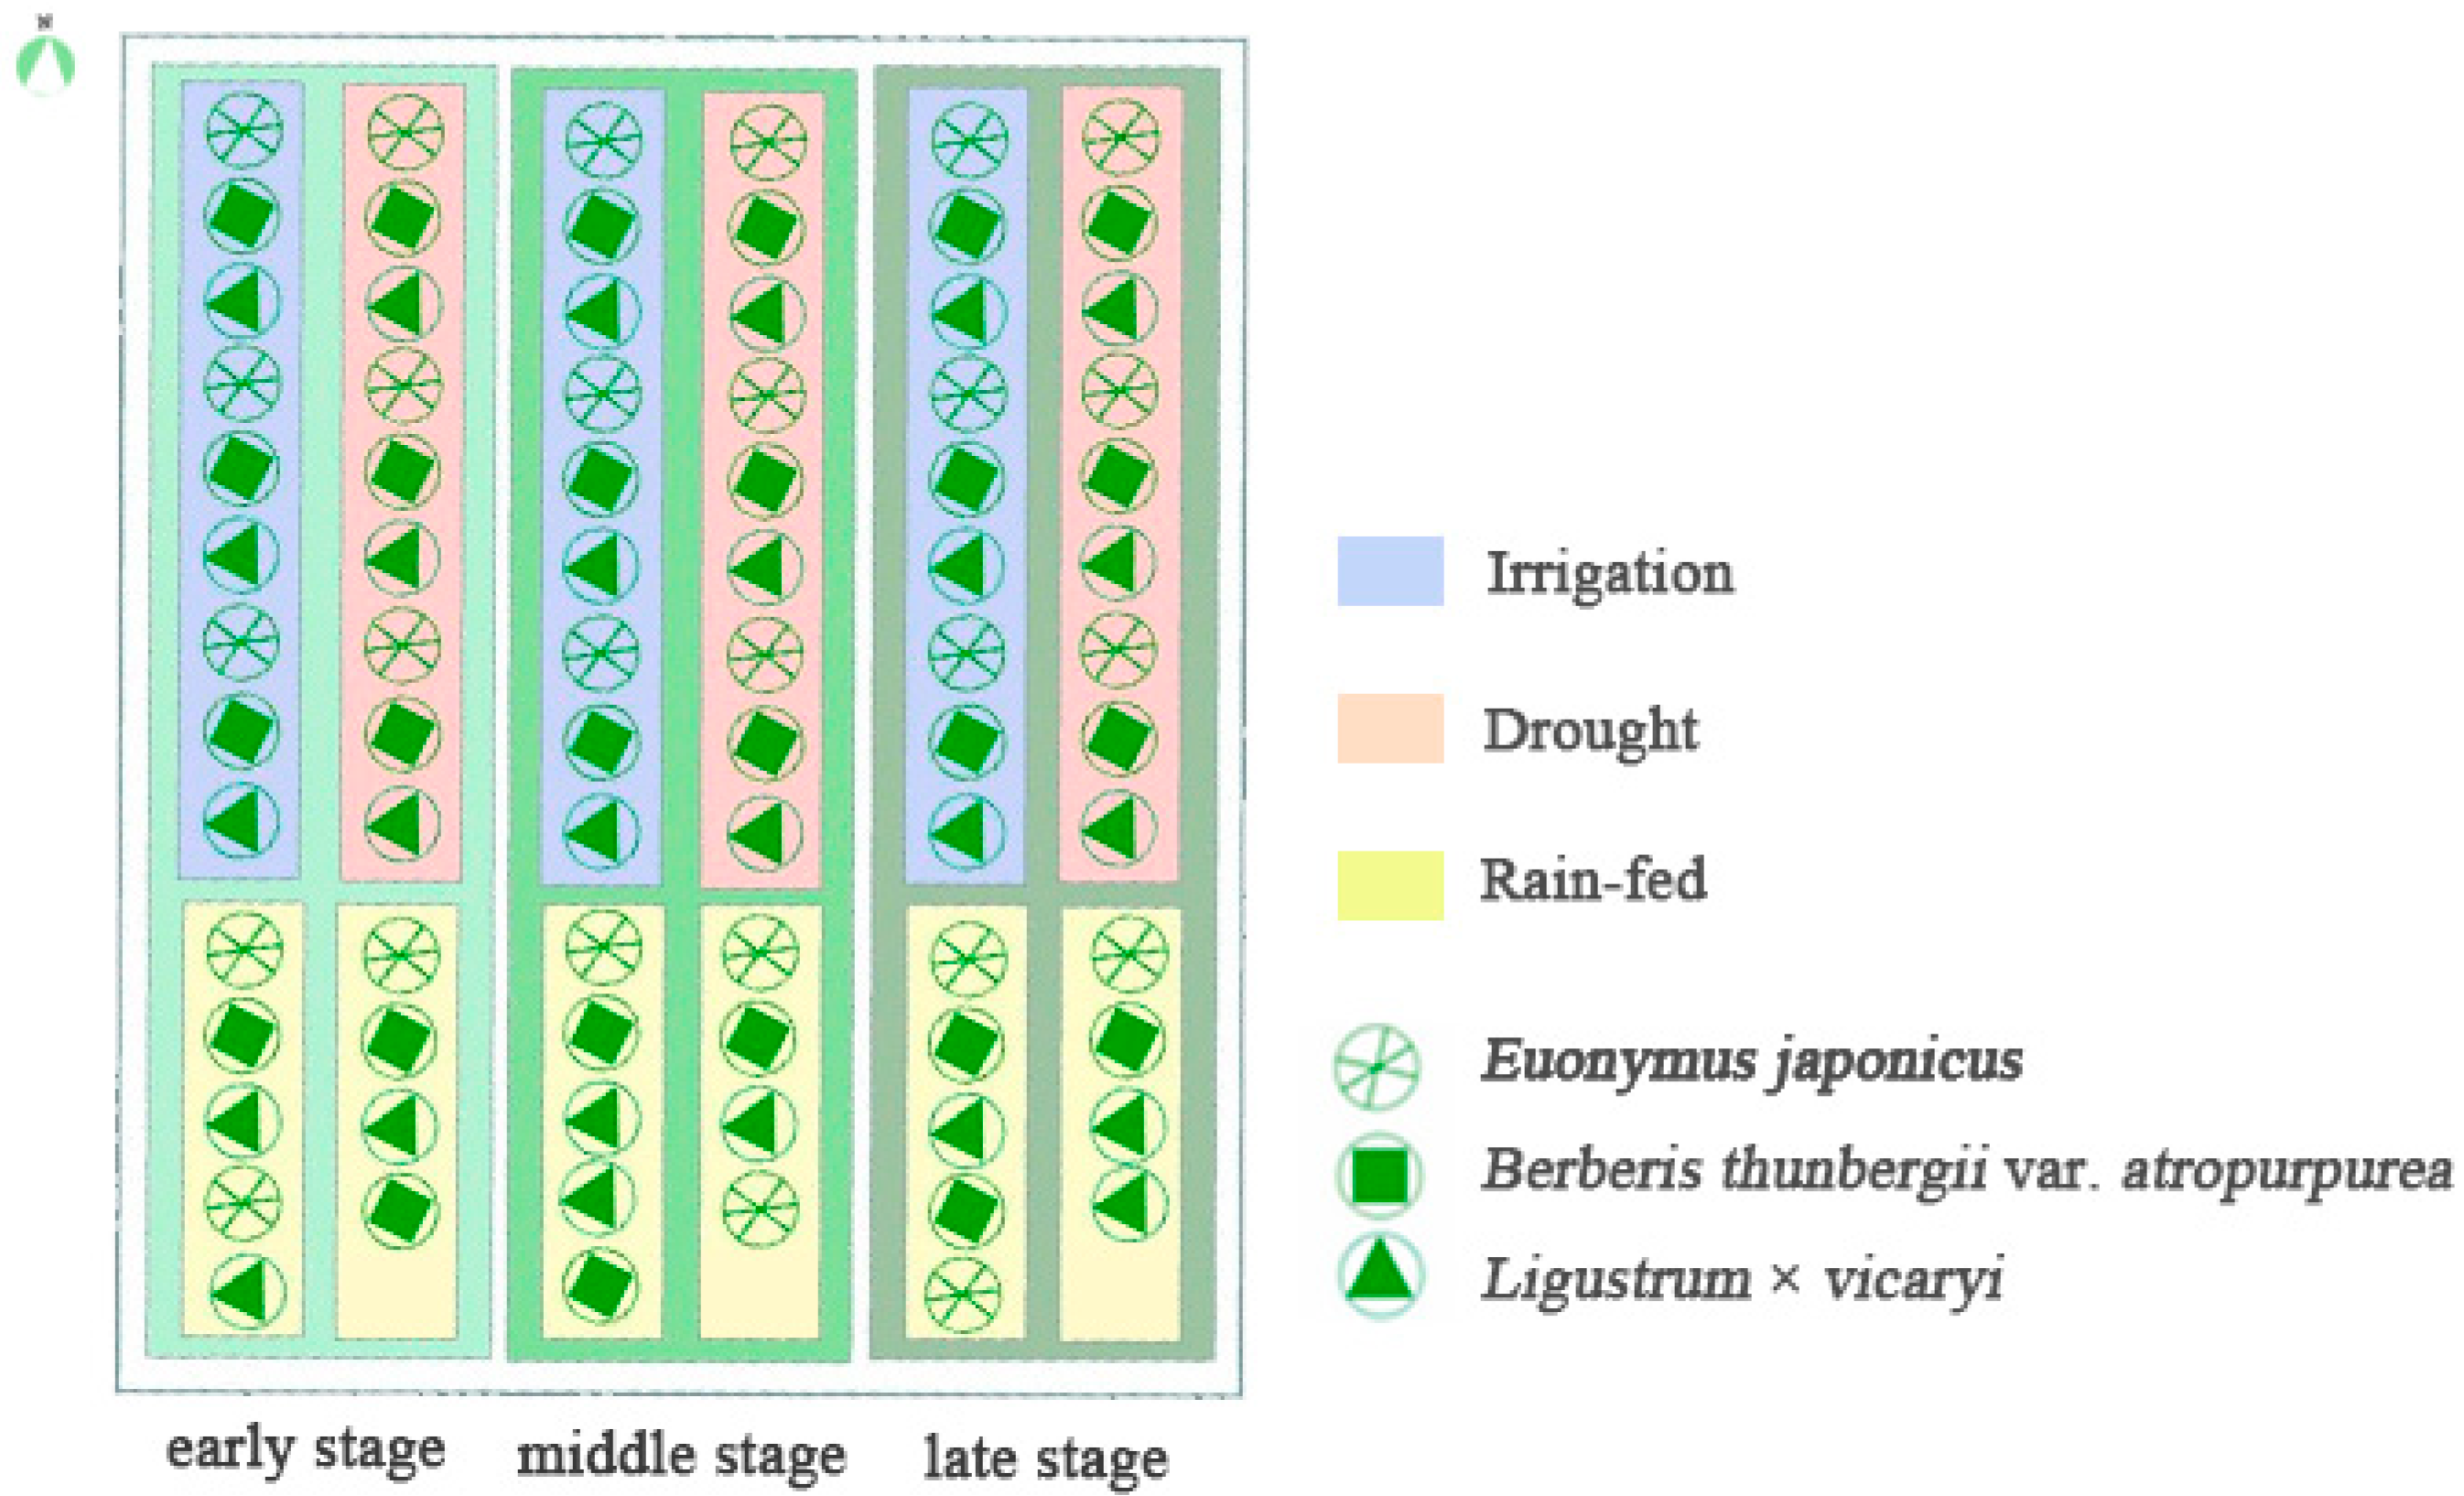
2.2. Plant Materials and Irrigation Treatments

Three typical shrubs that are commonly used in green belts for greening and occupy the largest area in Beijing, as well as other regions in northern China, were selected as the materials for this experiment. They were E. japonicus, L. × vicaryi and B. thunbergii var. atropurpurea, which covered 741.1, 245.8 and 147.4 ha in the urban greening of Beijing, respectively [37]. The shrub age was five years old, the average plant height of each shrub was 75.4 ± 8.3, 86.6 ± 6.4, and 69.4 ± 7.3 cm, and the average crown width was 53.7 ± 5.7, 78.4 ± 7.6, and 73.0 ± 12.7 cm. The daily precipitation during the experiment was recorded by a Meter automatic weather station 20 m away from the test site. The L. × vicaryi has well-developed leaves and a well-developed root system, while the root diameter is small, and the root system has strong osmotic absorption capacity and high hydraulic conductivity; B. thunbergii var. atropurpurea has smaller leaves but a relatively developed root system, with strong root vigor; E. japonicus is an evergreen shrub with a large root diameter, which is capable of surviving under very limited water and nutrient conditions [38].
During the growing season in 2022, the experiment was designed according to a randomized grouping with the plot design shown in Figure 1. The yearly growing season in Beijing is from April to September, and the experimental process was divided into three phases, namely the early growing season (1 April–31 May), the middle-growing season (1 June–31 July), and the late-growing season (1 August–30 September) at 60 d intervals. The experimental irrigation and drought treatments consisted of the following: (i) fully irrigated treatment (FI) irrigated group, in which the irrigation was 100% of the field holding capacity in the early morning from mid-March to the end of September at 10 d intervals; (ii) deficit irrigation treatment-rainfed group, which was grown under natural rainfed conditions without relying on artificial irrigation; (iii) no irrigation treatment at all–extreme drought treatment, in which there was no irrigation, and a rain shelter was erected over each shrub seedling to remove all the precipitation during the trial period (Table 1). The rain shelter was a 2 mm-thick transparent polycarbonate plastic sheet with a 3.0 m × 2.1 m canopy (up to 90% light transmission) over a stainless steel galvanized pipe trellis frame, which intercepted all the rainwater and discharged it to the outside of the sample area [39]. The roof was oriented upwind at an angle of approximately 25°, and the heights of the roofs were approximately 1.2 m and 1.5 m in the upwind and downwind directions, respectively; the irrigation plot consisted with a circle with a diameter of 1.2 m and one shrub seedling in the center, isolated from the outside water conditions by plastic water barriers 50 cm underground and 20 cm aboveground, and watering was performed within the plot when there was no drought treatment. A 80 cm buffer zone was established outside the irrigation circle between different plots to minimize the marginal effects [40]. There is little effect on the roots of the shrubs, because the area of the barrier circles was larger than the root zones of these young tree seedlings. The type in our field is cinnamon soil and the insertion depth is about 50 cm. There were three shrub species, three experimental periods, three treatments, and three replications, with a total of 81 test plots (Figure 1).

2.3. Measurement of the Photosynthetic Parameters

We chose sunny and cloudless weather, and the measurement time was controlled at 9:00~11:00 a.m. A CI-340 Ultralight Portable Photosynthesis Tester (CID Bio-Science, Inc., Camas, WA, USA) was utilized to measure photosynthetic parameters, such as the photosynthesis rate (Pn, μmol·m−2·s−1) and stomatal conductance (Gs, mmol·m−2·s−1), in the experimental shrub species. The flow rate of the photosynthesizer was set at 0.3 L·min−1; the temperature of the leaf chamber was controlled at 25~30 °C, we have set the leaf chamber temperature to the actual ambient shade temperature on the measurement day, and the specific outdoor temperature and leaf temperature can be seen Table S1. We randomly selected five functional leaves of the same part of the sunny side of the upper one-third of the crown of the sampled shrubs that were exposed to the same amount of light and grew healthy, and the results were repeated three times. The results were taken as the mean value. Air humidity during the test is shown in Table S2.

2.4. Soil Moisture Content in Response to Drought Stress

A Delta-WHET-2 portable soil moisture meter was used to measure the soil volume moisture content of each test sample every 10 d. To complement manual data collection, a ZL6 soil moisture monitoring system was set up in the plots for the different growing seasons, and a group was selected to continuously and automatically measure the change in soil moisture at a depth of 10 cm at 30 min intervals. There were three replicate measurements for each shrub species for a total of 81 groups. The three shrubs were subjected to drought stress during the three growing seasons, and the three treatment conditions differed significantly, with increasing irrigation having a significant effect on the soil moisture content (p < 0.01). The mean value of the fully irrigated group in the early part of the growing season was 31.07%, and the soil moisture content under fully irrigated conditions was significantly higher than that of the fully drought-prone group and the natural rainfed group. In the middle part of the growing season, the mean values of the moisture content of the fully irrigated group and the natural rainfed group were 26.66 and 25.29%, respectively, which were significantly higher than that of the fully drought-prone group. In the late growing season, the water contents in the fully irrigated group and the natural rainfed group were 20.03 and 26.54%, respectively, which was significantly higher than that in the complete drought group.

2.5. Determination of the Level of Plant Stress

At the beginning of the experiment in each growing season, the dawn water potential values (Ψpd) were measured at 10 d intervals before sunrise (4:00~6:00), and the mid-day water potential measurements (Ψmd) were measured at midday (12:00~14:00). Intact branches with the third to sixth leaves downward from the tip of the branch were removed and placed in a portable pressure chamber (model 1500; PMS Instruments Co., Corvallis, OR, USA) to measure the dawn and mid-day water potentials, respectively. The early morning and midday water potentials of the plants were measured separately, and the curves of early morning and midday water potentials versus time were made to respond to the changes in the degree of stress of the plants.

2.6. Statistical Analysis

A one-way analysis of variance (ANOVA) in the GLM model was used to test the differences in the indicators under each treatment at the mean of each growing season, and the significance of the effects of different levels of drought stress on the indicators was analyzed by testing for significant differences using the Least Significant Difference test (LSD) (p < 0.05). A regression analysis was used to assess the relationship among photosynthetic parameters, water potential, and soil moisture. Microsoft Excel 2019 (Redmond, WA, USA, 2003), SPSS 26.0 (IBM, Inc., Armonk, NY, USA) and Origin 2021 (OriginLab, Northampton, MA, USA) were used to analyze the data and produce the plots.

3. Results

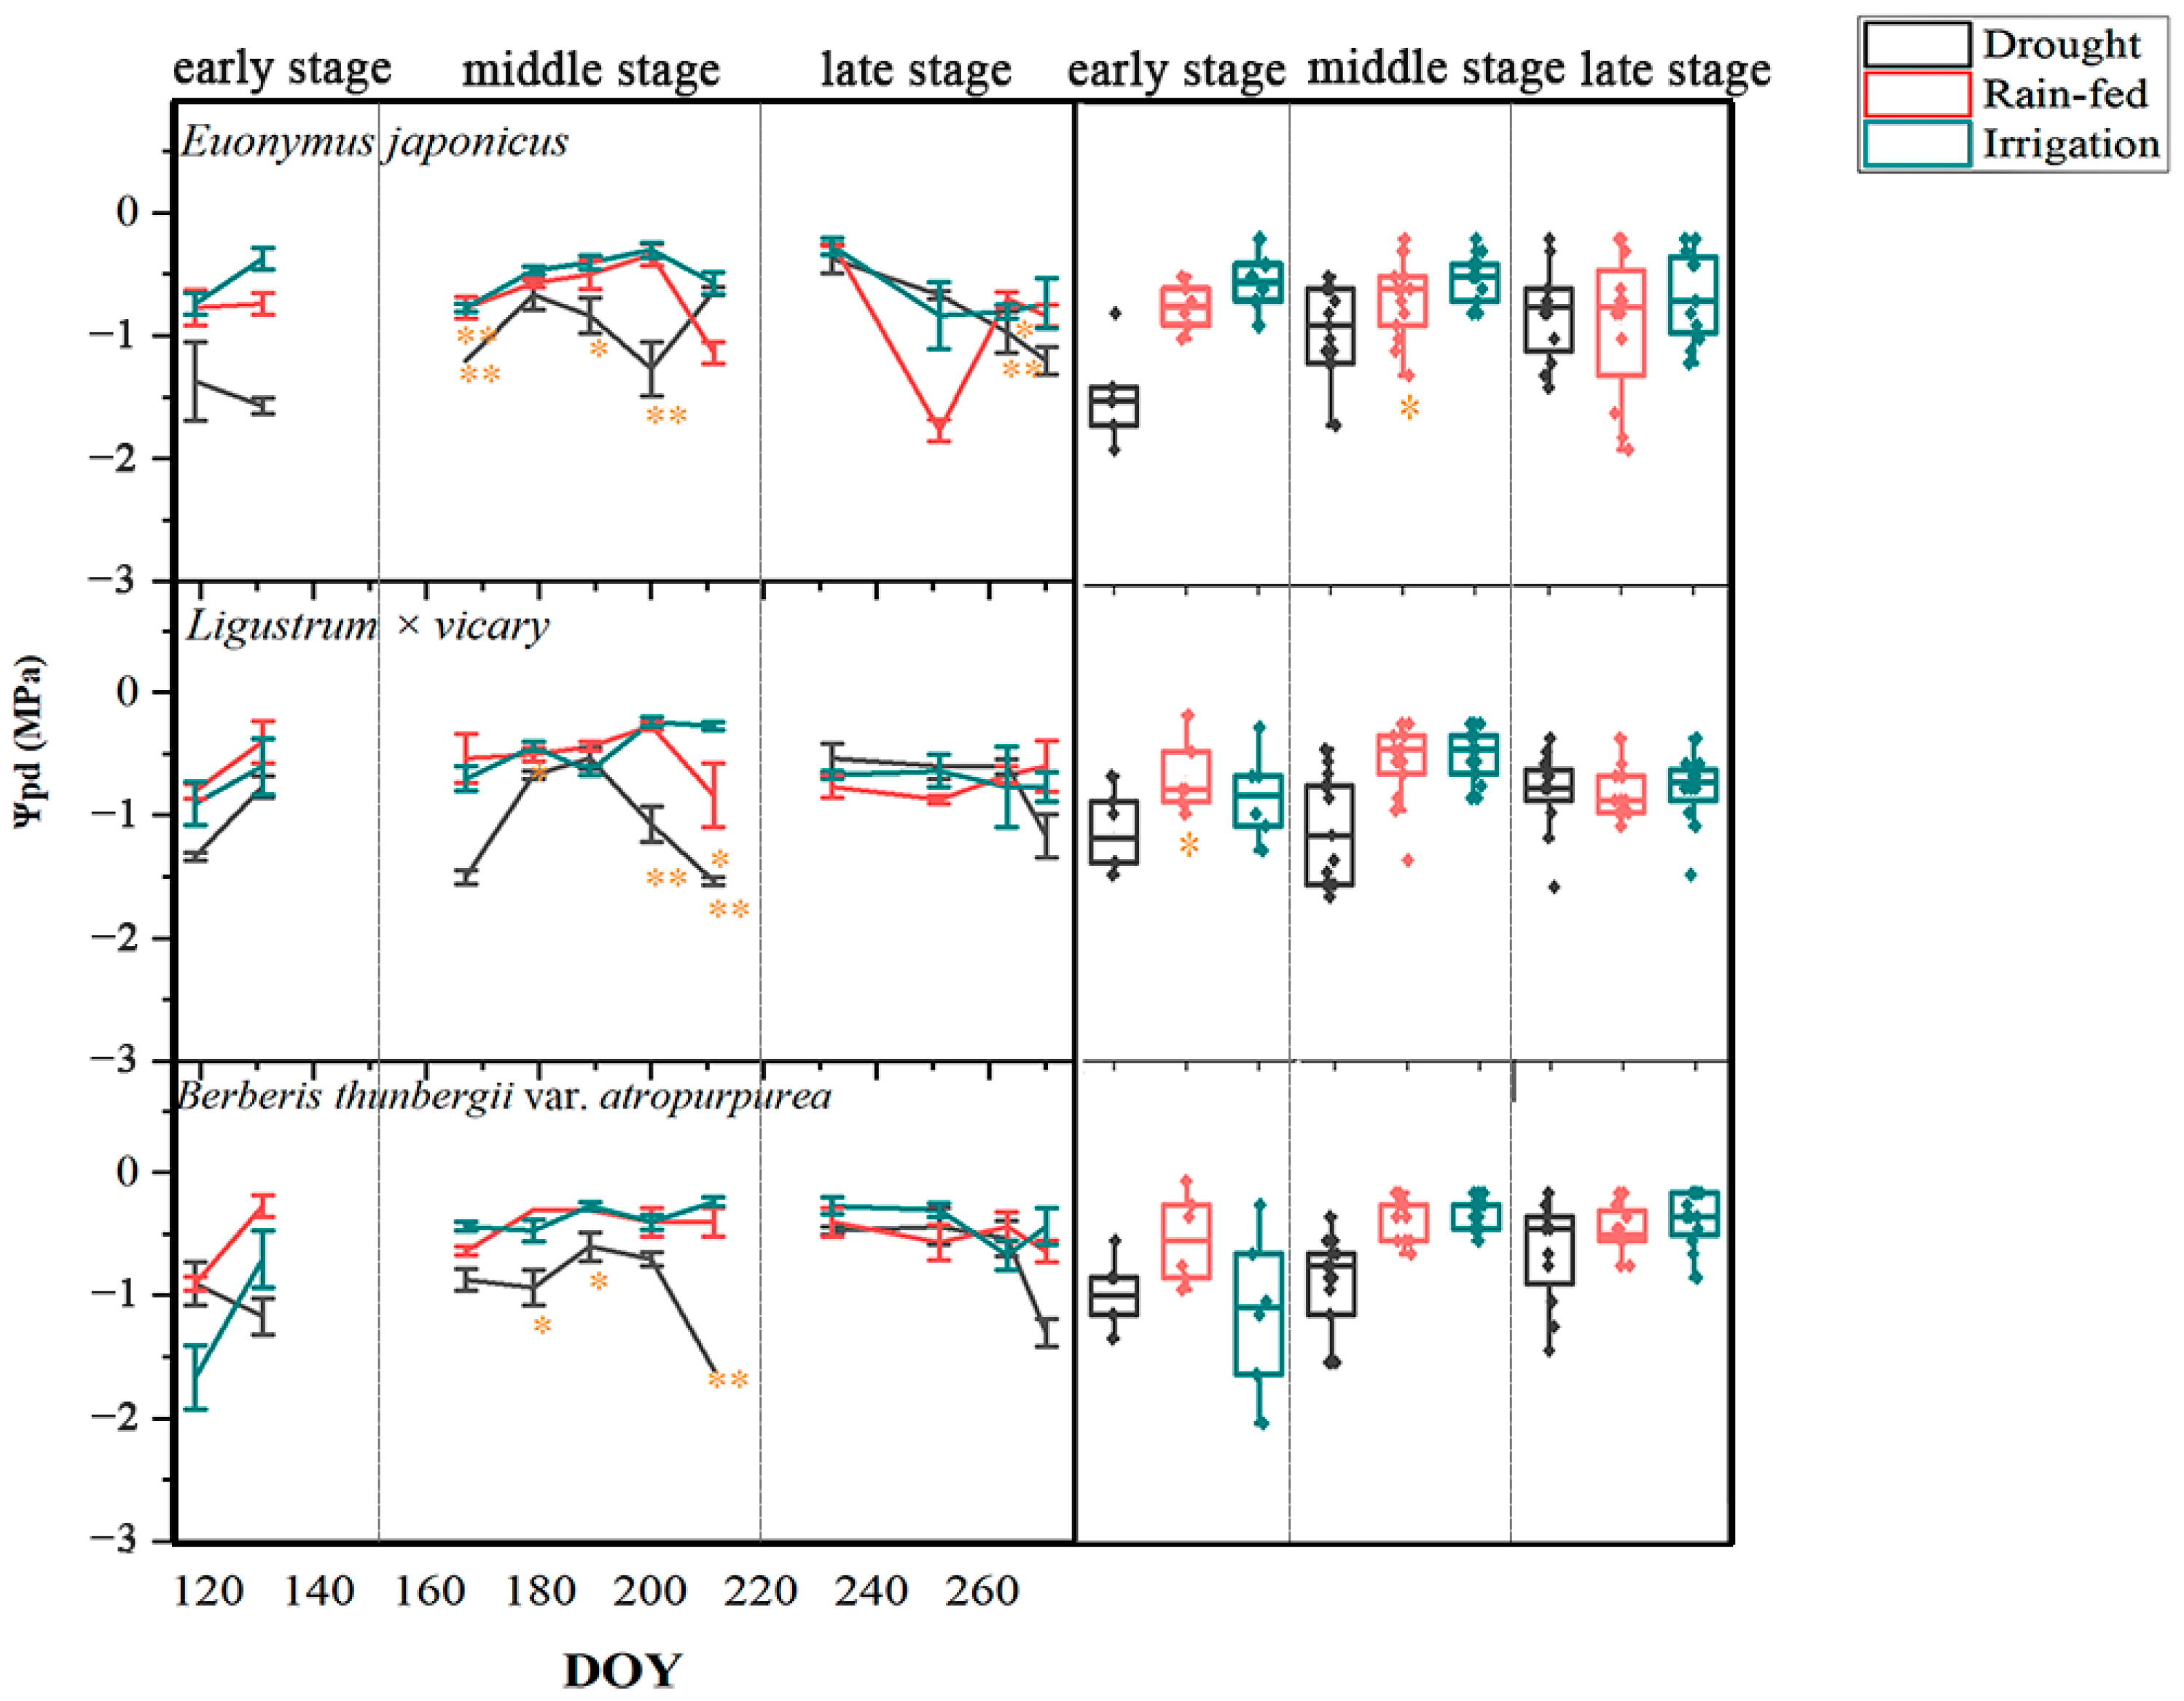
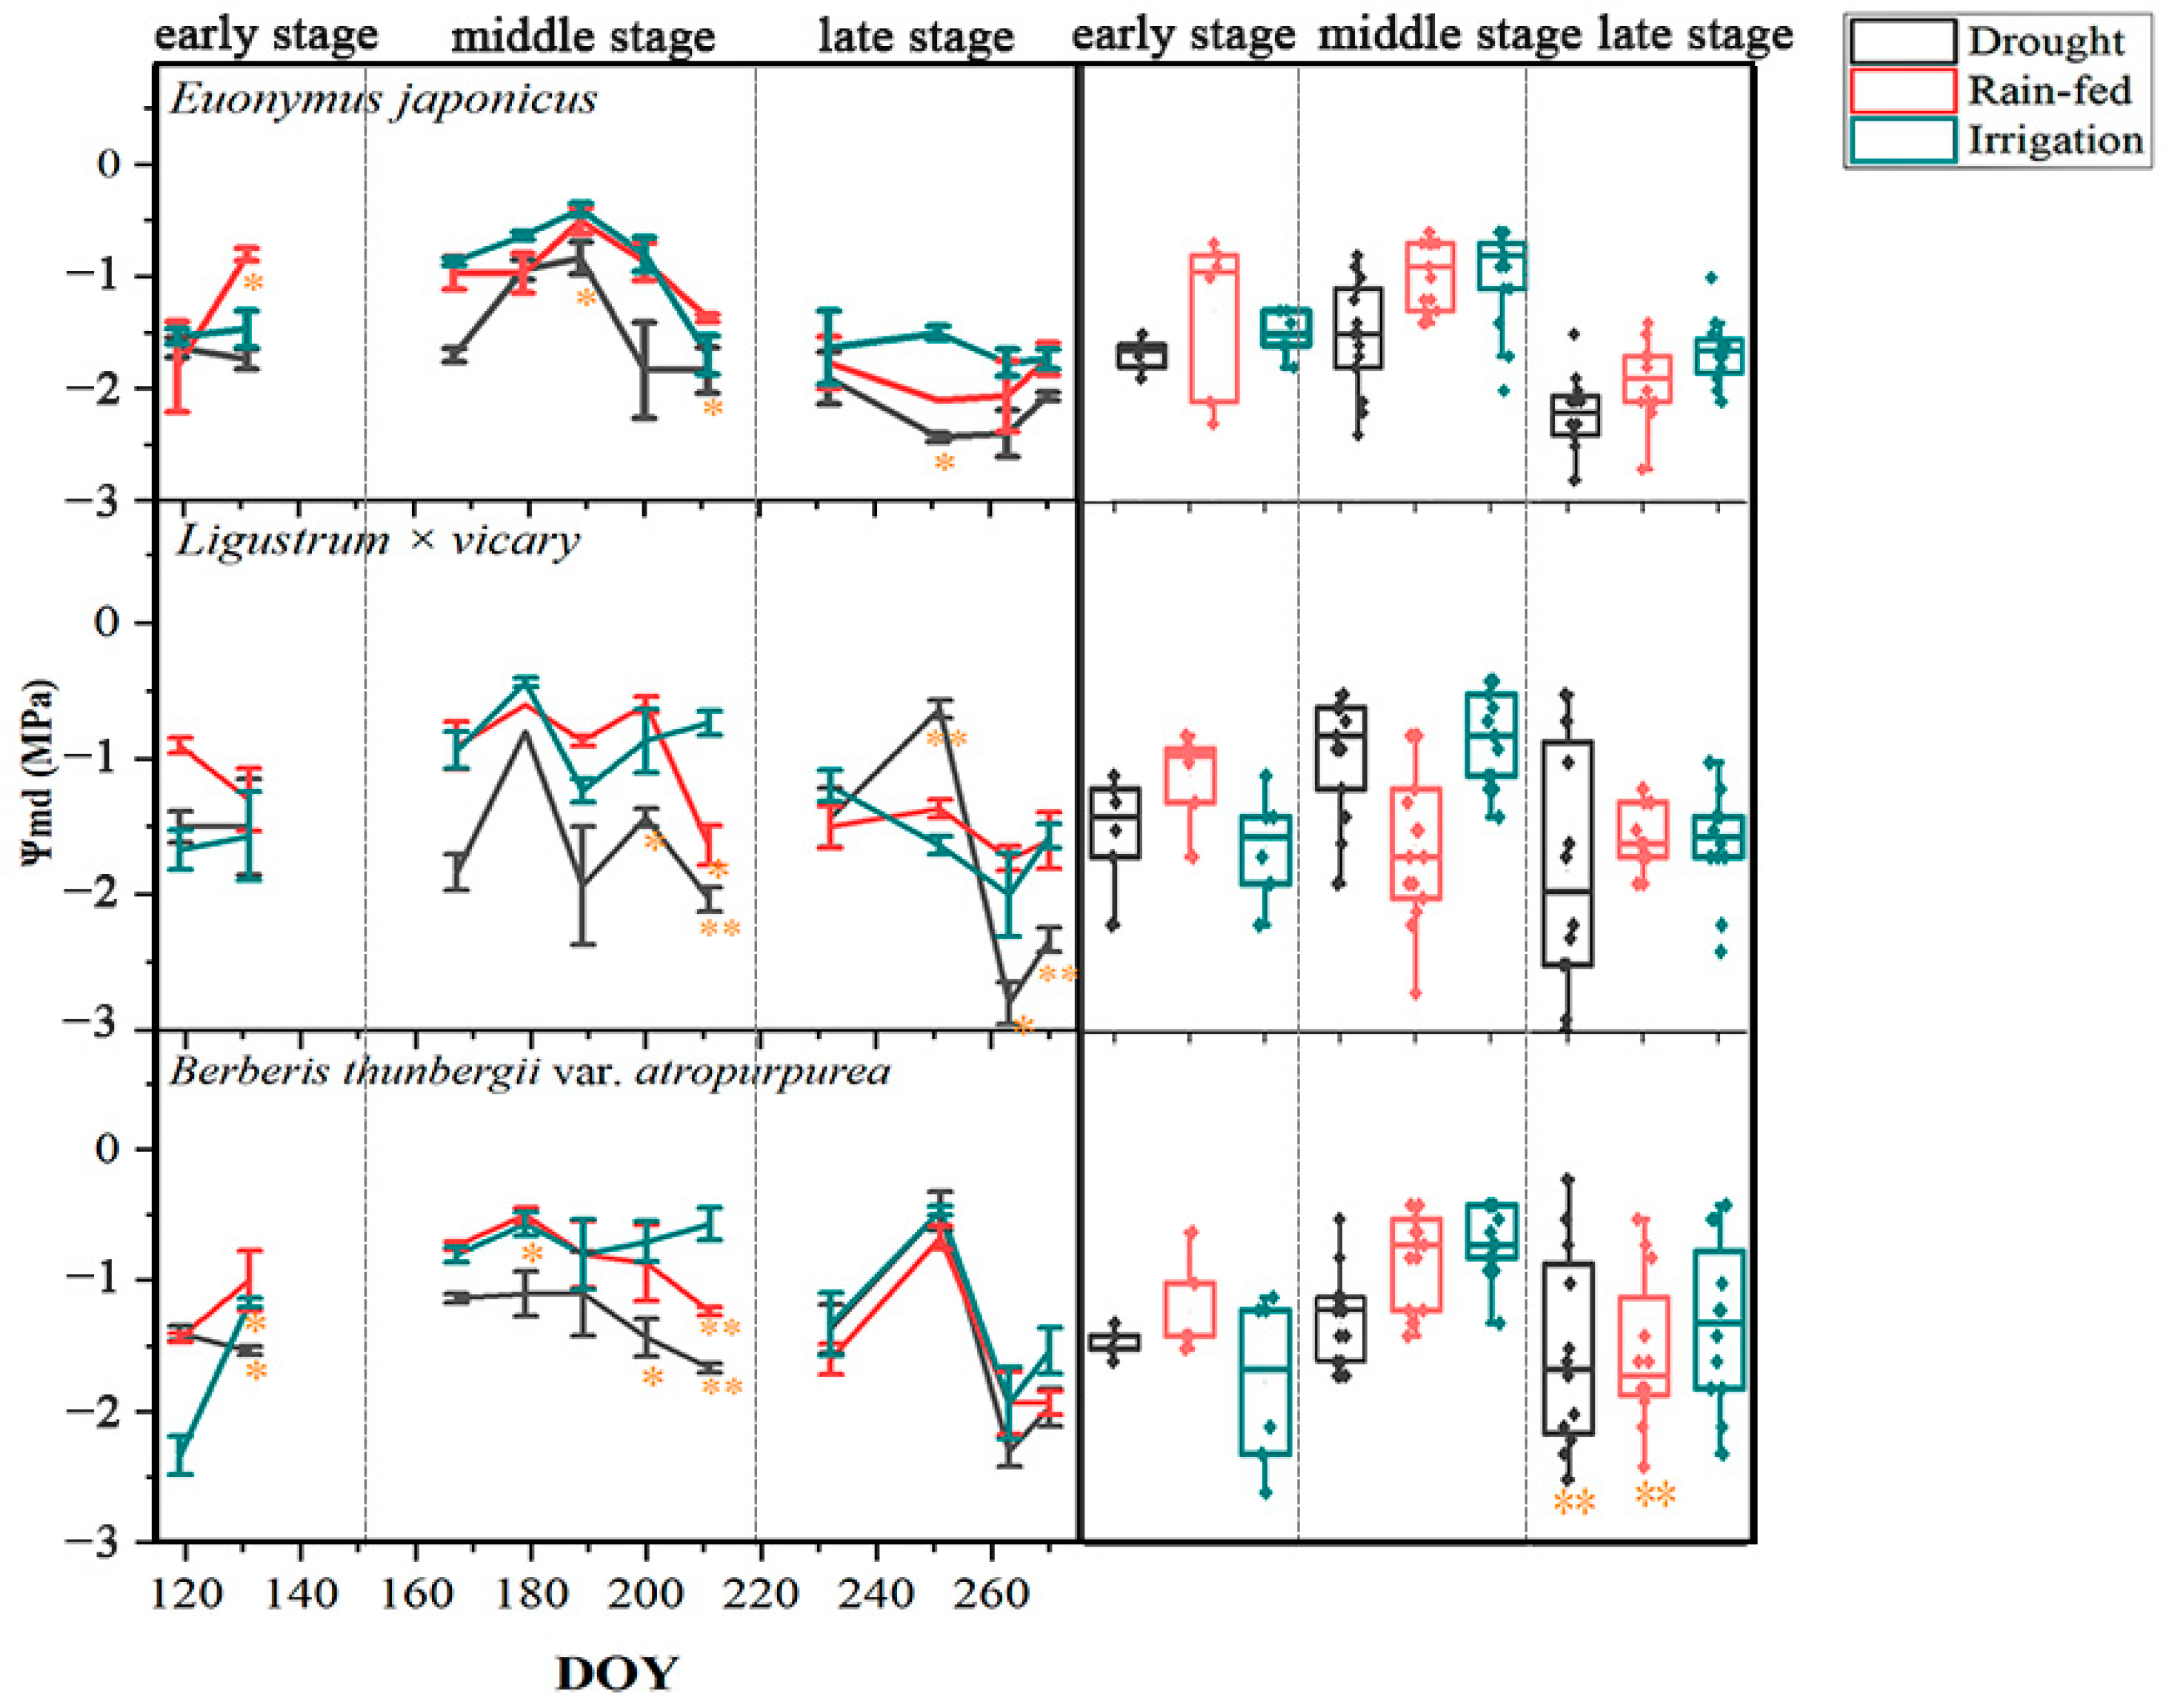
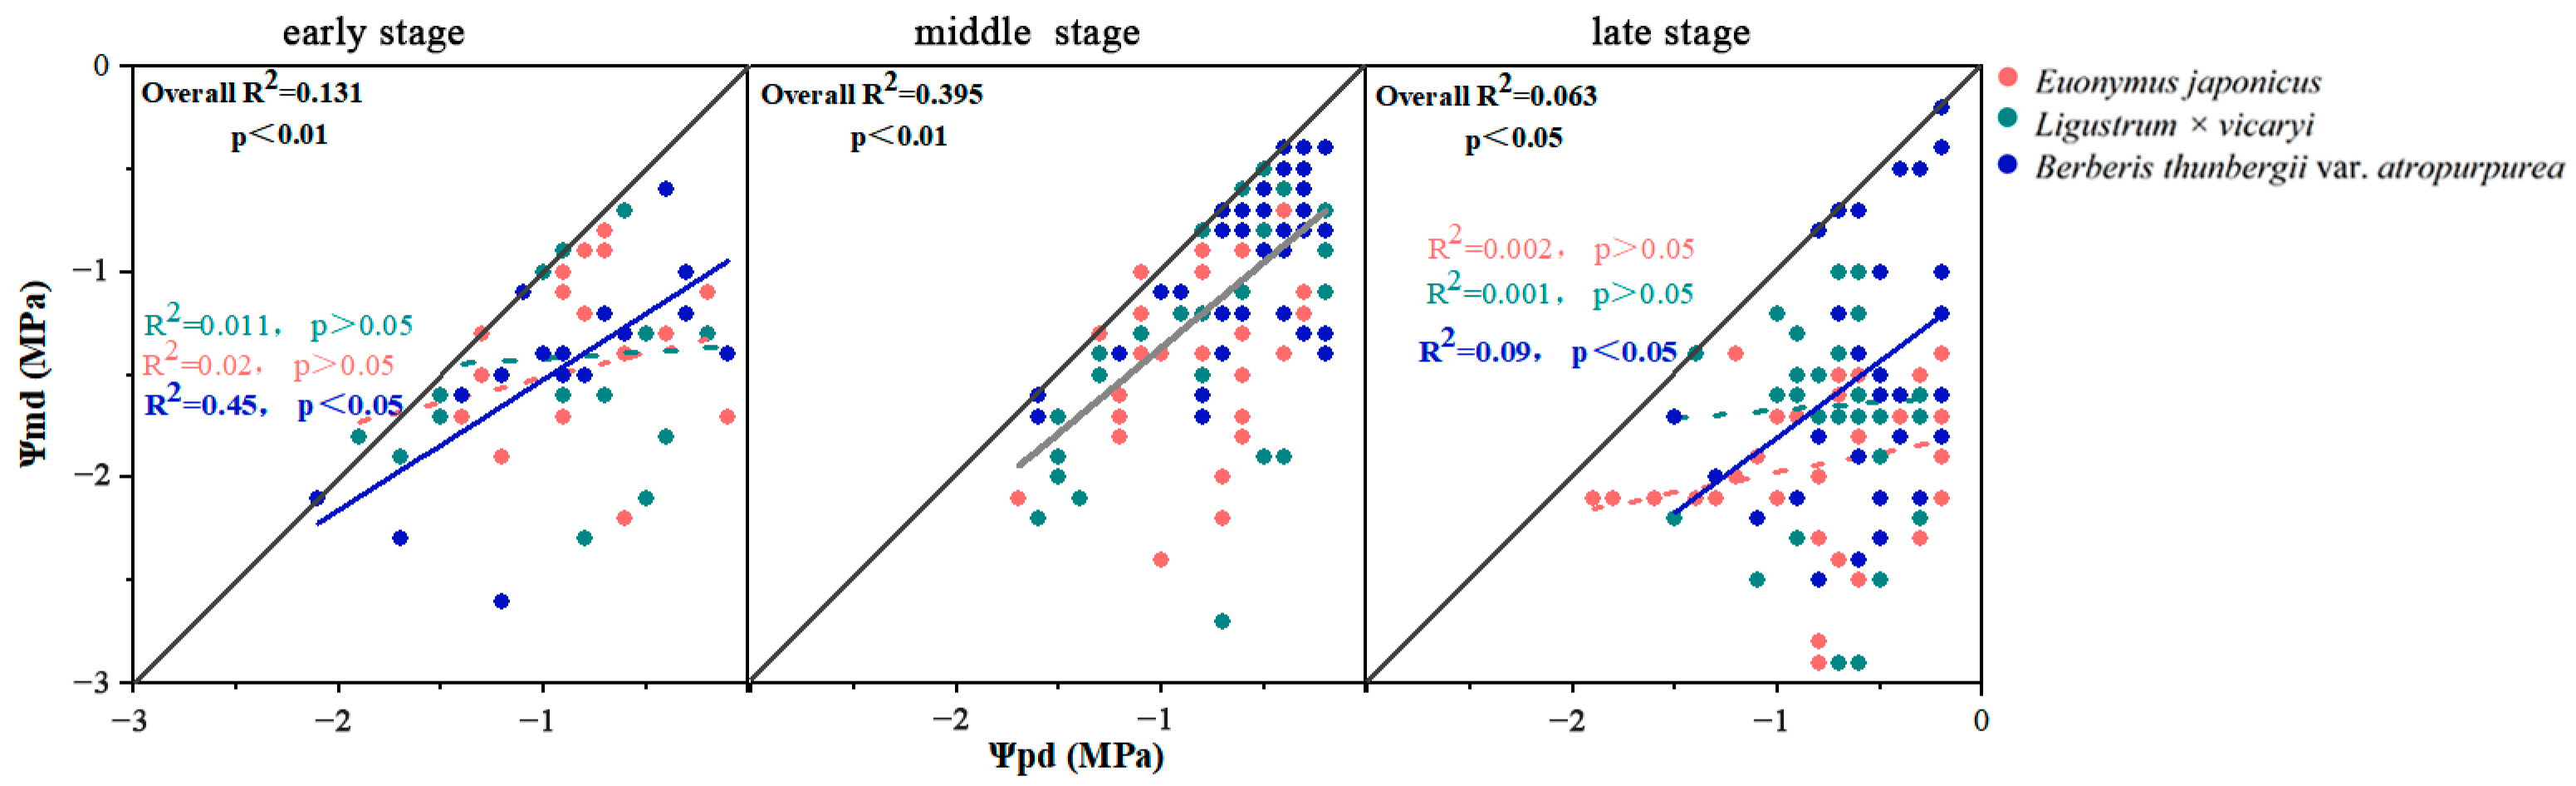
3.1. Responses of the Leaf Water Potential

The leaf Ψ varied in response to drought stress at different times of the growing season. For all three species of shrubs, the Ψpd was lowest during the early growing season (the average water potential was −1.18 MPa) and highest in the late growing season (the average water potential was −0.74 MPa) (Figure 2). Extreme drought significantly decreased the Ψpd compared with that of the irrigated plants in the middle and late growing seasons (p < 0.01), while there was no significant difference between the rainfed and irrigated groups. However, the Ψpd was highest in the rainfed group (mean −0.93 MPa) (except for E. japonicus) in the early growing season, which was higher than that in the drought and irrigated groups (mean −1.37 MPa and −1.2 MPa, respectively), and the trends were similar among the three shrubs. The Ψmd showed a similar trend to the Ψpd but with a larger magnitude of variation. There was a significant difference between the drought and irrigated groups in the middle growing season (p < 0.01). For B. thunbergii var. atropurpurea, extreme drought decreased the Ψmd from −0.5 MPa to −1.7 MPa compared with the irrigated group in the middle growing season; this change was larger than that of the other two species (in the range of −0.9 to −2.7 MPa), and the mean values of water potentials of the three shrubs did not change much during the late growing season (Figure 2 and Figure 3).

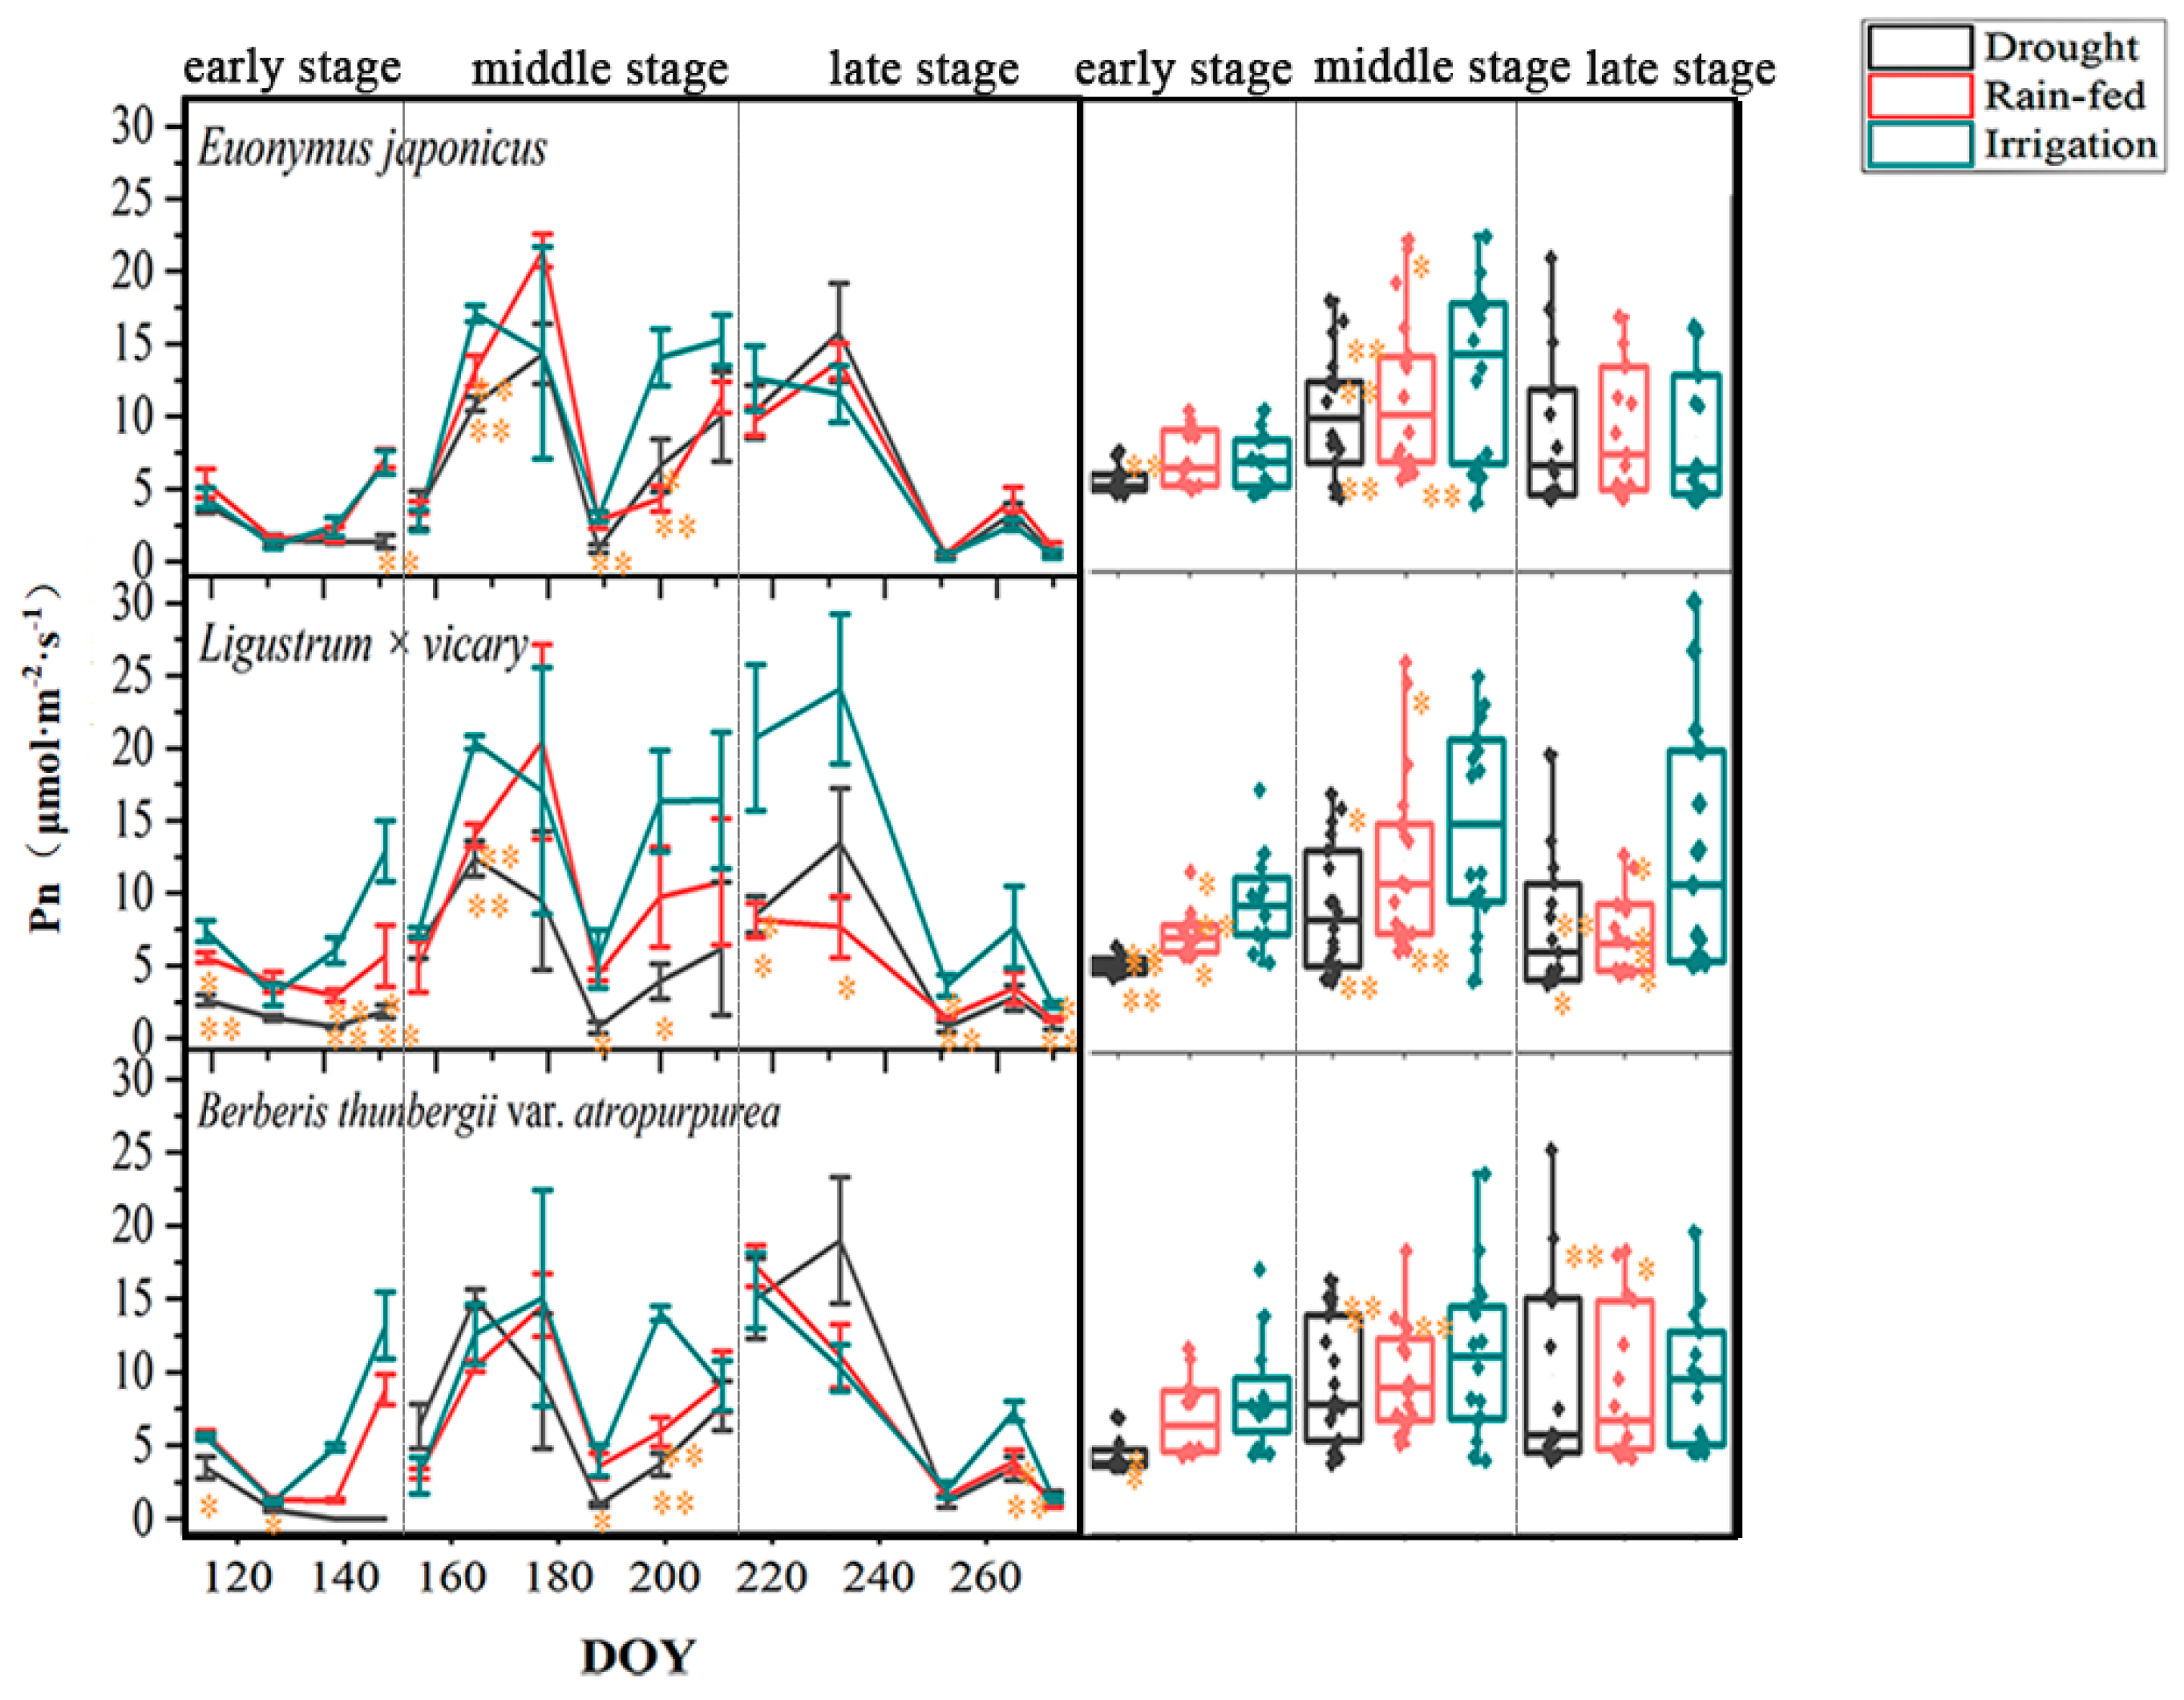
3.2. Response of the Photosynthetic Rate

The photosynthetic rates varied in response to drought stress at different periods of the growing season. The mean photosynthetic rate was 3.33 μmol·m−2·s−1 during the early growing season; the highest photosynthetic rate was 9.57 μmol·m−2·s−1 during the middle growing season, and the mean was 5.59 μmol·m−2·s−1 during the late growing season (Figure 4). Compared with the irrigated group, the photosynthetic rates of the drought and rainfed groups of the three species of shrubs decreased at different times of the growing season with the most apparent decrease in the middle of the growing season. In particular, the decreasing mean values of the drought-stricken and rainfed groups of the three species were 3.13 and 1.28 μmol·m−2·s−1, respectively, in the early part of the growing season, and the decreasing magnitude of the three species was the most apparent in the middle of the growing season, with mean values of 5.40 and 2.88 μmol·m−2·s−1, respectively. The decreasing trend was still observed during the late part of the season in the case of L. × vicaryi, and the mean values of B. thunbergii var. atropurpurea still decreased, while the changes were not significant in the drought and rainfed groups of E. japonicus compared with the irrigated group (Figure 4).

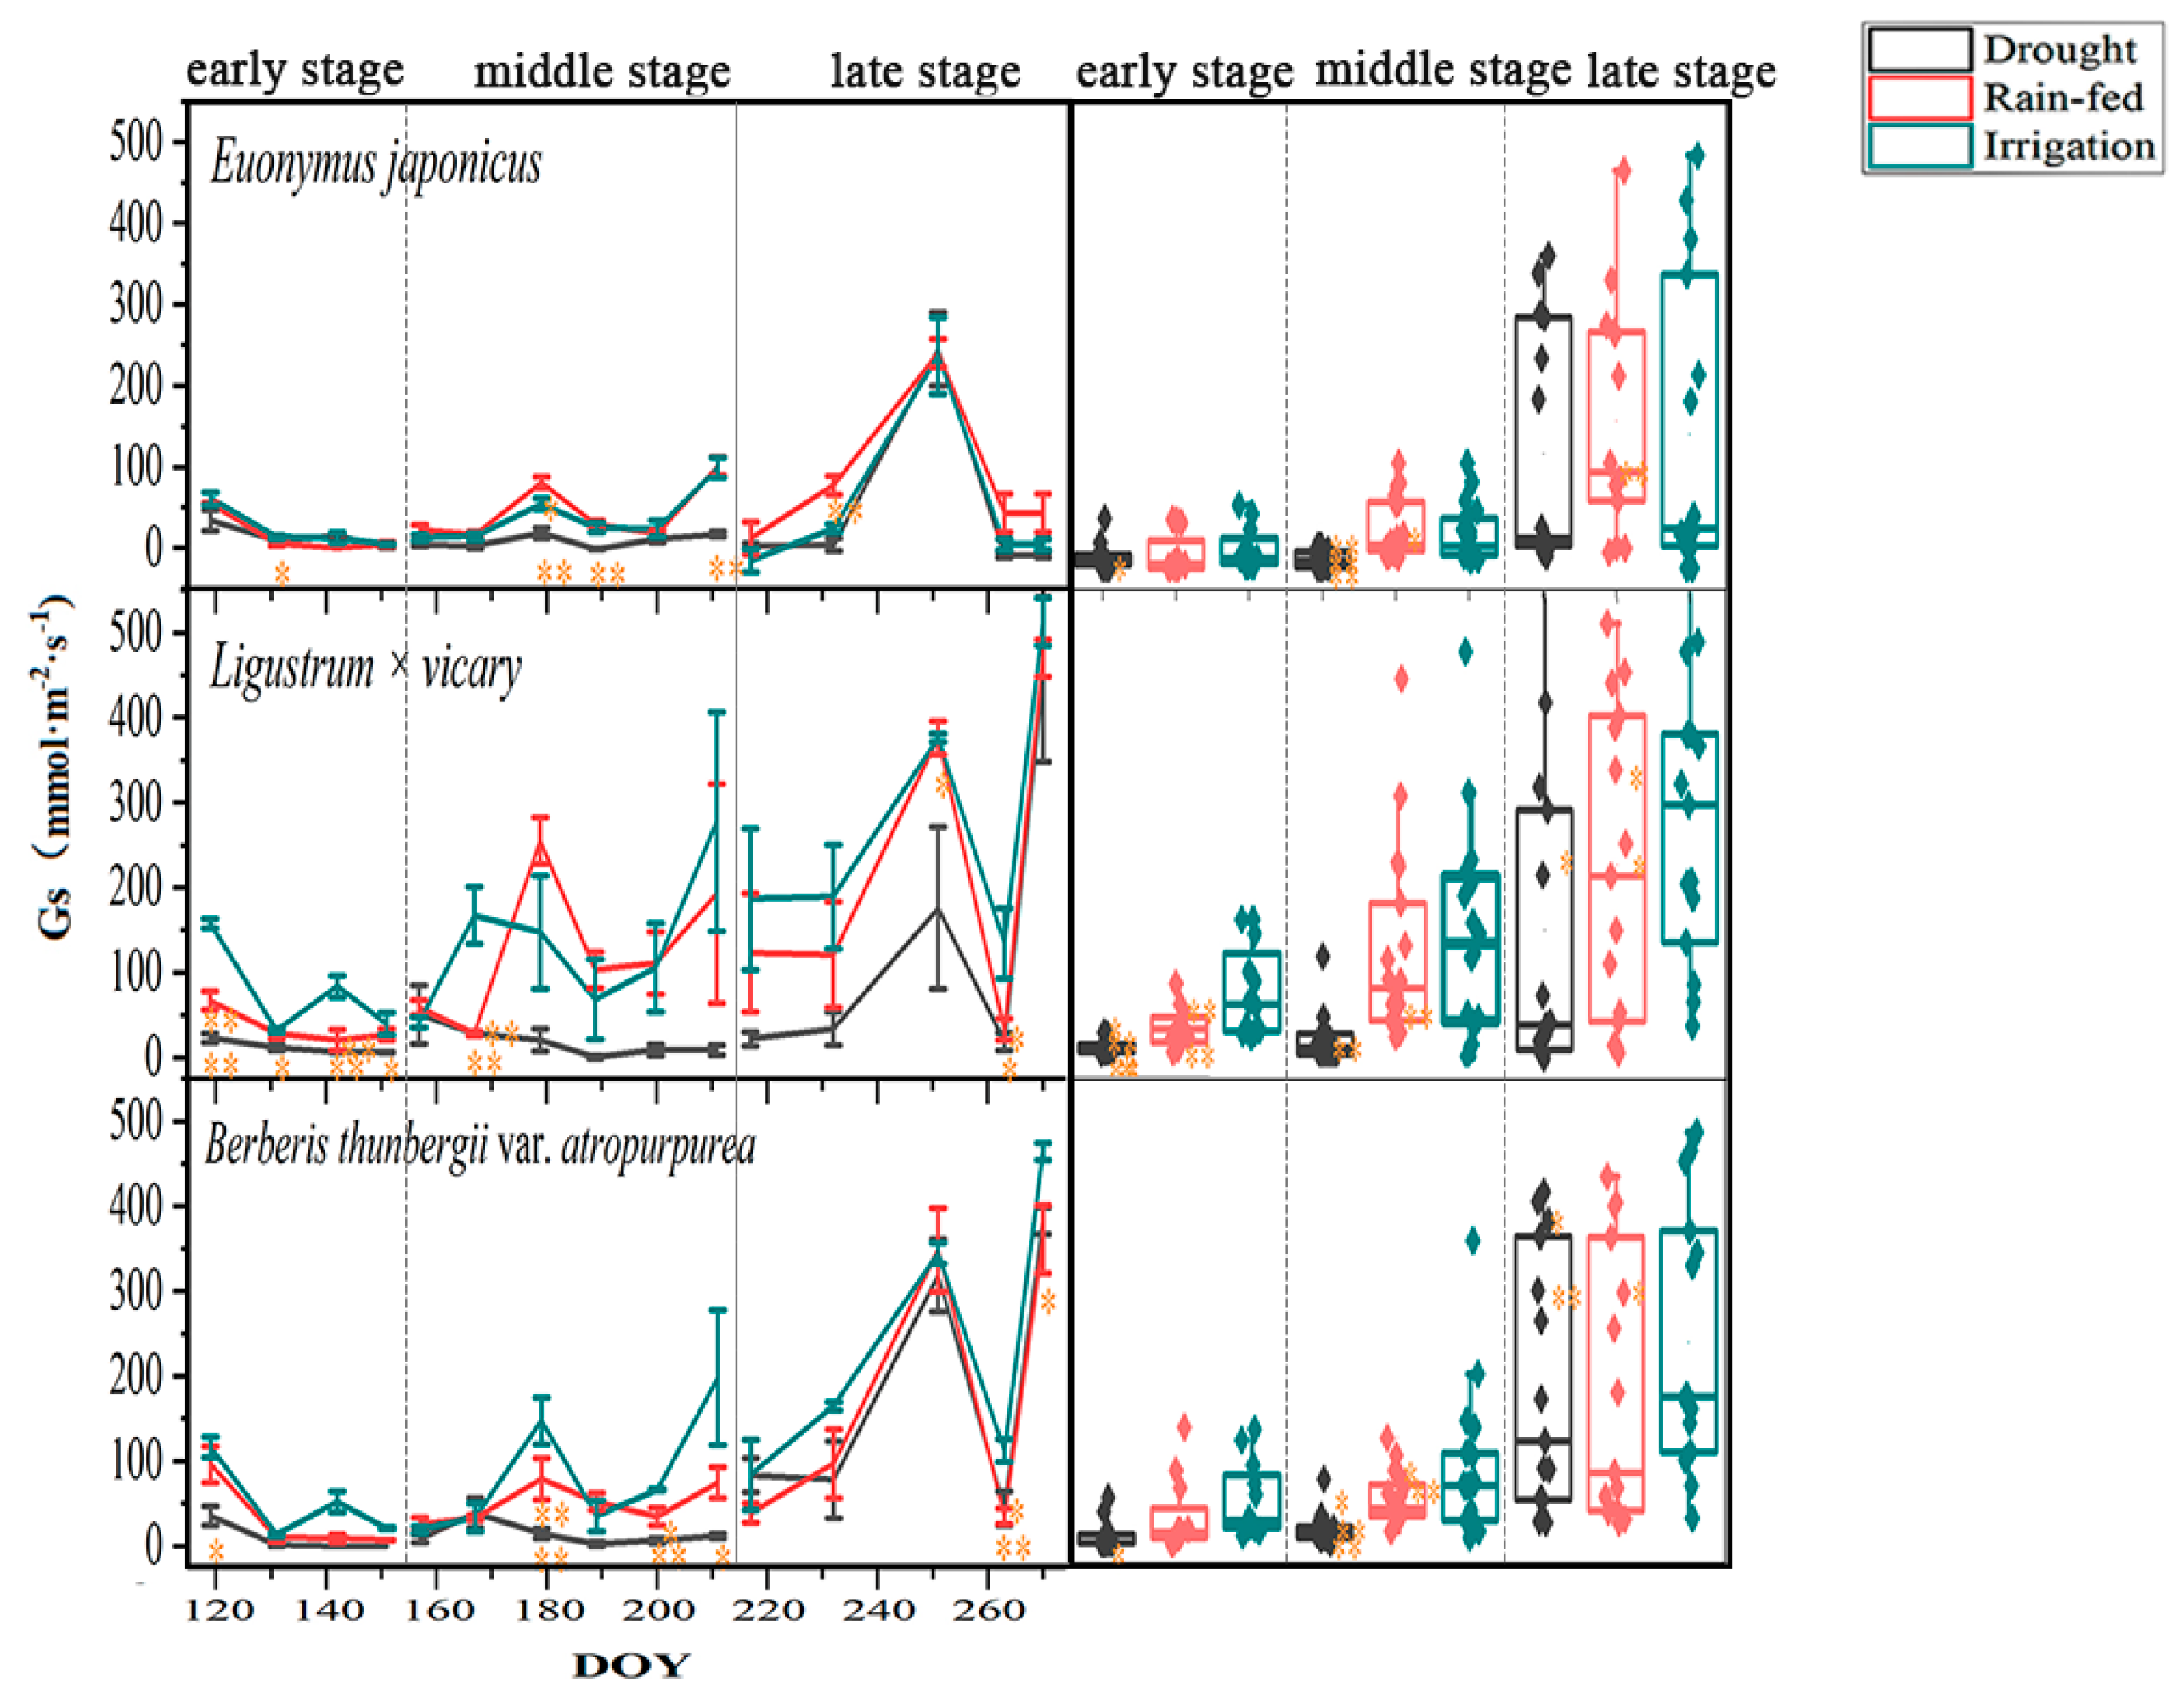
3.3. Response of Stomatal Conductance

The stomatal conductance varied in response to drought stress at different times of the growing season. The mean values of stomatal conductance during the early, middle, and late growing seasons were 30.04, 61.35, and 192.41 mmol·m−2·s−1, respectively, and they varied among the three species of shrubs (Figure 5). During the early growing season, the stomatal conductance in the drought and rainfed groups was lower than that in the irrigated groups with mean reductions of 38.68 and 23.06 mmol·m−2·s−1, respectively. The corresponding reductions during the middle growing seasons were 75.19 and 27.77 mmol·m−2·s−1, respectively. In the late growing season, the drought and rainfed groups decreased with mean values of 69.57 and 32.63 mmol·m−2·s−1, respectively, while the E. japonicus rainfed group did not change significantly. Moreover, in the end of the late growing season at DOY-260 (September 17), L. × vicaryi and B. thunbergii var. atropurpurea showed a significant sudden upward trend, while the trend for E. japonicus remained smooth (from 31.26 to 20.1 mmol·m−2·s−1 in the drought group) (Figure 5).

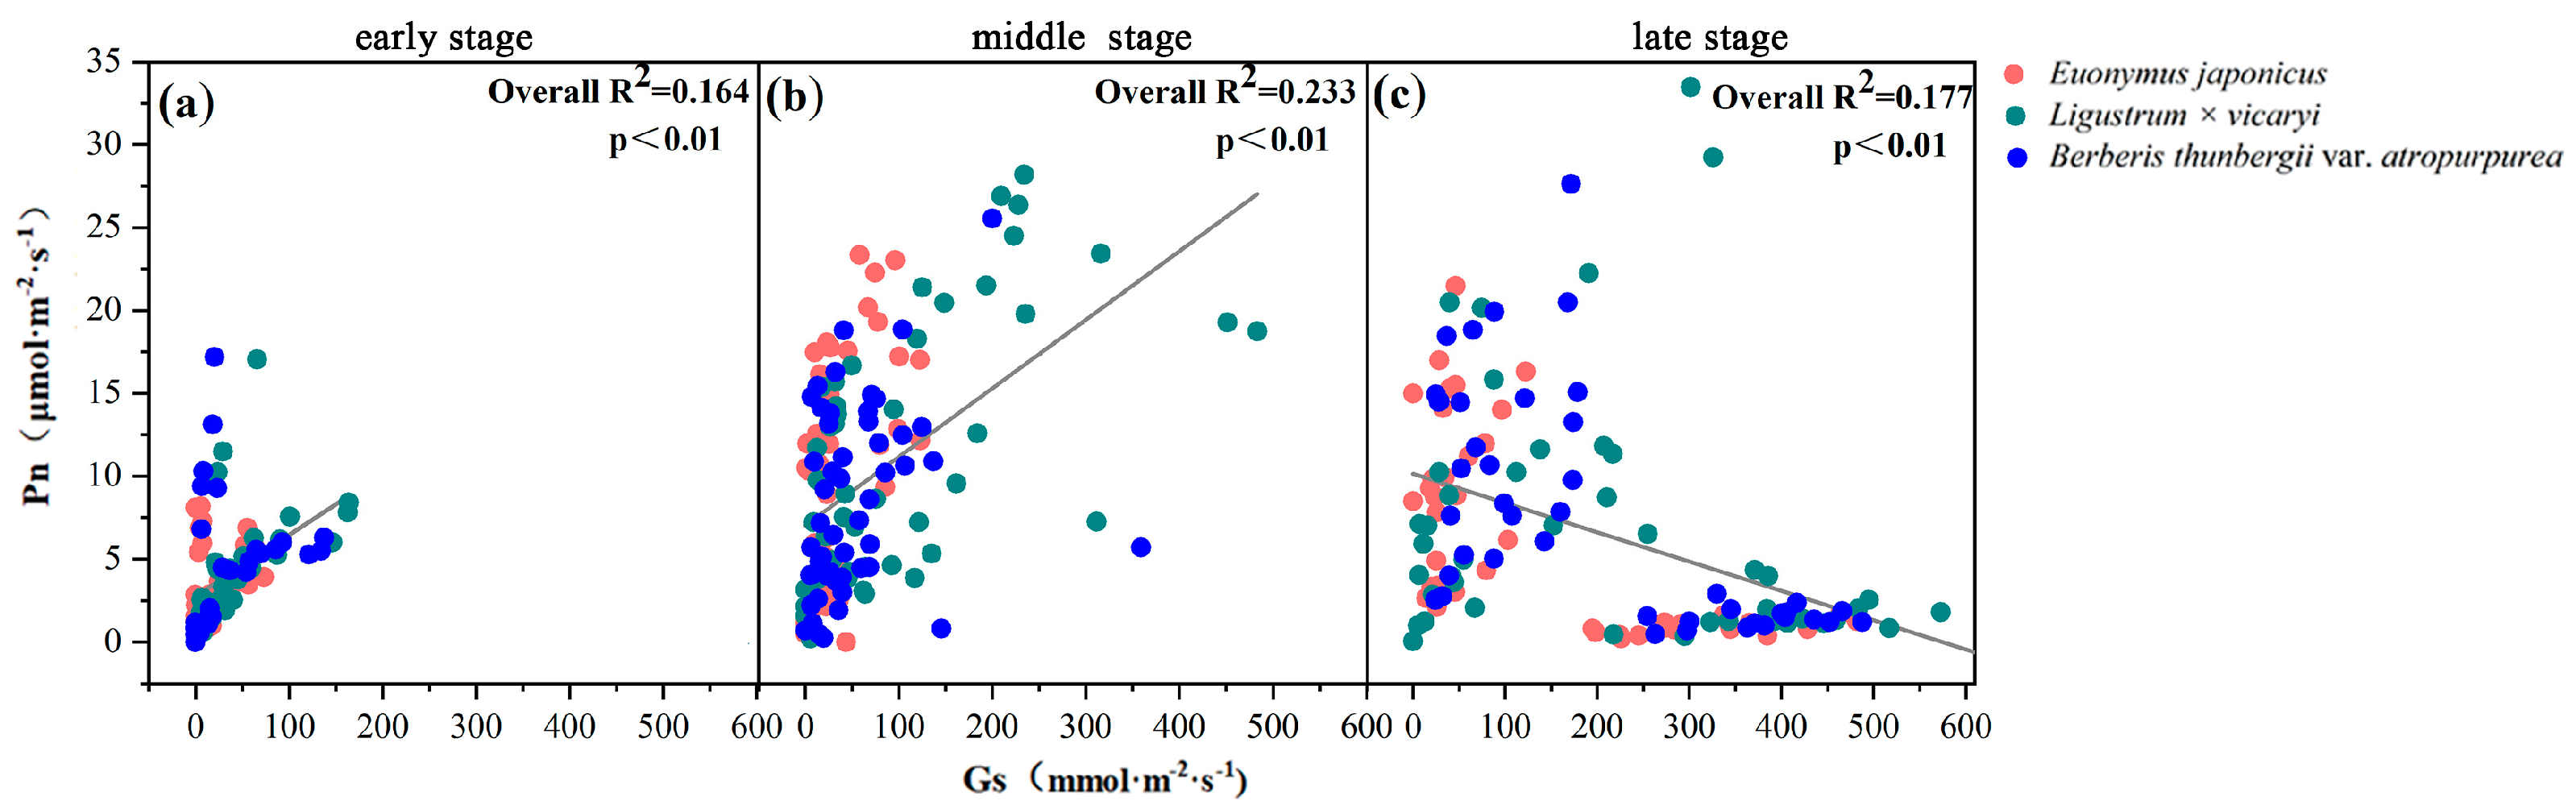
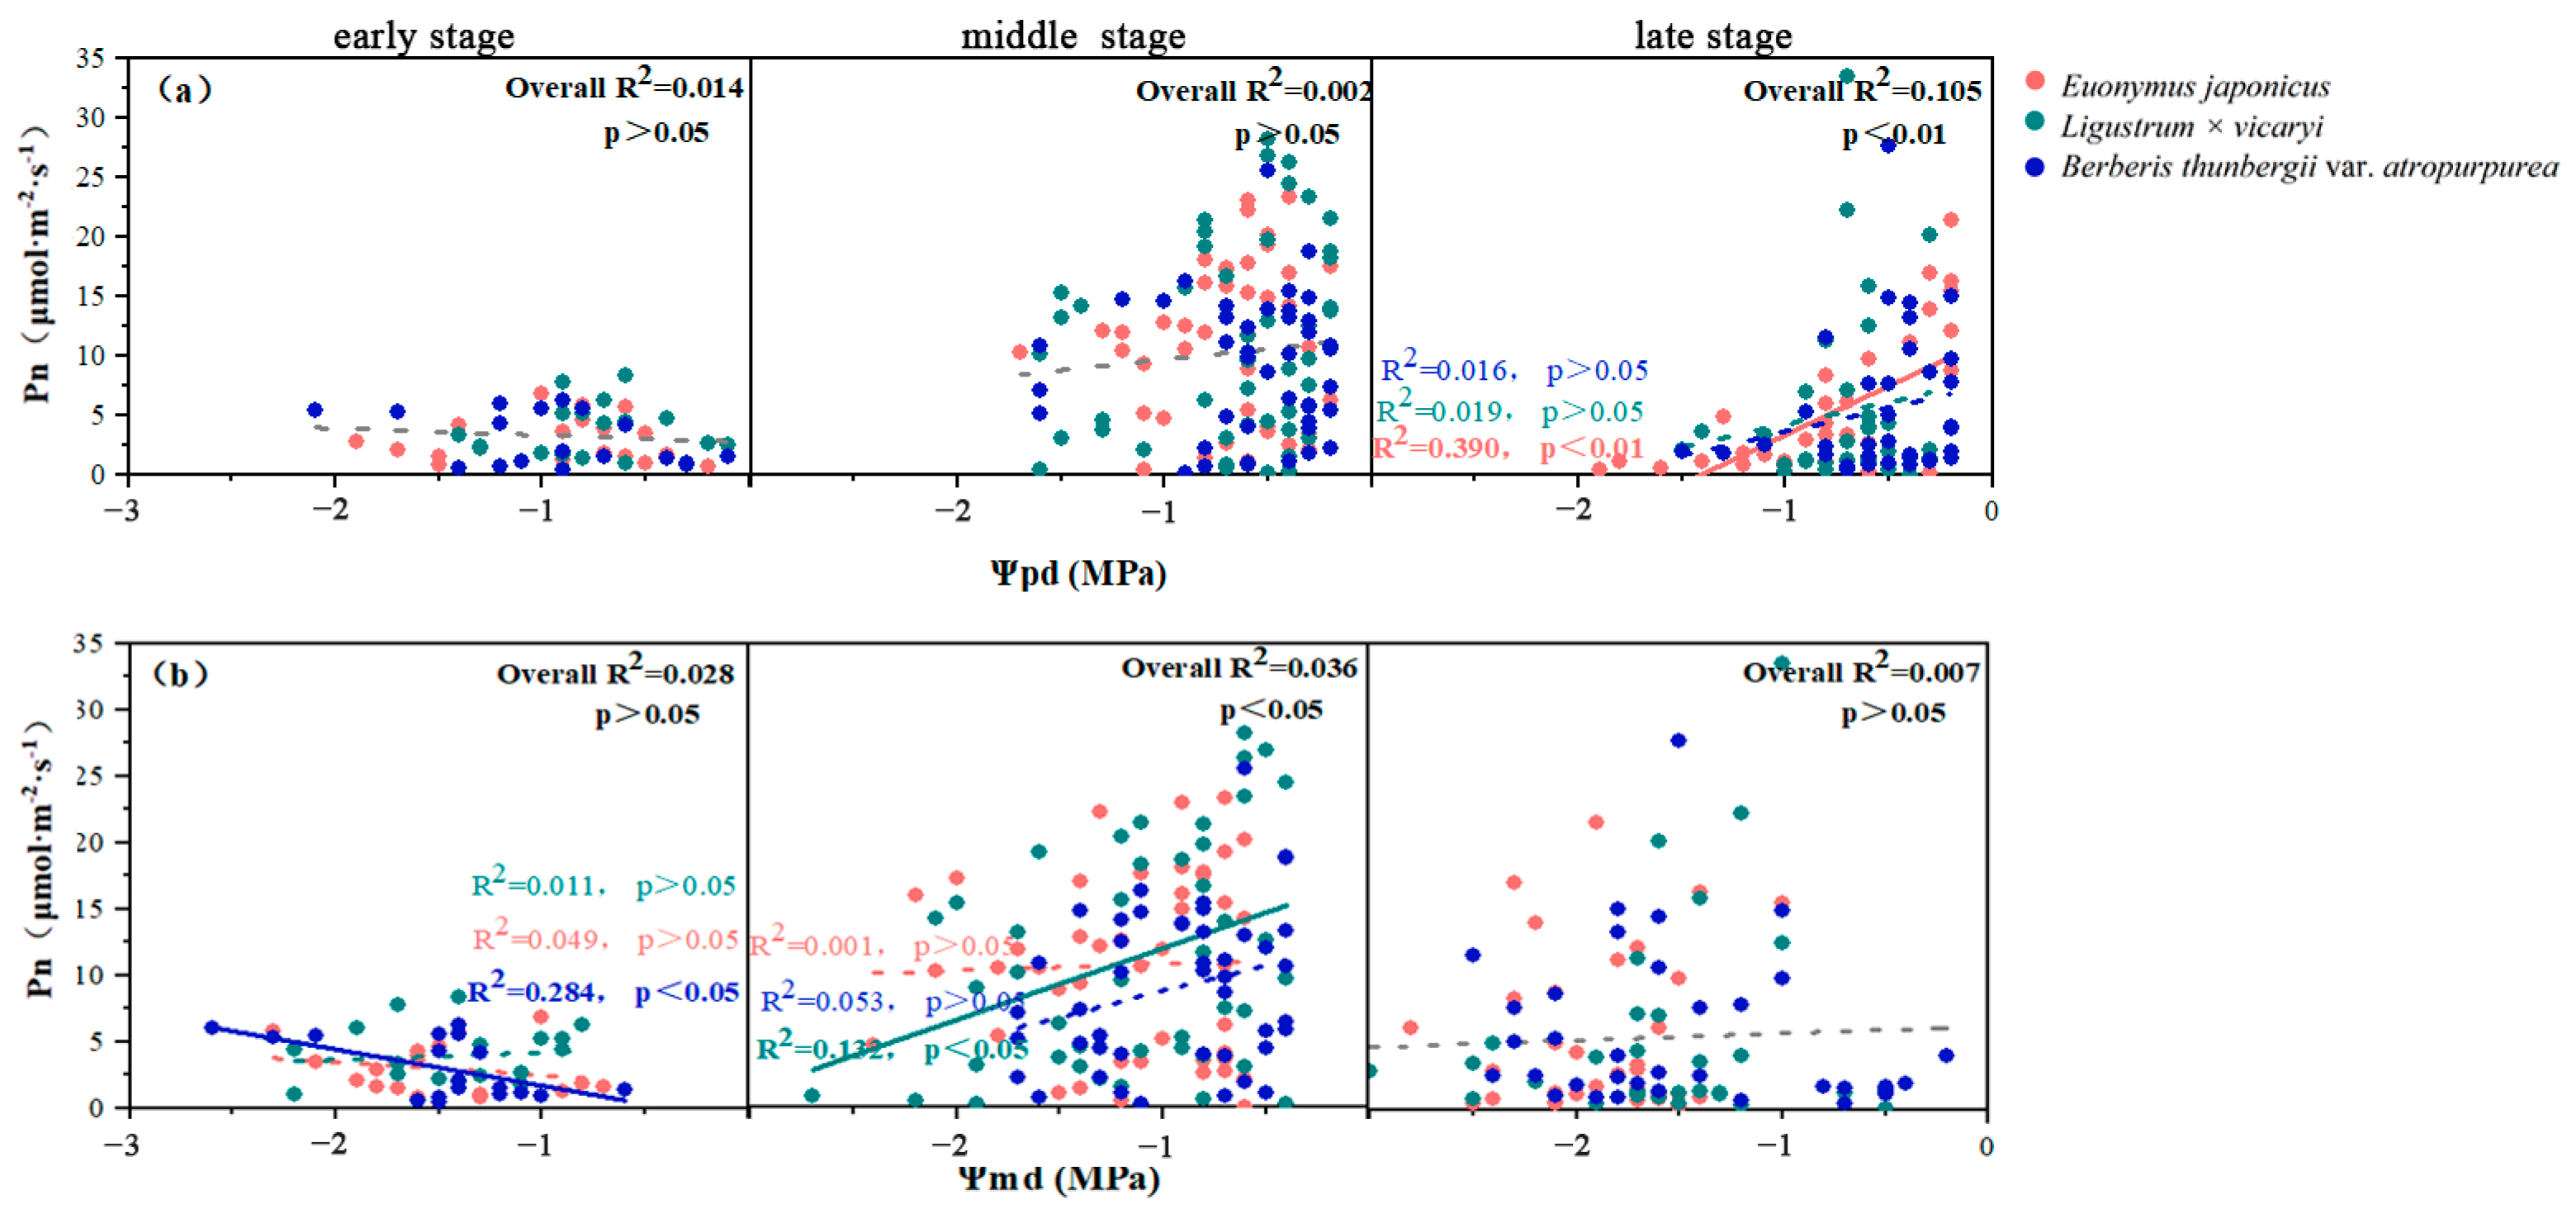
3.4. Relationships between the Photosynthetic Parameters and Leaf Water Potentials

The relationship between the photosynthetic rate and stomatal conductance varied among different periods of the growing season with a significant positive correlation (Figure 6a,b) (p < 0.01) in the early and middle parts of the growing season and a significant negative correlation in the late period (Figure 6c). However, when the late growing season was split into three time periods (5–20 August; 30 August–10 September; and 20–30 September, 2022), the trend of the positive correlation remained within each period of time (Figure S1). This suggests that late in the growing season (early autumn), the photosynthetic rate may no longer be dominated by stomatal conductance but rather decrease over time.
The relationships between the photosynthetic rate and leaf water potential changed between different periods of the growing season, as shown in Figure 7, with each water potential index lacking an overall significant relationship during the early growing season (R2 = 0.028, R2 = 0.014 for Ψpd and Ψmd, respectively), and the Ψpd was also unrelated to the photosynthetic rate in the middle of the growing season (R2 = 0.002). However, the Ψpd significantly affected the photosynthetic rate by the latter part of the season (R2 = 0.105, p < 0.01) (Figure 7a). The opposite was true for Ψmd, where the two interacted with each other in the middle of the growing season (R2 = 0.036, p < 0.05), and there was no overall significant relationship between the two later in the growing season (R2 = 0.007) (Figure 7b). The three shrubs also differed during the same period of the growing season with the Ψmd of B. thunbergii var. atropurpurea affecting the photosynthetic rates during the first and middle part of the growing season (R2 = 0.284 and R2 = 0.053, respectively), whereas the water potential of E. japonicus significantly affected the photosynthetic rates later in the growing season ( R2 = 0.390, p < 0.01).
Moreover, we developed a linear relationship between Ψpd and Ψmd for the three shrubs at different times of the growing season (Figure 8). The overall R2 values across the three species of shrubs during the early, middle, and late growing seasons were 0.131, 0.395, and 0.063, respectively (p < 0.05). The overall slopes of the Ψpd versus Ψmd during the middle growing season were close to 1.0 for all three species, and they ranged from 0.714 to 0.876 (p < 0.05). The linear relationships were consistently significant across the different periods for B. thunbergii var. atropurpurea with slopes that ranged from 0.638 to 0.739 (p < 0.05), while the other two species showed generally insignificant trends during the early and late growing seasons with slopes ranging from 0.063 to 0.238. L. × vicaryi had much lower slopes that were close to 0 (0.063 and 0.074) for the early and late growing seasons, respectively (Figure 8).

4. Discussion

4.1. Seasonal Differences in the Response of Three Shrubs to Water Deficit

We found a significant linear correlation between plant responses to drought stress in the middle of the growing season. As one of the primary consequences of water stress, plants often reduce their photosynthetic rates [41] and close their stomata to reduce water loss through transpiration [42,43]. Many studies have shown that when plants are subjected to drought, their leaves exhibit large reductions in their relative water content and water potential [44]. Here, our study provided field data for the seasonal characteristics of leaf photosynthetic rates and water potential in response to drought stress in typical shrubs, which contributes to a better understanding of drought adaptation in urban forestry at different times of the growing season. Our results showed that the responses to drought stress of typical shrubs used for greening in northern China may be compatible with the regional temperate continental monsoon climate. Both the leaf water potentials and photosynthetic rates exhibited greater sensitivity to drought during the middle growing season (midsummer) with a continuous decrease along the decreasing water gradient during the experimental periods (Figure 3 and Figure 4). These findings were consistent with our hypothesis, as well as those of other researchers that demonstrated that the leaf water potentials were sensitive indicators of drought [45,46]. Several previous studies have shown that the plant water status decreases significantly under limited conditions of soil moisture [47,48], and the leaf water potential can be one of the most effective indicators to determine the sensitivity of plants to water conditions [49].
We found that this pattern was the most pronounced only during the middle of the growing season, which was consistent with the findings of studies conducted in the summer in climates that are usually hot and dry. For example, it has been found that lower water potentials [50] and higher photosynthetic rates [51] could be observed in the summer. Consequently, drought may reduce the content of more soil water in mid-summer, and thus, the mid-summer climate may increase the sensitivity of photosynthesis to increasing temperatures [52]. However, we found that the decrease in leaf water potential and photosynthetic rates owing to the soil drought stress was minimized in the early and late growing seasons. In particular, the higher values of leaf water potential in the rainfed groups than in the irrigated groups during the early growing season may be related to the climatic adaptions for usually dry springs. Adequate irrigation in the early growing season (spring) may increase the water demand of the plants, which results in a decrease in their adaptability to the drier natural environment. In the late growing season (autumn), both the water potential values and photosynthetic rates tended to decrease owing to lower temperatures and air humidity compared with the middle growing season (mid-summer) [53].
In summary, we concluded that plants respond differently to a soil water deficit in different seasons. Therefore, in future studies, it can be important to conduct more comprehensive experiments in the spring and autumn when climatic conditions fluctuate considerably rather than only considering the peak of the growing season. Studies that merge different times will help to obtain a complete picture of the response of green plants to drought stress covering the whole growing season.

4.2. Differences in the Acclimation and Mechanisms of Responses of Three Shrubs to Water Deficits in the Growing Season

During the middle growing season, all three species exhibited stronger anisohydirc behavior, but in the early and late growing seasons, only B. thunbergii var. atropurpurea tended to be anisohydric. Although the general patterns of the response of the leaf water potential and photosynthetic parameters of the three shrub species were similar, the intensities of the drought response may vary among the tree species, which were supported by the presence of different mechanisms of adaptation [50,54]. All the three shrub species are the most common of all in North China’s hedge plants, but there are significant morphological differences among them. For example, E. japonicus has glossy green leaves with leathery surfaces and large blades with corrugated serrated edges, L. × vicaryi is characterized by golden-yellow leaves with smooth margins and pointed leaf tips, and B. thunbergii var. atropurpurea is a purplish-red leaf with smooth edges, several leaflets growing in one place, and thorny branches. These differences might explain some of the outlier data identified in the previous section. During the middle growing season, owing to the increase in air temperature and evapotranspiration, the uptake of water by the plants may fail to catch up with the consumption of water under a soil water deficit, and all the plant species closed their stomata to reduce transpiration [55] (the leaf chlorophyll content, transpiration rate and water use efficiency measured previously have been shown in the Figures S2–S4), which is also a characteristic of drought-resistant species [56]. For example, L. × vicaryi showed significant mean changes in the photosynthetic rate in the irrigated group late in the growing season, but the amplitudes of the responses of E. japonicus and B. thunbergii var. atropurpurea were much smaller (Figure 4). Among them, the most pronounced responses of L. × vicaryi may be related to its relatively large root system, which enables it to rapidly grow in suitable environments [57]. In contrast, the photosynthetic rates and stomatal conductances (the least significant changes between drought and full irrigation groups) of E. japonicus were the most stable, possibly because E. japonicus has leaves with thicker boundary layers that interfere with the dissipation of heat [58]. It has been previously suggested that the photosynthetic rates of E. japonicus may not be limited by stomata during the late-growing seasons [59], indicating that this hypothesis is probably true.
Studies have demonstrated that water-use characteristics varied with the species, irrigation regime, and climatic conditions [60]. Water regulation in plants always varies continuously between conservative isohydric regulation and adventive anisohydric regulation, which is primarily determined by the intrinsic genotypes of plants [61]. At molecular levels, several drought-responsive genes and transcription factors have been identified, such as the dehydration-responsive element-binding gene and aquaporin, etc., and prolonged drought caused it to accumulate NSCs in the branches [6,62]. However, in plants that are regulated isohydraulically, the stomata conservatively regulate their own water status to match their water supply capacity by controlling the rate of water dissipation [63]. Here, by developing a linear model, as utilized in a previous study that showed that the relationship between Ψpd and Ψmd explains 90% of the variability in leaf water potentials [64], we evaluated the adaptation and mechanisms of response of the three shrubs from the aspect of isohydrophilicity. The slopes ranged between 0 and 1.0 among the three shrubs, which suggests that by responding to soil drying, transpiration of the canopy decreases faster than plant hydraulic conductance, and therefore, the plant pressure decreases [65]. During the middle growing season, all three species exhibited stronger anisohydirc behavior (higher slopes close to 1.0), and they tended to maintain photosynthetic rates and stomatal apertures when faced with water deficit pressure. However, during the early and late growing seasons, only B. thunbergii var. atropurpurea tended to be anisohydric (slopes of 0.638 and 0.739, respectively), while E. japonicus and L. × vicaryi shifted to more pronounced isohydric behavior (slopes close to 0); thus, they tended to maintain their leaf water potentials by closing their stomata [63]. Considering the large variability that was measured in the water potential, these results indicate that the parameter values that were obtained are largely consistent within species and can be used to characterize the responses of species to differing effectiveness of soil water [65].
These results suggest that the responses of different shrubs to a water deficit in the same growing season can vary, and we found that depending on the different characteristics of the three periods of the growing season, it is necessary to invest more irrigation management in the early (April–May) and middle (June–July) times of the growing season for L. × vicaryi and B. thunbergii var. atropurpurea and reduce the water consumption for E. japonicus in the middle and late (August–September) times of the growing season to avoid excessive irrigation, indicating that the responses and mechanisms of adaptation should be analyzed in a comprehensive way throughout the growing season to draw more scientific and objective conclusions. Future research may require analyses of the combination of the seasonality of leaf-level stomatal regulation, water potential, and other factors, such as the root efficiency [35].

5. Conclusions and Prospects

Taking typical greening shrubs in the Beijing area as experimental objects, it was found in field experiments that a water deficit at different times had different effects on shrub species. The responses during the middle growing season were generally consistent with the linear relationships between the photosynthetic physiological parameters and water gradient, while during the early and late growing season, the three species of shrubs showed different responses. Among them, B. thunbergii var. atropurpurea showed a clear anisohydric behavior throughout the whole growing season, while L.×vicaryi showed the clearest isohydric behavior during the early and late growing seasons but was the most sensitive to drought. E. japonicus tended to be more plastic in its leaf water potential relationships and was the least sensitive to drought. There is a need to invest in more irrigation management for L.×vicaryi and B. thunbergii var. atropurpurea in the early (April–May) and mid-season (June–July), and for E. japonicus, in the mid-and late-season (August–September), water use can be reduced to avoid over-irrigation.
In future experiments, all the above indicators of plants can be comprehensively analyzed. For example, the carbon sink function of green space ecosystems is becoming increasingly important, the seasonal drought sensitivity of carbon exchange and its mechanisms can be further explored in the subsequent experiments, which can provide a better scientific theoretical basis for the construction of water-saving garden cities and maximize the ecological benefits of green shrubs. In the future, it is hoped that through fully integrating the seasonal data, mobile phone software can be developed to achieve one-click conversion of rainfall and irrigation, which in turn can provide guiding opinions for the manager for irrigation of landscape green space.

Supplementary Materials

The following supporting information can be downloaded at: https://www.mdpi.com/article/10.3390/agronomy14081772/s1, Figures S1–S4 and Tables S1 and S2. Relationships between the photosynthetic rate and stomatal conductance late in the growing season.

Author Contributions

Conceptualization, S.L. (Shaowei Lu) and X.X.; Methodology, S.L. (Shaoning Li), B.L. and X.X.; Resources, S.L. (Shaowei Lu), N.Z. and X.X.; Writing—original draft, J.L. and S.L. (Shaowei Lu); Writing—review and editing, J.L., S.L. (Shaowei Lu), S.L. (Shaoning Li), B.L., L.H., N.Z. and X.X.; Visualization, J.L. and L.H.; Supervision, S.L. (Shaoning Li), B.L., N.Z. and X.X.; Funding acquisition, S.L. (Shaoning Li), N.Z. and X.X. All authors have read and agreed to the published version of the manuscript.

Funding

This research was funded by the Funding Projects of the Science and Technology Innovation Capacity Building Project of Beijing Academy of Agricultural and Forestry Sciences, China (KJCX20220412) and the National Natural Science Foundation of China (32171537, 32171844).

Data Availability Statement

The data that support the findings of this study are available on request from the corresponding author.

Acknowledgments

We thank Jiahui Zhao for assisting in data collection in the field.

Conflicts of Interest

The authors declare no competing interests.

References

  1. United Nations. United Nations 2023 Water Conference Mid-Term Review of the Water Action Decade: Key Messages from the United Nations Regional Commissions; United Nations: Bangkok, Thailand, 2023. [Google Scholar]
  2. Balting, D.F.; AghaKouchak, A.; Lohmann, G.; Ionita, M. Northern Hemisphere drought risk in a warming climate. NPJ Clim. Atmos. Sci. 2021, 4, 61. [Google Scholar] [CrossRef]
  3. Chiang, F.; Mazdiyasni, O.; Agha Kouchak, A. Evidence of anthropogenic impacts on global drought frequency, duration, and intensity. Nat. Commun. 2021, 12, 2754. [Google Scholar] [CrossRef]
  4. Ghafari, S.; Kaviani, B.; Sedaghathoor, S.; Sadegh, M. Urban Forestry & Urban Greening Ecological Potentials of Trees, Shrubs and Hedge Species for Urban Green Spaces by Multi Criteria Decision Making. Urban For. Urban Green. 2020, 55, 126824. [Google Scholar] [CrossRef]
  5. Meineke, E.K.; Davies, T.J. Museum Specimens Provide Novel Insights into Changing Plant–herbivore Interactions. Philos. Trans. R. Soc. B Biol. Sci. 2019, 374, 20170393. [Google Scholar] [CrossRef]
  6. Farooq, M.; Wahid, A.; Kobayashi, N.; Basra, S.M.A.; Fujita, D.B. Plant Drought Stress: Effects, Mechanisms and Management. Agron. Sustain. Dev. 2009, 29, 185–212. [Google Scholar] [CrossRef]
  7. Vilagrosa, A.; Hernández, E.I.; Luis, V.C.; Cochard, H.; Pausas, J.G. Physiological Differences Explain the Co-Existence of Different Regeneration Strategies in Mediterranean Ecosystems. New Phytol. 2014, 201, 1277–1288. [Google Scholar] [CrossRef] [PubMed]
  8. Toscano, S.; Scuderi, D.; Giuffrida, F.; Romano, D. Responses of Mediterranean Ornamental Shrubs to Drought Stress and Recovery. Sci. Hortic. 2014, 178, 145–153. [Google Scholar] [CrossRef]
  9. Long, M. Comparative Study on the Structure and Function of Shrub Leaves in the Traffic Separation Green Belt on East University Road in Nanning City; Guangxi University: Guangxi, China, 2020; (In Chinese). [Google Scholar] [CrossRef]
  10. Qi, Y.; Wei, W.; Chen, C.; Chen, L. Plant Root-Shoot Biomass Allocation over Diverse Biomes: A Global Synthesis. Glob. Ecol. Conserv. 2019, 18, e00606. [Google Scholar] [CrossRef]
  11. Song, S.; Leng, H.; Feng, S.; Meng, C.; Luo, B.; Zhao, L.; Zhang, C. Biomass Allocation Pattern of Urban Shrubs in the Yangtze River Delta Region, China–A Field Observation of 13 Shrub Species. Urban For. Urban Green. 2021, 63, 127228. [Google Scholar] [CrossRef]
  12. Bradford, K.J.; Hsiao, T.C. Physiological Responses to Moderate Water Stress. In Physiologcal Plant Ecology II; Springer: Berlin/Heidelberg, Germany, 1982; pp. 263–324. [Google Scholar] [CrossRef]
  13. Hsiao, T.C. Plant responses to water stress. Ann. Rev. Plant Physiol. 1973, 24, 519–570. [Google Scholar] [CrossRef]
  14. Jones, H.G. Partitioning Stomatal and Non-stomatal Limitations to Photosynthesis. Plant. Cell Environ. 1985, 8, 95–104. [Google Scholar] [CrossRef]
  15. Anjum, S.A.; Xie, X.Y.; Wang, L.C.; Saleem, M.F.; Man, C.; Lei, W. Morphological, physiological and biochemical responses of plants to drought stress. Afr. J. Agric. Res. 2011, 6, 2026–2032. [Google Scholar] [CrossRef]
  16. Campbell, D.R.; Wu, C.A.; Travers, S.E. Photosynthetic and Growth Responses of Reciprocal Hybrids to Variation in Water and Nitrogen Availability. Am. J. Bot. 2010, 97, 925–933. [Google Scholar] [CrossRef] [PubMed]
  17. Ahluwalia, O.; Singh, P.C.; Bhatia, R. A review on drought stress in plants: Implications, mitigation and the role of plant growth promoting rhizobacteria. Resour. Environ. Sustain. 2021, 5, 100032. [Google Scholar] [CrossRef]
  18. Pereira, L.S.; Oweis, T.; Zairi, A. Irrigation Management under Water Scarcity. Agric. Water Manag. 2002, 57, 175–206. [Google Scholar] [CrossRef]
  19. Mitchell, P.-D.; Ke, G. Effects of regulating water deficit on tree growth, flowering, fruit development and yield of pear trees. Fujian Fruit Tree 1985, 3, 43–44. (In Chinese) [Google Scholar]
  20. Leib, B.G.; Caspari, H.W.; Redulla, C.A.; Andrews, P.K.; Jabro, J.J. Partial rootzone drying and deficit irrigation of ‘Fuji’ apples in a semi-arid climate. Irrig. Sci. 2006, 24, 85–99. [Google Scholar] [CrossRef]
  21. Tribulato, A.; Toscano, S.; Di Lorenzo, V.; Romano, D. Effects of Water Stress on Gas Exchange, Water Relations and Leaf Structure in Two Ornamental Shrubs in the Mediterranean Area. Agronomy 2019, 9, 381. [Google Scholar] [CrossRef]
  22. Chen, X.; Qi, Z.; Gui, D.; Sima, M.W.; Zeng, F.; Li, L.; Li, X.; Feng, S. Responses of Cotton Photosynthesis and Growth to a New Irrigation Control Method under Deficit Irrigation. Field Crop. Res. 2022, 275, 108373. [Google Scholar] [CrossRef]
  23. Jung, M.; Reichstein, M.; Ciais, P.; Seneviratne, S.I.; Sheffield, J.; Goulden, M.L.; Bonan, G.; Cescatti, A.; Chen, J.; De Jeu, R.; et al. Recent Decline in the Global Land Evapotranspiration Trend Due to Limited Moisture Supply. Nature 2010, 467, 951–954. [Google Scholar] [CrossRef]
  24. Kljun, N.; Black, T.A.; Griffis, T.J.; Barr, A.G.; Gaumont-Guay, D.; Morgenstern, K.; McCaughey, J.H.; Nesic, Z. Response of Net Ecosystem Productivity of Three Boreal Forest Stands to Drought. Ecosystems 2007, 10, 1039–1055. [Google Scholar] [CrossRef]
  25. Richardson, A.D.; Black, T.A.; Ciais, P.; Delbart, N.; Friedl, M.A.; Gobron, N.; Hollinger, D.Y.; Kutsch, W.L.; Longdoz, B.; Luyssaert, S.; et al. Influence of Spring and Autumn Phenological Transitions on Forest Ecosystem Productivity. Philos. Trans. R. Soc. B Biol. Sci. 2010, 365, 3227–3246. [Google Scholar] [CrossRef]
  26. Piao, S.; Ciais, P.; Friedlingstein, P.; Peylin, P.; Reichstein, M.; Luyssaert, S.; Margolis, H.; Fang, J.; Barr, A.; Chen, A.; et al. Net Carbon Dioxide Losses of Northern Ecosystems in Response to Autumn Warming. Nature 2008, 451, 49–52. [Google Scholar] [CrossRef] [PubMed]
  27. Yousfi, S.; Marin, J.F.; Parra, L.; Lloret, J.; Mauri, P.V. Remote sensing devices as key methods in the advanced turfgrass phenotyping under different water regimes. Agric. Water Manag. 2022, 266, 107581. [Google Scholar] [CrossRef]
  28. Miller, D.L.; Alonzo, M.; Roberts, D.A.; Tague, C.L.; McFadden, J.P. Drought response of urban trees and turfgrass using airborne imaging spectroscopy. Remote Sens. Environ. 2020, 240, 111646. [Google Scholar] [CrossRef]
  29. De Micco, V.; Aronne, G. Occurrence of Morphological and Anatomical Adaptive Traits in Young and Adult Plants of the Rare Mediterranean Cliff Species Primula palinuri Petagna. Sci. World J. 2012, 2012, 471814. [Google Scholar] [CrossRef]
  30. Robinson, T.M.P.; La Pierre, K.J.; Vadeboncoeur, M.A.; Byrne, K.M.; Thomey, M.L.; Colby, S.E. Seasonal, Not Annual Precipitation Drives Community Productivity across Ecosystems. Oikos 2013, 122, 727–738. [Google Scholar] [CrossRef]
  31. Bates, J.D.; Svejcar, T.; Miller, R.F.; Angell, R.A. The Effects of Precipitation Timing on Sagebrush Steppe Vegetation. J. Arid Environ. 2006, 64, 670–697. [Google Scholar] [CrossRef]
  32. De Boeck, H.J.; Dreesen, F.E.; Janssens, I.A.; Nijs, I. Whole-System Responses of Experimental Plant Communities to Climate Extremes Imposed in Different Seasons. New Phytol. 2011, 189, 806–817. [Google Scholar] [CrossRef]
  33. Mulhouse, J.M.; Hallett, L.M.; Collins, S.L. The Influence of Seasonal Precipitation and Grass Competition on 20 Years of Forb Dynamics in Northern Chihuahuan Desert Grassland. J. Veg. Sci. 2017, 28, 250–259. [Google Scholar] [CrossRef]
  34. Munson, S.M.; Lauenroth, W.K. Controls of Vegetation Structure and Net Primary Production in Restored Grasslands. J. Appl. Ecol. 2014, 51, 988–996. [Google Scholar] [CrossRef]
  35. Leuschner, C.; Wedde, P.; Lübbe, T. The Relation between Pressure–volume Curve Traits and Stomatal Regulation of Water Potential in Five Temperate Broadleaf Tree Species. Ann. For. Sci. 2019, 76, 60. [Google Scholar] [CrossRef]
  36. Zhou, J. Change of biodiversity conservation concept in the era of ecological civilisation. People’s Forum-Acad. Front. 2022, 4, 16–23. (In Chinese) [Google Scholar] [CrossRef]
  37. Zhou, Y. Potential Annual Water Consumption of Green Plants in Beijing; Beijing Forestry University: Beijing, China, 2020. (In Chinese) [Google Scholar]
  38. Hou, L.W.; Lu, S.W.; Li, S.N. Effects of drought on dry mass partitioning and root distribution of three shrub species. J. Plant Resour. Environ. 2023, 32, 34–42. (In Chinese) [Google Scholar]
  39. Xu, X.; Liu, H.; Wang, W.; Hu, G.; Wu, X.; Song, Z. Effects of Manipulated Precipitation on Aboveground Net Primary Productivity of Grassland Fields: Controlled Rainfall Experiments in Inner Mongolia, China. Land Degrad. Dev. 2021, 32, 1981–1992. [Google Scholar] [CrossRef]
  40. Yahdjian, L.; Sala, O.E. A Rainout Shelter Design for Intercepting Different Amounts of Rainfall. Oecologia 2002, 133, 95–101. [Google Scholar] [CrossRef] [PubMed]
  41. Hsiao, T.C.; Acevedo, E. Plant responses to water deficits, water-use efficiency, and drought resistance. Dev. Agric. Manag. For. Ecol. 1975, 1, 59–84. [Google Scholar] [CrossRef]
  42. Huang, B. Recent Advances in Drought and Heat Stress Physiology of Turfgrass—A Review. Acta Hortic. 2004, 661, 185–192. [Google Scholar] [CrossRef]
  43. Nayyar, H.; Gupta, D. Differential Sensitivity of C3 and C4 Plants to Water Deficit Stress: Association with Oxidative Stress and Antioxidants. Environ. Exp. Bot. 2006, 58, 106–113. [Google Scholar] [CrossRef]
  44. Hessini, K.; Wasli, H.; Al-Yasi, H.M.; Ali, E.F.; Issa, A.A.; Hassan, F.A.S.; Siddique, K.H.M. Graded Moisture Deficit Effect on Secondary Metabolites, Antioxidant, and Inhibitory Enzyme Activities in Leaf Extracts of Rosa damascena Mill. var. trigentipetala. Horticulturae 2022, 8, 177. [Google Scholar] [CrossRef]
  45. Scarascia-Mugnozza, G.; De Angelis, P.; Matteucci, G.; Valentini, R. Long-Term Exposure to Elevated [CO2] in a Natural Quercus Ilex L. Community: Net Photosynthesis and Photochemical Efficiency of PSII at Different Levels of Water Stress. Plant Cell Environ. 1996, 19, 643–654. [Google Scholar] [CrossRef]
  46. Luo, Q.H.; Ning, H.S.; He, M.; Ji, X.M.; Lei, C.Y. Ecophysiological responses of five sandy shrubs to drought stress. Sci. Silvae Sin. 2017, 53, 29–42. (In Chinese) [Google Scholar]
  47. Escobar-Gutiérrez, A.J.; Zipperlin, B.; Carbonne, F.; Moing, A.; Gaudillere, J.P. Photosynthesis, carbon partitioning and metabolite content during drought stress in peach seedlings. Funct. Plant Biol. 1998, 25, 197–205. [Google Scholar] [CrossRef]
  48. Rieger, M.; Lo Bianco, R.; Okie, W.R. Response of Prunus Ferganensis, Prunus Persica and Two Interspecific Hybrids to Moderate Drought Stress. Tree Physiol. 2003, 23, 51–58. [Google Scholar] [CrossRef] [PubMed]
  49. Mellisho, C.D.; Cruz, Z.N.; Conejero, W.; Ortuño, M.F.; Rodríguez, P. Mechanisms for Drought Resistance in Early Maturing Cvar Flordastar Peach Trees. J. Agric. Sci. 2011, 149, 609–616. [Google Scholar] [CrossRef]
  50. Haider, M.S.; Kurjogi, M.M.; Khalil-ur-Rehman, M.; Pervez, T.; Songtao, J.; Fiaz, M.; Jogaiah, S.; Wang, C.; Fang, J. Drought Stress Revealed Physiological, Biochemical and Gene-Expressional Variations in ‘Yoshihime’ Peach (Prunus persica L.) Cultivar. J. Plant Interact. 2018, 13, 83–90. [Google Scholar] [CrossRef]
  51. Lansac, A.R.; Zaballos, J.P.; Martin, A. Seasonal Water Potential Changes and Proline Accumulation in Mediterranean Shrubland Species. Vegetatio 1994, 113, 141–154. [Google Scholar] [CrossRef]
  52. Saxe, H.; Cannell, M.G.R.; Johnsen, Ø.; Ryan, M.G.; Vourlitis, G. Tree and Forest Functioning in Response to Global Warming. New Phytol. 2001, 149, 369–399. [Google Scholar] [CrossRef] [PubMed]
  53. Arend, M.; Brem, A.; Kuster, T.M.; Günthardt-Goerg, M.S. Seasonal Photosynthetic Responses of European Oaks to Drought and Elevated Daytime Temperature. Plant Biol. 2013, 15, 169–176. [Google Scholar] [CrossRef]
  54. Noordermeer, D.; Velasco, V.M.E.; Ensminger, I. Autumn Warming Delays the Downregulation of Photosynthesis and Does Not Increase the Risk of Freezing Damage in Interior and Coastal Douglas-Fir. Front. For. Glob. Change 2021, 4, 1–14. [Google Scholar] [CrossRef]
  55. Abrams, M.D. Adaptations and Responses to Drought in Quercus Species of North America. Tree Physiol. 1990, 7, 227–238. [Google Scholar] [CrossRef] [PubMed]
  56. Zeng, F.; Zhang, X.; Li, X.; Foetzki, A.; Runge, M. Seasonal variation of water potential of tamarisk and poplar at the southern edge of Taklamakan Desert. Chin. J. Appl. Ecol. 2005, 16, 1389–1393. (In Chinese) [Google Scholar]
  57. Sanchez-Diaz, M.F.; Kramer, P.J. Behavior of Corn and Sorghum under Water Stress and during Recovery. Plant Physiol. 1971, 48, 613–616. [Google Scholar] [CrossRef]
  58. Hou, L.W. Response of Biomass Allocation and Root Distribution of Three Greening Shrubs to Drought at Different Periods of the Growing Season; Shenyang Agricultural University: Shenyang, China, 2023. (In Chinese) [Google Scholar]
  59. Leigh, A.; Sevanto, S.; Close, J.D.; Nicotra, A.B. The Influence of Leaf Size and Shape on Leaf Thermal Dynamics: Does Theory Hold up under Natural Conditions? Plant Cell Environ. 2017, 40, 237–248. [Google Scholar] [CrossRef] [PubMed]
  60. Hassan, F.; Al-Yasi, H.; Ali, E.F.; Alamer, K.; Hessini, K.; Attia, H.; El-Shazly, S. Mitigation of salt stress effects by moringa leaf extract or salicylic acid through motivating antioxidant machinery in damask rose. Can. J. Plant Sci. 2021, 101, 157–165. [Google Scholar] [CrossRef]
  61. Reich, P.B. The World-Wide “fast-Slow” Plant Economics Spectrum: A Traits Manifesto. J. Ecol. 2014, 102, 275–301. [Google Scholar] [CrossRef]
  62. Xu, G.; Chen, T.; Liu, S.; Ma, J.; Li, Y. Within-crown plasticity of hydraulic properties influence branch dieback patterns of two woody plants under experimental drought conditions. Sci. Total Environ. 2022, 854, 158802. [Google Scholar] [CrossRef]
  63. Tardieu, F.; Simonneau, T. Variability among Species of Stomatal Control under Fluctuating Soil Water Status and Evaporative Demand: Modelling Isohydric and Anisohydric Behaviours. J. Exp. Bot. 1998, 49, 419–432. [Google Scholar] [CrossRef]
  64. Luo, D.D.; Wang, C.K.; Jin, Y. Plant Water-Regulation Strategies: Isohydric versus Anisohydric Behavior. Chin. J. Plant Ecol. 2017, 41, 1020–1032. [Google Scholar] [CrossRef]
  65. Martínez-Vilalta, J.; Poyatos, R.; Aguadé, D.; Retana, J.; Mencuccini, M. A New Look at Water Transport Regulation in Plants. New Phytol. 2014, 204, 105–115. [Google Scholar] [CrossRef]
Figure 1. Schematic diagram of the shrub planting. The size of each plot was a circle with a radius of 60 cm, and the spacing between each shrub species was 2 m. The number of shrubs presented in the figure is 81 in total.
Agronomy 14 01772 g001
Figure 2. Response of the pre-dawn water potential to the water control treatments. Panels on the left and right sides represent seasonal dynamics and seasonal mean values, respectively. DOY stands for the day of year. Each bar represents the mean value ± standard errors. Significance compared with the irrigation group: * 0.05 > p > 0.01. ** 0.01 > p > 0.001.
Agronomy 14 01772 g002
Figure 3. Response of the mid-day water potential to changes in moisture and mean values, respectively. Panels on the left and right sides represent seasonal dynamics and seasonal mean values, respectively. DOY stands for the day of year. Each bar represents the mean value ± standard errors. Significance compared with the irrigation group: * 0.05 > p > 0.01. ** 0.01 > p > 0.001.
Agronomy 14 01772 g003
Figure 4. Response of the photosynthetic rate to changes in water and mean values. Panels on the left and right sides represent seasonal dynamics and seasonal mean values, respectively. DOY stands for the day of year. Each bar represents the mean value ± standard errors. Significance compared with the irrigation group: * 0.05 > p > 0.01. ** 0.01 > p > 0.001.
Agronomy 14 01772 g004
Figure 5. Response of stomatal conductance to changes in the water and mean values. Panels on the left and right sides represent the seasonal dynamics and seasonal mean values, respectively. DOY stands for the day of year. Each bar represents the mean value ± standard errors. Significance compared with the irrigation group: * 0.05 > p > 0.01. ** 0.01 > p > 0.001.
Agronomy 14 01772 g005
Figure 6. The relationships between the photosynthetic rate and stomatal conductance during the (a) early, (b) middle, and (c) late growing seasons. Gs, stomatal conductance; Pn, photosynthetic rate. We used regression analysis to generate the lines and R2.
Agronomy 14 01772 g006
Figure 7. Relationship between the leaf (a) pre-dawn water potential (Ψpd) and (b) mid-day water potential (Ψmd) and the photosynthetic rate of each shrub during different periods of the growing season. We used regression analysis to generate the lines and R2.
Agronomy 14 01772 g007
Figure 8. Relationships between the pre-dawn and mid-day water potential during different periods of the growing season. Ψmd, mid-day water potential; Ψpd, pre-dawn water potential. We used regression analysis to generate the lines and R2.
Agronomy 14 01772 g008
Table 1. Seasonal mean soil water contents under different treatments (%).
DroughtRain-FedIrrigation
Early stage (1 April–31 May)15.91 ± 9.8820.17 ± 7.7831.07 ± 4.84
Middle stage (1 June–31 July)12.20 ± 5.0825.29 ± 3.7126.66 ± 2.99
Late stage (1 August–30 September)16.04 ± 7.1426.54 ± 1.3030.03 ± 1.57
Note: All data mean values ± standard errors across all shrub species and replications.
Disclaimer/Publisher’s Note: The statements, opinions and data contained in all publications are solely those of the individual author(s) and contributor(s) and not of MDPI and/or the editor(s). MDPI and/or the editor(s) disclaim responsibility for any injury to people or property resulting from any ideas, methods, instructions or products referred to in the content.

