Article

Comprehensive Perspective on Contamination Identification, Source Apportionment, and Ecological Risk Assessment of Heavy Metals in Paddy Soils of a Tropical Island

1
Institute of Geographic Sciences and Natural Resources Research, Chinese Academy of Sciences, Beijing 100101, China
2
University of Chinese Academy of Sciences, Beijing 100049, China
*
Author to whom correspondence should be addressed.
Agronomy 2024, 14(8), 1777; https://doi.org/10.3390/agronomy14081777
Submission received: 8 July 2024 / Revised: 28 July 2024 / Accepted: 9 August 2024 / Published: 13 August 2024

Abstract

:
The closed-loop material and energy cycles of islands increase the susceptibility of their internal ecosystem components to heavy metal accumulation and transfer. However, limited research on the island scale hinders our understanding of heavy metal environmental geochemistry in this unique environment. This study focused on assessing a tropical island’s ecological risk by investigating heavy metal contamination and potential sources. The results revealed elevated cadmium and nickel concentrations in 0.44–1.31% of soil samples, particularly in coastal plains and developed areas. Using the absolute principal component score-multiple linear regression (APCS-MLR) model assisted by GIS mapping, we identified three contamination sources: geological factors, agricultural activities, and traffic emissions. Network analysis indicated direct exposure risks of vegetation and soil microorganisms to contaminated soil (0.4611 and 0.7687, respectively), with nickel posing the highest risk, followed by Zn, Cd, Pb, Cu, and Cr with risks transferring across trophic levels. These findings provide crucial insights for mitigating ecological risks associated with heavy metals by controlling priority pollutants and their sources in tropical island environments.

1. Introduction

Soil, a precious natural resource, forms the foundation of sustainable agricultural development. In China, soil resources are notably scarce. Despite covering only 9% of the world’s arable land, cultivated land in China must support approximately 21% of the global population [1]. Therefore, contamination of soil resources severely hampers food security and sustainable economic development. Long-term exposure to polluted soil environments can cause serious damage at all trophic levels, including producers, consumers, and decomposers, ultimately affecting humans [2,3,4].
Effective control and management of heavy metal contamination is crucial for mitigating risks [5]. Identifying potential sources of soil heavy metals and quantitatively assessing their contributions are essential steps in this process, aiding in the prevention of soil contamination and minimizing health risks [6,7,8]. However, the challenge lies in discerning the sources of heavy metals in surface soil due to their natural presence in the Earth’s crust [2]. Various tools, including principal component analysis (PCA) [9], chemical mass balance (CMB) [10], edge analysis (UNMIX) [11,12], positive matrix factorization (PMF) [5,13,14], and absolute principal component score-multiple linear regression (APCS-MLR) [15,16] have been widely employed for heavy metal source apportionment. The most popular receptor models among them are APCS-MLR and PMF, which are used to identify contamination sources and develop sustainable policies to prevent and reduce heavy metal contamination.
Soil contamination poses significant risks to agricultural productivity, ecological sustainability, and human health [17]. Acting as the primary sink for pollutants from both natural and anthropogenic sources [18,19], soil accumulation of trace metals can have detrimental effects on the environment, especially in areas where levels surpass national soil standards and local background values [20]. This issue is particularly acute in paddy soils, where heavy metal accumulation poses severe ecological and health risks globally. Soil organisms and vegetation are directly impacted by heavy metal-rich soils due to their heightened sensitivity [21]. Moreover, heavy metal contamination can directly influence soil microbial communities by impeding their growth and metabolic activity, consequently affecting organic matter decomposition and nutrient cycling. Vegetation plays a crucial role in ecosystems as it absorbs nutrients and pollutants from the soil and transfers energy through the food chain. Furthermore, the risks posed to vegetation can be transmitted to and harm subsequent consumers (e.g., herbivores and carnivores) via the ecological food chain [22]. Carnivores and herbivores are indirectly influenced by heavy metal contamination through bioaccumulation and biomagnification after consuming contaminated prey or vegetation. The process of bioaccumulation and biomagnification increases heavy metal levels as trophic levels increase, which poses potential ecological risks to animals at higher levels, such as carnivores and herbivores. Heavy metals also negatively affect human health through accumulation, transformation, and uptake (oral intake, inhalation, or dermal contact) [23,24,25]. Therefore, assessing the ecological risks to food web components resulting from direct and indirect environmental interactions is crucial for formulating contamination control measures [26].
Hainan Island is an important area for studying the contamination status, sources, and influence of heavy metals on the ecosystem due to its unique geographical environment [27,28]. This tropical province in China comprises 42.5% of the country’s tropical land area, with a per capita land area of approximately 0.47 hectares. Benefiting from favorable conditions, including ample sunlight, heat, and water availability, Hainan Island supports the cultivation of three rice seasons annually, thus serving as a significant rice planting area and a crucial crop breeding base in China. Given its insular nature, Hainan operates within a closed-loop system of material and energy processes, rendering it susceptible to the accumulation and transfer of soil heavy metals [29]. Understanding the contamination levels of heavy metals in paddy soils, identifying their sources, and clarifying the risks posed by soil contamination between ecological components through substances and energy processes is crucial for sustainable development and conservation efforts. However, limited studies on the island scale have hindered our understanding of the environmental geochemical behavior of heavy metals in such unique environments. Therefore, this study aims to: (1) explore the concentration and spatial distribution of heavy metal contamination using two calculation methods derived from a contamination index; (2) identify and apportion potential contamination sources of seven heavy metals in paddy soils using the APCS-MLR model; (3) quantify direct and indirect ecological risks of heavy metal consumption across four trophic levels (producer: vegetation; consumers: herbivores and carnivores; decomposer: soil microorganisms) using a network environment analysis (NEA) framework. Our findings can provide guidance for lowering the ecological risks posed by soil heavy metals through the management of high-risk sources, thereby ensuring the long-term preservation of the distinctive ecological environment of the tropical agricultural ecosystem and human welfare.

2. Materials and Methods
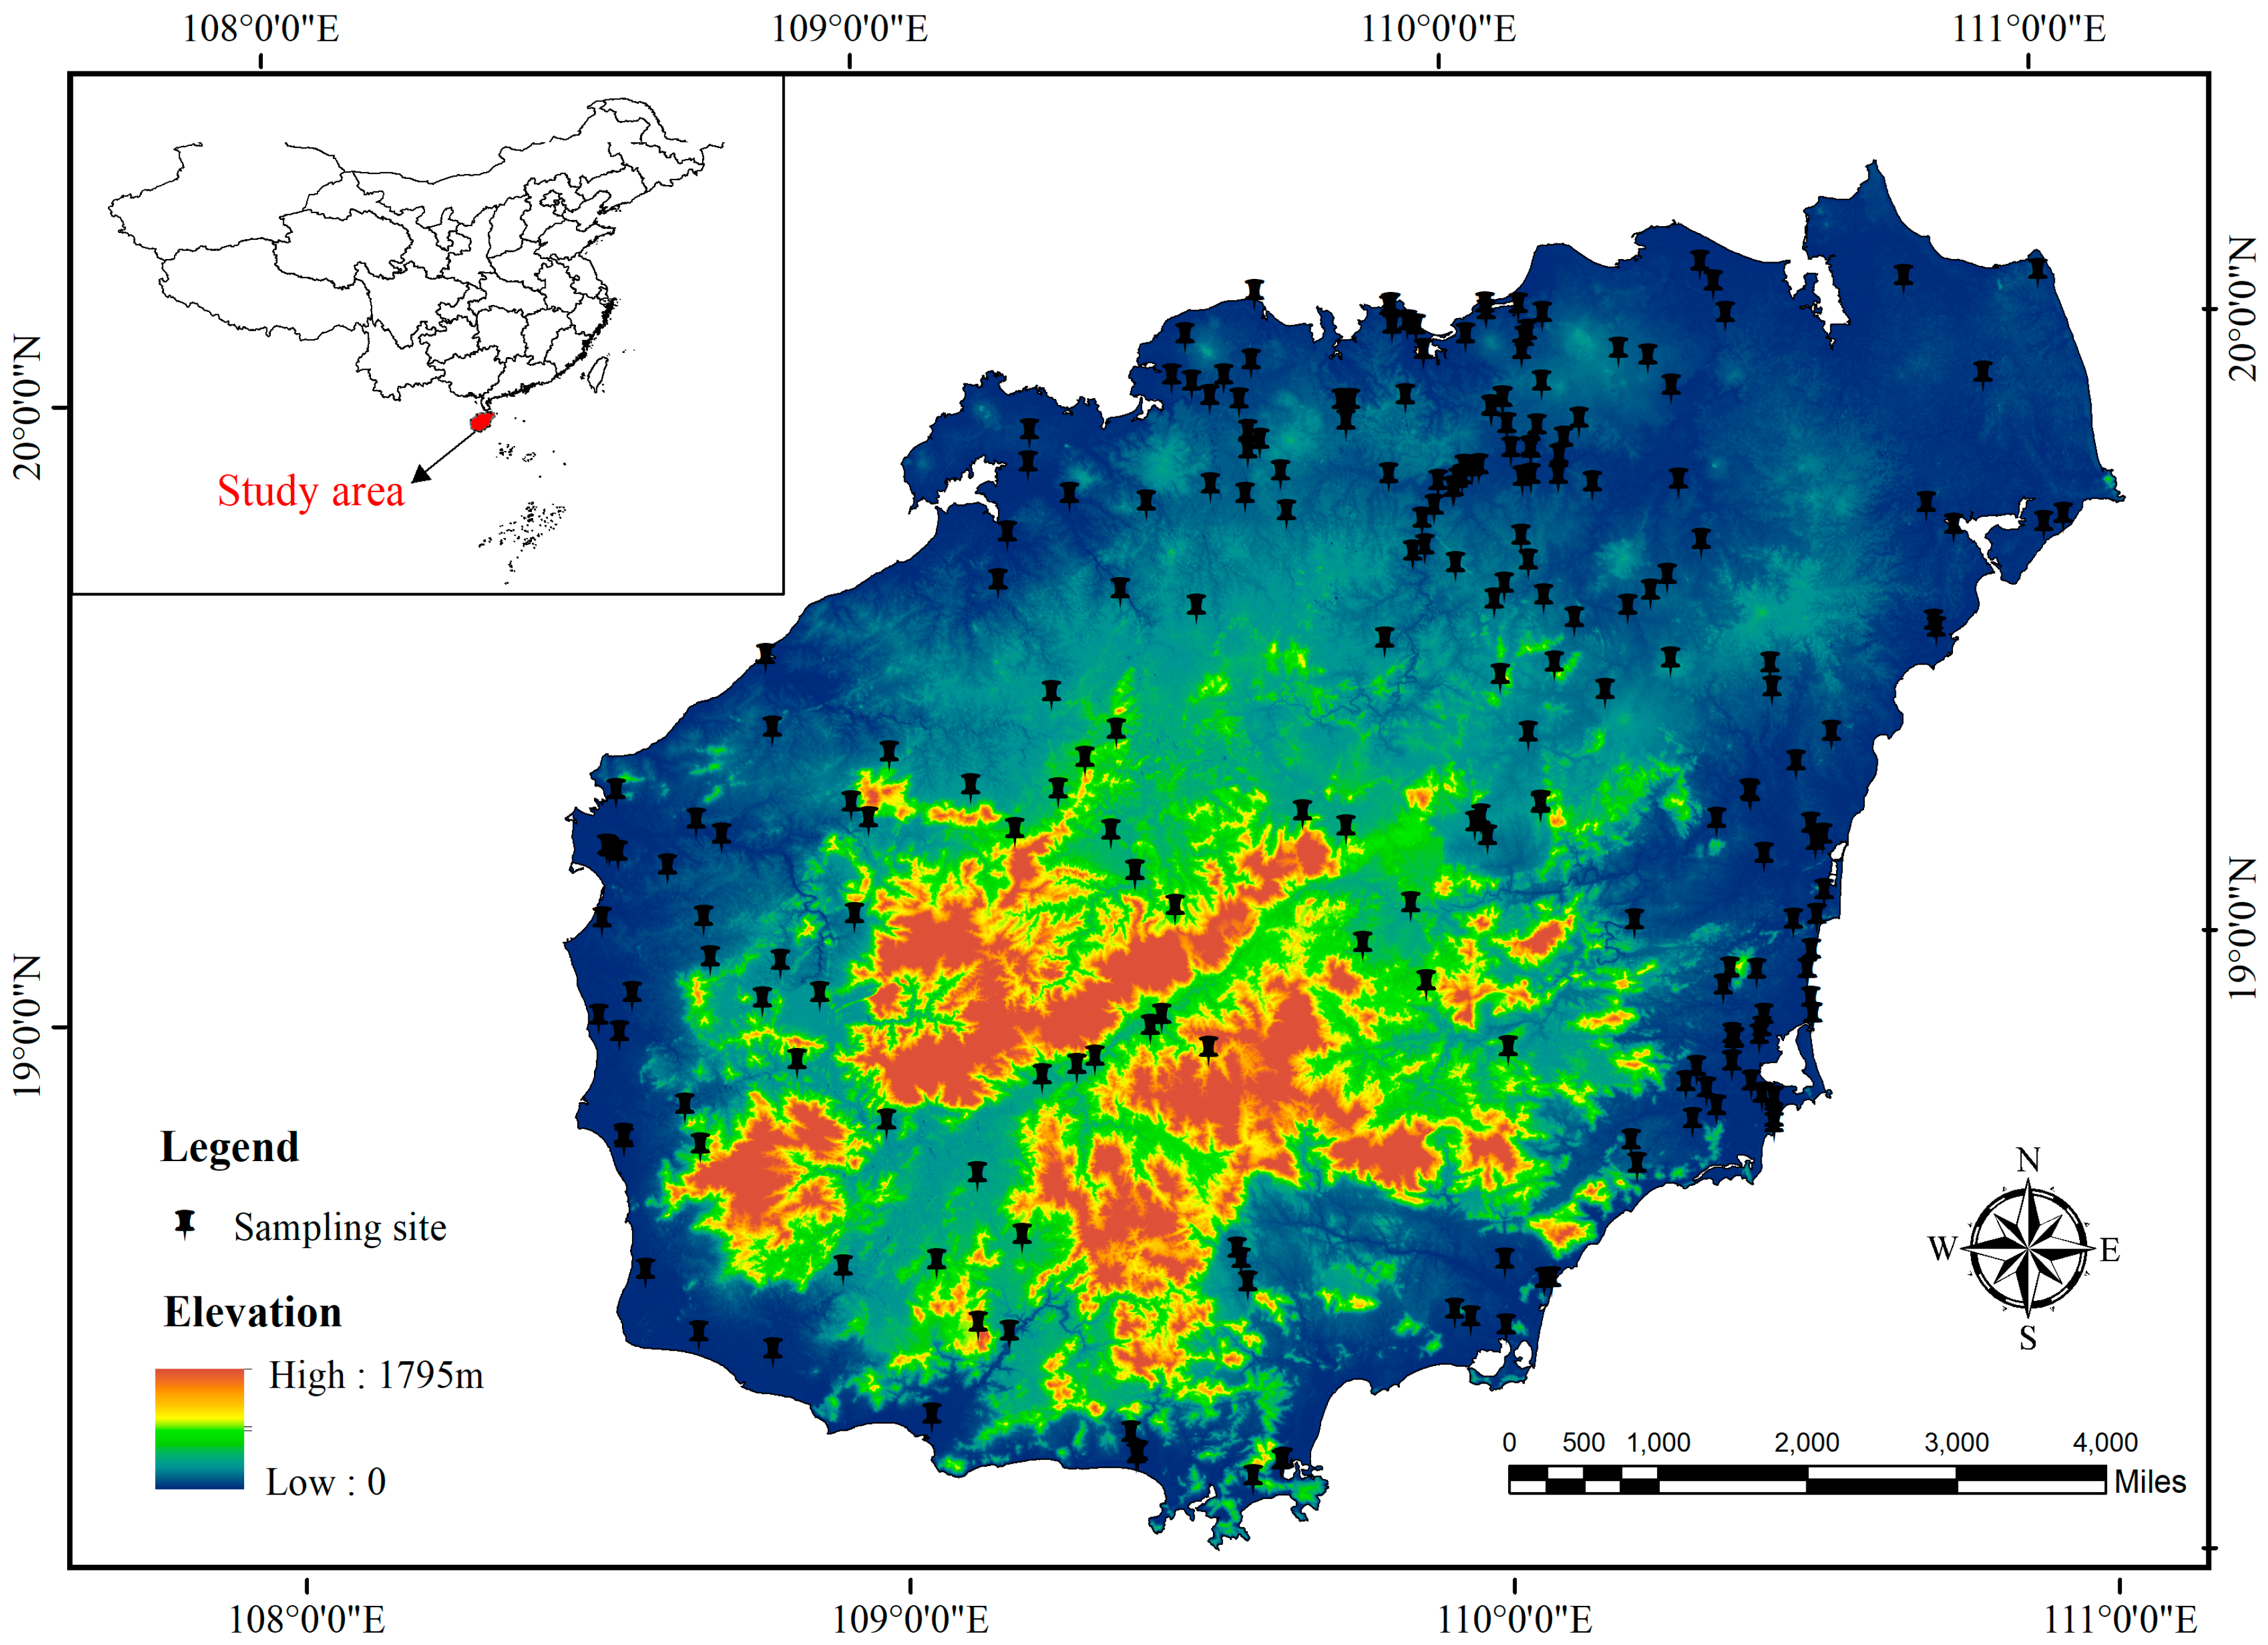
2.1. Study Area

Hainan Island is located northwest of the South China Sea (108°36′ E–111°3′ E, 18°10′ N–20°10′ N). It has a gross area of 354 km2, and the region is characterized as a tropical oceanic monsoon with ample light and heat energy [29]. The island’s topography features low-lying areas surrounding a central highland, resulting in a dome-shaped mountainous terrain. Landforms include mountains, hills, plateaus, and plains, forming distinct tiered structures. Favorable climatic conditions have given rise to valuable mineral resources on the island, including bauxite, coastal sand minerals, gem sand minerals, and leached-type rare-earth minerals, shaped over time by the maritime tropical monsoon climate. Hainan Island is an important agricultural production area in China, with frequent population movements and a concentration of agricultural related activities; at the same time, it has a unique natural environment and abundant medical, tourism, health, cultural, and other resources, making it a world-famous longevity island and base for international tourism and health demonstration. Industrial activities in Hainan Island are relatively weak, especially as the introduction of industries with serious pollution issues such as those that are “heavy metal-related” has been restricted, which creates a solid foundation for the development of the tourism and health industries.

2.2. Data Sources and Chemical Analysis

A total of 229 paddy soil samples were collected from the rice-growing regions of Hainan Island (Figure 1). The sampling locations were chosen based on changes in land use type and terrain factors. During sampling, contiguous farmland was selected to ensure the samples were representative. Topsoil samples (0–20 cm deep) were collected at each sampling site using the double diagonal method (with a weight > 1.000 g). The collected soil samples were placed in polyethylene bags and transported to the laboratory. All soil samples were naturally air-dried, and small objects, such as gravel and plant debris, were removed manually [30]. The samples were ground and filtered through 0.15-mm nylon sieves [4]. Subsequently, they were digested with a mixture of HNO3, HClO4, and HF (with a ratio of V1:V2:V3 = 8:1:8) in 100 mL Teflon crucibles, which were left standing for 12 h. Then, the digestion solution was placed on an electric heating plate in turn. The initial temperature of the electric hot plate was controlled at 100 °C, increased to 120–130 °C after two hours, increased to 140–160 °C for two hours, and then kept constant at 170 °C until the solution became colorless and transparent or light yellow, with only one drop remaining. Finally, the resulting clear digestion solutions were then directly diluted with a 1% HNO3 solution and stored at 4 °C until analysis.
Heavy metals, including cadmium (Cd), lead (Pb), chromium (Cr), nickel (Ni), copper (Cu), zinc (Zn), and manganese (Mn) were measured using an ELAN DRC II inductively coupled plasma mass spectrometer (ICP-MS; PerkinElmer Ltd., Waltham, MA, USA) [31]. Fe and P were measured using an OPTIMA 5300DV inductively coupled plasma optical emission spectrometer (ICP-OES) (PerkinElmer, Waltham, MA, USA). The detection limits for the elements are as follows: Mn is 1 ppb (1 × 10⁻⁶ mg kg−1), Pb, Cr, Ni, Cu, and Zn are 0.1 ppb (1 × 10⁻⁷ mg kg−1), and Cd is 1 ppt (1 × 10⁻⁹ mg kg−1). Three blank and three soil standard reference material samples (GBW07410) were used to ensure quality control. A set of parallel samples for every 10 samples was also used in the analysis. The recoveries in soil samples were 96.1–101.3% for soil Cd content, 89.5–109.3% for soil Pb content, 85.8–107.7% for soil Cr content, 87.5–109.4% for soil Ni content, 87.5–110.8% for soil Cu content, 90.8–112.6% for soil Zn content, and 85.8–104.9% for soil Mn content, respectively. The tested substances’ relative standard deviation (RSD) is <15%, which satisfies the USEPA’s requirement [32] of an RSD <30%.
Soil physicochemical properties, such as pH, organic carbon content (OC), and cation exchange capacity (CEC), for each paddy soil sample were sourced from the China soil map-based harmonized world soil database (HWSD; version v1.1, 2009), accessed through the National Tibetan Plateau Data Center [33]. Land-use type (1000 × 1000 m, Figure S1a) and road type data (Figure S1b) were acquired from the Resources and Environmental Sciences Data Center, Chinese Academy of Sciences (RESDC, 2020, http://www.resdc.cn, accessed on 10 March 2024), and OpenStreetMap, respectively. Metal mine data were obtained from China’s Mineral Resources Report for 2021 (Figure S1c). The data for metal-related factories (mining, metallurgy, and manufacturing) (Figure S1d) were obtained from points-of-interest gathered from Gaode Maps for 2023.

2.3. Contamination Level of Heavy Metals in Paddy Soils

The single factor pollution index (SFPI) and Nemerow composite pollution index (NCPI) were employed to evaluate heavy metal contamination levels in paddy soils. SFPI aids in identifying primary heavy metal pollutants and assessing the extent of damage with seven categories [34,35]. Meanwhile, NCPI evaluates the risk of heavy metal contamination in paddy soils. Due to the varying impacts of heavy metals on paddy soils and ecological environments, the mean NCPI value was derived using a weighted calculation method. To establish weights, this study adopted Swaine’s proposal to assign values of three, two, and one based on the importance of heavy metals to the environment (i.e., Cd: 3, Pb: 3, Cr: 3, Ni: 2, Cu: 2, and Zn: 2) [36]. The NCPI classification method defined by Förstner et al. (1990) was utilized to categorize the integrated contamination risk into five classes, enabling an evaluation classification [37]. The formulas of the single factor pollution index (SFPI) and Nemerow composite pollution index are as follows:
S F P I = C i S i
N C P I = ( P a v e 2 + P m a x 2 ) / 2
where SFPI refers to the single heavy mental pollution index, C i refers to concentrations of Cd in paddy soils, and S i refers to risk screen value of Cd in paddy soils [38]. NCPI refers to the integrated pollution risk for paddy soils. Pave and Pmax refers to the mean and maximum values of each heavy metal pollution index.

2.4. Contamination Source Apportionment

2.4.1. Regression Model

The regression model describes the relationship between variables by fitting a line to the observed data. Simple linear regression is used to estimate the relationship between two quantitative variables. Generally, linear regression models use straight lines, while logistic regression and nonlinear regression models use curves.

2.4.2. PCA Analysis

PCA analysis reduces the dimensionality of a dataset composed of a large number of correlated variables to minimize the loss of original information [4]. The principal component can be expressed as:
Z i j = α i 1 X 1 j + α i 2 X 2 j + α i 3 X 3 j + + α i m X m j
where Z is the component score, α is the component loading, X is the measured value of the variable, i is the component number, j is the sample number, and m is the total number of variables.
The FA can be expressed as:
Z i j = α f 1 f 1 i + α f 2 f 2 i + α f 3 f 3 i + + α f m f m i + e f i
where Z is the measured variable, α is the factor loading, f is the factor score, e is the residual term accounting for errors or other sources of variation, i is the sample number, and m is the total number of factors.
Kaiser–Meyer–Olkin (KMO) and Bartlett’s Sphericity tests were used to assess the applicability of data sets for PCA [39]. The evaluation criteria can be described as follows: when KMO > 0.9, it is very suitable for PCA; when 0.8 < KMO > 0.9, it is suitable for PCA; and when 0.7 < KMO > 0.8, PCA can be performed.

2.4.3. APCS-MLR Model

In the APCS-MLR model, absolute principal component scores and heavy metal concentrations are often used as independent and dependent variables, respectively [40]. Regression coefficients are then utilized to determine the contribution rate of each pollutant source. The specific calculation method is described by Sheng et al. (2022) [5].

2.5. Risk Assessments

2.5.1. Potential Ecological Risk

The potential risk between different ecological components related to soil heavy metals can be evaluated by the potential ecological risk index (PERI) [34]. This approach considers various factors, including heavy metal properties, environmental and behavioral characteristics, concentration levels, biological toxicity, and ecological effects [34]. The formula for PERI is as follows:
C f i = C s i B n i
P E R I = E f i = T f i × C f i
I R I = i = 1 n E f i
where C f i represents the heavy metal pollution coefficient, C s i represents the heavy metal concentration (mg kg−1), and B n i represents the heavy metal background value, which was taken from the soil environmental background value of Hainan Province in this study (Cd: 0.04, Pb: 28.4, Cr: 76.4, Cu: 19.3, Ni: 30.8, and Zn: 60.0. Units: mg kg−1) [41]. PERI is the potential ecological risk index, T f i   is the heavy metal toxicity response coefficient (Cd: 30, Pb: 5, Cr: 2, Ni: 10, Cu: 5, Zn: 1, Mn: 1), and IRI is the integrated risk index for multiple heavy metals in paddy soils [42,43].
In addition, the mean effect range median quotient (MERMQ) is used to identify and prioritize areas associated with soil quality that may potentially pose a threat to biological organisms [44]. The mean effect range median quotient (MERMQ) represents the 50th percentiles of harmful biological effects, and the specific calculation process is as follows:
M E R M Q = i = 1 n ( C i / E R M i ) n
where Ci is the heavy metal concentration, and n is the studied number of heavy metals. ERMi is the heavy metal’s effect range median (Cd: 0.2, Pb: 31.15, Cr: 41.38, Ni: 10.65, Cu: 18.41, Zn: 81.53, and Mn: 483.68). MERMQ considers the following parameters: low priority (probability of existing toxicity 9%) if MERMQ < 0.1, medium to low priority (probability of existing toxicity 21%) if 0.1 < MERMQ ≤ 0.5, high to medium priority (probability of existing toxicity 49%) if 0.5 < MERMQ ≤ 1.5, and high priority (probability of existing toxicity 76%) if MERMQ > 5.

2.5.2. Risk Allocation among Soil Microorganisms and Vegetation

The risks posed by environmental factors to ecological components in direct proximity to the soil, such as vegetation (V) and soil microorganisms (SM), provide information on the initial risk (Ri). The Ri is contingent upon the variability of the risk factors, the likelihood of their occurrence, and the susceptibility of specific organisms, which can be calculated using the following equations:
R i = I x   × P x × S x i , 0 R i 1
P x = P e x × P o x
I x   = I t x I o x m a x I t x , I o x ,   0 I x   1
where Ri is the initial risk (simulated and dimensionless), ΔIx is the risk intensity caused by the change of risk factor x at time (t) after interference, Px is the occurrence probability, and Sxi is the sensitivity of component I to indicator x. In this formula, Si = 0.3 (vegetation) or Si = 0.5 (soil microorganism) [45]. In Equation (2), Pox indicates the probability of risk, whereas Pex indicates the distribution probability. The specific calculation method used was described by Zerizghi et al. (2022) [46]. In Equation (3), Itx represents the measured value of the indicator x at time (t), and Iox is the Chinese background value of the indicator without interference [47].

2.5.3. Risk Flow Mechanism among Ecological Components

Network environment analysis (NEA) can quantify the complex ecological risks caused by multiple sources on ecological receptors within an ecosystem [48]. The control allocation (CA) controls the risk intensity from one component to another [16,45,49]. Details regarding the calculation of CA can be found in Supplementary Material S1. Notably, when an ecosystem is subjected to specific disturbances, both the transmission and interpretation of risk information occur between various components.

3. Results and Discussion

3.1. Soil Physicochemical Properties and Heavy Metal Concentrations

Table 1 displays the descriptive statistics for pH, OC, CEC, and heavy metal concentrations in the paddy soils. The average pH of paddy soils ranged from 4.40 to 8.9, with a median value of 5.20, indicating that most of the paddy soils in the studied area were slightly acidic. The OC ranged from 0.40 to 6.74% in weight, with a mean value of 1.33%. The mean CEC ranged from 1 to 32 cmol kg−1. This study used Kolmogorov Smirnov to test for normal distribution, ANOVA to analyze differences between data, and Tukey for post hoc testing. The results showed that the mean concentrations of soil heavy metals decreased in the following order: Zn > Cr > Pb > Ni > Cu > Cd (p < 0.01), and there is a significant difference between any two elements of them. These concentrations exceeded screening values regulated by risk control standards (Cd: 0.3; Pb: 80; Cr: 250; Ni: 60; Cu: 50; Zn: 200) [38] by 29.26%, 11.35%, 9.61%, 15.72%, 13.10%, and 6.55%, respectively. This indicates that Cd and Ni were the primary contaminants in Hainan Island. Moreover, Cd has been identified as a significant pollutant in agricultural soils in China [50].

3.2. Contamination Level of Heavy Metals in Paddy Soils

Knowledge about integrated contamination levels of heavy metals in tropical paddy soils is essential for island soil management. In this study, the SFPI and NCPI were selected and results showed that the SFPI values of heavy metals Cd, Pb, Cr, Ni, Cu, and Zn in paddy soils ranged from 0.067 to 5.333, 0.013 to 2.649, 0.007 to 2.649, 0.026 to 5.226, 0.018 to 2.423, and 0.016 to 2.879, with average values of 0.980, 0.538, 0.332, 0.537, 0.516, and 0.496, respectively (Figure 2). The proportions of different heavy metal contamination levels in the paddy soils are shown in Figure S2. According to Zhang et al. (2018) [52], most heavy metal contamination levels fell within the class of 0−3, while Cd and Ni contamination levels were within the class of 0−6. This indicates that the contamination levels of Cd and Ni at some sampling points were extremely high. Approximately 0.44 and 1.31% of the soil samples exhibited extremely high levels of Cd and Ni, respectively. From the spatial distribution maps showing the contamination levels in paddy soil samples (Figure 2a–f), it can be concluded that most of the soil contamination was concentrated in coastal plains and economically developed areas, such as Haikou, Chengmai, Danzhou, Lingao, and Wenchang. This may be because the coastal plain areas and economically developed regions of Hainan Island are the main production areas for rice, and factors such as the extensive use of pesticides and fertilizers may bring heavy metals into the soil during agricultural activities. Lead arsenate (PbHAsO4) insecticides have been widely used to control pests in different crop systems [53]. Bordeaux mixtures of copper sulfate (CuSO4) are commonly used to control fungal invasion in various crop systems [54], and phosphate fertilizers may contain 0.1–170, 7–38, and 7–225 milli-grams per kilogram of total Cd, Ni, Hg, and Pb, all of which are important sources of heavy metal elements [55]. Similarly, transportation is also an important source of heavy metals. Therefore, in order to prevent further pollution of heavy metals, crop rotation and fallow modes should be implemented in areas with severe pollution; or fertilizers and pesticides should be applied reasonably to reduce the accumulation of heavy metals; or finally, planting trees and forests on both sides of the road to reduce the opportunity for heavy metals to enter farmland through atmospheric deposition and other means.
The NCPI values ranged from 0.102 to 4.256, with an average of 1.001, indicating that it is slightly polluted (1.0 < NCPI ≤ 2.0) (Table S1). Based on the evaluation standards, around 4.80% of paddy soils were heavily polluted, primarily located in portions of the Haikou, Chengmai, Danzhou, Wenchang, Lingao, and Anding regions (Figure 2g). Additionally, approximately 21.83% of soil samples were slightly polluted, followed by those categorized as precautionarily polluted (17.47%) and moderately polluted (6.55%). The samples with NCPI values < 0.7 occupied most of the study area, accounting for 49.34%.

3.3. Source Apportionment

3.3.1. Correlation Analysis

Correlation analysis can help explore the relationships between these elements. The results showed that Cr–Ni (0.70), Cr–Cu (0.65), Cr–Fe (0.59), Ni–Cu (0.71), Ni–Fe (0.69), Cu–Zn (0.69), Cu–Mn (0.64), Cu–P (0.56), Zn–Mn (0.65), and Zn–P (0.62) had higher correlation coefficients, indicating the same or similar origins and geochemical behaviors (Figure 3).

3.3.2. PCA Analysis

Prior to PCA analysis, the data were tested using the Kaiser–Meyer–Olkin (KMO > 0.800) and Bartlett sphericity tests (p = 0.000) after standardization [9]. In this study, the results (KMO = 0.822 and p = 0.000) showed the suitability of these data. According to the principle of eigenvalues greater than 1, three principal components (PC1, PC2, and PC3) were extracted with an accumulative variance of 82.742% (Table 2).
According to these results, three principal components can explain 82.742% of the total data variance (Table 2). Among them, PC1 was dominated by Ni, Cr, and Fe. Generally, Fe, Cr, and Ni, which are iron group elements, are both readily bound to soil oxides and have a close relationship with the parent materials [24,56]. Cr and Ni are derived from alkaline and ultra-alkaline rocks. According to Table 1, the average concentration of Ni in paddy soil is lower than its background value, and the average concentration of Cr is 1.27 times the background value, which is very close to the concentration of the element background value. Thus, in this study, Ni and Cr are related to geogenic and pedogenic processes in paddy soils [24,56]. Therefore, Factor 1 can be considered the “geological source” since it reflects the comprehensive impact of the geological background.
PC2 was dominated by P, Zn, Cu, and Mn. The application of fertilizers and pesticides in pursuit of high yield is a common practice in China’s grain system [57]. These chemicals, especially phosphate fertilizers and pesticides, contain chemical mixtures of various heavy metals [58,59]. Phosphorus-containing fertilizers typically contain different heavy metal elements, including Cu and Zn, with concentrations of 0.41–11.6 and 4.87–348.2 mg kg−1, respectively [58]. Based on these reports, China applies approximately 1200 tons of Zn and 5000 tons of Cu-containing fertilizer to farmland every year, respectively [60]. Consequently, the application of these chemicals containing heavy metals gradually increases the pollution level of soil heavy metals. The Bordeaux mixture of copper sulfate (CuSO4) is often used as a protective fungicide in various crop systems, inhibiting the germination of pathogenic spores or mycelial growth by releasing soluble copper ions [54]. Cu and Zn also exist as additives in livestock feed by providing intestinal antibacterial agents [61] and controlling post-weaning diarrhea [62]. Mn is typically added to feed additives to increase feed conversion rates, boost egg production, and help prevent diseases [63,64]. The application of this manure by local farmers can also lead to the enrichment of heavy metals in paddy soil [65,66]. Therefore, PC2 can be considered as “agricultural activities”.
PC3 was dominated by Cd and Pb with a data variance of 0.861 and 0.882, respectively, which was much higher than the other PCs’ variance. According to relevant reports, the soil along highways often has high concentrations of Cd and Pb, and transportation is the main source of pollution [67,68,69,70]. Hainan Island has a well-developed tourism industry and high traffic volume. The road network diagram illustrates that the areas of paddy soils contaminated with Cd and Pb were primarily located in regions with high traffic flow or near intersections (Figure S1b). This phenomenon could be attributed to the presence of Pb in brake pads, tires, and lubricating oils [40,71], which are released into the environment during vehicle operation and subsequently settle in the soil. Additionally, Cd, a significant additive in automotive tire production, contributes to soil pollution as dust containing cadmium is discharged into the soil from vehicle tires. Despite the complete ban on Pb-containing gasoline, the accumulation of lead along roads remains a concern due to decades of leaded gasoline use [7]. Furthermore, heavy metals exhibit poor degradation in soil, emphasizing the ongoing importance of addressing contamination issues. Hainan Island harbors abundant Pb ore resources (Figure S1c). However, the spatial distribution of soil pollution indicates that the pattern of Pb pollution does not align with the distribution of Pb ore resources (Figure S1c), suggesting that the latter does not significantly contribute to the current soil Pb contamination. Therefore, PC3 can be characterized as “traffic emissions”.

3.3.3. Source Apportionment Based on APCS-MLR Model

Based on PCA results, we obtained the influence degree of each possible source and constructed the functional relationships between each possible source and its variables using the APCS-MLR model. The determination coefficient (R2 > 0.75) and significance level (p < 0.001) were used to check the validity of this model (Table S2), indicating better applicability in paddy soil. All sources’ contribution to each element was estimated through MLR equations. However, the sum of the three principal sources is less than 100%, indicating the presence of other sources.
Cr (63.75%), Ni (47.87%), and Fe (40.93%) primarily originated from geological sources (Figure S3). Conversely, P, Zn, Cu, and Mn were predominantly attributed to agricultural activities, with contribution rates of 85.86%, 74.19%, 44.45%, and 48.81%, respectively. Traffic emissions dominated the contribution to Cd and Pb, with contribution rates of 82.60% and 82.04%, respectively. Among the nine studied elements, PC4 (unknown sources) made a relatively weaker contribution, with Ni and Fe being the main constituents, possibly linked to limited industrial activities in Hainan Island. Overall, the APCS-MLR model showed that the main element contributions in paddy soil on Hainan Island were derived from geological sources and human activity–related sources. Among the sources related to human activities, agricultural activities and traffic emissions are the most prominent; this may be due to the developmental positioning of Hainan Island.

3.4. Risk Assessment

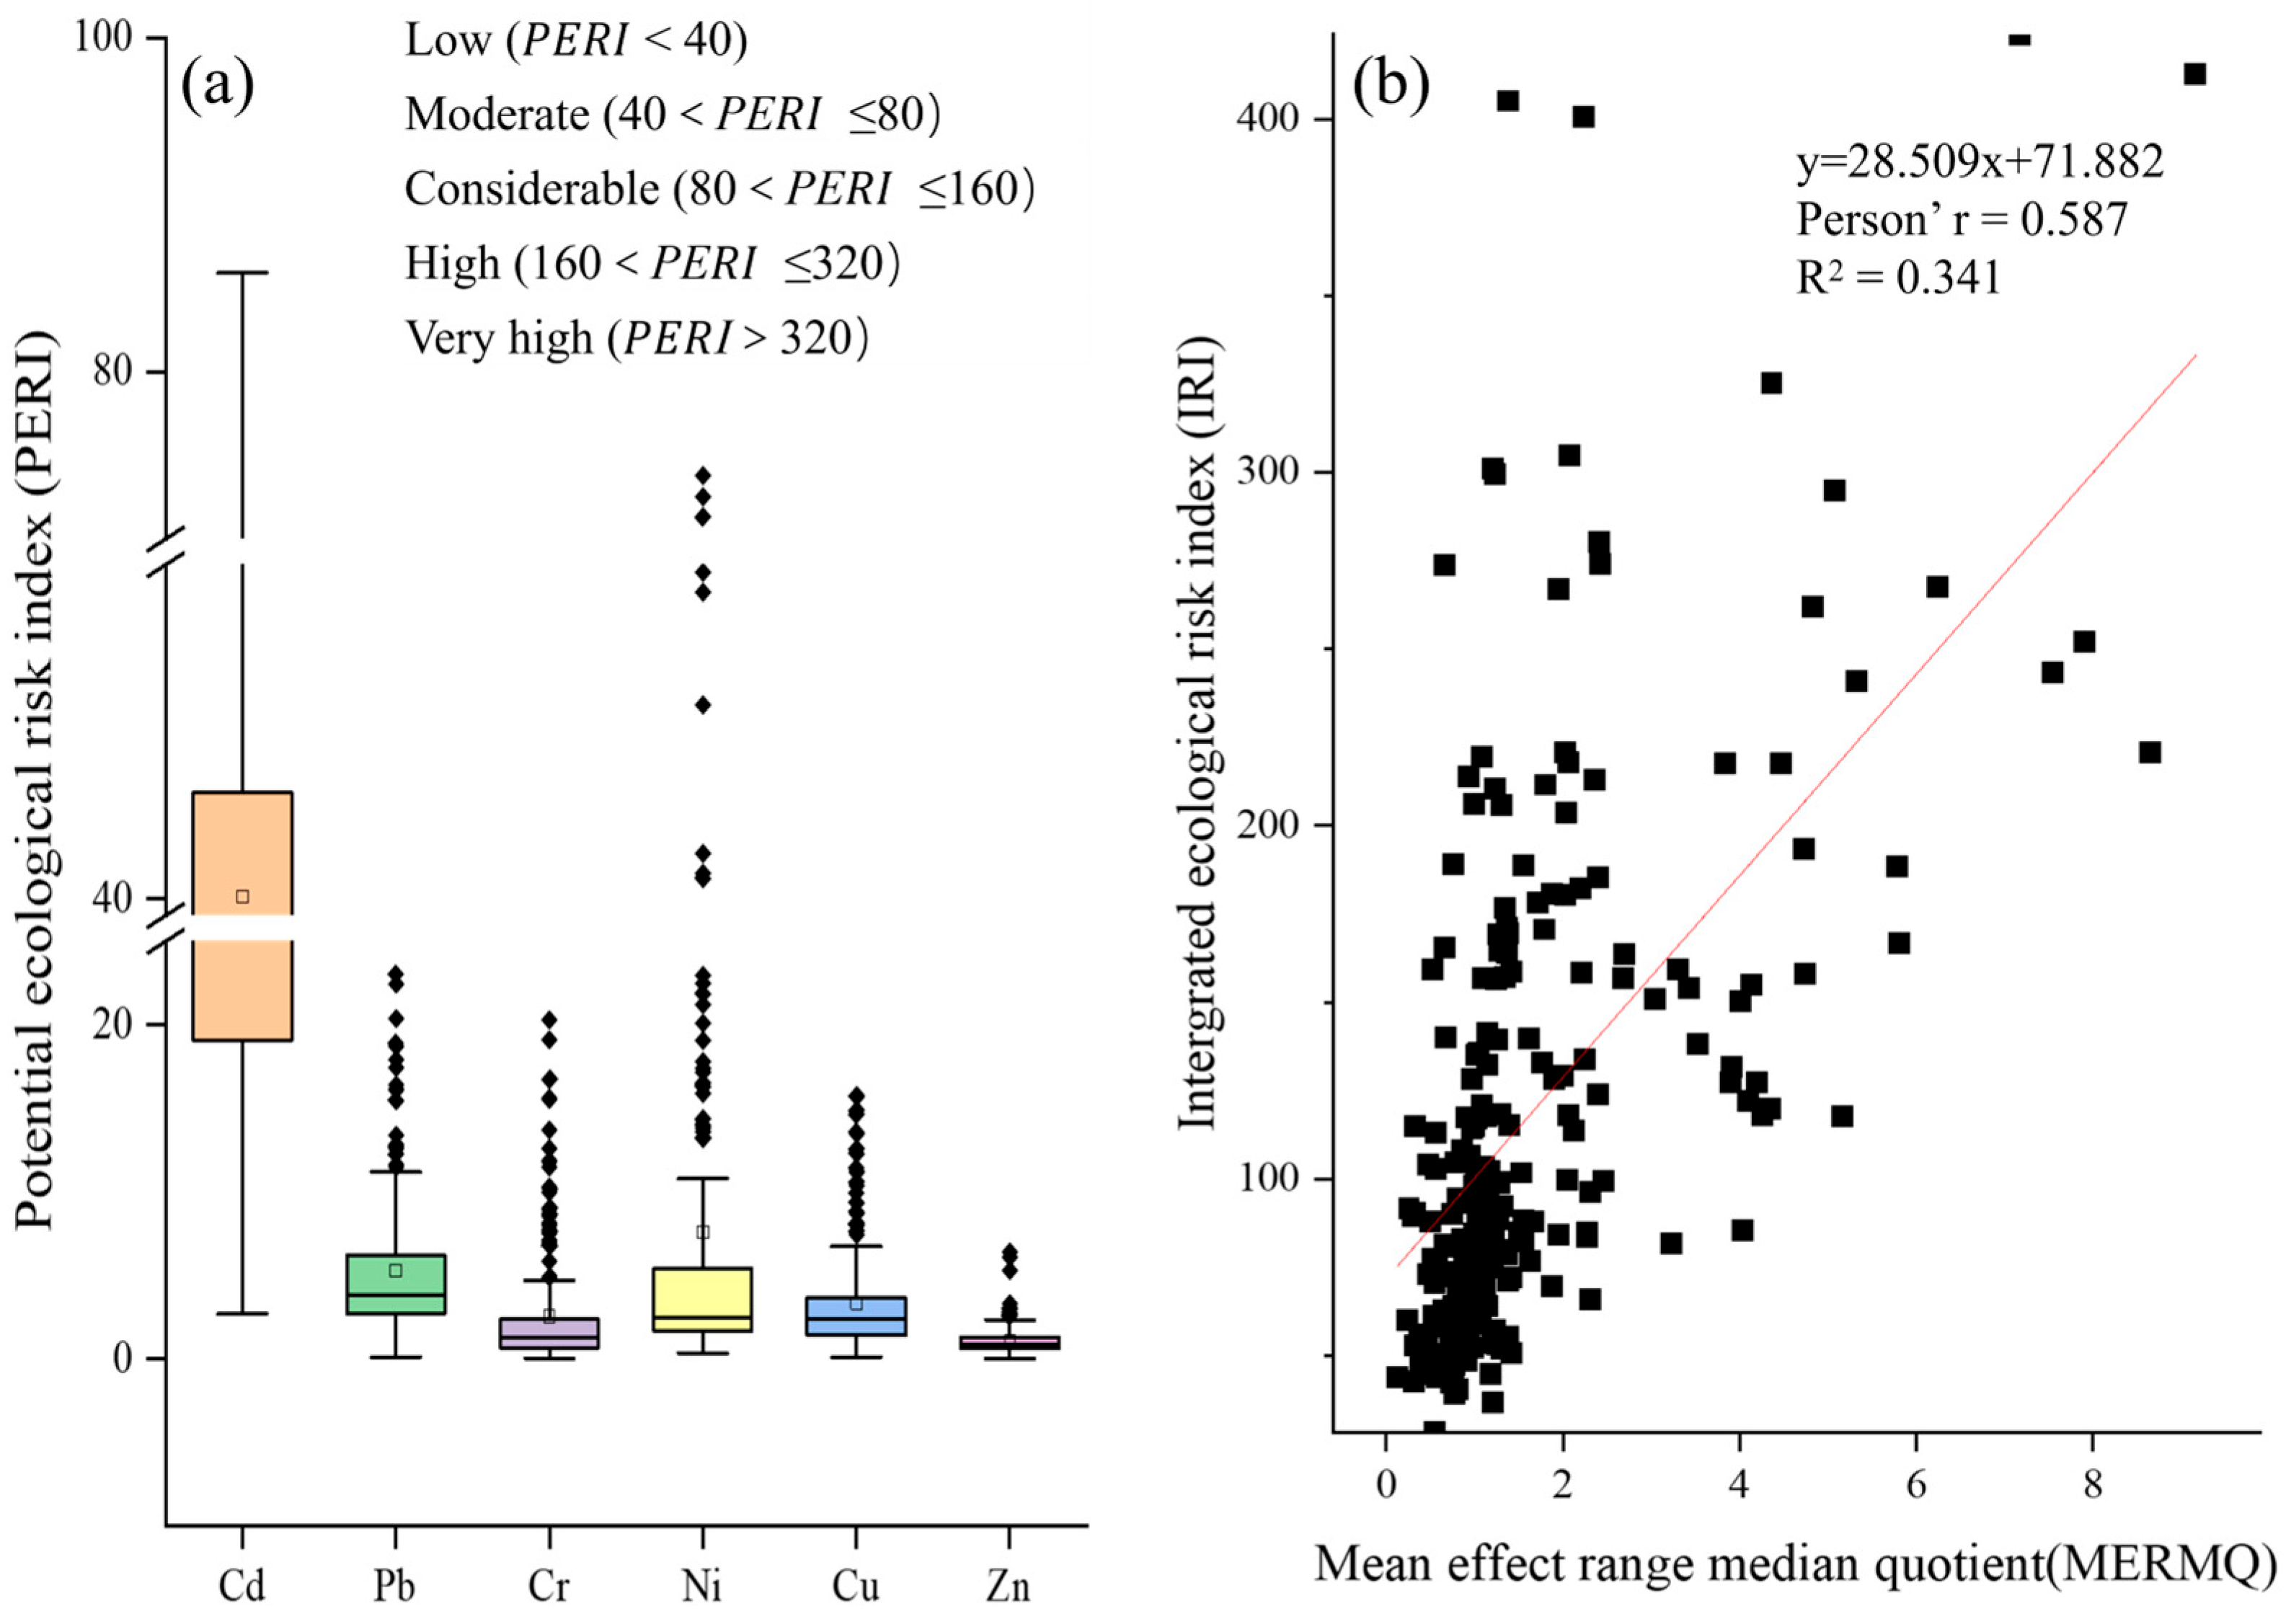
3.4.1. Potential Ecological Risk of Heavy Metals in Paddy Soil

Figure 4a shows the classification criteria of PERI proposed by Hakanson (1980) [34]. The results show that Cd exhibited the highest ecological risk. This may be related to the high exceedance rate of cadmium and its pollution characteristics. The National Soil Pollution Status Survey Bulletin shows that the point exceedance rate of Cd in soil nationwide is 7%, which is much higher than the exceedance rate of other pollutants. In addition, soil Cd pollution has characteristics such as concealment, lag, and non-degradability. Once exogenous Cd enters the soil, it gradually accumulates and poses a long-term threat to soil health; moreover, the soil pollution carrying capacity of cadmium is much smaller than that of other heavy metals, that is, a slight increase in cadmium content in soil will significantly increase the cadmium concentration in crops. Among the Cd contaminants, 70.00% of paddy soils had a low contamination level, followed by moderate (20.00%), considerable (6.96%), and high (3.04%) levels. For Ni contaminants, 95.65% of paddy soils showed low contamination levels, with the remainder showing moderate contamination (3.91%). Additionally, Ri values for Pb, Cr, Cu, and Zn were below the lowest range (PERI < 40), indicating no ecological risk between different ecological components (Figure 4a).
The mean MERMQ value of the soil samples ranged from 0.5 to 1.5, with a mean of 1.16, suggesting a 49% probability of potential hazards to biological organisms [44]. Moreover, 46.49% of the soil samples fell within the range of 0.5 to 1.5 (49% probability of toxicity), while 5.02% were within the range of 0.1 to 0.5 (21% probability of toxicity). Furthermore, we conducted a linear regression (Figure 4b) on the relationship between the IRI and MERMQ, and the results revealed a moderate relationship (R2 = 0.341), which demonstrates that the risks caused by soil contamination have an impact on ecological species. From this perspective, although ecological risk assessments based on PERI and IRI have no negative impact, they continue to affect biological organisms, which aligns with the findings of Zerizghi et al. (2022) [46]. Therefore, PERI and IRI are commonly used for assessing potential ecological risks; however, their impact on ecological species is underestimated.

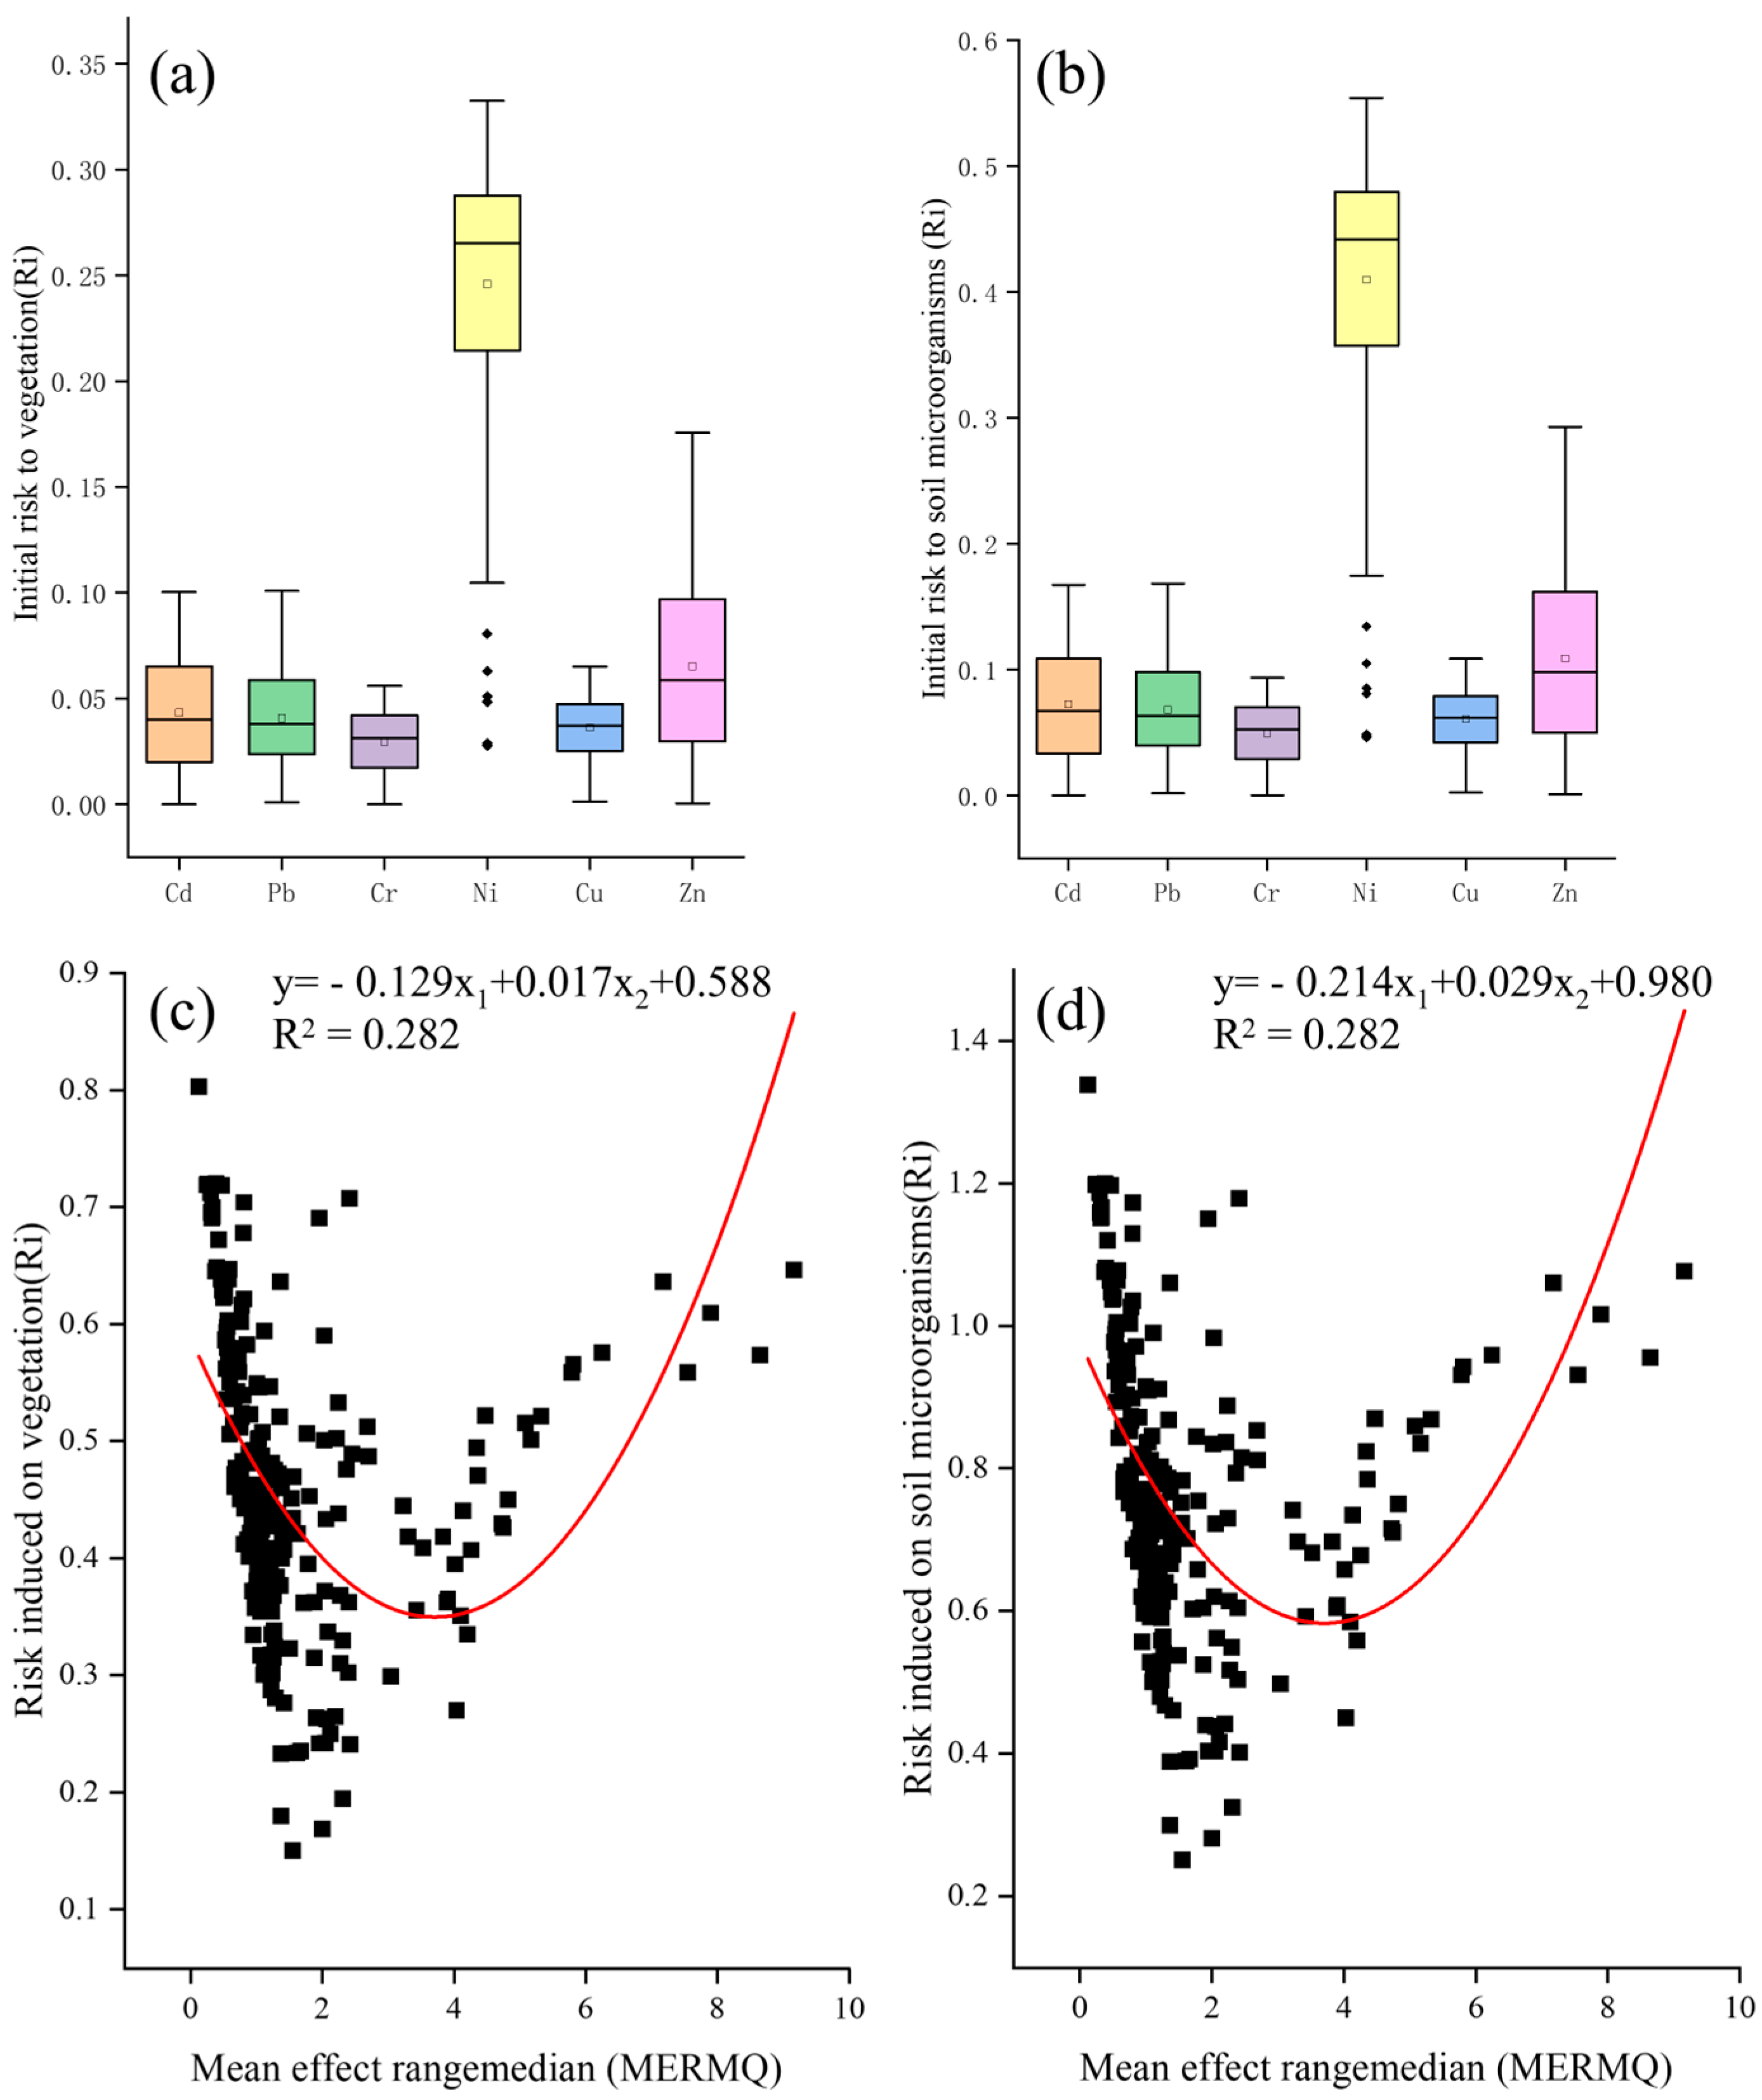
3.4.2. Risk Allocation among Soil Microorganisms and Vegetation

Soil contamination is harmful to the organisms in ecosystems [45]. Direct risk receptors for vegetation (producer) and soil microorganisms (decomposer) are considered as the Ri, which are risk inflow sources for each trophic level in the entire ecosystem [47]. Table 3 presents the data used to assess the probability of risk in the soil on Hainan Island.
In the process of calculating Ri, ΔIx and Px must first be evaluated. Using Equation (11), we calculated that the risk intensity (ΔΙx) for each heavy metal was 0.393 (Cd), 0.394 (Pb), 0.514 (Cr), 0.712 (Ni), 0.544 (Cu), and 0.385 (Zn). Subsequently, Px was calculated using Equation (10). We chose the soil background [49] and screening values [52] in China to calculate Px because of its relation to soil contamination levels [49]. Six categories were proposed to represent the risks associated with contamination levels. Further information on the calculation of Px and the specific division method can be found in Tang et al. (2017). The results showed that Ni had the highest Px value (1.515), followed by Zn (0.607), Cd (0.368), Pb (0.345), Cu (0.222), and Cr (0.192) (Table 3).
The average Ri values for Cd, Pb, Cr, Ni, Cu, and Zn in the vegetation were 0.043, 0.041, 0.030, 0.025, 0.036, and 0.065 (Figure 5a), respectively, and those for the soil microorganisms were 0.072, 0.068, 0.049, 0.410, 0.061, and 0.109 (Figure 5b), respectively. According to Hakanson (1980) [34], Ri is regardless of toxicity, which the NEA assessment does not consider. The highest Ri value was observed for Ni and ranged from 0.028 to 0.332 for vegetation and 0.046 to 0.554 for soil microorganisms. Additionally, compared with other metals, Zn and Pb displayed comparatively higher Ri values; however, the Ri values for Ni exceeded those for Zn and Pb by 3.77 and 6.03 times, respectively. In summary, the Ri value of Ni is the highest, followed by Zn, Pb, Cd, Cu, and Cr (for both vegetation and soil microorganisms).
Soil microorganisms are more sensitive to heavy metal stress than animals (including herbivores and carnivores) and vegetation [72]. In this study, the risk to soil microorganisms (Ri = 0.769) was approximately 1.67 times higher than vegetation (Ri = 0.461). However, the actual risk for sensitive soil organisms may be even higher because we assume that the soil risk screen values are a contamination index and that no risk would occur below this threshold during the current calculation process. Furthermore, a linear regression relationship was observed between Ri and MERMQ, indicating relatively higher credibility of the impact of risks on vegetation (R2 = 0.282) and soil organisms (R2 = 0.282) (Figure 5c,d). Therefore, heavy metal contamination still can pose an ecological risk to soil microorganisms in the Hainan tropical paddy soils, although PERI is below the safe limit (PERI < 40), according to Hakanson (1980) [34].

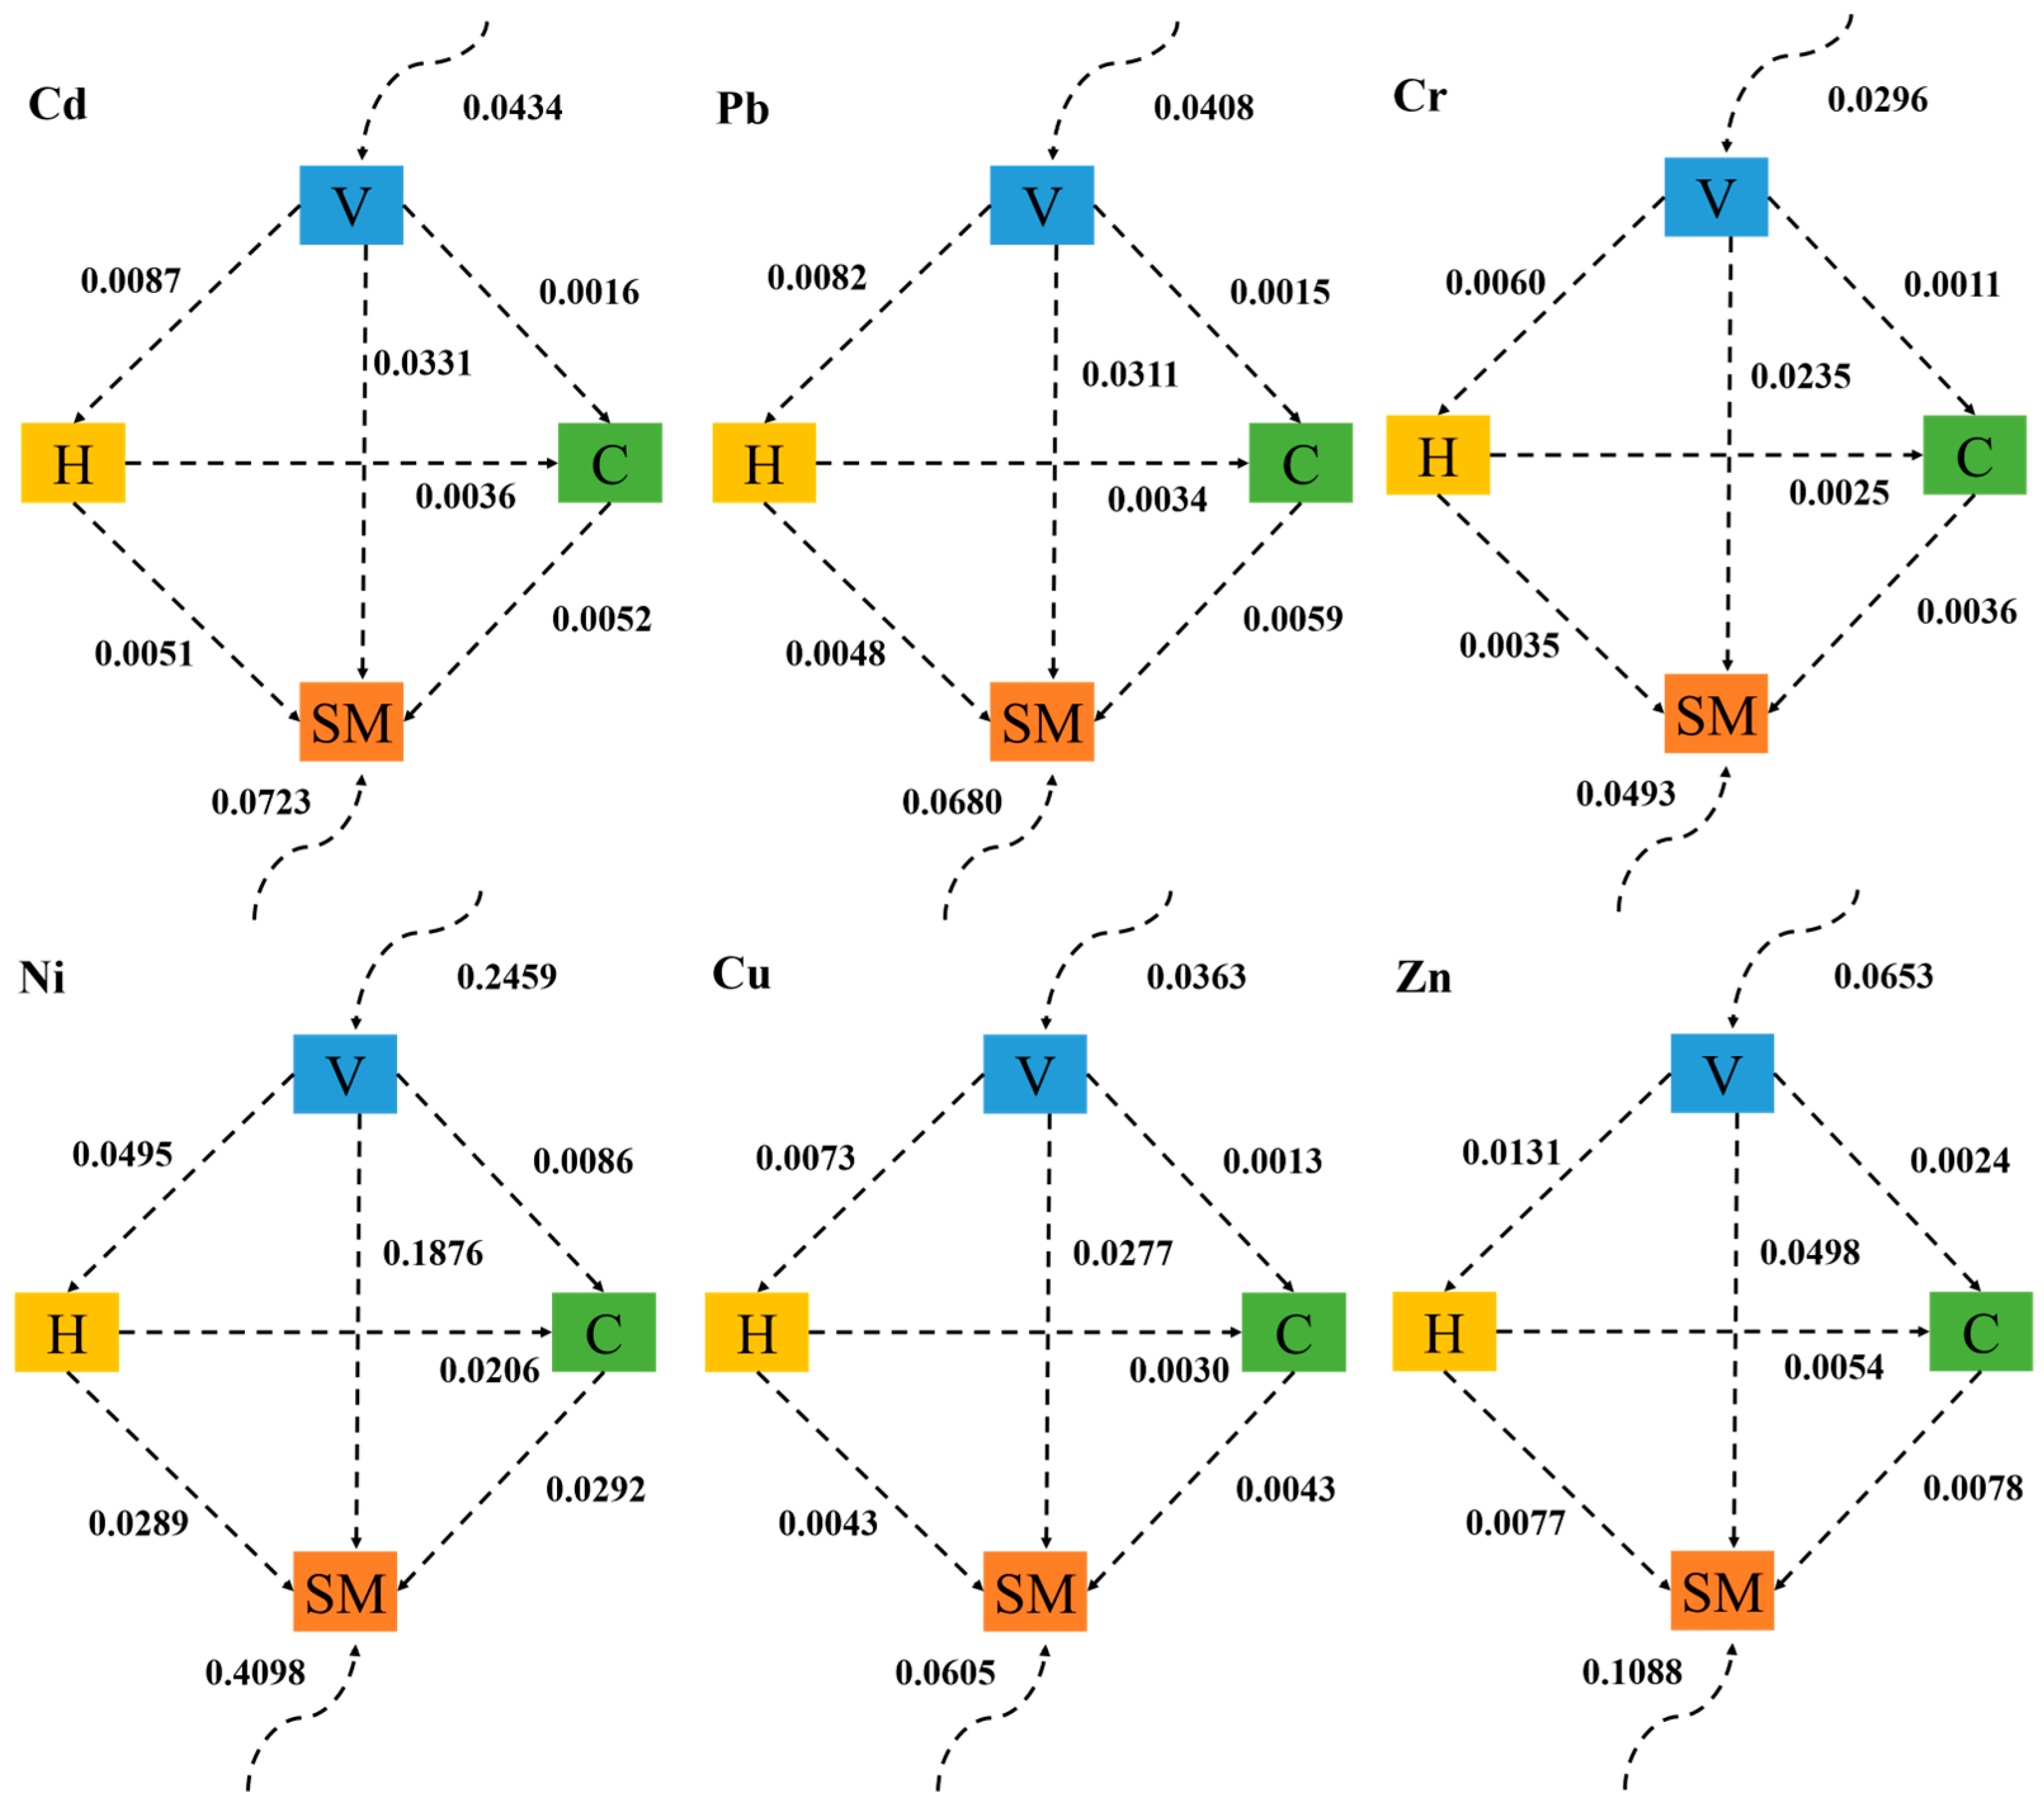
3.4.3. Risk Flow Mechanism among Ecological Components

The basic ecological components of ecosystems are vegetation (producers), herbivores (primary consumers), carnivores (secondary consumers), and soil microorganisms (decomposers) [73]. In an autotrophic food web, energy enters through vegetation before moving to higher trophic levels [49]. Consequently, through energy relationships, the risks posed to vegetation can impact the subsequent levels of consumers (including primary and secondary consumers) and, ultimately, the entire ecosystem [74,75]. In complex natural ecosystems, the material cycle, energy flow, and information transfer between components are typically expressed in the form of flow patterns, and their paths, directions, intensity, and rates have significant impacts on the ecosystem. The energy flow relationships between different trophic levels can be explained through an energy flow matrix model, as the interaction of these components regarding energy depends on various factors, such as ecosystem structure and function and population density [45,49]. Figure S4 presents the energy flow matrix between four trophic levels and the CA calculated from this matrix (dashed arrow indicates direction of risk flow) [45,76]; the stronger the CA, the higher the inflow risk.
Multiplying the CA and risk magnitude of energy supply components can simulate the risk flow between trophic levels to a certain extent (Figure 6) [47,73]. In this study, the highest Ri value of vegetation input to the ecosystem was for Ni (0.2459), followed by Zn (0.0653), Cd (0.0434), Pb (0.0408), Cu (0.0363), and Cr (0.0296). The highest Ri of soil microbial input into the ecosystem was for Ni (0.4098), followed by Zn (0.1088), Cd (0.0723), Pb (0.0680), Cu (0.0605), and Cr (0.0493). There is no direct connection between heavy metal contamination of soil and herbivores or carnivores; however, risk may be transferred to herbivores or carnivores through energy transfer established by competitive prey relationships among the different trophic levels [45]. Vegetation mostly controls herbivores; therefore, a direct threat to vegetation may signify an associated risk. The average direct risk transfer from vegetation to herbivores ranged from 0.0060 (Cr, lowest risk) to 0.0495 (Ni, highest risk). Additionally, the average risk to carnivores from both direct (herbivore) and indirect (vegetation) interactions ranged from 0.0011 (Cr, lowest risk) to 0.0206 (Ni, highest risk) (Figure 6). Soil contamination posed by heavy metals can affect the diversity and stability of soil microorganisms, which can change the community structure and functions [77]. According to the calculation, the risk allocation for soil microorganisms from vegetation was 5.03 and 16.84 times higher for herbivores and carnivores, respectively.
Soil microorganisms were controlled by four pathways: risk from soil exposure (Ri, external soil environment), vegetation, herbivores, and carnivores. In addition to the external environment, the cumulative risks of Cd, Pb, Cr, Ni, Cu, and Zn transferred from vegetation (direct risk), herbivores (indirect risk), and carnivores (indirect risk) to soil microorganisms were 0.0434, 0.0418, 0.0306, 0.2457, 0.0363, and 0.0653, respectively. Carnivores are controlled by both vegetation and herbivores. The cumulative risks from soil heavy metals for carnivores, transferred from vegetation and herbivores, were 0.0165 and 0.0385, respectively. Based on the integrated risk across the four trophic levels, carnivorous animals exhibited the least harm, with herbivores showing slightly lower harm (Figure S5a). Regarding the proportion of risk attributed to the six heavy metals, it can be concluded that the largest percentage of risk posed to the different trophic levels originated from Ni (53.29–53.37%), followed by Zn (14.11–14.16%), Cd (9.41–9.45%), Pb (8.84–8.92%), Cu (7.74–7.87%), and Cr (6.40–6.44%) (Figure S5b).

4. Conclusions

This study analyzed the concentrations of seven heavy metals and their spatial patterns in paddy soils on a tropical island. The findings revealed that most heavy metal contamination levels fell within the class of 0−3, while Cd and Ni contamination levels were within the class of 0−6. In addition, soil contamination was predominantly concentrated in coastal plains and economically developed areas, including Haikou, Chengmai, Danzhou, Lingao, and Wenchang. Utilizing the APCS-MLR model, three main sources of heavy metal pollution were identified: geological, agricultural activities, and traffic emissions. Within each principal fraction, geological sources contributed the most to environmental pollution levels, followed by agricultural activities and traffic emissions. Notably, among the studied heavy metals, Cd and Ni emerged as significant contributors to ecological risks. Soil contamination can be transferred to higher trophic levels through energy exchange across food webs, and the risk flow follows the order of soil microorganisms, vegetation, herbivores, and carnivores. Ecological species on the island were more vulnerable to the effects of Ni, Zn, Cd, Pb, and Cu, whereas Cr posed the least threat. Therefore, it is important to explore governance measures to reduce the concentrations of Cu, Zn, and Mn released from agricultural activities and Cd and Pb emitted from transportation to prevent the environmental and ecological risks caused by heavy metals. These results provide fundamental and significant information for mitigating the ecological risks caused by heavy metals by controlling priority pollutants and sources on tropical islands in China.

Supplementary Materials

The following supporting information can be downloaded at: https://www.mdpi.com/article/10.3390/agronomy14081777/s1, Supplementary materials S1: Risk flow analysis using network environment analysis; Figure S1. The maps of the factors influencing heavy metal element concentrations in the soils of Hainan Island, including (a) land use; (b) road network; (c) metal mines; and (d) factory sites; Figure S2. Proportion of different heavy metal content evaluation levels in paddy soils. (Note: Class 0: uncontaminated; Class 1: uncontaminated to moderately contaminated; Class 2: moderately contaminated; Class 3: moderately to heavily contaminated; Class 4: heavily contaminated; Class 5: heavily to extremely contaminated; Class 6: extremely contaminated.); Figure S3. Contribution rate of different pollution sources to each heavy metal element; Figure S4. The energy flow matrix (F) (Kj·ft−1 y−1) and control allocation (CA) calculated from this matrix among the components. (V represents vegetation, H represents herbivores, SM represents soil microorganisms and C represents carnivores.); Figure S5. (a) The comparison of risks between four ecological components (including input risk from the external environment) posed by six heavy metals, (b) The proportion of risk of each heavy metal in the components; Table S1. Newmerow composite pollution index results for heavy metals; Table S2. Multiple linear regression equations for studied elements and test results.

Author Contributions

All authors contributed to the study conception and design. Y.G.: Investigation, methodology, visualization, writing—original draft; Y.Y.: Investigation, data curation, writing—review & editing; Y.L.: Conceptualization, supervision, writing—review & editing, funding acquisition. All authors have read and agreed to the published version of the manuscript.

Funding

This work was supported by the Strategic Priority Research Program of the Chinese Academy of Science (XDA19040303).

Institutional Review Board Statement

This study does not involve ethical approval.

Data Availability Statement

Data are available upon reasonable request from the corresponding author.

Conflicts of Interest

The authors declare that they have no known competing financial interests or personal relationships that could have appeared to influence the work reported in this paper.

References

  1. Zhou, Y.; Li, X.H.; Liu, Y.S. Cultivated land protection and rational use in China. Land Use Policy 2021, 106, 105454. [Google Scholar] [CrossRef]
  2. Hua, Y.N.; He, K.L.; Sun, Z.H.; Chen, G.; Cheng, H.F. Quantitative source apportionment of heavy metal(loid)s in the agricultural soils of an industrializing region and associated model uncertainty. J. Hazard. Mater. 2020, 391, 122244. [Google Scholar] [CrossRef]
  3. Xu, Y.F.; Bi, R.T.; Li, Y.H. Effects of anthropogenic and natural environmental factors on the spatial distribution of trace elements in agricultural soils. Ecotoxicol. Environ. Saf. 2023, 249, 114436. [Google Scholar] [CrossRef]
  4. Li, R.; Zhang, R.; Yang, Y.; Li, Y. Accumulation characteristics, driving factors, and model prediction of cadmium in soil-highland barley system on the Tibetan Plateau. J. Hazard. Mater. 2023, 453, 131407. [Google Scholar] [CrossRef]
  5. Sheng, D.R.; Meng, X.H.; Wen, X.H.; Wu, J.; Yu, H.J.; Wu, M. Contamination characteristics, source identification, and source-specific health risks of heavy metal (loid) s in groundwater of an arid oasis region in Northwest China. Sci. Total Environ. 2022, 84, 1156733. [Google Scholar] [CrossRef]
  6. Zhou, M.G.; Li, Y.H. Spatial distribution and source identification of potentially toxic elements in Yellow River Delta soils, China: An interpretable machine-learning approach. Sci. Total Environ. 2024, 912, 169092. [Google Scholar] [CrossRef] [PubMed]
  7. Chai, L.; Wang, Y.H.; Wang, X.; Ma, L.; Cheng, Z.X.; Su, L.M.; Liu, M.X. Quantitative source apportionment of heavy metals in cultivated soil and associated model uncertainty. Ecotoxicol. Environ. Saf. 2021, 215, 112150. [Google Scholar] [CrossRef] [PubMed]
  8. Guan, Q.Y.; Zhao, R.; Pan, N.H.; Wang, F.F.; Yang, Y.Y.; Luo, H.P. Source apportionment of heavy metals in farmland soil of Wuwei, China: Comparison of three receptor models. J. Clean. Prod. 2019, 237, 117792. [Google Scholar] [CrossRef]
  9. Jafarabadi, R.A.; Bakhtiyari, R.A.; Toosi, S.A.; Jadot, C. Spatial distribution, ecological and health risk assessment of heavy metals in marine surface sediments and coastal seawaters of fringing coral reefs of the Persian gulf, Iran. Chemosphere 2017, 185, 1090–1111. [Google Scholar] [CrossRef]
  10. Srivastava, A.; Sengupta, B.; Dutta, S.A. Source apportionment of ambient VOCs in Delhi City. Sci. Total Environ. 2005, 343, 207–220. [Google Scholar] [CrossRef]
  11. Deng, J.; Zhang, Y.; Qiu, Y.; Zhang, H.; Du, W.; Xu, L.; Hong, Y.; Chen, Y.; Chen, J. Source apportionment of PM2.5 at the Lin’an regional background site in China with three receptor models. Atmos. Res. 2018, 202, 23–32. [Google Scholar] [CrossRef]
  12. Lei, M.; Li, K.; Guo, G.; Ju, T. Source-specific health risks apportionment of soil potential toxicity elements combining multiple receptor models with Monte Carlo simulation. Sci. Total Environ. 2022, 817, 152899. [Google Scholar] [CrossRef]
  13. Men, C.; Liu, R.M.; Wang, Q.R.; Miao, Y.X.; Wang, Y.F.; Jiao, L.J.; Li, L.; Cao, L.P.; Shen, Z.R.; Li, Y.; et al. Spatial-temporal characteristics, source-specific variation and uncertainty analysis of health risks associated with heavy metals in road dust in Beijing, China. Environ. Pollut. 2021, 278, 116866. [Google Scholar] [CrossRef]
  14. Men, C.; Liu, R.M.; Wang, Y.F.; Cao, L.P.; Jiao, L.J.; Li, L.; Shen, Z.Y. A four-way model (FEST) for source apportionment: Development, verification, and application. J. Hazard. Mater. 2022, 426, 128009. [Google Scholar] [CrossRef]
  15. Zhang, H.; Cheng, S.Q.; Li, H.F.; Fu, K.; Xu, Y. Groundwater pollution source identification and apportionment using PMF and PCA-APCS-MLR receptor models in a typical mixed land-use area in Southwestern China. Sci. Total Environ. 2020, 741, 140383. [Google Scholar] [CrossRef]
  16. Wei, R.F.; Meng, Z.R.; Zerizghi, T.; Luo, J.; Guo, Q.J. A comprehensive method of source apportionment and ecological risk assessment of soil heavy metals: A case study in Qingyuan city, China. Sci. Total Environ. 2023, 882, 163555. [Google Scholar] [CrossRef]
  17. Rashid, A.; Schutte, B.J.; Ulery, A.; Deyholos, M.K.; Sanogo, S.; Lehnhoff, E.A.; Beck, L. Heavy Metal Contamination in Agricultural Soil: Environmental Pollutants Affecting Crop Health. Agronomy 2023, 13, 1521. [Google Scholar] [CrossRef]
  18. Tóth, G.; Hermann, T.; Silva, M.R.D.; Montanarella, L. Heavy metals in agricultural soils of the European Union with implications for food safety. Environ. Int. 2016, 88, 299–309. [Google Scholar] [CrossRef]
  19. Radim, V. Heavy Metal Pollution and Its Effects on Agriculture. Agronomy 2021, 11, 1719. [Google Scholar] [CrossRef]
  20. Jiang, H.-H.; Cai, L.M.; Hu, G.C.; Wen, H.H.; Luo, J.; Xu, H.Q.; Chen, L.-G. An integrated exploration on health risk assessment quantification of potentially hazardous elements in soils from the perspective of sources. Ecotoxicol. Environ. Saf. 2021, 208, 111489. [Google Scholar] [CrossRef]
  21. Hiroki, M. Effects of heavy metal contamination on soil microbial population. Soil Sci. Plant Nutr. 1992, 38, 141–147. [Google Scholar] [CrossRef]
  22. McIntyre, T.; Whiting, M.J. Increased metal concentrations in Giant Sungazer Lizards (Smaug giganteus) from mining areas in South Africa. Arch. Environ. Contam. Toxicol. 2012, 63, 574–585. [Google Scholar] [CrossRef] [PubMed]
  23. IARC—International Agency for Research on Cancer. Agents Classified by the IARC Monographs. 2011, pp. 1–102. Available online: https://monographs.iarc.fr/agents-classified-by-the-iarc/ (accessed on 20 October 2023).
  24. Yang, S.Y.; He, M.J.; Zhi, Y.Y.; Chang, S.X.; Gu, B.J.; Liu, X.M.; Xu, J.M. An integrated analysis on source-exposure risk of heavy metals in agricultural soils near intense electronic waste recycling activities. Environ. Int. 2019, 133, 105239–105248. [Google Scholar] [CrossRef]
  25. Mama, C.; Nnaji, C.; Emenike, P.; Chibueze, C. Potential environmental and human health risk of soil and roadside dust in a rapidly growing urban settlement. Int. J. Environ. Sci. Technol. 2020, 17, 2385–2400. [Google Scholar] [CrossRef]
  26. Ma, W.; Tai, L.; Qiao, Z.; Zhong, L.; Wang, Z.; Fu, K.; Chen, G. Contamination source apportionment and health risk assessment of heavy metals in soil around municipal solid waste incinerator: A case study in North China. Sci. Total Environ. 2018, 631, 348–357. [Google Scholar] [CrossRef]
  27. Xu, X.L.; Liu, J.Y.; Zhang, S.W.; Li, R.D.; Yan, C.Z.; Wu, S.X. China Multi Period Land Use Remote Sensing Monitoring Dataset (CNLUCC). Resource and Environmental Science Data Registration and Publishing System. 2018. Available online: https://www.resdc.cn/DOI/doi.aspx?DOIid=54 (accessed on 10 March 2024). [CrossRef]
  28. Zang, Z.F.; Li, Y.H.; Liu, S.H.; Li, H.R.; Hao, Z.; Xu, Y.F. Assessment of the heavy metal pollution and health risks of rice cultivated in Hainan Island, China. Environ. Forensics 2021, 22, 63–74. [Google Scholar] [CrossRef]
  29. Guo, Y.; Yang, Y.; Li, R.X.; Liao, X.Y.; Li, Y.H. Distribution of cadmium and lead in soil-rice systems and their environmental driving factors at the island scale. Ecotoxicol. Environ. Saf. 2023, 265, 115530. [Google Scholar] [CrossRef]
  30. Guo, Y.; Yang, Y.; Li, R.X.; Liao, X.Y.; Li, Y.H. Cadmium accumulation in tropical island paddy soils: From environment and health risk assessment to model prediction. J. Hazard. Mater. 2024, 465, 133212. [Google Scholar] [CrossRef] [PubMed]
  31. Xu, Y.F.; Hao, Z.; Li, Y.H.; Li, H.R.; Wang, L.; Zang, Z.F.; Liao, X.Y.; Zhang, R. Distribution of selenium and zinc in soil-crop system and their relationship with environmental factors. Chemosphere 2020, 242, 125289. [Google Scholar] [CrossRef]
  32. USEPA—United States Environmental Protection Agency. Exposure Factors Handbook, Final ed.; Environmental Protection Agency: Washington, DC, USA, 2011. [Google Scholar]
  33. Fischer, G.; Nachtergaele, F.; Prieler, S.; van Velthuizen, H.T.; Verelst, L.; Wiberg, D. Global Agro-Ecological Zones Assessment for Agriculture; IIASA: Laxenburg, Austria; FAO: Rome, Italy, 2008. [Google Scholar]
  34. Hakanson, L. An ecological risk index for aquatic pollution control. A sedimentological approach. Water Res. 1980, 14, 975–1001. [Google Scholar] [CrossRef]
  35. Qu, M.; Li, W.; Zhang, C. Spatial distribution and uncertainty assessment of potential ecological risks of soil heavy metals using sequential Gaussian simulation. Hum. Ecol. Risk Assess. 2014, 20, 764–778. [Google Scholar] [CrossRef]
  36. Swaine, D.J. Why trace elements are important. Fuel Process. Technol. 2000, 65, 21–33. [Google Scholar] [CrossRef]
  37. Förstner, U.; Ahlf, W.; Calmano, W.; Kersten, M. Sediment criteria development. In Sediments and Environmental Geochemistry; Springer: Berlin/Heidelberg, Germany, 1990; pp. 311–338. [Google Scholar]
  38. GB15618-2018; MEE of the PRC and SAMR of the People’s Republic of China, Soil Environmental Quality Risk Control Standard for Soil Contamination of Agricultural Land. China Environmental Science Press: Beijing, China, 2018.
  39. Kaiser, H.F. An index of factorial simplicity. Psychometrika 1974, 39, 31–36. [Google Scholar] [CrossRef]
  40. Guo, G.H.; Wang, Y.T.; Zhang, D.G.; Lei, M. Source-specific ecological and health risks of potentially toxic elements in agricultural soils in southern Yunnan province and associated uncertainty analysis. J. Hazard. Mater. 2021, 417, 126144. [Google Scholar] [CrossRef]
  41. Ma, M.L.; Li, Z.Y.; Zhou, M.; Luo, Y.Z.; Zeng, S.Q.; Chen, W.Y.; Lin, S. Soil Environmental Background Values in Hainan Province; Guangdong Provincial Environmental Monitoring Center, Department of Geography, Sun Yat-sen University, Hainan Provincial Environmental Monitoring Center: Guangzhou, China, 1991; pp. 14–15. (In Chinese) [Google Scholar]
  42. Zhang, J.J.; Ma, C.M.; Kuang, H.; Zhou, A.G. Assessment of heavy metals pollution in soil of Qingdao based on matter-element extension model. China Environ. Sci. 2017, 37, 661–668. [Google Scholar]
  43. Hu, M.J.; Li, C.Y.; Li, N.N.; Ji, T.Q.; Zheng, D.Y. Using the matter-element extension model to assess heavy metal pollution in topsoil in parks in the main district park of Lanzhou City. Environ. Sci. 2021, 42, 2457–2468. [Google Scholar]
  44. Weissmannová, H.D.; Pavlovský, J. Indices of soil contamination by heavy metals– methodology of calculation for pollution assessment (minireview). Environ. Monit. Assess. 2017, 189, 616. [Google Scholar] [CrossRef]
  45. Lu, J.; Lu, H.; Wang, W.; Feng, S.; Lei, K. Ecological risk assessment of heavy metal contamination of mining area soil based on land type changes: An information network environ analysis. Ecol. Model. 2021, 455, 109633. [Google Scholar] [CrossRef]
  46. Zerizghi, T.; Guo, Q.J.; Tian, L.Y.; Wei, R.F.; Zhao, C.Q. An integrated approach to quantify ecological and human health risks of soil heavy metal contamination around coal mining area. Sci. Total Environ. 2022, 814, 152653. [Google Scholar] [CrossRef] [PubMed]
  47. Chen, S.; Fath, B.D.; Chen, B. Information-based network environ analysis: A system perspective for ecological risk assessment. Ecol. Indic. 2011, 11, 1664–1672. [Google Scholar] [CrossRef]
  48. Fath, B.D.; Patten, B.C. Review of the foundations of network environ analysis. Ecosystems 1999, 2, 167–179. [Google Scholar] [CrossRef]
  49. Tang, P.Z.; Liu, J.Z.; Lu, H.W.; Wang, Z.; He, L. Information-based network environ analysis for ecological risk assessment of heavy metals in soils. Ecol. Model. 2017, 344, 17–28. [Google Scholar] [CrossRef]
  50. Shi, T.R.; Zhang, Y.Y.; Gong, Y.W.; Ma, J.; Wei, H.Y.; Xu, X.; Zhao, L.; Hou, H. Status of cadmium accumulation in agricultural soils across China (1975–2016): From temporal and spatial variations to risk assessment. Chemosphere 2019, 230, 136–143. [Google Scholar] [CrossRef] [PubMed]
  51. CNEMC—China National Environmental Monitoring Centre. Soil Elements Background Values in China; China Environmental Science Press: Beijing, China, 1990. (In Chinese) [Google Scholar]
  52. Zhang, P.Y.; Qin, C.Z.; Hong, X.; Kang, G.H.; Qin, M.Z.; Yang, D.; Pang, B.; Li, Y.Y.; He, J.J.P.; Dick, R. Risk assessment and source analysis of soil heavy metal pollution from lower reaches of Yellow River irrigation in China. Sci. Total Environ. 2018, 633, 1136–1147. [Google Scholar] [CrossRef] [PubMed]
  53. Gupta, M.; Gupta, S. An Overview of Selenium Uptake, Metabolism, and Toxicity in Plants. Front. Plant Sci. 2016, 7, 2074. [Google Scholar] [CrossRef] [PubMed]
  54. Hajek, A.E.; Eilenberg, J. Natural Enemies: An Introduction to Biological Control; Cambridge University Press: Cambridge, UK, 2018. [Google Scholar]
  55. Ihedioha, J.N.; Ujam, O.T.; Nwuche, C.O.; Ekere, N.R.; Chime, C.C. Assessment of heavy metal contamination of rice grains (Oryza sativa) and soil from Ada field, Enugu, Nigeria: Estimating the human healtrisk. Hum. Ecol. Risk Assess. Int. J. 2016, 22, 1665–1677. [Google Scholar] [CrossRef]
  56. Liang, J.; Feng, C.; Zeng, G.; Gao, X.; Zhong, M.; Li, X.; Li, X.; He, X.; Fang, Y. Spatial distribution and source identification of heavy metals in surface soils in a typical coal mine city, Lianyuan, China. Environ. Pollut. 2017, 225, 681. [Google Scholar] [CrossRef] [PubMed]
  57. Miao, Y.; Stewart, B.A.; Zhang, F. Long-term experiments for sustainable nutrient management in China. A review. Agron. Sustain. Dev. 2011, 31, 397–414. [Google Scholar] [CrossRef]
  58. Arunakumara, K.K.I.U.; Walpola, B.C.; Yoon, M.-H. Current status of heavy metal contamination in Asia’s rice lands. Rev. Environ. Sci. Biotechnol. 2013, 12, 355–377. [Google Scholar] [CrossRef]
  59. Wuana, R.A.; Okieimen, F.E. Heavy Metals in Contaminated Soils: A Review of Sources, Chemistry, Risks and Best Available Strategies for Remediation. Int. Sch. Res. Not. 2011, 2011, e402647. [Google Scholar] [CrossRef]
  60. Luo, L.; Ma, Y.; Zhang, S.; Wei, D.; Zhu, Y.-G. An inventory of trace element inputs to agricultural soils in China. J. Environ. Manag. 2009, 90, 2524–2530. [Google Scholar] [CrossRef] [PubMed]
  61. Rosen, G.D.; Roberts, P.A. Comprehensive Survey of the Response of Growing Pigs to Supplementary Copper in Feed; Field Investigations and Nutrition Service Ltd.: London, UK, 1996. [Google Scholar]
  62. Holm, A. E. Coli Associated Diarrhoea in Weaner Pigs: Zinc Oxide Added to the Feed as a Preventive Measure. In Proceedings of the International Pig Veterinary Society, Congress, Lausanne, Switzerland, 1–5 July 1990. [Google Scholar]
  63. Mondal, M.K.; Das, T.K.; Biswas, P.; Samanta, C.C.; Bairagi, B. Influence of dietary inorganic and organic copper salt and level of soybean oil on plasma lipids, metabolites, and mineral balance of broiler chickens. Anim. Feed Sci. Technol. 2007, 139, 212–233. [Google Scholar] [CrossRef]
  64. Gupta, D.K.; Chatterjee, S.; Datta, S.; Veer, V.; Walther, C. Role of phosphate fertilizers in heavy metal uptake and detoxification of toxic metals. Chemosphere 2014, 108, 134–144. [Google Scholar] [CrossRef] [PubMed]
  65. Qian, X.; Wang, Z.; Shen, G.; Chen, X.; Tang, Z.; Guo, C.; Gu, H.; Fu, K. Heavy metals accumulation in soil after 4 years of continuous land application of swine manure: A field-scale monitoring and modeling estimation. Chemosphere 2018, 210, 1029–1034. [Google Scholar] [CrossRef] [PubMed]
  66. Zeng, X.; Xiao, Z.; Zhang, G.; Wang, A.; Li, Z.; Liu, Y.; Wang, H.; Zeng, Q.; Liang, Y.; Zou, D. Speciation and bioavailability of heavy metals in pyrolytic biochar of swine and goat manures. J. Anal. Appl. Pyrolysis 2018, 132, 82–93. [Google Scholar] [CrossRef]
  67. Wang, S.; Cai, L.-M.; Wen, H.-H.; Luo, J.; Wang, Q.-S.; Liu, X. Spatial distribution and source apportionment of heavy metals in soil from a typical county-level city of Guangdong Province, China. Sci. Total Environ. 2019, 655, 92–101. [Google Scholar] [CrossRef]
  68. Jiang, H.H.; Cai, L.M.; Wen, H.H.; Luo, J. Characterizing pollution and source identification of heavy metals in soils using geochemical baseline and PMF approach. Sci. Rep. 2020, 10, 6460. [Google Scholar] [CrossRef]
  69. Jiang, H.H.; Cai, L.M.; Wen, H.H.; Hu, G.C.; Chen, L.G.; Luo, J. An integrated approach to quantifying ecological and human health risks from different sources of soil heavy metals. Sci. Total Environ. 2020, 701, 134466. [Google Scholar] [CrossRef] [PubMed]
  70. Men, C.; Liu, R.M.; Xu, L.B.; Wang, Q.R.; Guo, L.J.; Miao, Y.X.; Shen, Z.Y. Source-specific ecological risk analysis and critical source identification of heavy metals in road dust in Beijing, China. J. Hazard. Mater. 2020, 388, 121763–121775. [Google Scholar] [CrossRef]
  71. Zhang, J.; Hua, P.; Krebs, P. Influences of land use and antecedent dry-weather period on pollution level and ecological risk of heavy metals in road-deposited sediment. Environ. Pollut. 2017, 228, 158–168. [Google Scholar] [CrossRef]
  72. Giller, K.E.; Witter, E.; McGrath, S.P. Assessing risks of heavy metal toxicity in agricultural soils: Do microbes matter? Hum. Ecol. Risk Assess. Int. J. 1999, 5, 683–689. [Google Scholar] [CrossRef]
  73. Fath, B.D. Distributed control in ecological networks. Ecol. Model. 2004, 179, 235–245. [Google Scholar] [CrossRef]
  74. Li, J.; Chen, Y.; Peng, H.; He, L. Dynamic rule of ecological risk transmission among ecological communities based on network environmental analysis. Sci. Total Environ. 2021, 781, 146729. [Google Scholar] [CrossRef]
  75. Li, J.; Chen, Y.Z.; Peng, H.; He, L. A system-scale environmental risk analysis with considering a conceptual conversion from material/energy flow to information flow under uncertainties. J. Environ. Manag. 2021, 300, 113775. [Google Scholar] [CrossRef] [PubMed]
  76. Fath, B.D.; Scharler, U.M.; Ulanowicz, R.E.; Hannon, B. Ecological network analysis: Network construction. Ecol. Model. 2007, 208, 49–55. [Google Scholar] [CrossRef]
  77. Wang, A.C.; Li, X.; Hao, X.L.; Luo, X.S.; Chen, W.L.; Huang, Q.Y. Ammonia level influences the assembly of dissimilatory nitrate reduction to ammonia bacterial community in soils under different heavy metal remediation treatments. Sci. Total Environ. 2022, 838, 156393. [Google Scholar] [CrossRef]
Figure 1. Location of Hainan Island and spatial distributions of sampling sites.
Agronomy 14 01777 g001
Figure 2. The spatial distribution of single pollution levels and integrated pollution levels in the paddy soils. (a) Cd pollution levels; (b) Pb pollution levels; (c) Cr pollution levels; (d) Ni pollution levels; (e) Cu pollution levels; (f) Zn pollution levels; (g) integrated pollution levels.
Agronomy 14 01777 g002
Figure 3. Correlation of studied elements in paddy soils of Hainan Island. (Note: “*” represents significance at a significance level of 5%; “**” represents significance at a significance level of 1%; and “***” represents significance at a significance level of 0.1%.)
Agronomy 14 01777 g003
Figure 4. (a) Potential ecological risk index (PERI) and (b) linear regression between the integrated risk index (IRI) and the mean effect range quotient (MERMQ).
Agronomy 14 01777 g004
Figure 5. (a) Initial risk (Ri) posed from heavy metals in paddy soils of Hainan Island to vegetation; (b) Initial risk (Ri) from the heavy metals in paddy soils to soil microorganisms; (c) Linear regression between the initial risk (Ri) on vegetation and mean effect range median (MERMQ); (d) Linear regression between initial risk (Ri) on soil microorganisms and mean effect range median (MERMQ).
Agronomy 14 01777 g005
Figure 6. The direct and indirect risk flow diagraph from six heavy metals in paddy soils of the study area. (Note: Blue “represents” “vegetation”, abbreviated as “V”; Yellow “represents” “herbivores” and is abbreviated as “H”; Green “represents” “carnivores”, abbreviated as “C”; Orange “represents” “soil microorganisms”, abbreviated as “SM”).
Agronomy 14 01777 g006
Table 1. Descriptive statistics for element concentrations in Hainan paddy soils.
MaxMinAverageMedianSDCV. (%)Background Value [51]Risk Screening Value [38]% of SER
pH8.904.405.755.201.2020.92---
OC6.740.401.331.130.7656.93---
CEC32.001.0010.809.005.8654.24---
Cd1.600.020.290.200.2893.790.220.329.26%
Pb211.931.0343.0531.1536.2484.1840.68011.35%
Cr662.141.7082.9441.38112.65135.8265.22509.61%
Ni313.541.5732.2310.6554.30168.4842.56015.72%
Cu121.160.8825.8218.4124.2593.9338.385013.10%
Zn575.703.2099.1581.5374.6575.2989.72006.55%
Mn2481.1547.27596.62483.68470.9278.93626--
Fe20.820.193.982.673.6190.63---
P5496.4378.261133.91929.82881.5077.74---
SD: Standard deviation; CV. (%): Coefficient of variation; and % of SER: % of samples exceeding standard value. Units: OC (dg kg−1); CEC (mmol kg−1); Fe (%); Cd, Pb, Cr, Ni, Cu, Zn, Mn, and P (mg kg−1).
Table 2. Composition matrix after rotation for each element load.
Principal Component Load
PC1PC2PC3
Cd0.158−0.0340.861
Pb0.0540.1290.882
Cr0.9100.1410.038
Ni0.9260.0900.182
Cu0.7400.4990.210
Zn0.3020.8450.137
Mn0.7290.4720.058
Fe0.8760.2810.076
P0.1880.907−0.038
Percentage of variance (%)54.07216.26112.410
Percentage of accumulation (%)54.07270.33282.742
Table 3. Heavy metal concentrations of the local background and maximum threshold in tropical paddy soils (mg kg−1) used to assess probability of risk occurrence in soil of Hainan Island.
Heavy MetalsBackground LevelPollutedΔIxProbability of Risk Occurrence (Px)
Cd0.220.30.3930.368
Pb40.60800.3940.345
Cr65.202500.5140.192
Ni42.50600.7121.151
Cu38.38500.5440.222
Zn89.702000.3580.607
Disclaimer/Publisher’s Note: The statements, opinions and data contained in all publications are solely those of the individual author(s) and contributor(s) and not of MDPI and/or the editor(s). MDPI and/or the editor(s) disclaim responsibility for any injury to people or property resulting from any ideas, methods, instructions or products referred to in the content.

