Article

Accurate Characterization of Soil Moisture in Wheat Fields with an Improved Drought Index from Unmanned Aerial Vehicle Observations

by
Minghan Cheng
1,2,
Xintong Lu
1,2,
Zhangxin Liu
1,2,
Guanshuo Yang
1,2,
Lili Zhang
1,2,
Binqian Sun
1,2,
Zhian Wang
1,2,
Zhengxian Zhang
3,
Ming Shang
4 and
Chengming Sun
1,2,*
1
Jiangsu Key Laboratory of Crop Genetics and Physiology/Jiangsu Key Laboratory of Crop Cultivation and Physiology, Agricultural College, Yangzhou University, Yangzhou 225009, China
2
Jiangsu Co-Innovation Center for Modern Production Technology of Grain Crops, Yangzhou University, Yangzhou 225009, China
3
Co-Innovation Center of Sustainable Forestry in Southern China, Jiangsu Provincial Key Lab of Soil Erosion and Ecological Restoration, Nanjing Forestry University, Nanjing 210037, China
4
Jiangsu Jiangdu Water Conservancy Project Management Office, Yangzhou 225200, China
*
Author to whom correspondence should be addressed.
Agronomy 2024, 14(8), 1783; https://doi.org/10.3390/agronomy14081783
Submission received: 29 June 2024 / Revised: 29 July 2024 / Accepted: 12 August 2024 / Published: 14 August 2024
(This article belongs to the Special Issue Unmanned Farms in Smart Agriculture)

Abstract

:
Soil moisture content is a crucial indicator for understanding the water requirements of crops. The effective monitoring of soil moisture content can provide support for irrigation decision-making and agricultural water management. Traditional ground-based measurement methods are time-consuming and labor-intensive, and point-scale monitoring cannot effectively represent the heterogeneity of soil moisture in the field. Unmanned aerial vehicle (UAV) remote sensing technology offers an efficient and convenient way to monitor soil moisture content in large fields, but airborne multispectral data are prone to spectral saturation effects, which can further affect the accuracy of monitoring soil moisture content. Therefore, we aim to construct effective drought indices for the accurate characterization of soil moisture content in winter wheat fields by utilizing unmanned aerial vehicles (UAVs) equipped with LiDAR, thermal infrared, and multispectral sensors. Initially, we estimated wheat plant height using airborne LiDAR sensors and improved traditional spectral indices in a structured manner based on crop height. Subsequently, we constructed the normalized land surface temperature–structured normalized difference vegetation index (NLST-SNDVI) space by combining the SNDVI with land surface temperature and calculated the improved Temperature–Vegetation Drought Index (iTVDI). The results are summarized as follows: (1) the structured spectral indices exhibit better resistance to spectral saturation, making the NLST-SNDVI space closer to expectations than the NLST-NDVI space, with higher fitting accuracy for wet and dry edges; (2) the iTVDI calculated based on the NLST-SNDVI space can effectively characterize soil moisture content, showing a significant correlation with measured surface soil moisture content; (3) the global Moran’s I calculated based on iTVDI deviations ranges between 0.18 and 0.30, all reaching significant levels, indicating that iTVDI has good spatial applicability. In conclusion, this study proved the effectiveness of the drought index based on a structured vegetation index, and the results can provide support for crop moisture monitoring and irrigation decision-making in the field.

1. Introduction

Soil moisture content serves as an indicator of drought and waterlogging conditions in farmland [1]. An appropriate soil moisture level ensures optimal crop growth, thereby maximizing crop yield and water input efficiency [2]. The effective monitoring of soil moisture is crucial for optimizing irrigation decisions and enhancing agricultural water use efficiency [3,4]. Traditional in situ soil moisture measurement methods, such as the gravimetric method [5], neutron probe [6], active heated distributed temperature sensing [7], time-domain reflectometry, and frequency-domain reflectometry [8], require numerous observation points in the target area [9]. Although these methods provide a certain level of accuracy, they demand considerable human and material resources, resulting in inefficient soil moisture monitoring. Furthermore, these monitoring techniques are based on point-scale measurements, which are spatially discontinuous and cannot accurately represent the spatial continuity of soil moisture in the field [10]. With the advancement of remote sensing technology, various sensors mounted on satellites and other platforms can observe large areas of the surface, providing a spatially and temporally continuous means for soil moisture monitoring [11].
Satellites and unmanned aerial vehicles (UAVs) are two commonly used remote sensing platforms [12]. Satellite remote sensing, with its large observation area and stable observation cycle, has been widely used in monitoring soil moisture and crop drought [13]. However, satellite remote sensing typically has lower resolution and is susceptible to weather factors, making it difficult to meet the needs of precise field management [9]. In contrast, UAV remote sensing offers advantages such as higher resolution, greater maneuverability, and improved timeliness. Additionally, it allows for the integration of different sensors based on user requirements to acquire corresponding remote sensing information [14]. Consequently, UAV remote sensing has been widely applied in agriculture and crop monitoring, including crop yield prediction [15], leaf area index estimation [16], biomass estimation [17], crop stress monitoring [18], and nitrogen diagnosis [19]. Research on UAV-based field soil moisture monitoring has also gradually emerged [10,20,21,22].
The research approaches for monitoring field soil moisture using remote sensing technology can be broadly classified into two categories. One approach involves studying the quantitative relationship between soil moisture content and remote sensing observation information to establish an inversion model for soil moisture, ultimately obtaining the soil moisture content in the field directly [10,22]. This approach typically aims to directly simulate soil moisture content, but the process is relatively complex. Additionally, the establishment of such models often requires a large amount of data, and these statistical regression models may suffer from poor portability [13]. For instance, Cheng et al. [10] used UAV-observed multi-source data and machine learning algorithms to accurately estimate soil moisture in maize field, and this framework can be also applied in regional scale with satellite observations [13]. Ge et al. [22] employed UAV-based hyperspectral data and machine learning to accurate predict the soil moisture content of farmland in Xinjiang, China. Lu et al. [20] used UAV-observed visible images to estimate the soil moisture content of a steppe. It should be noted that due to variations in crop varieties and environments, the drought trigger thresholds for different crops are different [23]. This direct method of estimating soil moisture cannot directly reflect the response of crops to soil moisture content. This type of method is usually combined with machine learning algorithms, so it requires a large sample size, and it is difficult to accurately describe the relationship between remote sensing information and target variables when the sample size is small [24,25].
Another approach involves integrating spectral and temperature information obtained through remote sensing to construct drought indices that correlate well with field moisture conditions [26]. These indices indirectly represent soil moisture content or crop water status in the field. This approach does not directly simulate soil moisture content or crop plant water content but rather indirectly represents their relative values through dimensionless drought indices [9]. This method is relatively simple, does not require a large amount of data for training, and has strong applicability [27]. Numerous drought indices have been proposed, each with varying performance, advantages, and disadvantages. For instance, the vegetation supply water index (VSWI), calculated based on the NDVI and surface temperature [28], and the temperature vegetation drought index (TVDI), which fits the dry edge and wet edge of the NDVI and surface temperature [29], are now widely used to estimate soil moisture. However, further exploration is needed to determine the most suitable crop drought index for specific field water management needs.
It should be noted that remote sensing spectral information remains one of the most important features for characterizing crop growth and monitoring soil moisture in the field, regardless of the chosen approach [30,31,32]. However, current spectral information is susceptible to spectral saturation issues [33]. Spectral saturation refers to a phenomenon that occurs during remote sensing image acquisition when the sensor’s sensitivity is limited [34]. If the reflectivity of the measured area is too high, the sensor cannot accurately distinguish and record more subtle spectral information, leading to saturation in the collected spectral data. This saturation problem can negatively affect the quality of hyperspectral images, resulting in the lost details or inaccurate representations of actual conditions in certain image areas [30]. This issue can lead to underestimations when simulating crop growth using spectral information, particularly after the crop canopy closes [10]. Therefore, spectral saturation should be further considered when developing appropriate drought indices.
In this study, we focused on wheat as the research object. We acquired structural information on field wheat using airborne LiDAR and further improved traditional spectral indices to mitigate the effects of spectral saturation. By combining the land surface temperature and the theory of LST-VI space, we constructed an improved temperature vegetation drought index (iTVDI), enabling the accurate representation of soil moisture content.

2. Materials and Methods
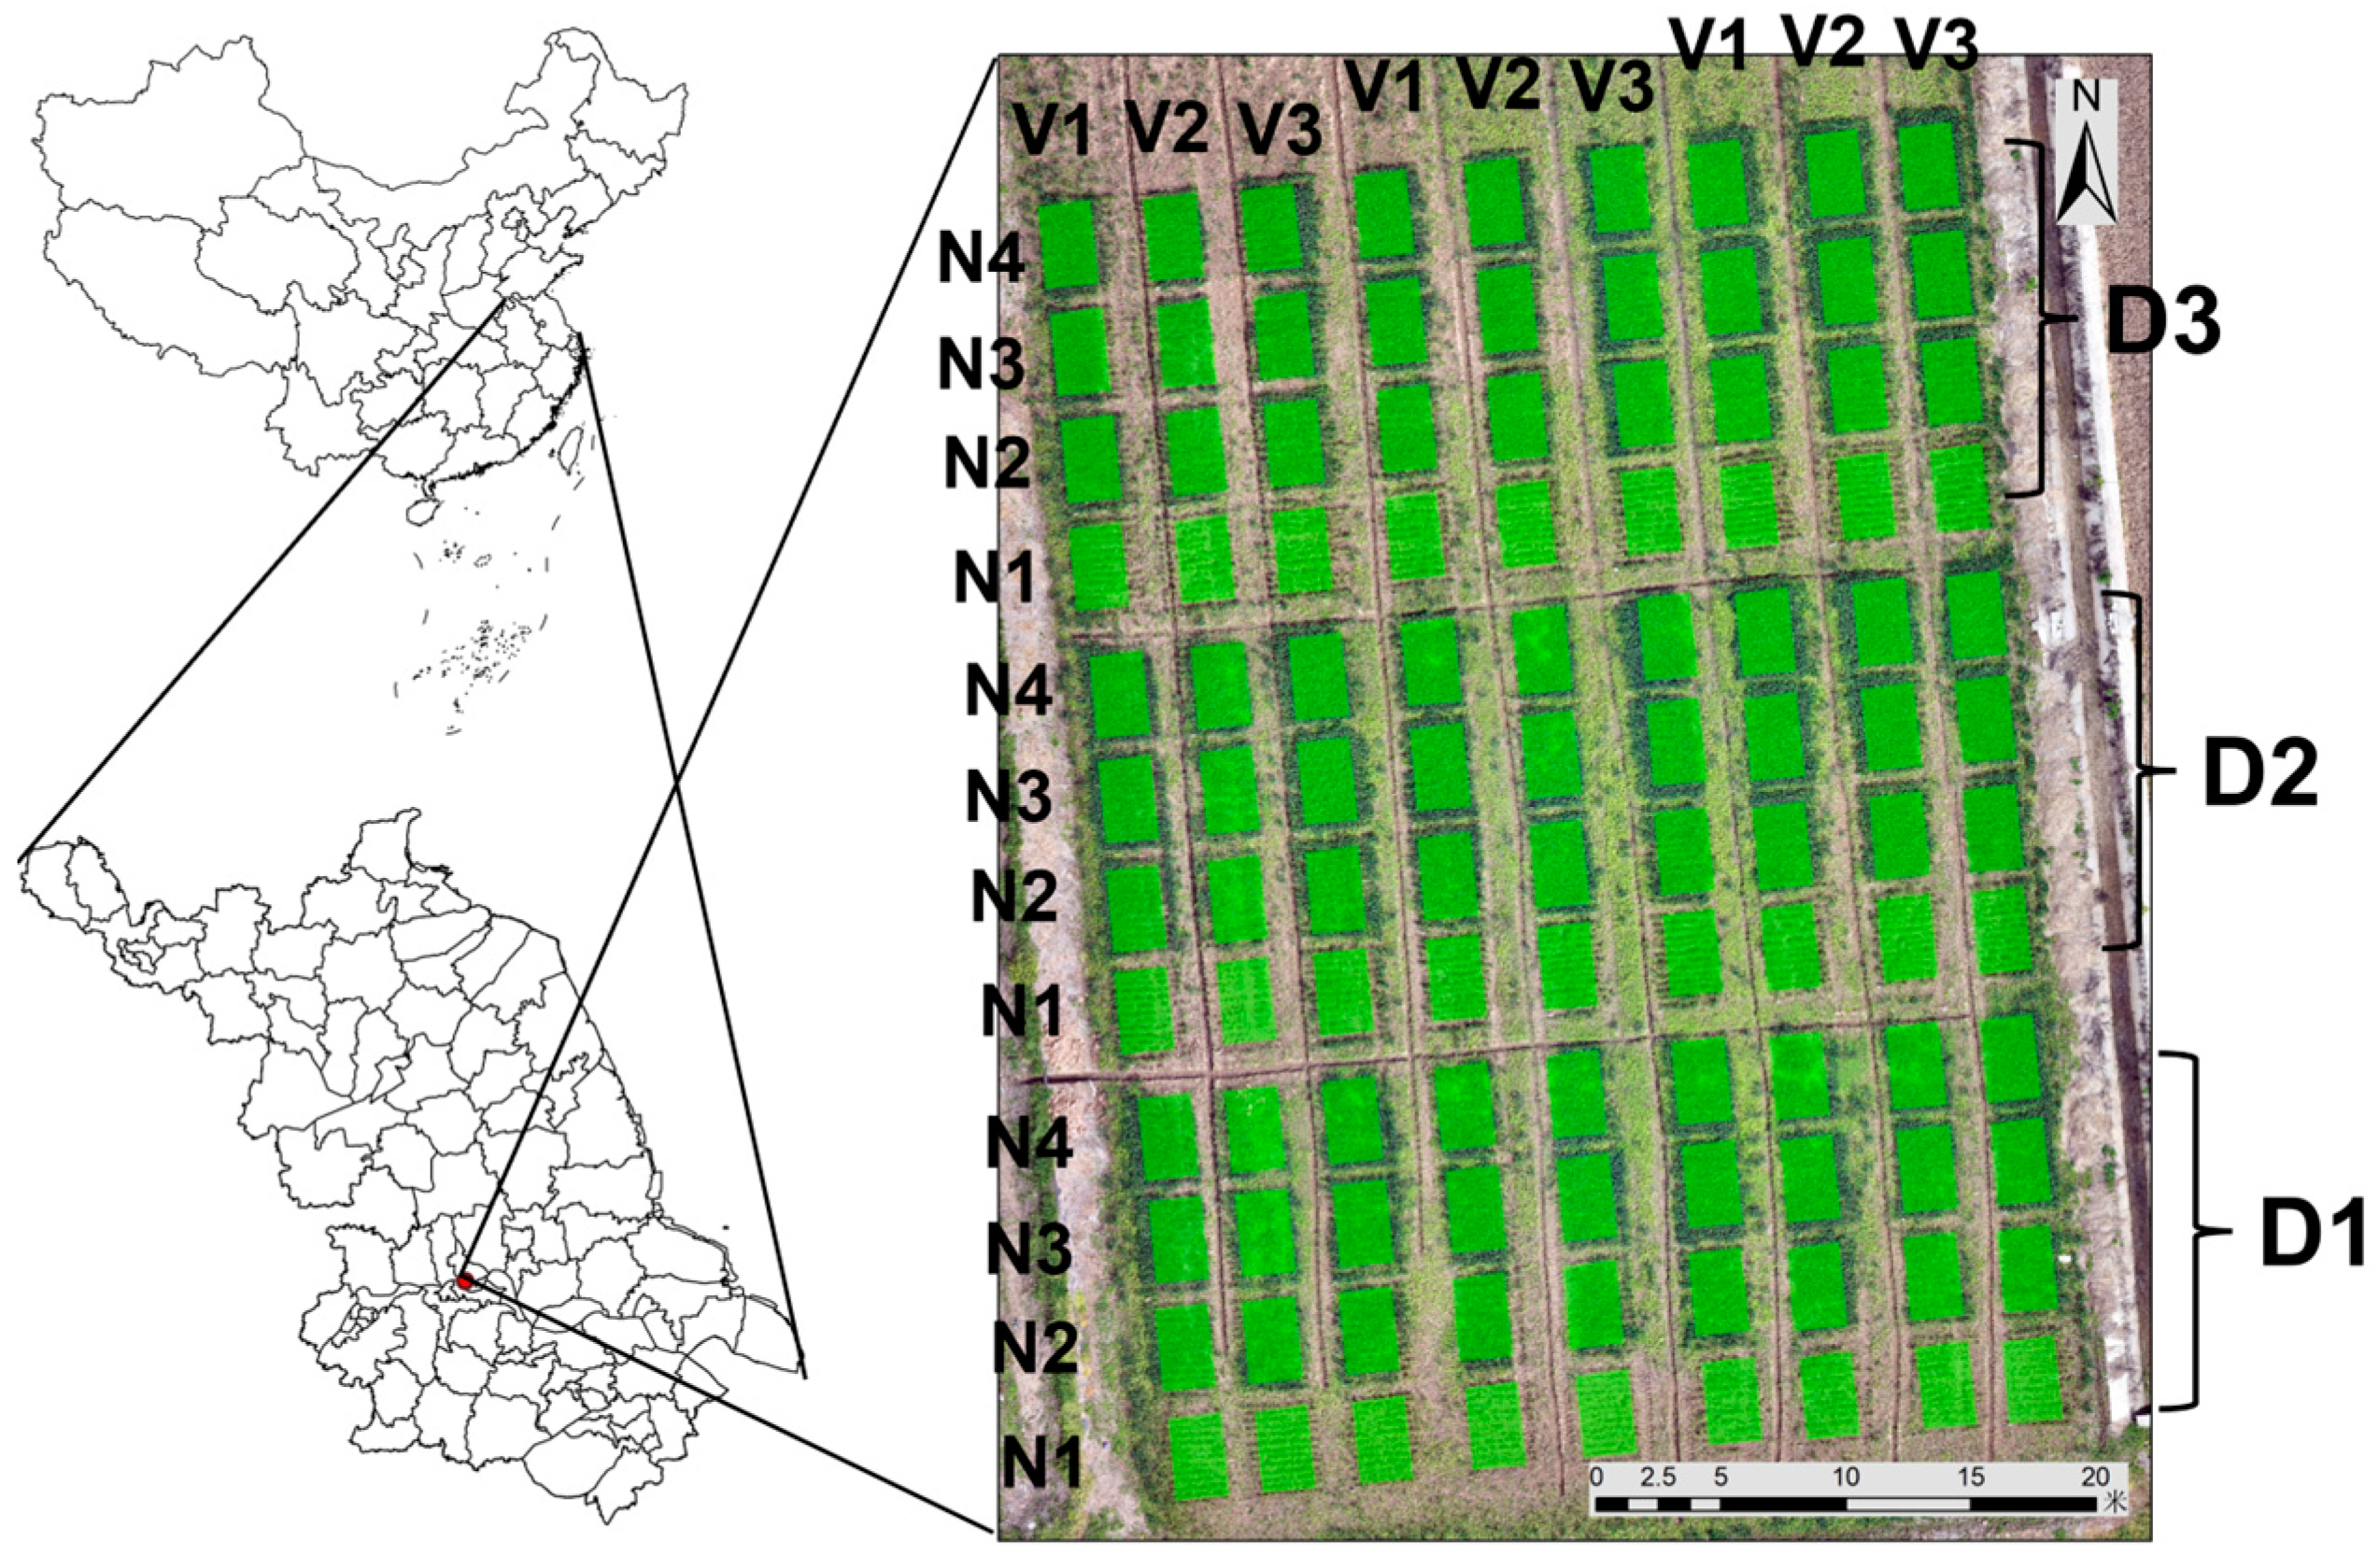
2.1. Study Area

The experiment was conducted in an experimental field located in the southern suburbs of Guangling District, Yangzhou City, Jiangsu Province, China, as shown in Figure 1. The region has a subtropical humid climate with an annual average temperature of 14.8 °C, an annual average frost-free period of 220 days, an average sunshine duration of 2140 h, and an annual precipitation of 1030 mm. Winter wheat was sown in November 2023 and harvested in May 2024. This experiment consisted of four types of fertilization treatments (fertilized nitrogen during the jointing stage): N1 (no fertilization), N2 (150 kg/hm2), N3 (225 kg/hm2), and N4 (300 kg/hm2); three planting density treatments: D1 (1,500,000 plants/hm2), D2 (2,250,000 kg/hm2), and D3 (3,000,000 kg/hm2); three wheat varieties: Yangmai 13, Yangmai 20, and Yangmai 28. This totaled 36 treatments with three replicates and totaling 108 experimental plots, as illustrated in Figure 1.

2.2. Data Collection
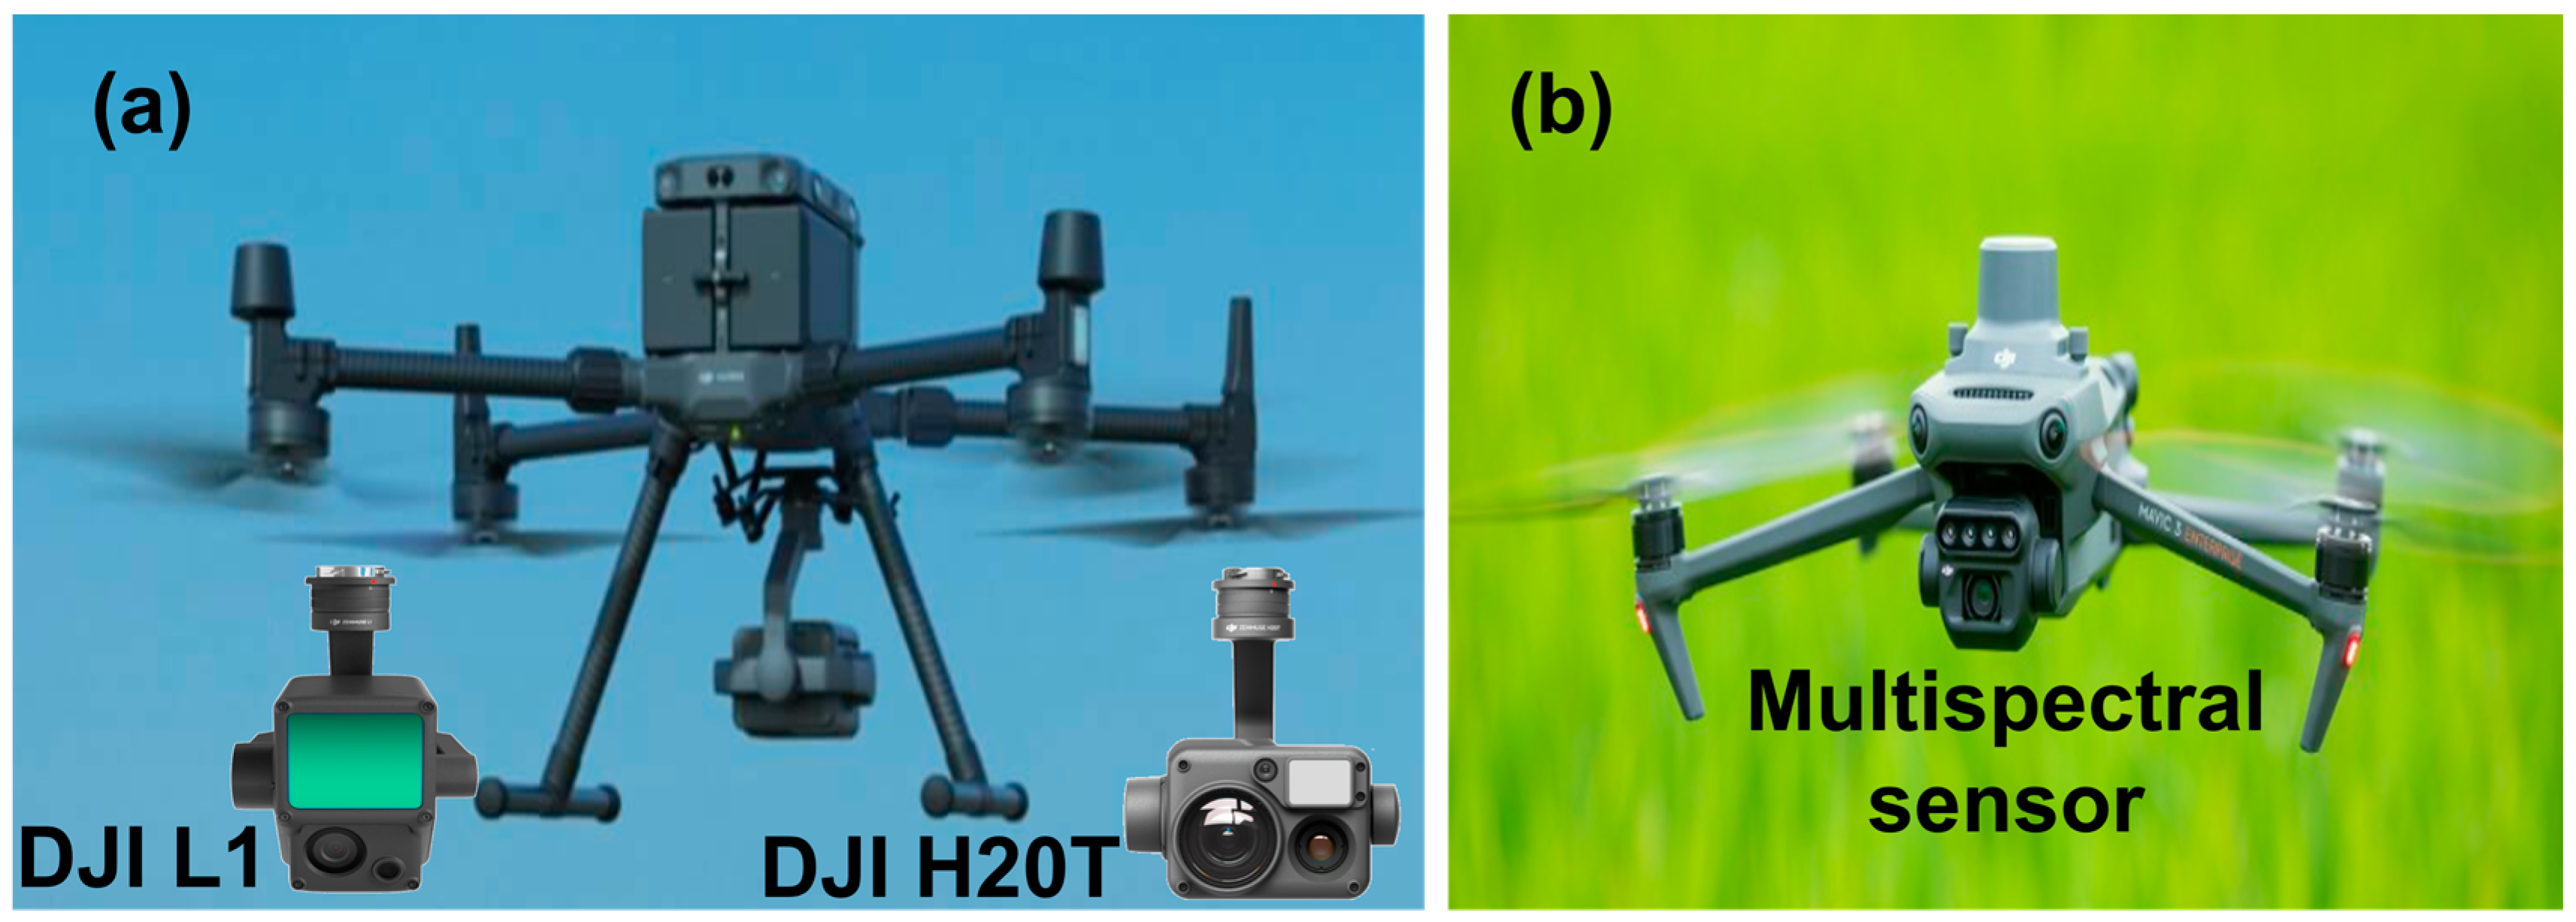
2.2.1. UAV Data

In this study, the DJI M300 RTK (Figure 2a, DJI Technology Co., Shenzhen, Guangdong, China) equipped with the thermal infrared sensor DJI H20T (DJI Technology Co., Shenzhen, Guangdong, China) and the LiDAR (Light Detection and Ranging) sensor DJI L1 (DJI Technology Co., Shenzhen, Guangdong, China) were used to acquire surface temperature information and three-dimensional point cloud information from the field, respectively. The Inertial Measurement Unit update frequency of DJI L1 is 200 Hz. The DJI M3M (Figure 2b, DJI Technology Co., Shenzhen, Guangdong, China) and its multispectral sensor were used to obtain spectral information (green band: 560 nm; red band: 650 nm; red edge: 730 nm; near infrared: 860 nm) from the field. These three types of sensors have been applied in related research and their effectiveness has been proven. The flight campaigns were conducted on 31 March 2024, 15 April 2024, 23 April 2024, 13 May 2024, and 24 May 2024 to acquire a total of five periods of remote sensing data and carrying out UAV activities during the stable period of solar radiation at noon.

2.2.2. Ground Measurement

In this study, the mobile soil moisture probe TDR 300 (FieldScout TDR 350 soil moisture meter, Spectrum Technologies, Inc., Plainfield, IL, USA) was used to measure the soil surface moisture content in the top 12 cm of the field to validate the effectiveness of the drought index developed in this research. The TDR 300 is a type of probe based on time-domain reflectometry, which measures soil moisture content based on the propagation characteristics of electromagnetic pulses in soil media, and its effectiveness has been verified by related studies [10]. During field sampling, a sub-plot of approximately 0.5 m2 was selected in each experimental plot, and data were read 4–8 times at the wheat root zone and between plants within the sub-plot. The average value was taken as the actual soil surface moisture content of the sub-plot. In situ sampling of soil moisture was conducted after each unmanned aerial vehicle (UAV) observation campaign.
The soil moisture sampling was conducted on 31 March 2024, 15 April 2024, 13 May 2024, and 24 May 2024 after each flight campaign. By sampling each experimental plot, a total of 432 sets of measured soil moisture sample data were obtained. Soil moisture was converted to relative moisture content, as performed in a previous study [13], and its numerical distribution is shown in Figure 3.

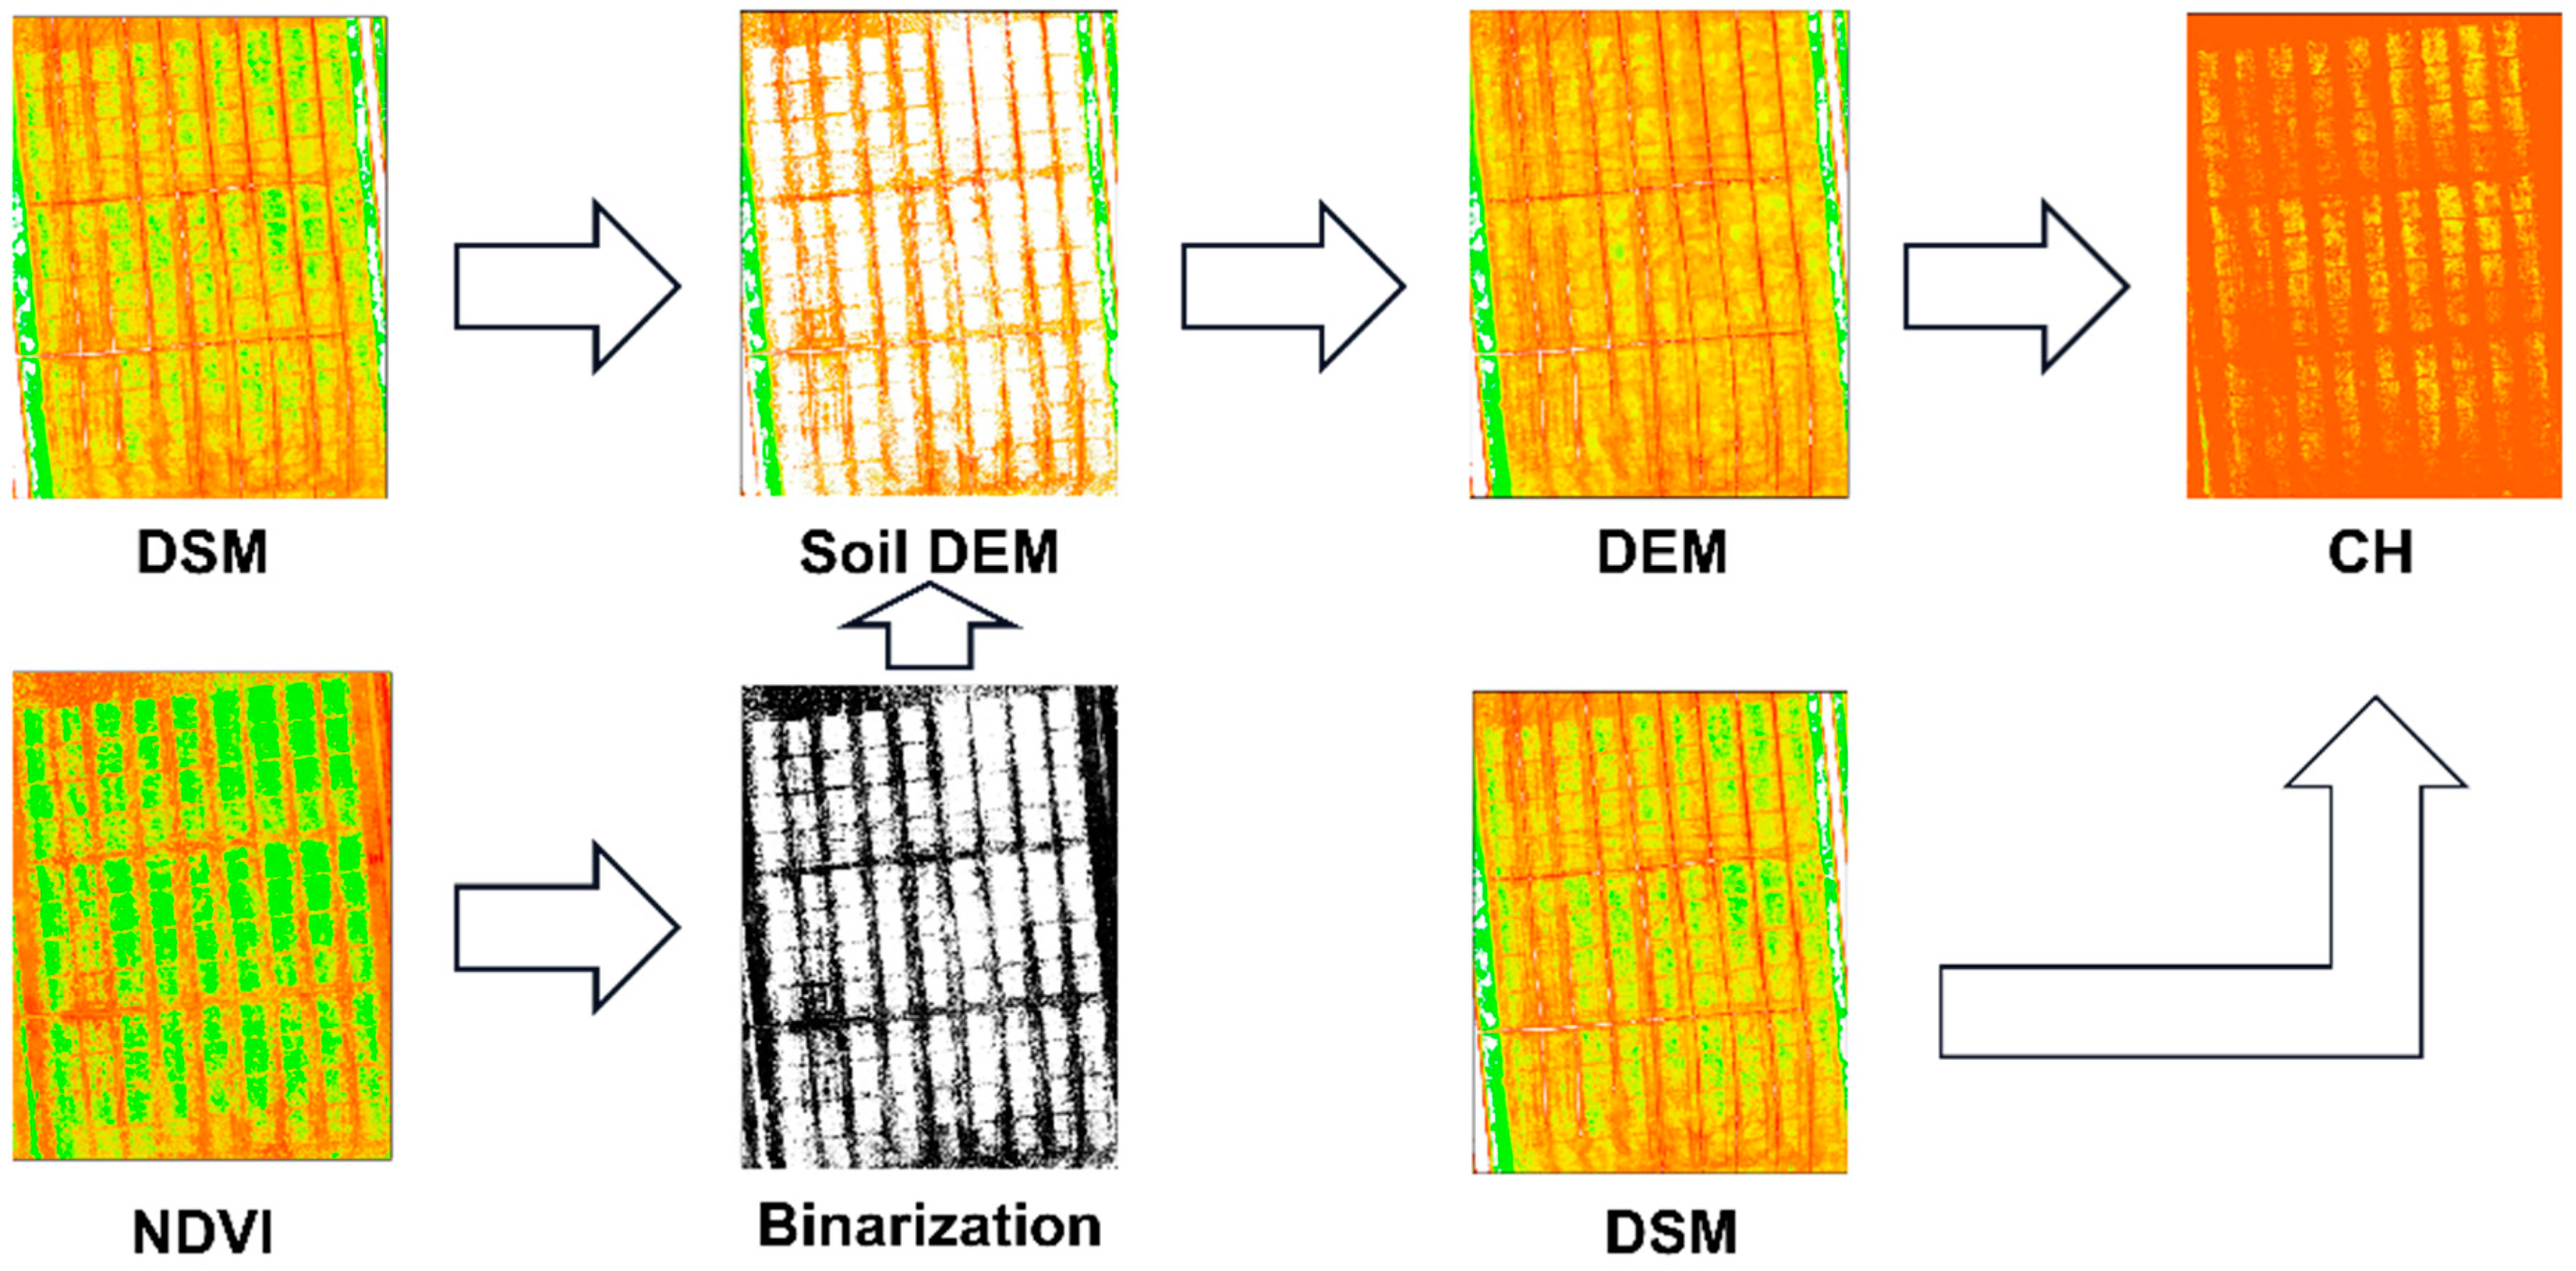
2.3. Data Preprocessing

Before being used, the three types of remote sensing data collected in this study (multispectral, thermal infrared, and three-dimensional point cloud) were spliced using DJI Terra to form orthophotos and underwent corresponding preprocessing (geographic registration and radiometric calibration) to meet usage requirements.
In this study, spectral information from the field was obtained using the DJI M3M and its multispectral sensor. Radiometric calibration was performed using gray panels with known reflectance placed on the ground to convert the original DN values of different bands into actual reflectance. The thermal infrared information was calibrated using the method of relative radiation calibration (normalization) to convert the original DN value of thermal images to normalized land surface temperature (NLST), normalized surface temperature can alleviate the impact of air temperature changes.
In this study, ArcGIS 10.4 software was used to convert the three-dimensional point cloud data in LAS format acquired by the LiDAR sensor DJI L1 into a raster-format digital surface model (DSM). The normalized difference vegetation index (NDVI) was constructed using multispectral data, and the canopy cover and bare soil were binarized through threshold segmentation, with specific reference to the research of Cheng et al. [10]. Based on this, the canopy surface model (CSM) and digital elevation model (DEM) were extracted from the DSM, and a spatially continuous DEM was obtained through interpolation (by using the inverse distance weight interpolation method). The height information of wheat was obtained using the difference between the CSM and DEM. The process flow is shown in Figure 4.

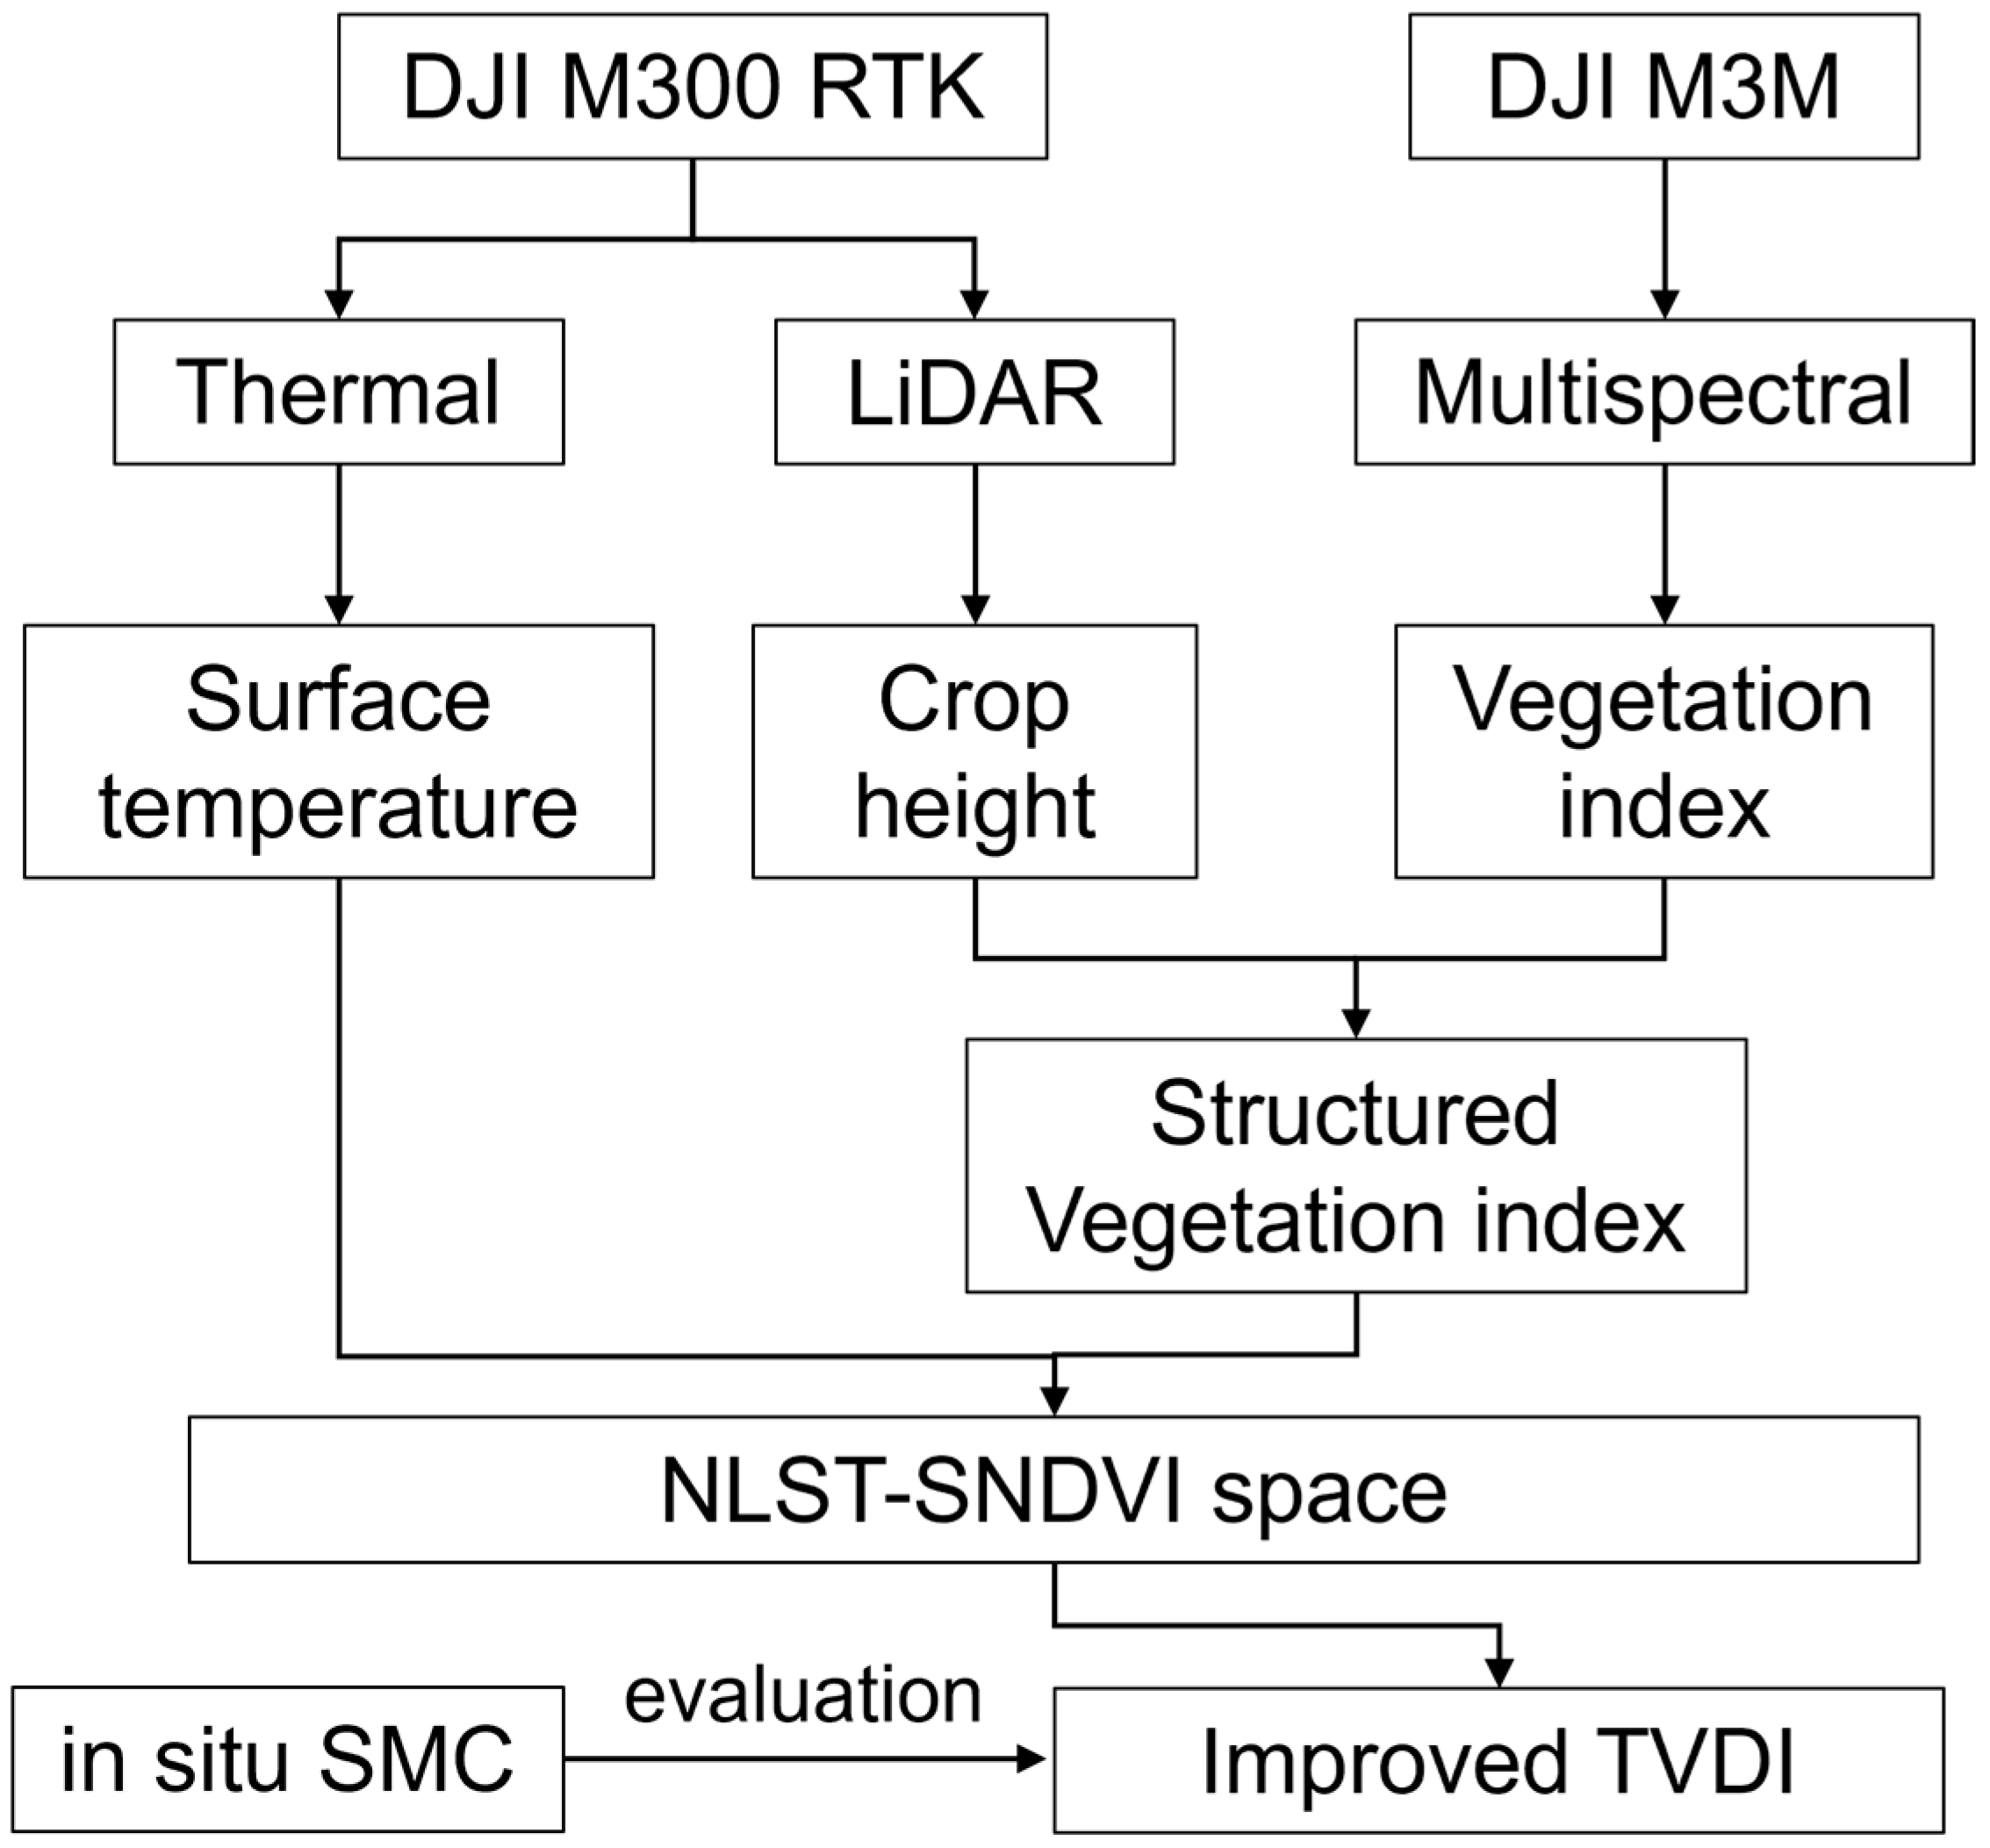
2.4. Improved Drought Index Construction

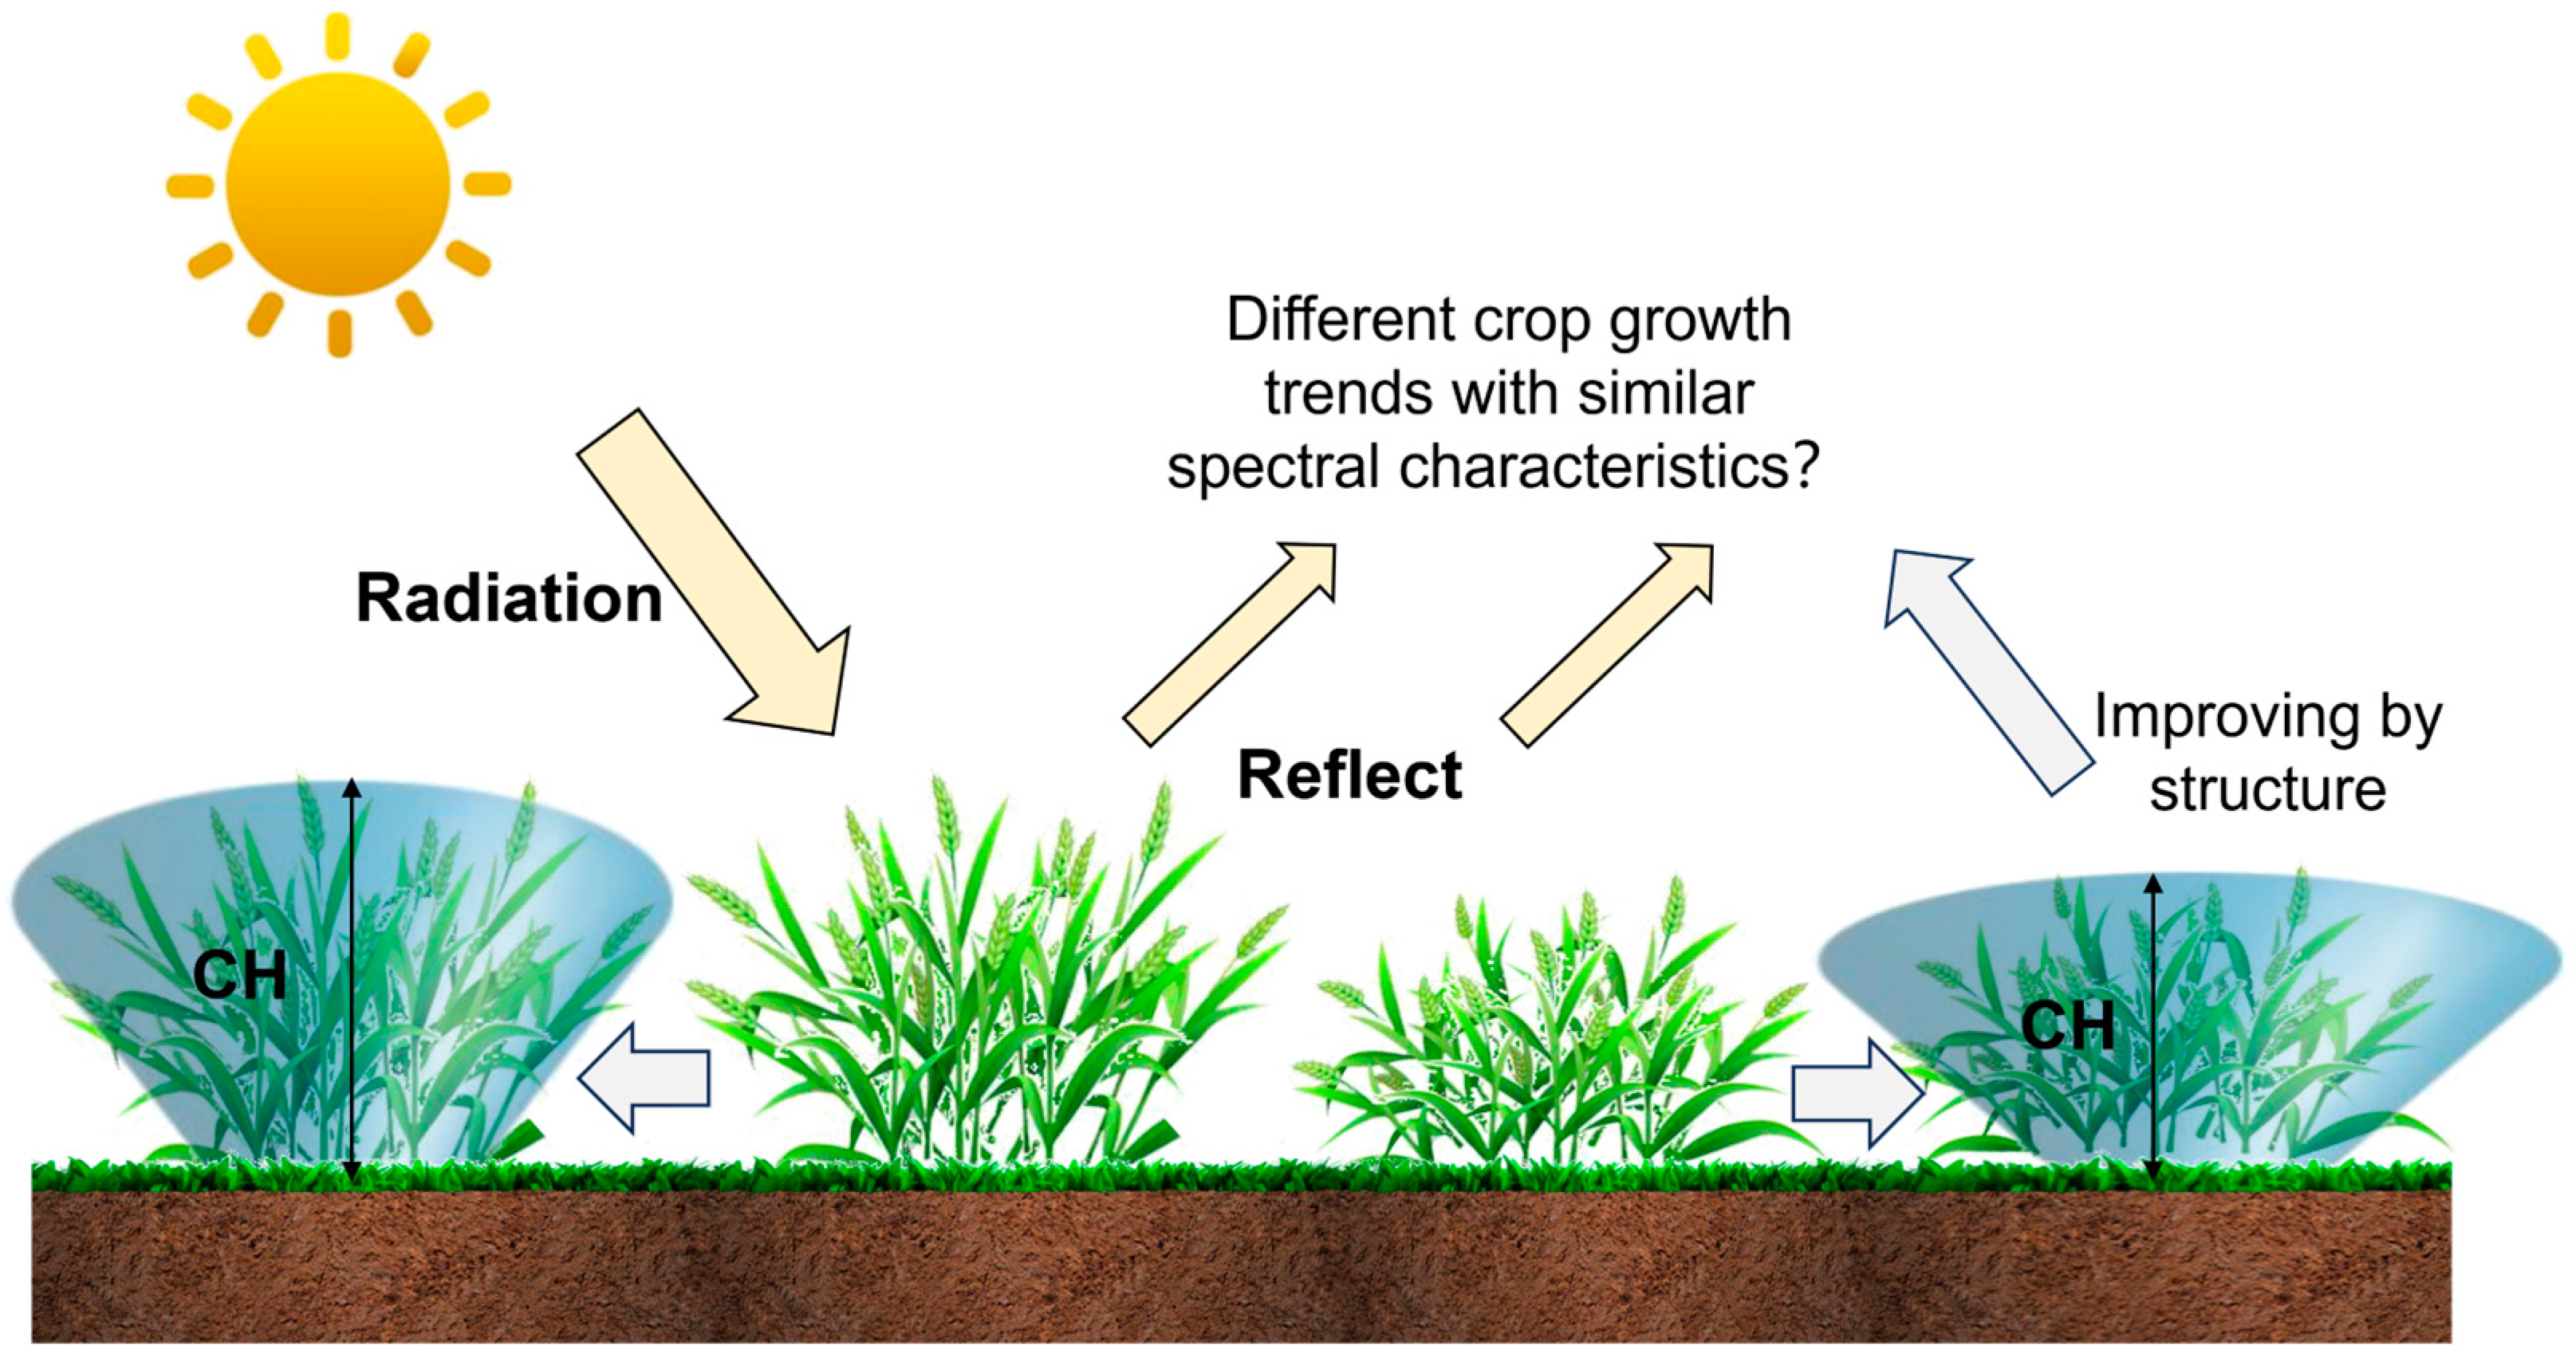
2.4.1. Construction of Structured Vegetation Index

Traditional vegetation indices calculated based on orthophotos of multispectral imagery are “flattened” and cannot reflect the influence of plant bodies under canopy cover on the spectrum due to spectral saturation issues (Figure 5). In this study, plant height information obtained through LiDAR is used to structure the “flattened” vegetation indices. Here, plants are approximated as cones, and the volume of the cone is calculated as a weight to weight the traditional vegetation indices, in order to construct a structured vegetation index (SVI) and improve the saturation resistance of the vegetation indices. The calculation formula is as follows:
S V I = 1 3 × C H × P i 2 × V I
where CH represents plant height; Pi represents spatial resolution; and VI represents vegetation index. Here, the widely used NDVI is selected and structured (SNDVI) for further research. Overall, this method transforms “planar” spectral indices into “three-dimensional forms” through height information.

2.4.2. NLST-SNDVI Space and Drought Index Construction

This study utilizes the Temperature–Vegetation Drought Index (TVDI) [29], constructs the NLST-SNDVI space based on the normalized land surface temperature and structured vegetation index, and fits the corresponding dry/wet boundaries to calculate the improved Temperature–Vegetation Drought Index (iTVDI). The specific process is as follows:
(1).
Resample the NLST and SNDVI images from five periods to the same resolution (1 cm × 1 cm).
(2).
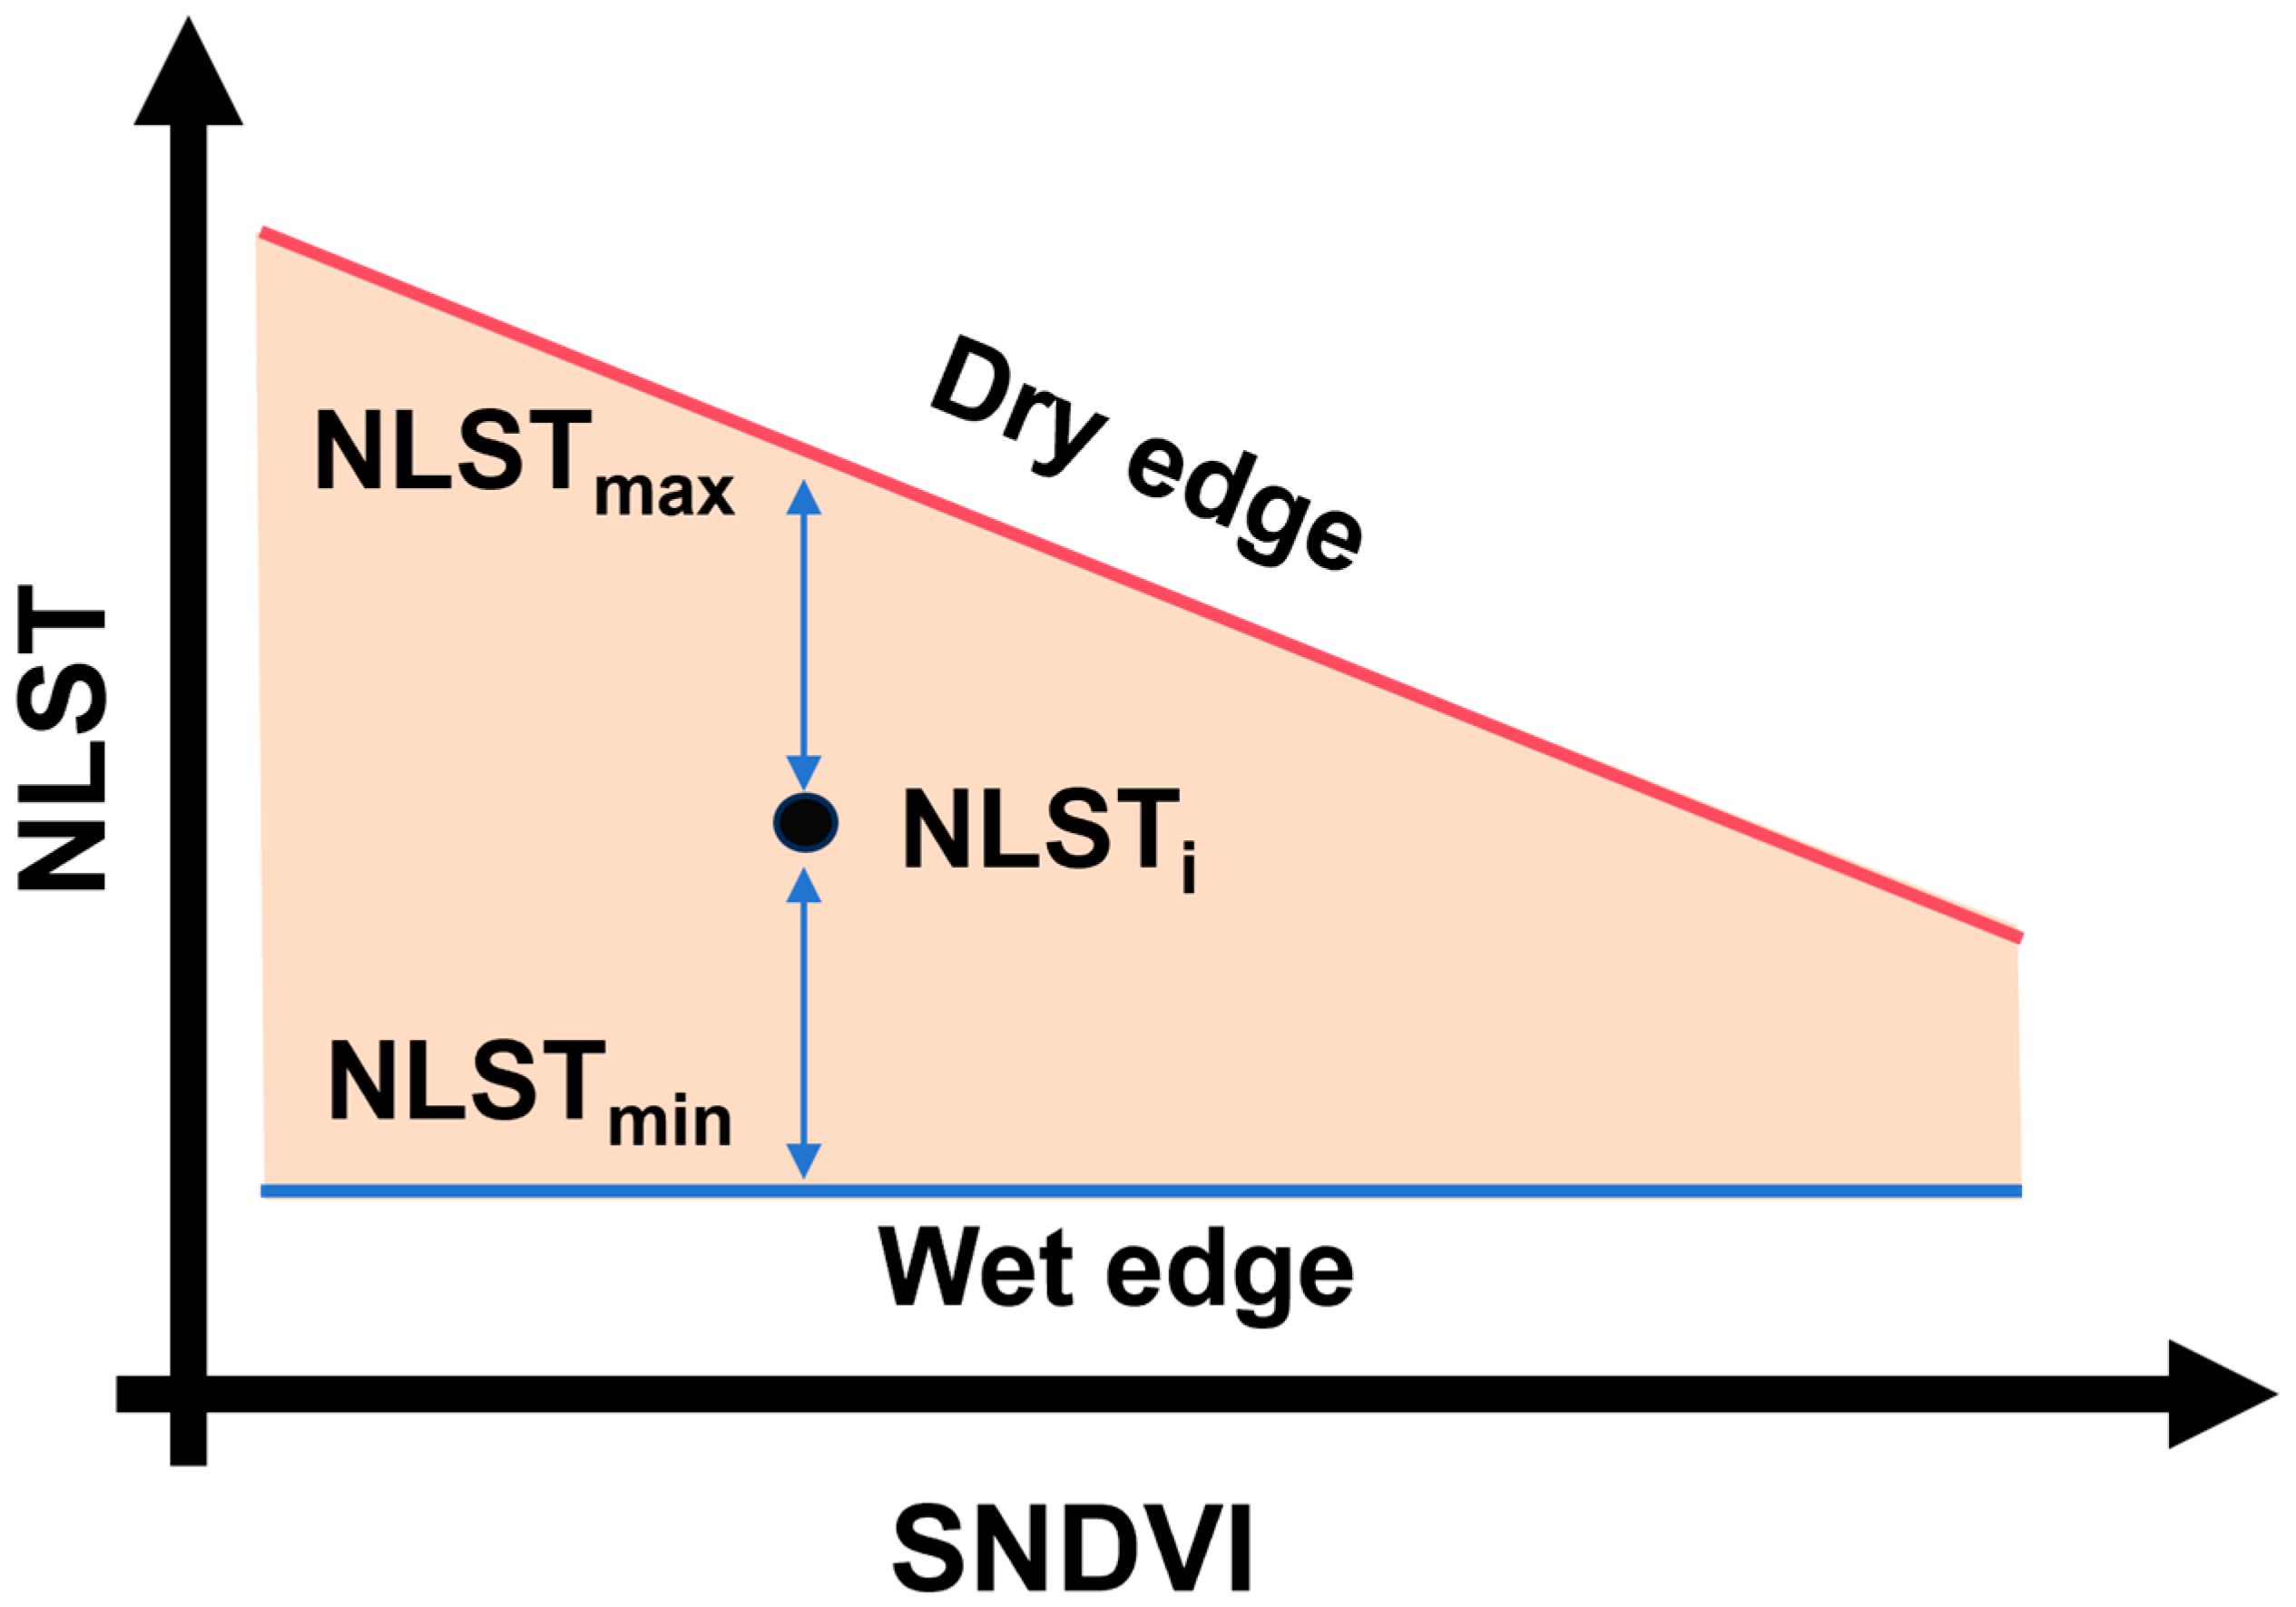
Combine the NLST and SNDVI images from each period with the near-surface air temperature measured in each sub-area and place them into a two-dimensional Cartesian coordinate system by pixel. The triangle/trapezoid formed by scattered points is the NLST-SNDVI space, and the upper boundary of this space is the dry edge and the lower boundary is the wet edge (Figure 6).
(3).
Fit the upper/lower edges of NLST, i.e., the corresponding dry/wet edges, through statistical regression methods. This study intends to compare the fitting effects of four statistical regression methods: linear regression, quadratic function, exponential function, and logarithmic function.
(4).
Calculate iTVDI using the following formula:
i T V D I = N L S T max N L S T i N L S T max N L S T min
where NLSTi represents the relative land surface temperature of the target pixel, while NLSTmax and NLSTmin represent the dry and wet edges corresponding to that pixel, respectively. The calculated iTVDI values range from 0 to 1. When iTVDI is closer to 0, it indicates lower soil moisture content; conversely, it indicates higher soil moisture content.
In summary, this study uses spectral sensors to construct vegetation indices, structures them using three-dimensional information from LiDAR, and finally combines the temperature information obtained from thermal sensors to construct a drought index.

2.5. Evaluation

In this study, the Pearson correlation coefficient r between the measured soil moisture content and the corresponding drought index is calculated to characterize the performance of the proposed iTVDI. The calculation formula is as follows:
r = i = 1 n ( S M C i S M C ¯ ) ( i T D D I i i T D D I ¯ ) i = 1 n ( S M C i S M C ¯ ) 2 i = 1 n ( i T D D I i i T D D I ¯ ) 2
where SMC represents the measured soil moisture content, and n represents the sample size. There are a total of 432 samples in this study. The correlation coefficient r ranges from −1 to 1. When r is closer to 1, it indicates a stronger positive correlation between the two variables; when r is close to 0, it indicates a weaker correlation between the two variables; and when r is closer to −1, it indicates a stronger negative correlation between the two variables.
Additionally, this study conducts spatial analysis using the global Moran’s I (GMI) to characterize the spatial applicability of the proposed drought index iTVDI. GMI was initially proposed for the spatial autocorrelation analysis of specified variables, and the value of GMI ranges between −1 and 1. When GMI is closer to 1 or −1, it indicates the stronger positive or negative spatial autocorrelation of the specified variable. When GMI is closer to 0, it indicates that the spatial distribution of the specified variable is random. The calculation method referred to previous studies [15,35,36]. In this study, the difference (DS) between the SMC predicted based on iTVDI and the measured SMC (Equation (4)) is selected as the specified variable to calculate GMI, in order to determine whether the applicability of iTVDI is affected by spatial location.
D S = ( a × i T V D I + b ) r S M C
where the parameters a and b were calculated by fitting the iTVDI with measured relative soil moisture content (rSMC). Here, the GMI was closer to 0, which means that the distribution of errors was random and the spatial adaptability was better.
Figure 7 presents the flowchart of the iTVDI establishment in this study.

3. Results

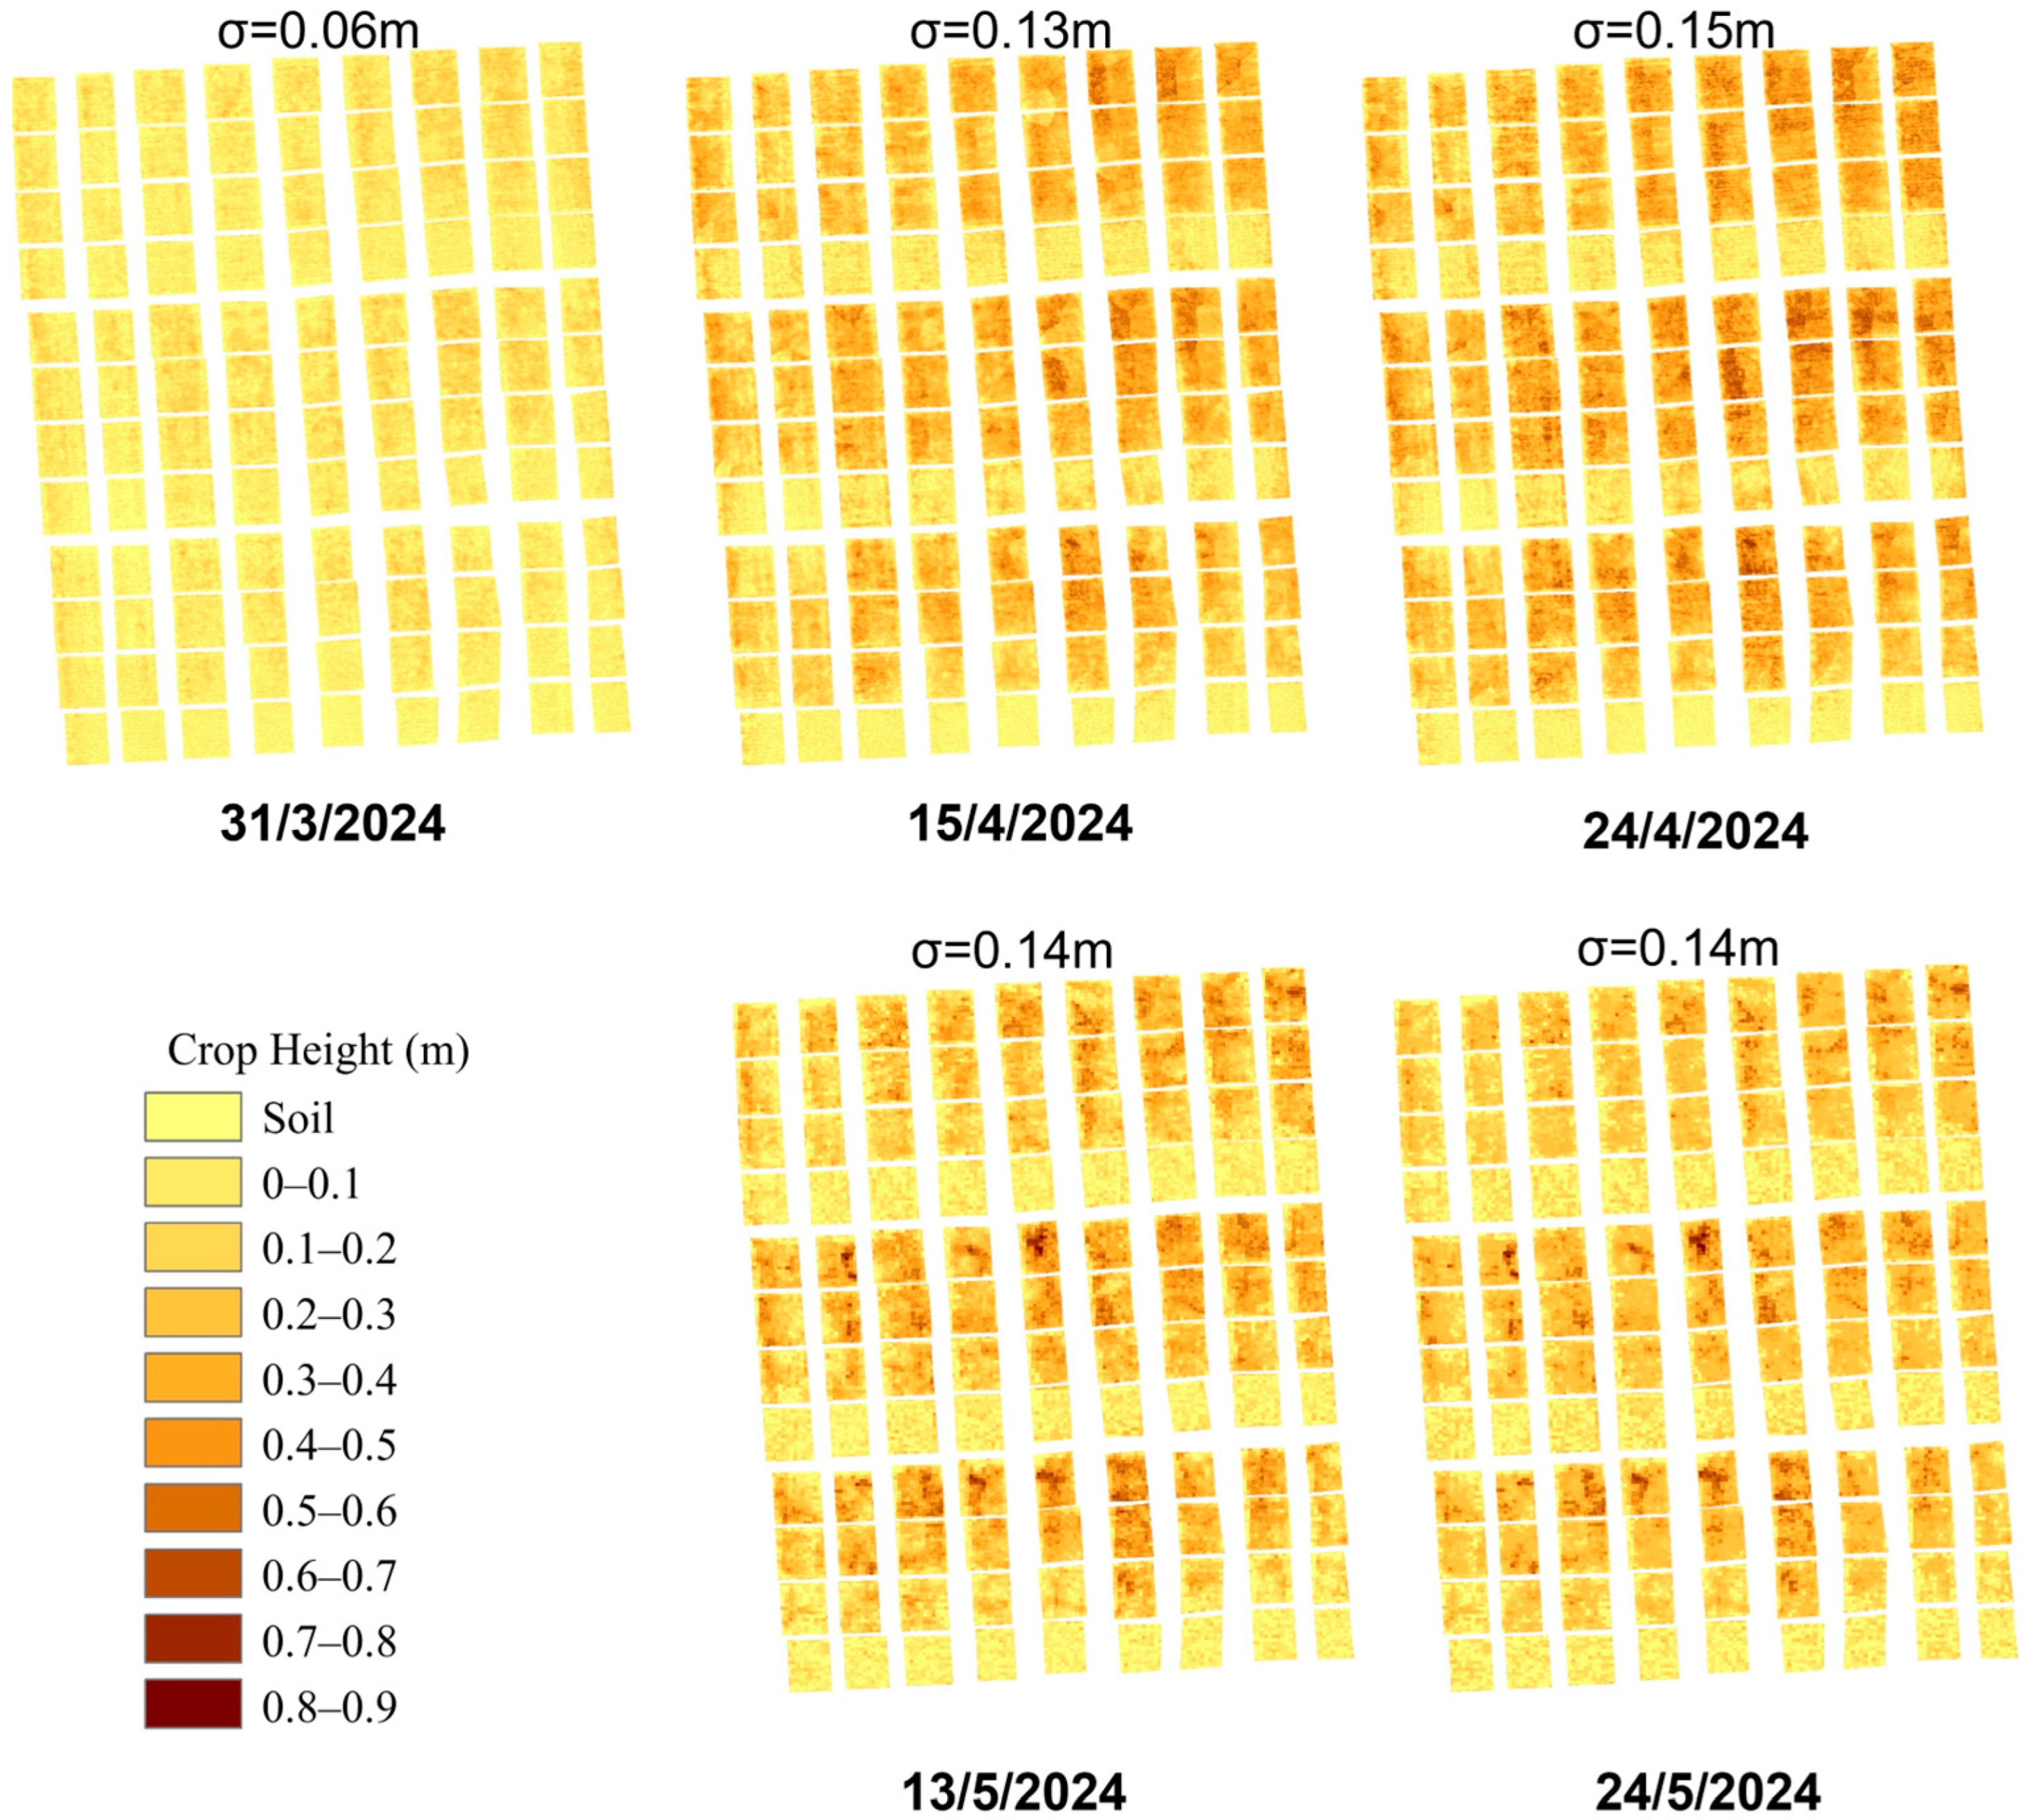
3.1. Spatial Distribution of Crop Height

Crop height is one of the most important indicators characterizing the structural features of crops, and the three-dimensional point cloud data obtained by LiDAR sensors can effectively provide information on crop structure. Figure 8 presents the distribution maps of wheat height in the field calculated for five periods in this study. Through Figure 8, the growth changes in wheat height can be clearly understood, and as the wheat grows, the spatial variability in wheat height can be manifested. The standard deviation (σ) calculated for each crop height map shows that as the wheat grows, the spatial heterogeneity of its height becomes more pronounced, with the σ varying from 0.06 to 0.15 m. Overall, crop height has the potential to relieve the saturation issue of spectral indices.

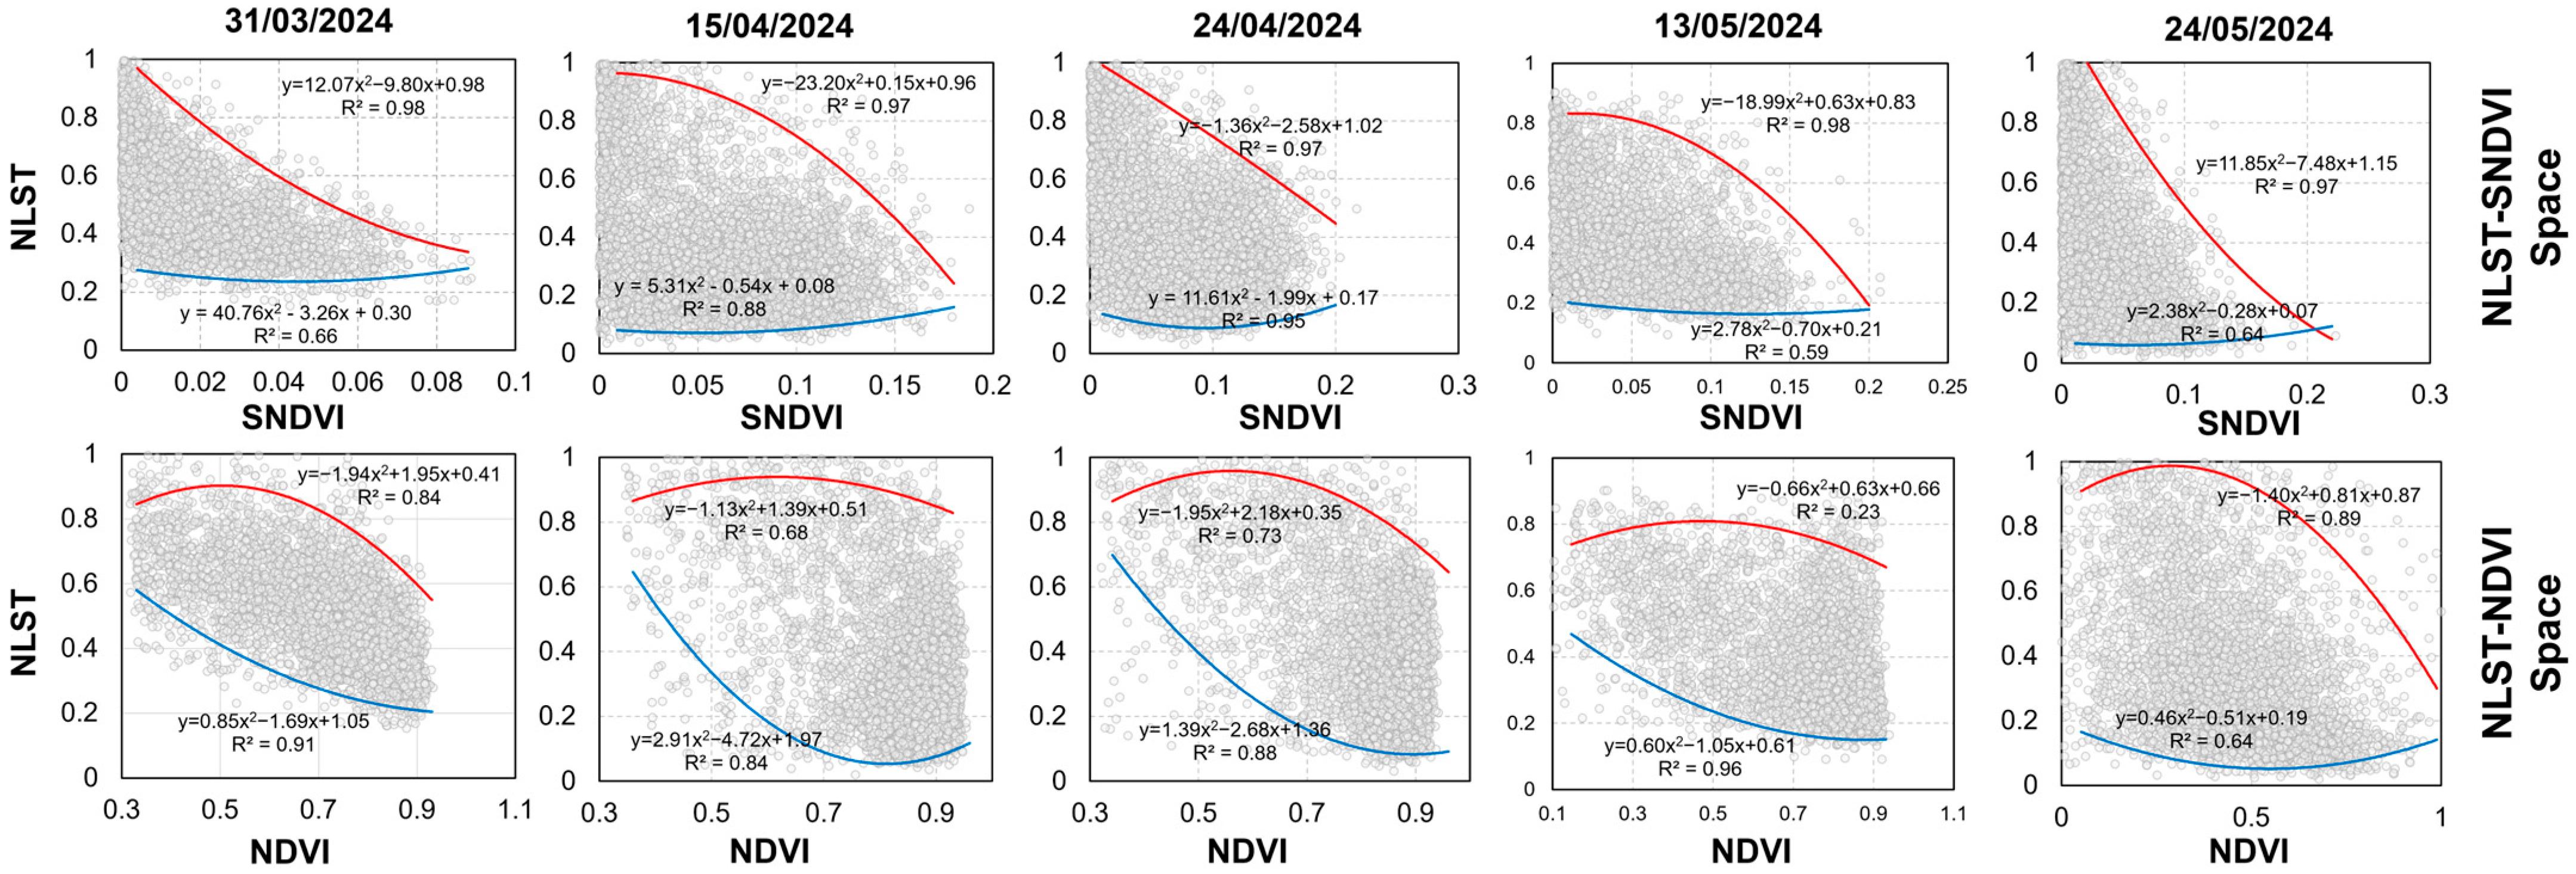
3.2. NLST-SNDVI Space and Dry/Wet Edge

The premise for constructing the NLST-SNDVI space and fitting the dry–wet edge model was to calculate the drought index. This study compares the NLST-SNDVI and NLST-NDVI spaces. As shown in Figure 9, the NLST-SNDVI space is closer to the theoretical triangular/trapezoidal space, where the dry edge exhibits a monotonic decrease, and the wet edge shows a gentler variation. However, the NLST-NDVI space in this study differs significantly from the theoretical model. Furthermore, the dry and wet edges are not straight lines in either space. This study compares the fitting accuracy of different nonlinear functions and finds that, in most cases, using a quadratic function for fitting yields the best results (Table 1), i.e., quadratic function best accounts for the natural variability in this complex landscape. For the NLST-SNDVI space, the R2 of the quadratic function fitting the dry edge ranges from 0.97 to 0.98, while the fitting accuracy for the wet edge is between 0.59 and 0.95. For the NLST-NDVI space, the R2 of the quadratic function fitting the dry edge is between 0.23 and 0.89, and the fitting accuracy for the wet edge is between 0.64 and 0.96. According to Equation (2), the fitting accuracy of the dry and wet edges has a significant impact on the calculation of the drought index, especially for the dry edge, which theoretically exhibits a more pronounced monotonic trend. Overall, the NLST-SNDVI space exhibits better fitting accuracy for the dry and wet edges and is superior to the NLST-NDVI space.

3.3. Comparison of the Improved Drought Index with In Situ Soil Moisture

Two drought indices were calculated using the fitted dry and wet edges: iTVDI based on the NLST-SNDVI space and TVDI based on the NLST-NDVI space. These indices were compared with the relative soil moisture content (rSMC) measured in situ using TDR. As shown in Figure 10, the correlation coefficient between iTVDI and rSMC reached 0.60 and was significant at the p > 0.05 level. However, the correlation coefficient between TVDI and rSMC was only 0.39 and did not reach the significance level (p > 0.05). Overall, the NLST-SNDVI space constructed using structured vegetation indices and the drought index calculated from it can more accurately describe the soil moisture conditions in wheat fields.

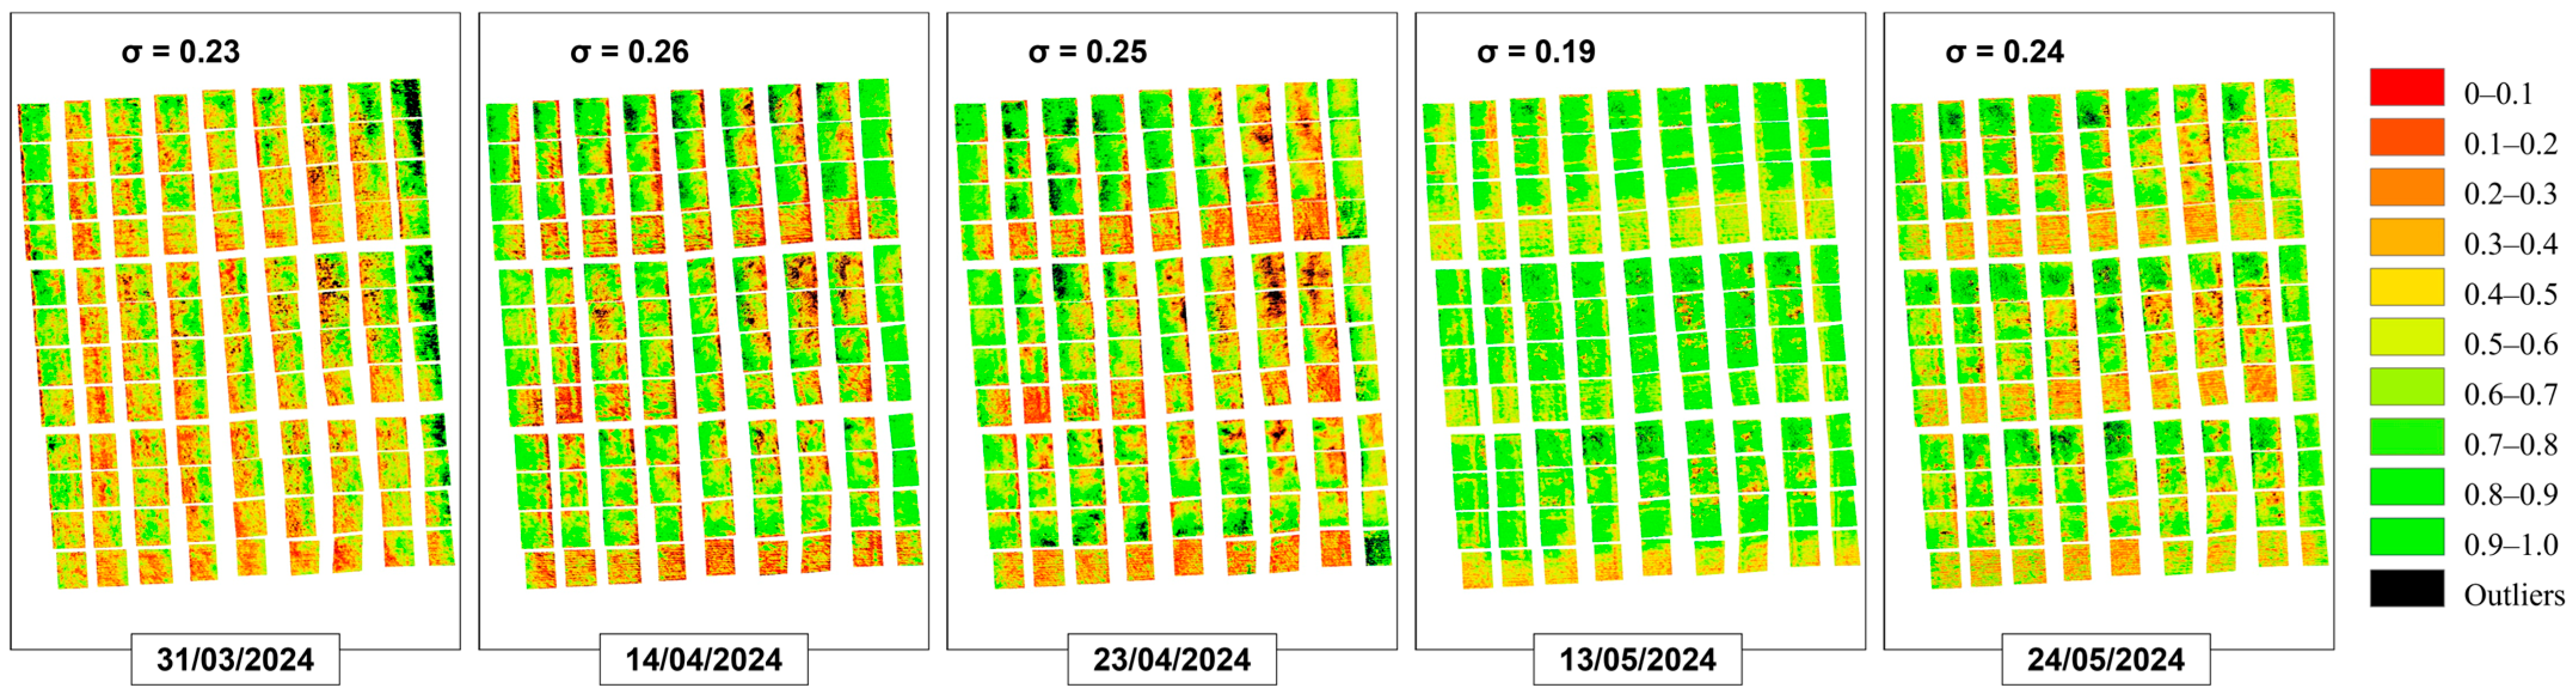
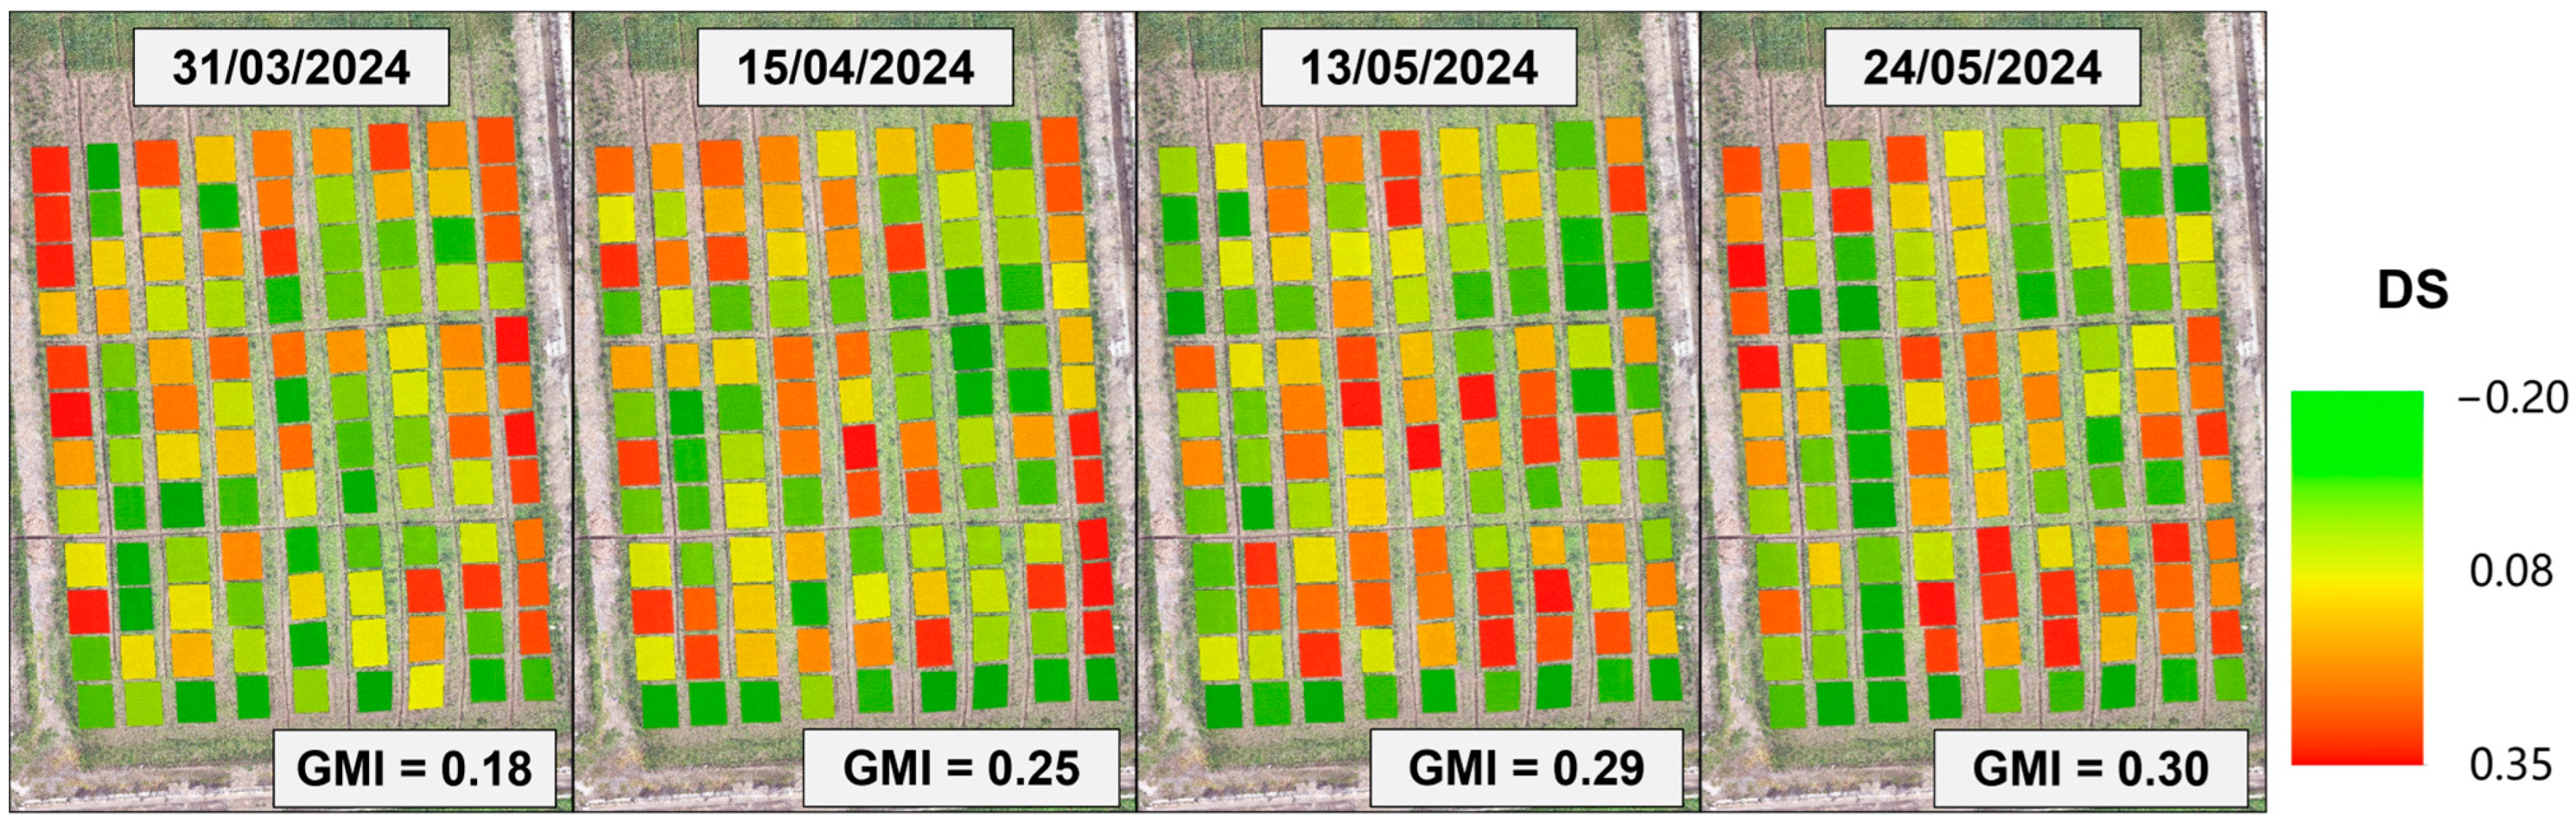
3.4. Spatial Analysis of Improved Drought Index

After demonstrating the effectiveness of iTVDI based on the NLST-SNDVI space, this study further generated an iTVDI map to further prove its ability to characterize the spatial heterogeneity of soil moisture content in wheat fields. As shown in Figure 11, the iTVDI clearly exhibits the temporal and spatial characteristics of soil moisture content. By calculating the standard deviation (σ), it can be seen that the method proposed in this study and the calculated iTVDI are capable of revealing the spatial heterogeneity of soil moisture (with σ ranging from 0.19 to 0.26). The few outliers in the figure, which are values beyond the theoretical range of iTVDI (iTVDI values range from 0 to 1), may be attributed to errors introduced during the fitting of the dry and wet edges, causing some NLST values to exceed the dry edge or fall below the wet edge. However, the overall error is small and does not affect the ability to characterize soil moisture.
To study the spatial applicability of iTVDI, we calculated the deviation of iTVDI in each experimental plot using Equation (4) and further calculated the global Moran’s I (GMI). The calculation results are shown in Figure 12. The GMI values for the four periods range between 0.18 and 0.30. It should be noted that GMI increases as the wheat growth period progresses, indicating that the spatial applicability of iTVDI decreases in later stages. This may be due to increasingly pronounced growth differences caused by wheat varieties and treatments. In general, none of which reached the significance level. This indicates that the error distribution of soil moisture information characterized by iTVDI is spatially random, suggesting the good spatial applicability of iTVDI.

4. Discussion

In general, this study proposed a method for crop drought monitoring based on UAV observations. Compared to ground observation, UAV provides a more efficient and cost-effective way. However, UAV still has shortcomings such as short endurance time (30–40 min) and large amounts of remote sensing observation data, which need further improvement.
Plant height is a key indicator for describing crop growth status and a relatively easily obtainable crop structural parameter [37,38]. It is widely used to estimate crop yield [39], biomass [40], and leaf area index [16] but is less common in soil moisture research. This study aims to improve the saturation resistance of spectral indices through plant height, optimizing their performance in estimating soil moisture. There are various methods for obtaining plant height. In their previous research, Maimaitijiang et al. [15] utilized RGB sensors combined with oblique photography to construct digital surface models (DSMs) of large fields and subsequently estimate crop height. However, with the widespread application of airborne LiDAR sensors, the deviations introduced by oblique photography algorithms have been reduced, enhancing accuracy [41]. The method proposed in this study to estimate crop height using the difference between DSM and digital elevation model (DEM) hinges on two key aspects: the segmentation of the canopy and soil background and the spatial interpolation of DEM. For the former, threshold segmentation methods have been widely applied and proven effective [42], but the specific indicator for determining the threshold remains to be further discussed [43]. For DEM spatial interpolation, the inverse distance weighting method used in this study is a common approach [44]. However, its underlying assumption is that the missing values between two points vary uniformly, which depends on the density of point cloud data and is not necessarily valid. Therefore, interpolation methods also require further research. Overall, the crop height extraction method used in this study is theoretically reliable and has the potential to improve the saturation resistance of spectral indices. In addition, this method of improving spectral saturation has theoretical universality, but further research is still needed to verify it.
In summary, the NLST-SNDVI space proposed in this study describes, to some extent, the relationship between field moisture conditions, crop growth conditions, and land surface temperature. The NLST-SNDVI space exhibits a more reasonable shape and demonstrates better fitting accuracy for wet and dry edges compared to the NLST-NDVI space. This is primarily attributed to the structured normalized difference vegetation index (SNDVI), which incorporates crop height into its calculation. On the other hand, the NDVI is prone to the influence of spectral saturation effects after crops reach a dense growth stage, resulting in its insufficient ability to represent crop growth vigor. As observed in Figure 13, although SNDVI shows a significant correlation with NDVI (r = 0.61, p > 0.05), NDVI quickly reaches saturation as crops grow, while SNDVI exhibits stronger resistance to saturation, meaning that the NLST-SNDVI space is closer to theoretical expectations. Previous studies have attempted to mitigate spectral saturation issues by combining multiple vegetation indices [45], but they are inherently based on spectral data, making it difficult to effectively alleviate saturation problems. Cheng et al. [10], in a study estimating soil moisture in cornfields using multi-source remote sensing information combined with machine learning, pointed out that thermal infrared data can alleviate spectral saturation issues to some extent because temperature differences persist even after spectral saturation occurs in dense crops. Studies addressing the common issue of spectral saturation in remote sensing continue to be conducted [34,46], not only for soil moisture estimation in this study but also for broader applications.
Sandholt et al. [29] explained the relationship between vegetation growth (characterized by vegetation indices), surface temperature, and soil moisture in his research, which were represented by the vegetation index-surface temperature triangle/trapezoid space. They demonstrated the theoretical validity of the Temperature–Vegetation Dryness Index (TVDI), but its performance in practical applications is affected by various factors such as spectral saturation and systematic errors in sensors. This study improves the negative impact of spectral saturation by structuring vegetation indices. It is noteworthy that when the vegetation index–surface temperature triangle/trapezoid space was initially proposed, it was generally believed that the wet and dry edges were linear. However, subsequent research has challenged this viewpoint. Hu et al. [47] suggested that using nonlinear wet and dry boundaries can effectively enhance the performance of the corresponding water deficit index. Furthermore, Cheng et al. [9] introduced air temperature into the two-dimensional space of vegetation index–surface temperature, constructing a three-dimensional space of vegetation index–surface temperature–air temperature. Their research suggests that surface temperature is not only influenced by soil moisture and vegetation conditions but also significantly impacted by air temperature, especially in long-term sequence studies, and similarly, the relationship between the three is nonlinear. Therefore, the original wet and dry edges should be wet and dry surfaces. Based on this theory, Cheng et al. [9] constructed the three-dimensional drought index TDDI, which was proven to outperform TVDI. Subsequently, some studies further confirmed the rationality of the three-dimensional space of vegetation index–surface temperature–air temperature and the effectiveness of the three-dimensional drought index [4,48]. However, for small-scale field studies, the difference in air temperature is minimal. Therefore, the correlation between air temperature and soil moisture is difficult to establish, and the theory of the three-dimensional drought index may be more applicable to long-term sequences or larger research areas, such as satellite observations.

5. Conclusions

In this study, we utilized unmanned aerial vehicles (UAVs) equipped with LiDAR, thermal infrared, and multispectral sensors to construct effective drought indices for the accurate characterization of soil moisture content in winter wheat fields. Initially, we estimated wheat plant height using airborne LiDAR sensors and improved traditional spectral indices in a structured manner based on crop height. Subsequently, we constructed the NLST-SNDVI space by combining the structured normalized difference vegetation index (NDVI) with land surface temperature and calculated the improved Temperature–Vegetation Drought Index (iTVDI). The conclusions are summarized as follows:
(1).
The structured spectral indices exhibit better resistance to spectral saturation, making the NLST-SNDVI space closer to expectations than the NLST-NDVI space, with higher fitting accuracy for wet and dry edges.
(2).
The iTVDI calculated based on the NLST-SNDVI space can effectively characterize soil moisture content, showing a significant correlation with measured surface soil moisture content.
(3).
The global Moran’s I calculated based on iTVDI deviations ranges between 0.18 and 0.30, all reaching significant levels, indicating that iTVDI has good spatial applicability.
Overall, the results of this study can provide support for crop moisture monitoring and irrigation decision-making in the field. The proposed structured vegetation index also offers a new perspective for related research on spectral saturation effects.

Author Contributions

Methodology, M.C.; Formal analysis, M.C.; Investigation, X.L.; Resources, M.S.; Data curation, X.L., Z.L., G.Y., L.Z., B.S., Z.W., Z.Z. and M.S.; Writing—original draft, M.C.; Writing—review & editing, C.S.; Supervision, C.S.; Project administration, C.S.; Funding acquisition, C.S. All authors have read and agreed to the published version of the manuscript.

Funding

This research was supported by National Natural Science Foundation of China (grant no. 42301366), the China Postdoctoral Science Foundation (grant no. 2023M733001), the Basic Research Program Natural Science Foundation of Jiangsu Province (grant no. SBK2023043261), and a project funded by the Priority Academic Program Development of Jiangsu Higher Education Institutions (PAPD).

Data Availability Statement

The original contributions presented in the study are included in the article; further inquiries can be directed to the corresponding authors.

Conflicts of Interest

The authors declare that they have no conflicts of interest.

References

  1. Thompson, R.B.; Gallardo, M.; Valdez, L.C.; Fernández, M.D. Using plant water status to define threshold values for irrigation management of vegetable crops using soil moisture sensors. Agric. Water Manag. 2007, 88, 147–158. [Google Scholar] [CrossRef]
  2. Elsayed, S.; Elhoweity, M.; Ibrahim, H.H.; Dewir, Y.H.; Migdadi, H.M.; Schmidhalter, U. Thermal imaging and passive reflectance sensing to estimate the water status and grain yield of wheat under different irrigation regimes. Agric. Water Manag. 2017, 189, 98–110. [Google Scholar] [CrossRef]
  3. Shin, Y.; Jung, Y. Development of irrigation water management model for reducing drought severity using remotely sensed soil moisture footprints. J. Irrig. Drain. Eng. 2014, 140, 04014021. [Google Scholar] [CrossRef]
  4. Zhu, S.; Cui, N.; Jin, H.; Jin, X.; Guo, L.; Jiang, S.; Wu, Z.; Lv, M.; Chen, F.; Liu, Q. Optimization of multi-dimensional indices for kiwifruit orchard soil moisture content estimation using UAV and ground multi-sensors. Agric. Water Manag. 2024, 294, 108705. [Google Scholar] [CrossRef]
  5. Robinson, D.A.; Campbell, C.S.; Hopmans, J.W.; Hornbuckle, B.K.; Jones, S.B.; Knight, R.; Ogden, F.; Selker, J.; Wendroth, O. Soil Moisture Measurement for Ecological and Hydrological Watershed-Scale Observatories: A Review. Vadose Zone J. 2008, 7, 358–389. [Google Scholar] [CrossRef]
  6. Hollinger, S.E.; Isard, S.A. A soil moisture climatology of Illinois. J. Clim. 1994, 7, 822–833. [Google Scholar] [CrossRef]
  7. Agliata, R.; Bogaard, T.A.; Greco, R.; Minardo, A.; Mollo, L.; Steele-Dunne, S.C. Non-invasive water content estimation in a tuff wall by DTS. Constr. Build. Mater. 2019, 197, 821–829. [Google Scholar] [CrossRef]
  8. Robinson, D.A.; Jones, S.B.; Wraith, J.M.; Or, D.; Friedman, S.P. A Review of Advances in Dielectric and Electrical Conductivity Measurement in Soils Using Time Domain Reflectometry. Vadose Zone J. 2003, 2, 444–475. [Google Scholar] [CrossRef]
  9. Cheng, M.; Sun, C.; Nie, C.; Liu, S.; Yu, X.; Bai, Y.; Liu, Y.; Meng, L.; Jia, X.; Liu, Y. Evaluation of UAV-based drought indices for crop water conditions monitoring: A case study of summer maize. Agric. Water Manag. 2023, 287, 108442. [Google Scholar] [CrossRef]
  10. Cheng, M.; Jiao, X.; Liu, Y.; Shao, M.; Yu, X.; Bai, Y.; Wang, Z.; Wang, S.; Tuohuti, N.; Liu, S. Estimation of soil moisture content under high maize canopy coverage from UAV multimodal data and machine learning. Agric. Water Manag. 2022, 264, 107530. [Google Scholar] [CrossRef]
  11. Mohanty, B.P.; Cosh, M.H.; Lakshmi, V.; Montzka, C. Soil moisture remote sensing: State-of-the-science. Vadose Zone J. 2017, 16, 1–9. [Google Scholar] [CrossRef]
  12. Bhardwaj, A.; Sam, L.; Martín-Torres, F.J.; Kumar, R. UAVs as remote sensing platform in glaciology: Present applications and future prospects. Remote Sens. Environ. 2016, 175, 196–204. [Google Scholar] [CrossRef]
  13. Cheng, M.; Li, B.; Jiao, X.; Huang, X.; Fan, H.; Lin, R.; Liu, K. Using multimodal remote sensing data to estimate regional-scale soil moisture content: A case study of Beijing, China. Agric. Water Manag. 2022, 260, 107298. [Google Scholar] [CrossRef]
  14. Xie, T.; Li, J.; Yang, C.; Jiang, Z.; Chen, Y.; Guo, L.; Zhang, J. Crop height estimation based on UAV images: Methods, errors, and strategies. Comput. Electron. Agric. 2021, 185, 106155. [Google Scholar] [CrossRef]
  15. Maimaitijiang, M.; Sagan, V.; Sidike, P.; Hartling, S.; Esposito, F.; Fritschi, F.B. Soybean yield prediction from UAV using multimodal data fusion and deep learning. Remote Sens. Environ. 2020, 237, 111599. [Google Scholar] [CrossRef]
  16. Gano, B.; Dembele, J.S.B.; Ndour, A.; Luquet, D.; Beurier, G.; Diouf, D.; Audebert, A. Using UAV borne, multi-spectral imaging for the field phenotyping of shoot biomass, leaf area index and height of West African sorghum varieties under two contrasted water conditions. Agronomy 2021, 11, 850. [Google Scholar] [CrossRef]
  17. Maimaitijiang, M.; Ghulam, A.; Sidike, P.; Hartling, S.; Maimaitiyiming, M.; Peterson, K.; Shavers, E.; Fishman, J.; Peterson, J.; Kadam, S. Unmanned Aerial System (UAS)-based phenotyping of soybean using multi-sensor data fusion and extreme learning machine. ISPRS J. Photogramm. Remote Sens. 2017, 134, 43–58. [Google Scholar] [CrossRef]
  18. Shahi, T.B.; Xu, C.-Y.; Neupane, A.; Guo, W. Recent advances in crop disease detection using UAV and deep learning techniques. Remote Sens. 2023, 15, 2450. [Google Scholar] [CrossRef]
  19. Berger, K.; Verrelst, J.; Féret, J.-B.; Wang, Z.; Wocher, M.; Strathmann, M.; Danner, M.; Mauser, W.; Hank, T. Crop nitrogen monitoring: Recent progress and principal developments in the context of imaging spectroscopy missions. Remote Sens. Environ. 2020, 242, 111758. [Google Scholar] [CrossRef]
  20. Lu, F.; Sun, Y.; Hou, F. Using UAV Visible Images to Estimate the Soil Moisture of Steppe. Water 2020, 12, 2334. [Google Scholar] [CrossRef]
  21. Luo, W.; Xu, X.; Liu, W.; Liu, M.; Li, Z.; Peng, T.; Xu, C.; Zhang, Y.; Zhang, R. UAV based soil moisture remote sensing in a karst mountainous catchment. Catena 2019, 174, 478–489. [Google Scholar] [CrossRef]
  22. Ge, X.; Wang, J.; Ding, J.; Cao, X.; Zhang, Z.; Liu, J.; Li, X. Combining UAV-based hyperspectral imagery and machine learning algorithms for soil moisture content monitoring. PeerJ 2019, 7, e6926. [Google Scholar] [CrossRef]
  23. Guo, W.; Huang, S.; Huang, Q.; Leng, G.; Mu, Z.; Han, Z.; Wei, X.; She, D.; Wang, H.; Wang, Z. Drought trigger thresholds for different levels of vegetation loss in China and their dynamics. Agric. For. Meteorol. 2023, 331, 109349. [Google Scholar] [CrossRef]
  24. Cao, J.; Zhang, Z.; Luo, Y.; Zhang, L.; Zhang, J.; Li, Z.; Tao, F. Wheat yield predictions at a county and field scale with deep learning, machine learning, and google earth engine. Eur. J. Agron. 2021, 123, 126204. [Google Scholar] [CrossRef]
  25. Chandel, N.S.; Chakraborty, S.K.; Rajwade, Y.A.; Dubey, K.; Tiwari, M.K.; Jat, D. Identifying crop water stress using deep learning models. Neural Comput. Appl. 2021, 33, 5353–5367. [Google Scholar] [CrossRef]
  26. Liu, X.; Zhu, X.; Pan, Y.; Li, S.; Liu, Y.; Ma, Y. Agricultural drought monitoring: Progress, challenges, and prospects. J. Geogr. Sci. 2016, 26, 750–767. [Google Scholar] [CrossRef]
  27. Du, L.; Song, N.; Liu, K.; Hou, J.; Hu, Y.; Zhu, Y.; Wang, X.; Wang, L.; Guo, Y. Comparison of Two Simulation Methods of the Temperature Vegetation Dryness Index (TVDI) for Drought Monitoring in Semi-Arid Regions of China. Remote Sens. 2017, 9, 177. [Google Scholar] [CrossRef]
  28. Carlson, T.N.; Gillies, R.R.; Perry, E.M. A method to make use of thermal infrared temperature and NDVI measurements to infer surface soil water content and fractional vegetation cover. Remote Sens. Rev. 1994, 9, 161–173. [Google Scholar] [CrossRef]
  29. Sandholt, I.; Rasmussen, K.; Andersen, J. A simple interpretation of the surface temperature/vegetation index space for assessment of surface moisture status. Remote Sens. Environ. 2002, 79, 213–224. [Google Scholar] [CrossRef]
  30. Maimaitijiang, M.; Sagan, V.; Sidike, P.; Daloye, A.M.; Erkbol, H.; Fritschi, F.B. Crop monitoring using satellite/UAV data fusion and machine learning. Remote Sens. 2020, 12, 1357. [Google Scholar] [CrossRef]
  31. Berger, K.; Machwitz, M.; Kycko, M.; Kefauver, S.C.; Van Wittenberghe, S.; Gerhards, M.; Verrelst, J.; Atzberger, C.; Van der Tol, C.; Damm, A. Multi-sensor spectral synergies for crop stress detection and monitoring in the optical domain: A review. Remote Sens. Environ. 2022, 280, 113198. [Google Scholar] [CrossRef] [PubMed]
  32. Zhao, J.; Zhong, Y.; Hu, X.; Wei, L.; Zhang, L. A robust spectral-spatial approach to identifying heterogeneous crops using remote sensing imagery with high spectral and spatial resolutions. Remote Sens. Environ. 2020, 239, 111605. [Google Scholar] [CrossRef]
  33. Liu, Y.; Feng, H.; Yue, J.; Li, Z.; Yang, G.; Song, X.; Yang, X.; Zhao, Y. Remote-sensing estimation of potato above-ground biomass based on spectral and spatial features extracted from high-definition digital camera images. Comput. Electron. Agric. 2022, 198, 107089. [Google Scholar] [CrossRef]
  34. Mutanga, O.; Masenyama, A.; Sibanda, M. Spectral saturation in the remote sensing of high-density vegetation traits: A systematic review of progress, challenges, and prospects. ISPRS J. Photogramm. Remote Sens. 2023, 198, 297–309. [Google Scholar] [CrossRef]
  35. Cheng, M.; Penuelas, J.; McCabe, M.F.; Atzberger, C.; Jiao, X.; Wu, W.; Jin, X. Combining multi-indicators with machine-learning algorithms for maize yield early prediction at the county-level in China. Agric. For. Meteorol. 2022, 323, 109057. [Google Scholar] [CrossRef]
  36. Liu, Z.; Ju, H.; Ma, Q.; Sun, C.; Lv, Y.; Liu, K.; Wu, T.; Cheng, M. Rice Yield Estimation Using Multi-Temporal Remote Sensing Data and Machine Learning: A Case Study of Jiangsu, China. Agriculture 2024, 14, 638. [Google Scholar] [CrossRef]
  37. Oehme, L.H.; Reineke, A.-J.; Weiß, T.M.; Würschum, T.; He, X.; Müller, J. Remote sensing of maize plant height at different growth stages using UAV-based digital surface models (DSM). Agronomy 2022, 12, 958. [Google Scholar] [CrossRef]
  38. Ji, Y.; Chen, Z.; Cheng, Q.; Liu, R.; Li, M.; Yan, X.; Li, G.; Wang, D.; Fu, L.; Ma, Y. Estimation of plant height and yield based on UAV imagery in faba bean (Vicia faba L.). Plant Methods 2022, 18, 26. [Google Scholar] [CrossRef] [PubMed]
  39. Yu, D.; Zha, Y.; Shi, L.; Jin, X.; Hu, S.; Yang, Q.; Huang, K.; Zeng, W. Improvement of sugarcane yield estimation by assimilating UAV-derived plant height observations. Eur. J. Agron. 2020, 121, 126159. [Google Scholar] [CrossRef]
  40. Panday, U.S.; Shrestha, N.; Maharjan, S.; Pratihast, A.K.; Shahnawaz; Shrestha, K.L.; Aryal, J. Correlating the plant height of wheat with above-ground biomass and crop yield using drone imagery and crop surface model, a case study from Nepal. Drones 2020, 4, 28. [Google Scholar] [CrossRef]
  41. Zhou, X.; Zhang, X. Individual tree parameters estimation for plantation forests based on UAV oblique photography. IEEE Access 2020, 8, 96184–96198. [Google Scholar] [CrossRef]
  42. Liao, J.; Wang, Y.; Zhu, D.; Zou, Y.; Zhang, S.; Zhou, H. Automatic segmentation of crop/background based on luminance partition correction and adaptive threshold. IEEE Access 2020, 8, 202611–202622. [Google Scholar] [CrossRef]
  43. Castillo-Martínez, M.Á.; Gallegos-Funes, F.J.; Carvajal-Gámez, B.E.; Urriolagoitia-Sosa, G.; Rosales-Silva, A.J. Color index based thresholding method for background and foreground segmentation of plant images. Comput. Electron. Agric. 2020, 178, 105783. [Google Scholar] [CrossRef]
  44. Maleika, W. Inverse distance weighting method optimization in the process of digital terrain model creation based on data collected from a multibeam echosounder. Appl. Geomat. 2020, 12, 397–407. [Google Scholar] [CrossRef]
  45. Gu, Y.; Wylie, B.K.; Howard, D.M.; Phuyal, K.P.; Ji, L. NDVI saturation adjustment: A new approach for improving cropland performance estimates in the Greater Platte River Basin, USA. Ecol. Indic. 2013, 30, 1–6. [Google Scholar] [CrossRef]
  46. Gao, S.; Zhong, R.; Yan, K.; Ma, X.; Chen, X.; Pu, J.; Gao, S.; Qi, J.; Yin, G.; Myneni, R.B. Evaluating the saturation effect of vegetation indices in forests using 3D radiative transfer simulations and satellite observations. Remote Sens. Environ. 2023, 295, 113665. [Google Scholar] [CrossRef]
  47. Hu, X.; Shi, L.; Lin, L.; Zha, Y. Nonlinear boundaries of land surface temperature–vegetation index space to estimate water deficit index and evaporation fraction. Agric. For. Meteorol. 2019, 279, 107736. [Google Scholar] [CrossRef]
  48. Chen, H.; Chen, H.; Zhang, S.; Chen, S.; Cen, F.; Zhao, Q.; Huang, X.; He, T.; Gao, Z. Comparison of CWSI and Ts-Ta-VIs in moisture monitoring of dryland crops (sorghum, maize) based on UAV remote sensing. J. Integr. Agric. 2024, 23, 2458–2475. [Google Scholar] [CrossRef]
Figure 1. Overview of the experimental area and the experimental field. Note: N1: no fertilization, N2: 150 kg/hm2, N3: 225 kg/hm2, and N4: 300 kg/hm2; D1: 1,500,000 plants/hm2, D2: 2,250,000 kg/hm2, and D3: 3,000,000 kg/hm2; V1: Yangmai 13, V2: Yangmai 20, and V3: Yangmai 28.
Agronomy 14 01783 g001
Figure 2. UAV and sensors: (a) DJI M300RTK; (b) DJI M3M.
Agronomy 14 01783 g002
Figure 3. The measured soil moisture content.
Agronomy 14 01783 g003
Figure 4. Flowchart of extracting wheat plant height based on 3D point cloud data.
Agronomy 14 01783 g004
Figure 5. Schematic diagram of spectral saturation effect and structuring of vegetation indices.
Agronomy 14 01783 g005
Figure 6. Schematic diagram of the NLST-SNDVI space.
Agronomy 14 01783 g006
Figure 7. The flowchart of the iTVDI establishment.
Agronomy 14 01783 g007
Figure 8. Map of wheat height in different periods.
Agronomy 14 01783 g008
Figure 9. NLST-NDVI/SNDVI space.
Agronomy 14 01783 g009
Figure 10. The comparison of rSMC with (a) iTVDI and (b) TVDI. Note: * indicates the correlation reached significant level (p > 0.05).
Agronomy 14 01783 g010
Figure 11. The map of iTVDI.
Agronomy 14 01783 g011
Figure 12. The map of iTVDI deviation in different periods.
Agronomy 14 01783 g012
Figure 13. The scatter of NDVI and SNDVI. Note: * indicates the correlation reached significant level (p > 0.05).
Agronomy 14 01783 g013
Table 1. The accuracy (R2) by using different functions to fit day/wet edges.
SpaceEdgeFitting FunctionDate
31/03/202415/04/202423/04/202413/05/202424/05/2024
NLST-NDVIDryLinear0.600.210.400.060.69
Logarithmic0.490.130.310.020.41
Exponential0.560.190.370.060.58
Quadratic0.840.680.730.230.89
WetLinear0.870.650.890.880.03
Logarithmic0.910.740.930.950.12
Exponential0.910.820.960.940.05
Quadratic0.910.840.970.960.64
NLST-SNDVIDryLinear0.960.910.970.880.95
Logarithmic0.940.670.820.590.86
Exponential0.990.810.960.770.94
Quadratic0.990.970.970.980.97
WetLinear0.000.690.120.300.44
Logarithmic0.060.400.000.430.20
Exponential0.000.750.150.320.49
Quadratic0.350.880.720.590.64
Disclaimer/Publisher’s Note: The statements, opinions and data contained in all publications are solely those of the individual author(s) and contributor(s) and not of MDPI and/or the editor(s). MDPI and/or the editor(s) disclaim responsibility for any injury to people or property resulting from any ideas, methods, instructions or products referred to in the content.

