Article

Fungicide Protection as an Agrotechnical Treatment Reducing Nitrogen Gap in Winter Wheat—A Case Study

by
Agnieszka Andrzejewska
1,*,
Witold Szczepaniak
1 and
Tomasz Szymański
2
1
Department of Agricultural Chemistry and Environmental Biogeochemistry, Poznan University of Life Science, Wojska Polskiego 28, 60-637 Poznan, Poland
2
Saaten-Union Polska, sp. z o.o., Straszewska 70, 62-100 Wągrowiec, Poland
*
Author to whom correspondence should be addressed.
Agronomy 2024, 14(8), 1785; https://doi.org/10.3390/agronomy14081785
Submission received: 8 July 2024 / Revised: 1 August 2024 / Accepted: 12 August 2024 / Published: 14 August 2024
(This article belongs to the Special Issue Nitrogen Cycle in Farming Systems—2nd Edition)

Abstract

:
Protection of high-yielding winter wheat (WW) with fungicides increases the productivity of nitrogen (N) present in the soil–crop system during the growing season. As a consequence of the action of fungicides, the nitrogen gap (NG) reduces. This hypothesis was verified on the basis of data from a field experiment conducted with WW during three growing seasons (2013/2014; 2014/2015, 2015/2016) in Poland. The field experiment included two crop protection systems (CP): (i) CP-0—without fungicides and CP-F—with fungicides and (ii) six N doses increased gradually by 40 kg N ha−1 from 0 to 240 kg N ha−1. The grain yield (GY) of WW treated with fungicides was significantly higher than that of the unprotected. The difference in yields between both CP systems was 17.3% on a plot fertilized with 200 kg N ha−1 (9.13 vs. 11.2 t ha−1). The fungicide yield gap increased progressively with Nf doses from 0.76 t ha−1 in the Nf control plot to 2.17 t ha−1 in the fertilized with 200 kg ha−1. The use of fungicides increased the amount of N in grain (Ngr) from 15 kg N ha−1 in the control N plot to 51 kg N ha−1 in the plot with 200 kg N ha−1. The main source of additional N in grain (Ngr) was inorganic N released from the soil (Ng89) during the WW growing season. The maximum Ng89 values were 64.4 and 83.0 kg N ha−1. These values corresponded to Nf doses of 94.4 and 80.8 kg N ha−1. The Ng89 of 70.1 kg N ha−1 conditioned 100-percentage Nf recovery. As a consequence, the prediction reliability of GY and Ngr was highest when Ng89 was used as a predictor. The net increase in the absolute NG size in response to increasing N input was significantly slower and therefore smaller in fungicide-protected than in unprotected WW. It can be concluded that the use of fungicides due to the increase in inorganic N productivity in the soil–crop system reduces the potential threat of N dispersion into the environment. In the light of the results obtained, it should be concluded that the fungicidal protection of crop plants should be treated as a factor significantly reducing the nitrogen gap and, thus, the yield gap.

1. Introduction

Wheat is the most important crop, regardless of the world region, due to its use in bread production. The usefulness of wheat flour results from the specific properties of the protein, which contains glutenin and gliadin in equal proportions [1]. The quality of wheat flour depends not only on the genetic background, which determines the content of both proteins, but also from the content of total protein in the grain. High-quality wheat grain should contain at least and even more than 12.5% crude protein [2,3]. The protein content depends on the plant’s supply of nitrogen (N), more precisely on the applied dose of fertilizer N (Nf) [4]. The key primary yield-forming function of Nf is to build up the basic yield component, which is the number of grains per unit area (canopy grain density, CGD) [5]. An increase in CGD generally leads to a decrease in grain N content. This condition results from a higher CGD value or due to a larger grain weight (thousand grain weight, TGW). This phenomenon is known as “the N dilution effect”. For this reason, in agricultural practice, Nf rates are generally higher than for the real grain yield of winter wheat [3,4].
The grain yield of cereals depends on the mineral N (Nmin) resources present in the soil–crop system (i) at the beginning of the growing season, (ii) applied as fertilizer (Nf) and (iii) released from the soil resources during the growing season [6,7]. The first N pool is determined at the beginning of the growing season or, as in the case of winter crops, at the beginning of the spring part of the season. The Nmin method for identifying inorganic N resources has been known for over 50 years. However, its use is not common, even in leading wheat producers [8]. The advantage of the Nmin method is also the ability to determine the content of other nutrients and assess their resources [9,10]. The second N pool, that is, Nf, is the only one that is directly designated by the farmer. In WW production, the key problem is not only determining the optimal Nf dose, but also its division during the growing season. This distribution must be coordinated with the plant’s N demand. In fact, the key goal of in-season Nf partitioning is to control the rate of yield component development. In WW, this process extends from the beginning of shooting to the beginning of the grain growth (BBCH 70/71) [11,12]. During this period, the CGD reaches stability and largely determines the grain yield but not the content of crude protein. The second key characteristic of wheat depends on the supply of N to plants in the period from the stage of the grain growth to its physiological maturity [13]. The third pool of Nmin is the amount of inorganic N released from soil and its resources during the growing season of a given crop. This is a classic “black box” known as the in-season N gain (Ng) [7,14]. So far, attempts to determine the amount of Nmin released during the growing season of crop plants have not yielded a solution that could be widely used in agricultural practice [6]. Moreover, it is unclear to what extent the in-season-released inorganic N affects the components of the yield structure. There is also a question whether it is possible to indirectly calculate this N pool in the soil. The solution in this regard is the balance method proposed by Grzebisz et al. [7].
The increase in crop plants yields over the last 70 years is largely due to advances in plant breeding. However, without a sufficiently high dose of Nf and full crop protection, the yield potential of new varieties will not be efficiently exploited [5,15]. It is well documented that plants intensively fertilized with Nf are very sensitive to pathogen attack. This applies especially to those pathogens that are equipped with a biotrophic mechanism of obtaining nutrients from the living host plant [16]. A specific characteristic of this group of fungal pathogens is the infection of physiologically active plant organs, mainly leaves and glumes of ripening cereals. These fungi redirect the flow of nutrients from the plant to the growing pathogen but at the same time keep the host plant alive. Leaf diseases significantly reduce the assimilation area of wheat, which consequently weakens the potential of the canopy to absorb solar energy and use inorganic N present in the soil. Consequently, infection of wheat by diseases in the pre-flowering period of its growth reduces the production potential of the ear or, more precisely, the number of fertile flowers [17,18]. It is generally accepted that fungicide protection is effective only at high Nf doses. Only under fertilization conditions does the applied fungicide reduce the pathogen’s pressure on photosynthetically active plant parts, for example, on wheat leaves and glumes [19].
In the light of the complexity of the crop plants’ response to the interaction of Nmin resources in the soil and fungicide protection discussed above, it is justified to ask the question about the impact of both production factors on the N economy in the soil–winter-wheat system. Therefore, it should be hypothesized that insufficient development of the key yield component, i.e., CGD, leads to ineffective use of Nmin in the soil during the growing season by WW, This condition, in turn, results in the formation of a N gap (NG). In agronomic practice, this phenomenon is recognized in its final form and known as the yield gap (YG) [20]. Therefore, the question arises about how to treat fungicidal protection of WW. Is this just an agronomic measure controlling the degree of yield reduction, or is it a growth factor that determines the efficiency of inorganic N resources present in the soil during the WW growing season? The impact of fungicide protection on the yield-forming physiology of crop plants, as a process dependent on the supply of inorganic N, has not been recognized yet. This is a typical “black box”. This study aims to evaluate the impact of fungicide protection on the nitrogen economy of winter wheat. Specifically, it examines whether fungicide application can reduce the N gap by improving N uptake and grain yield. We hypothesize that WW fungicide treatment will enhance N use efficiency and increase both grain yield and grain N content.

2. Materials and Methods

2.1. Experimental Setup

This study on the impact of fungicide protection on the size of the N gap (NG) in WW was carried out in 2013/14 (acronym: first growing season, 1st), 2014/2015 (second growing season, 2nd) and 2015/2016 (third growing season, 3rd) in Smolice (52°42′ N; 17°10′ E), Poland. The field experiment was carried out on soil formed from loamy sand, classified as Albic Luvisol. The content of organic carbon (Corg) and pH were variable but at the appropriate level for WW. The content of available P, K, Fe and Zn was within the required range, at least in the medium class, while the content of Mg, Ca, Cu and Mn was insufficient for WW (low or very low classes). The amount of mineral N (Nmin), measured just before the beginning of WW regrowth in spring, was variable but generally high (Table 1).
The climate in Western Poland is classified as transitional between Atlantic and Continental. The latter one dominates in summer (Figure 1). The early growing phase of WW in March and April 2014 was very good, but May was wet. The second part of the season was less favorable, as June was very dry, and July was dry. The 2015 growing season was favorable for WW growth despite drought throughout the entire growing season. A deficiency in rainfall covered the period from the stem elongation to early flowering. The beginning of the 2016 growing season was too wet, while May was semi-dry, and June was dry.

2.2. Experimental Design

The field experiment, arranged in a two-factor design, replicated four times, included the following:
1.
Two systems of WW protection with fungicides (CP):
(1)
without the use of fungicides—CP-0;
(2)
using the fungicides—CP-F.
2.
N control plus six doses of applied N fertilizer: 0, 40, 80, 120, 160, 200, 240 kg ha−1.
N was applied in three stages of wheat growth: (i) at the beginning of plant regrowth (40 and 80 kg N ha−1), (ii) the end of tillering/beginning of shoot elongation (BBCH 29/30); supplementation of respective N combinations to 120 and 160 kg N ha−1, (iii) in the phase of flag leaf visible (BBCH 39; supplementation of respective N combinations to 200 and 240 kg N ha−1. Phosphorus was applied at the dose of 17.2 kg P ha−1 in the form of triple superphosphate (46% P2O5). Potassium was applied at the dose of 100 kg K ha−1 as Korn-Kali (K-MgO-Na2O-SO3 → 40-6-3-12.5). Both fertilizers were applied two weeks before WW sowing. The foliar application of fungicides was carried out in accordance with best agronomic practice.
The WW cv. Wydma was sown annually in the fourth week of September at a dose of 300 grains m−2. The forecrop was winter oilseed rape. The total area of a single plot was 22.5 m2 (1.5 × 15 m). The next year’s crop was harvested at the end of July from an area of 19.5 m−2.

2.3. Soil and Plant Sampling

Soil samples were taken from two layers: 0.0–0.3 m and 0.3–0.6 m. To determine the basic soil properties, they were collected after the winter oilseed rape harvest. Soil samples for mineral N (Nmin) determination were collected: (i) one week before the beginning winter wheat regrowth in spring, (ii) at the physiological maturity of WW (BBCH 89). The mineral forms of inorganic N (NH4+-N and NO3-N) were determined in “fresh” soil samples within 24 h after sampling. Twenty grams of soil were shaken for 1 h with 100 cm3 of 0.01 M CaCl2 solution (soil/solution ratio 5:1; m/v). Concentrations of NH4+-N and NO3-N were determined by colorimetric method using flow injection analyses (FIAstar5000, FOSS Tecator AB, Höganäs, Sweden). Total Nmin content was expressed in kg ha−1.
Plant material for determining dry matter and then N content was collected at WW harvest. The N content was determined in grain and straw using the standard macro-Kjeldahl procedure [24]. N content was expressed on a dry matter basis and used to calculate the amount of N in total WW biomass.

2.4. Calculated Parameters

Two sets of indicators were used to describe the N economy of WW during the growing season.

2.4.1. Nitrogen Gap Indicators

To assess the actual productivity of inorganic N present/introduced into the soil–winter-wheat system, the N gap (NG) concept was used [7,14,20]. The main components of this methodological approach for yield gap calculation are the amount of inorganic N (mineral N, Nmin) and the amount of fertilizer N (Nf) applied to winter wheat during the growing season.
The third component of the total Nmin input to the studied soil/crop system was the amount of Nmin released during the growing season, defined as N gain (Ng). The procedure for NG calculation consists of the following steps:
Partial   Factor   Productivity   of   N in   or   N int :   P F P N f = Y N i n ;   N i n t   kg   kg 1   f o r   N i n   o r   N i n t
Yield   Gap   for   N in   and   N int :   Y G = Y a Y a t t m a x   t   ha 1
Nitrogen   Gap   or   N in   and   N int :     N G = Y G c P F P N i n ; N i n t kg   N   ha 1
where
Nf—is the amount of applied fertilizer N, kg N ha−1;
Nmin—is the amount of mineral N at the beginning of winter wheat regrowth in spring, kg N ha−1;
Nin—is the sum of Nmin + Nf, kg N ha−1;
Ngain—is the amount of mineral N released from the soil during the growing season, kg N ha−1;
Nint—is the sum of Nmin + Nf + Ng, kg N ha−1;
PFP-Nin—is the partial factor productivity of Nin (kg grain per kg Nin);
PFP-Nint—is the partial factor productivity of Nint (kg grain per kg Nint);
YG—is the yield gap calculated separately for Nin and Nint (t ha−1);
NG—is the N gap calculated separately for Nin and Nint (kg ha−1).

2.4.2. Nitrogen Gain Indicators

A set of N balance indices was calculated based on the amount of N in WW and the total content of Nmin at the beginning of the crop regrowth (spring) and at crop maturity (BBCH 89) [7]:
N   input :   N i n = N m i n + N f ,   kg   N   ha 1
N   balance :   N b = N i n N A ,   kg   N   ha 1
N   gain :   N g = N m i n r N b ,   kg   N   ha 1  
N   input   total :   N i n t = N i n + N g ,   kg   N   ha 1
where
Nmin—the content of Nmin at the beginning winter wheat regrowth (spring), kg N ha−1;
NA—the amount of N accumulated in winter wheat biomass at harvest, kg N ha−1;
Nminr—the content of Nmin at winter wheat harvest, kg N ha−1;

2.5. Statistical Analysis

The effects of the individual experimental factor (year, N rates and crop protection level) on N resources and indicators of N productivity were assessed by means of a three-way ANOVA, including years as a factor. Means were separated by honest significant difference (HSD) using Tukey’s method when the F-test indicated significant factorial effects at the level of p < 0.05. Trends in the responses of studied characteristics were determined using a linear and quadratic regression model. The relationships between the traits were analyzed using Pearson correlation and linear regression. STATISTICA 12 software was used for all statistical analyses (StatSoft Inc., Tulsa, OK, USA, 2013). In the second step of the diagnostic procedure, stepwise regression was applied to define an optimal set of characteristics affecting grain yield. In the computational procedure, a consecutive variable was removed from the multiple linear regressions in a step-by-step manner.

3. Results

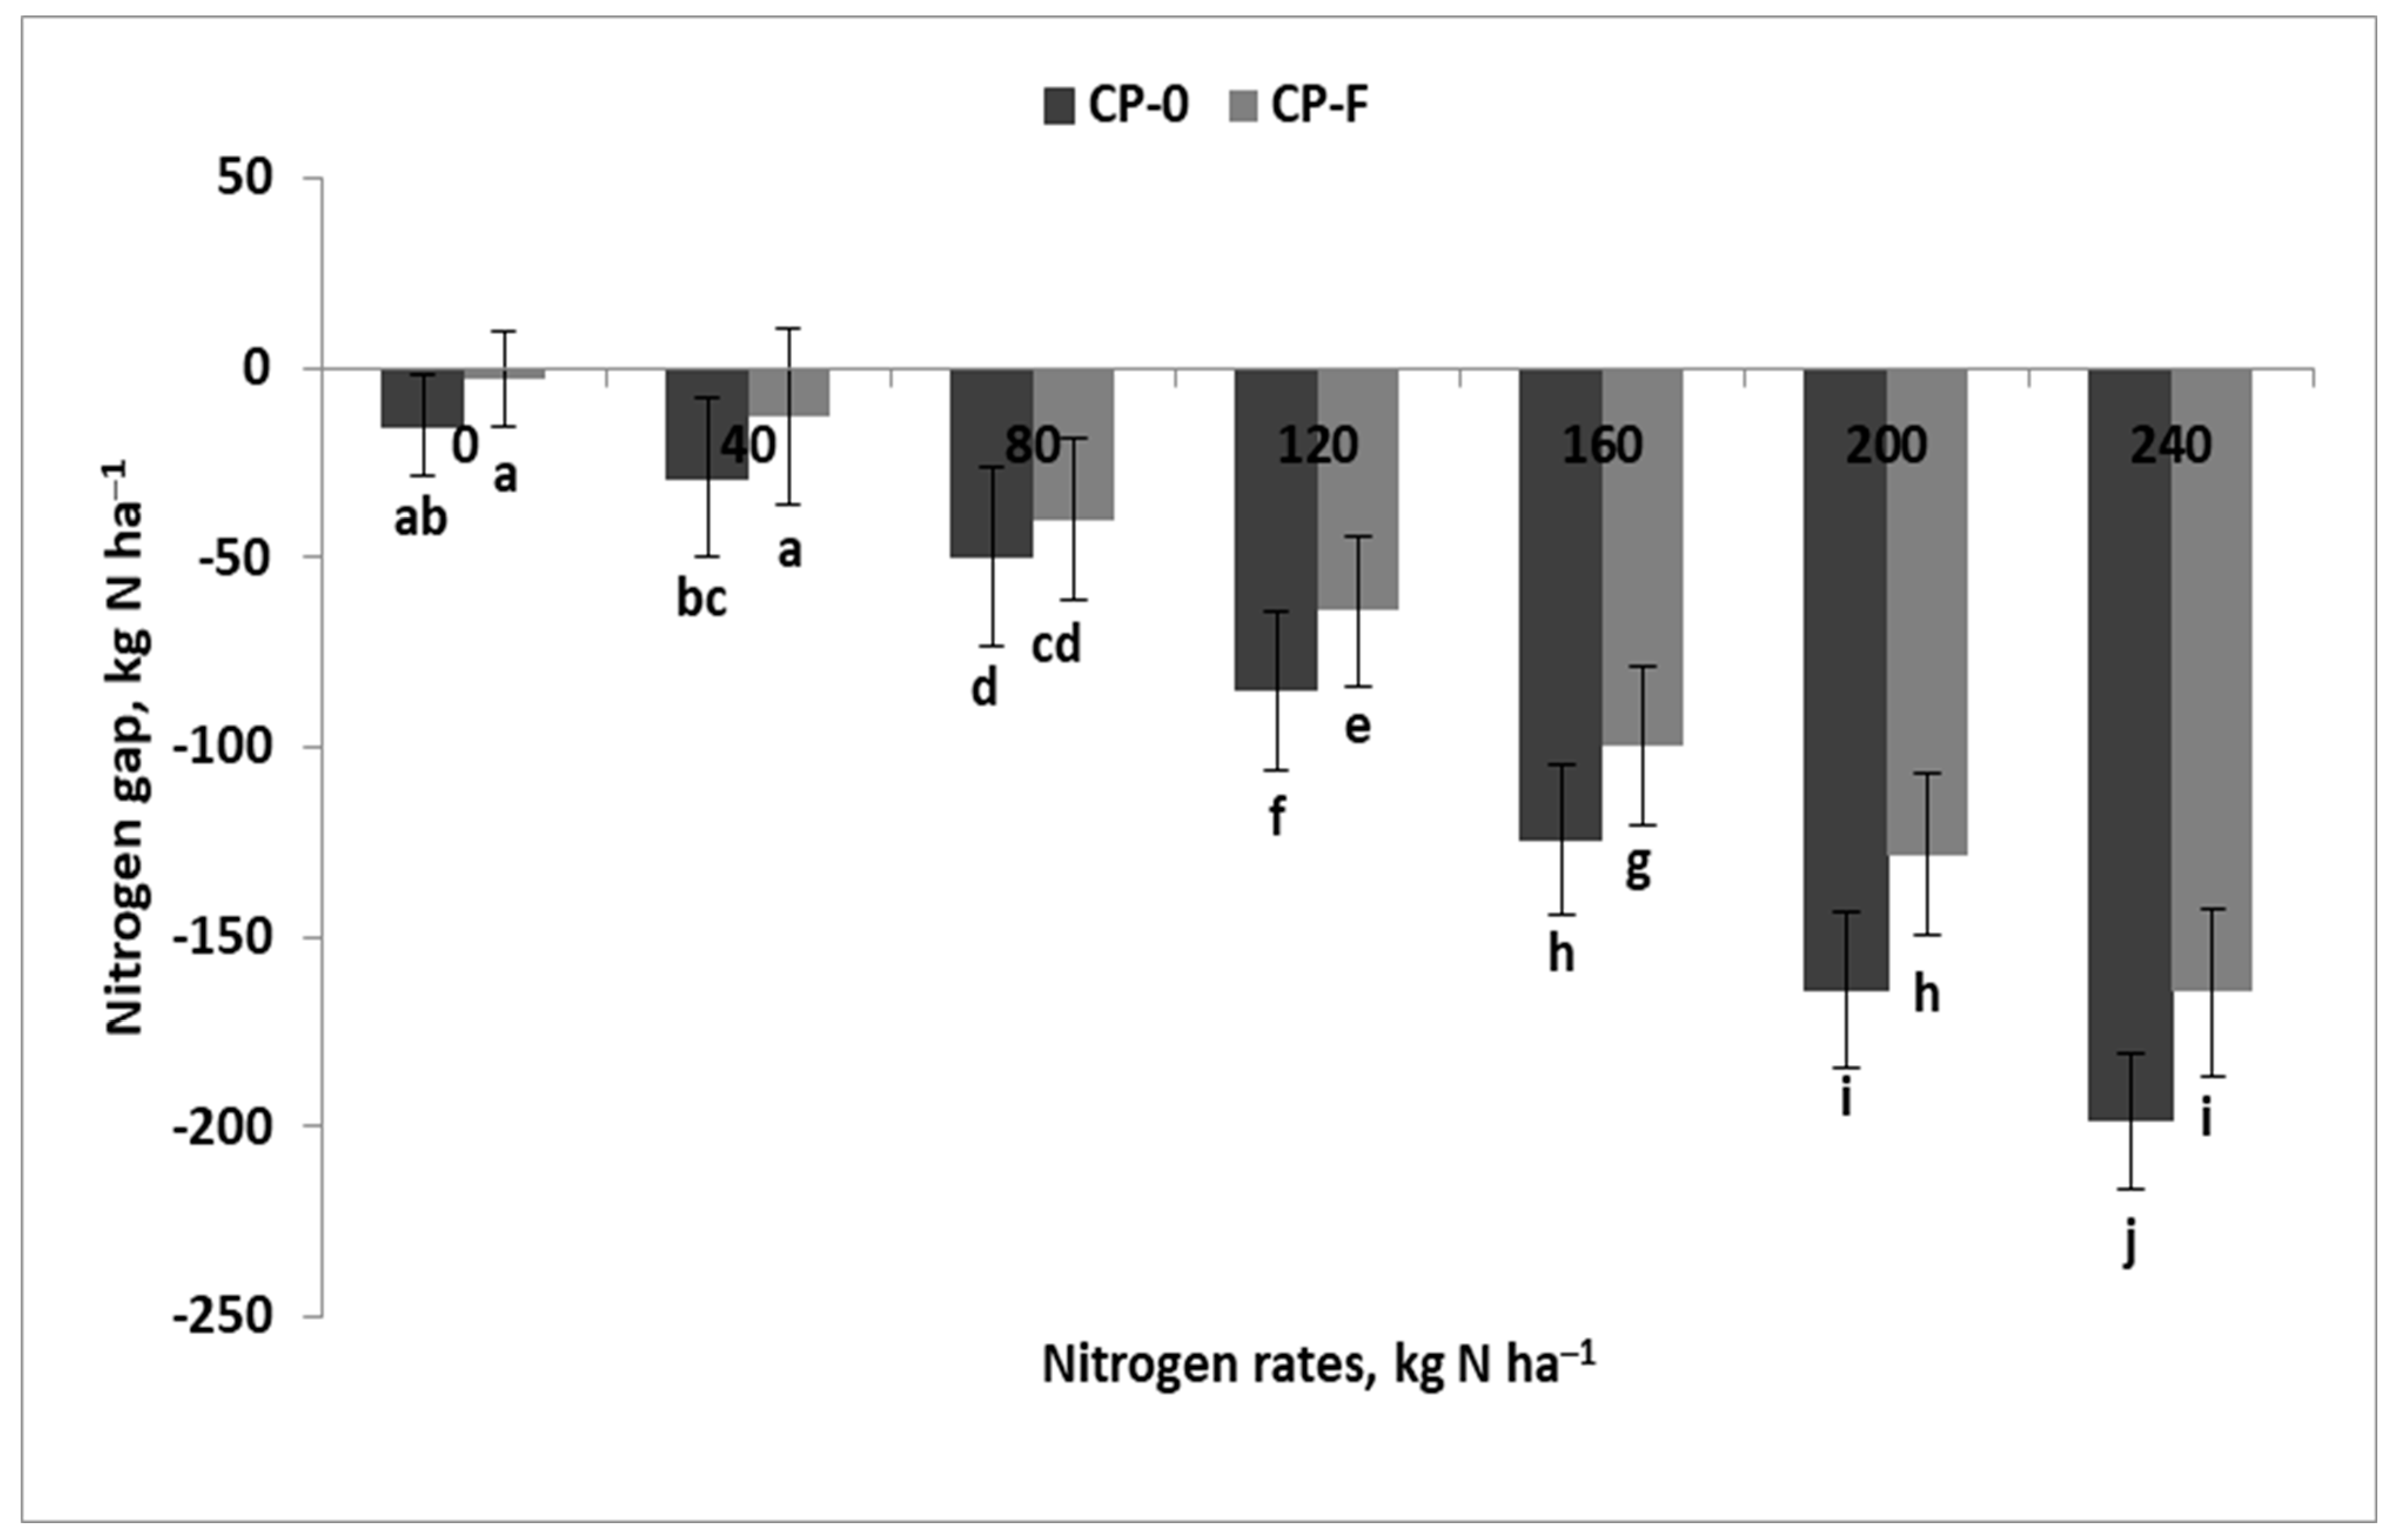
3.1. Nitrogen Gap—First

The grain yield (GY) of winter wheat was significantly affected by the interaction of the CP × N (crop protection, CP) and N dose (Nf) (Table 2, Figure A1). The impact of this interaction on GY was independent on weather in the subsequent years of the study. Only seemingly, the GY course in response to increasing Nf doses best fit the quadratic regression model:
CP - 0 :   G Y = 0.0009 N 2 + 0.035 N + 5.0   f o r   n = 7 ,   R 2 = 0.95 ,   p   0.001  
CP - 01 :   G Y = 0.035 N + 5.74     f o r   n = 3 ,   R 2 =   0.99 ,   p   0.001
CP - 02 :   G Y = 0.003 N + 8.3   f o r   n = 4 ,   R 2 =   0.72 ,   p   0.05
CP - F :   G Y = 0.000074 N 2 + 0.036 N + 6.6   f o r   n = 7 ,   R 2 =   0.99 ,   p   0.001
CP - F 1 :   G Y = 0.019 N + 7.2   f o r   n = 3 ,   R 2 =   0.92 ,   p   0.01
The quadratic regression model is described by two characteristics, i.e., grain yield maximum GY (GYmax) and a specific optimal Nf dose (Nfop). The first attribute of both models was 9.19 and 10.99 t ha−1 for CP-0 and CP-F, respectively. These two maxima were obtained provided that Nop reached 185.6 and 245.2 kg N ha−1, respectively. Therefore, the theoretical difference between both CP systems, i.e., fungicide-induced yield gap (YG) based on Nop, was 1.8 t ha−1. In fact, on CP-F, the effect of Nf doses on GY was progressive, increasing linearly with subsequent N doses. Yield stagnation occurred only for the last two Nf doses. Hence, Nfop exceeded the range of Nf applied. Therefore, the linear model is only statistically correct. In the case of CP-0, the GY trend, although statistically correct, is better assessed when two linear models are used. The obtained lines intersected for Nf equal to 91.5 kg N ha−1. The rate of GY increase below this critical Nf value was by 11.3-times faster than above it. An analysis of Figure A1 and the developed equations showed that the fungicide-induced yield gap (F-YG) occurred in the entire range of Nf doses. It increased progressively with Nf doses from 0.76 t ha−1 in the Nf control plot to 2.17 t ha−1 in the plot fertilized with 200 kg ha−1.
The Partial Factor Productivity of N input (PFP-Nin) was calculated based on the N amount present in soil (Nmin) at the beginning of the spring wheat regrowth and fertilizer N applied (Nf). Regardless of the growing season, the values of the index were higher by 15.7% for fungicide-protected wheat (Table 2). The PFP-Nin course was slightly more affected by the Y × N than by Y × CP interaction (Figure A2). The downward trend in the index in accordance with increasing Nf doses was fully confirmed. The highest and significant difference between years, amounting to 30 kg grain kg−1, was recorded on the plot fertilized with 40 kg N ha−1. At the same time, three times smaller differences were recorded in plots fertilized with 200 and 240 kg ha−1. In the 1st and 3rd season, the PFP-Nin was consistent with a linear regression model, while in the 2nd season with a cubic regression model:
2013 / 2014 :   P F P N i n = 0.18 N + 70.3     f o r   n = 7 ,   R 2 = 0.97 ,   p   0.01
2014 / 2015 :   P F P N i n = 0.000006 N 2 0.14 N + 53.8   f o r   n = 7 ,   R 2 = 0.98 ,   p   0.01  
2015 / 2016 :   P F P N i n = 0.087 N + 41.6   f o r   n = 7 ,   R 2 = 0.90 ,   p   0.01  
The equation constants for the 1st and 3rd season clearly indicate the difference between these two seasons. In the 2nd season, the downward PFP-Nin trend showed specific stability in relation to the Nf doses. This stability resulted from the maximum, amounting to 56.3 kg grain kg−1 N for Nfop of 37.9 kg N ha−1. The respective minimum of 35.8 kg grain kg−1 N was achieved for Nfop equal to 226.4 kg N ha−1. However, this value was higher than that obtained in other growing seasons.
The average PFP-Nin for the 3rd quartile of the obtained data set was then used to determine the Nitrogen Gap (NG). NG values showed significant dependence on the interaction of years (Y) and experimental factors but were considered separately. The effect of CP × N was highly significant and did not depend on weather variability in consecutive years of the study. This means that the effect of crop protection on NG, despite year-to-year variability, was consistent (Table 2). Overall, NG absolute values increased linearly with increasing Nf doses. The obtained linear regression models are as follows:
CP - 0 :   N G = 0.8 N f + 0.75   f o r   n = 7 ,   R 2 = 0.98 ,   p   0.001
CP - F :   N G = 0.7 N f + 9.9   f o r   n = 7 ,   R 2 = 0.98 ,   p   0.001
In fact, lower values of NG, i.e., larger amounts of unproductive inorganic N in the soil–winter-wheat system, were recorded for the CP-0 system (Figure 2). The smallest differences between both fungicide protection systems were documented for plots fertilized with low Nf doses, i.e., from 0 to 80 kg N ha−1. The advantage of CP-F over CP-0 in plots fertilized with 200 and 240 kg N ha−1 reached 35 kg N ha−1. It should be emphasized that both indicators of Nin productivity, i.e., PFP-Nin and NG, did not show a significant relationship with GY (Table A1).

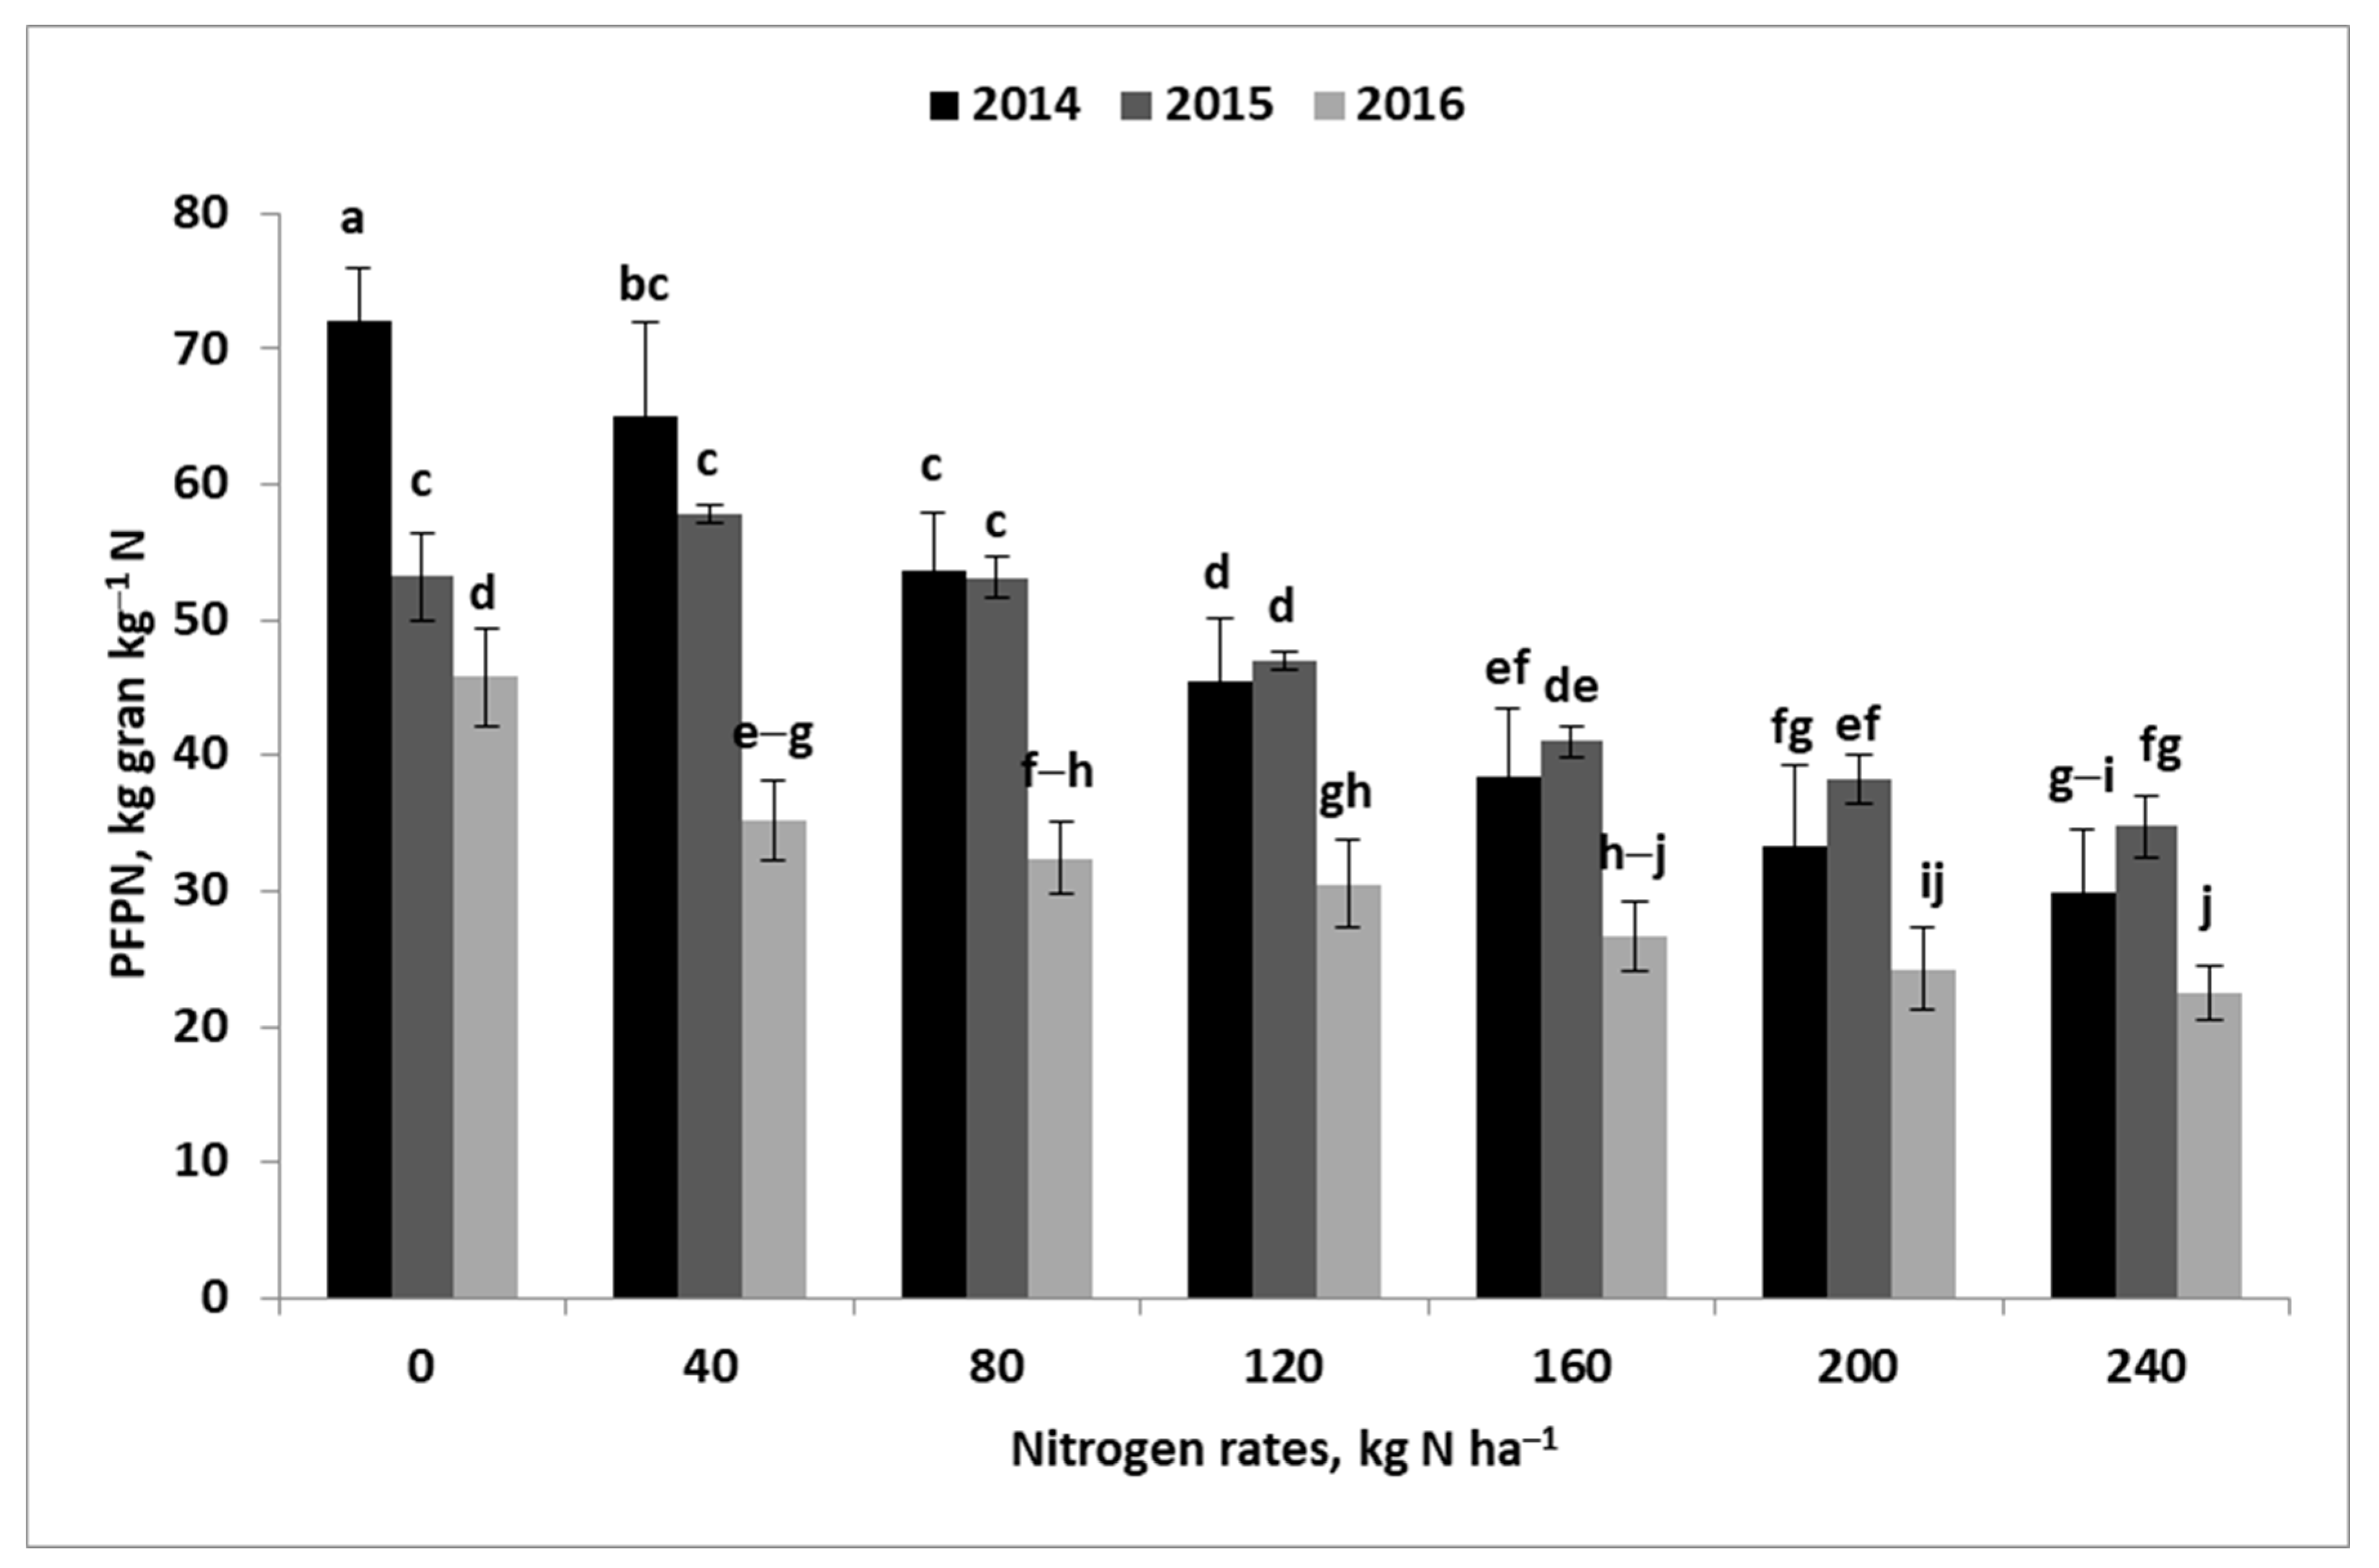
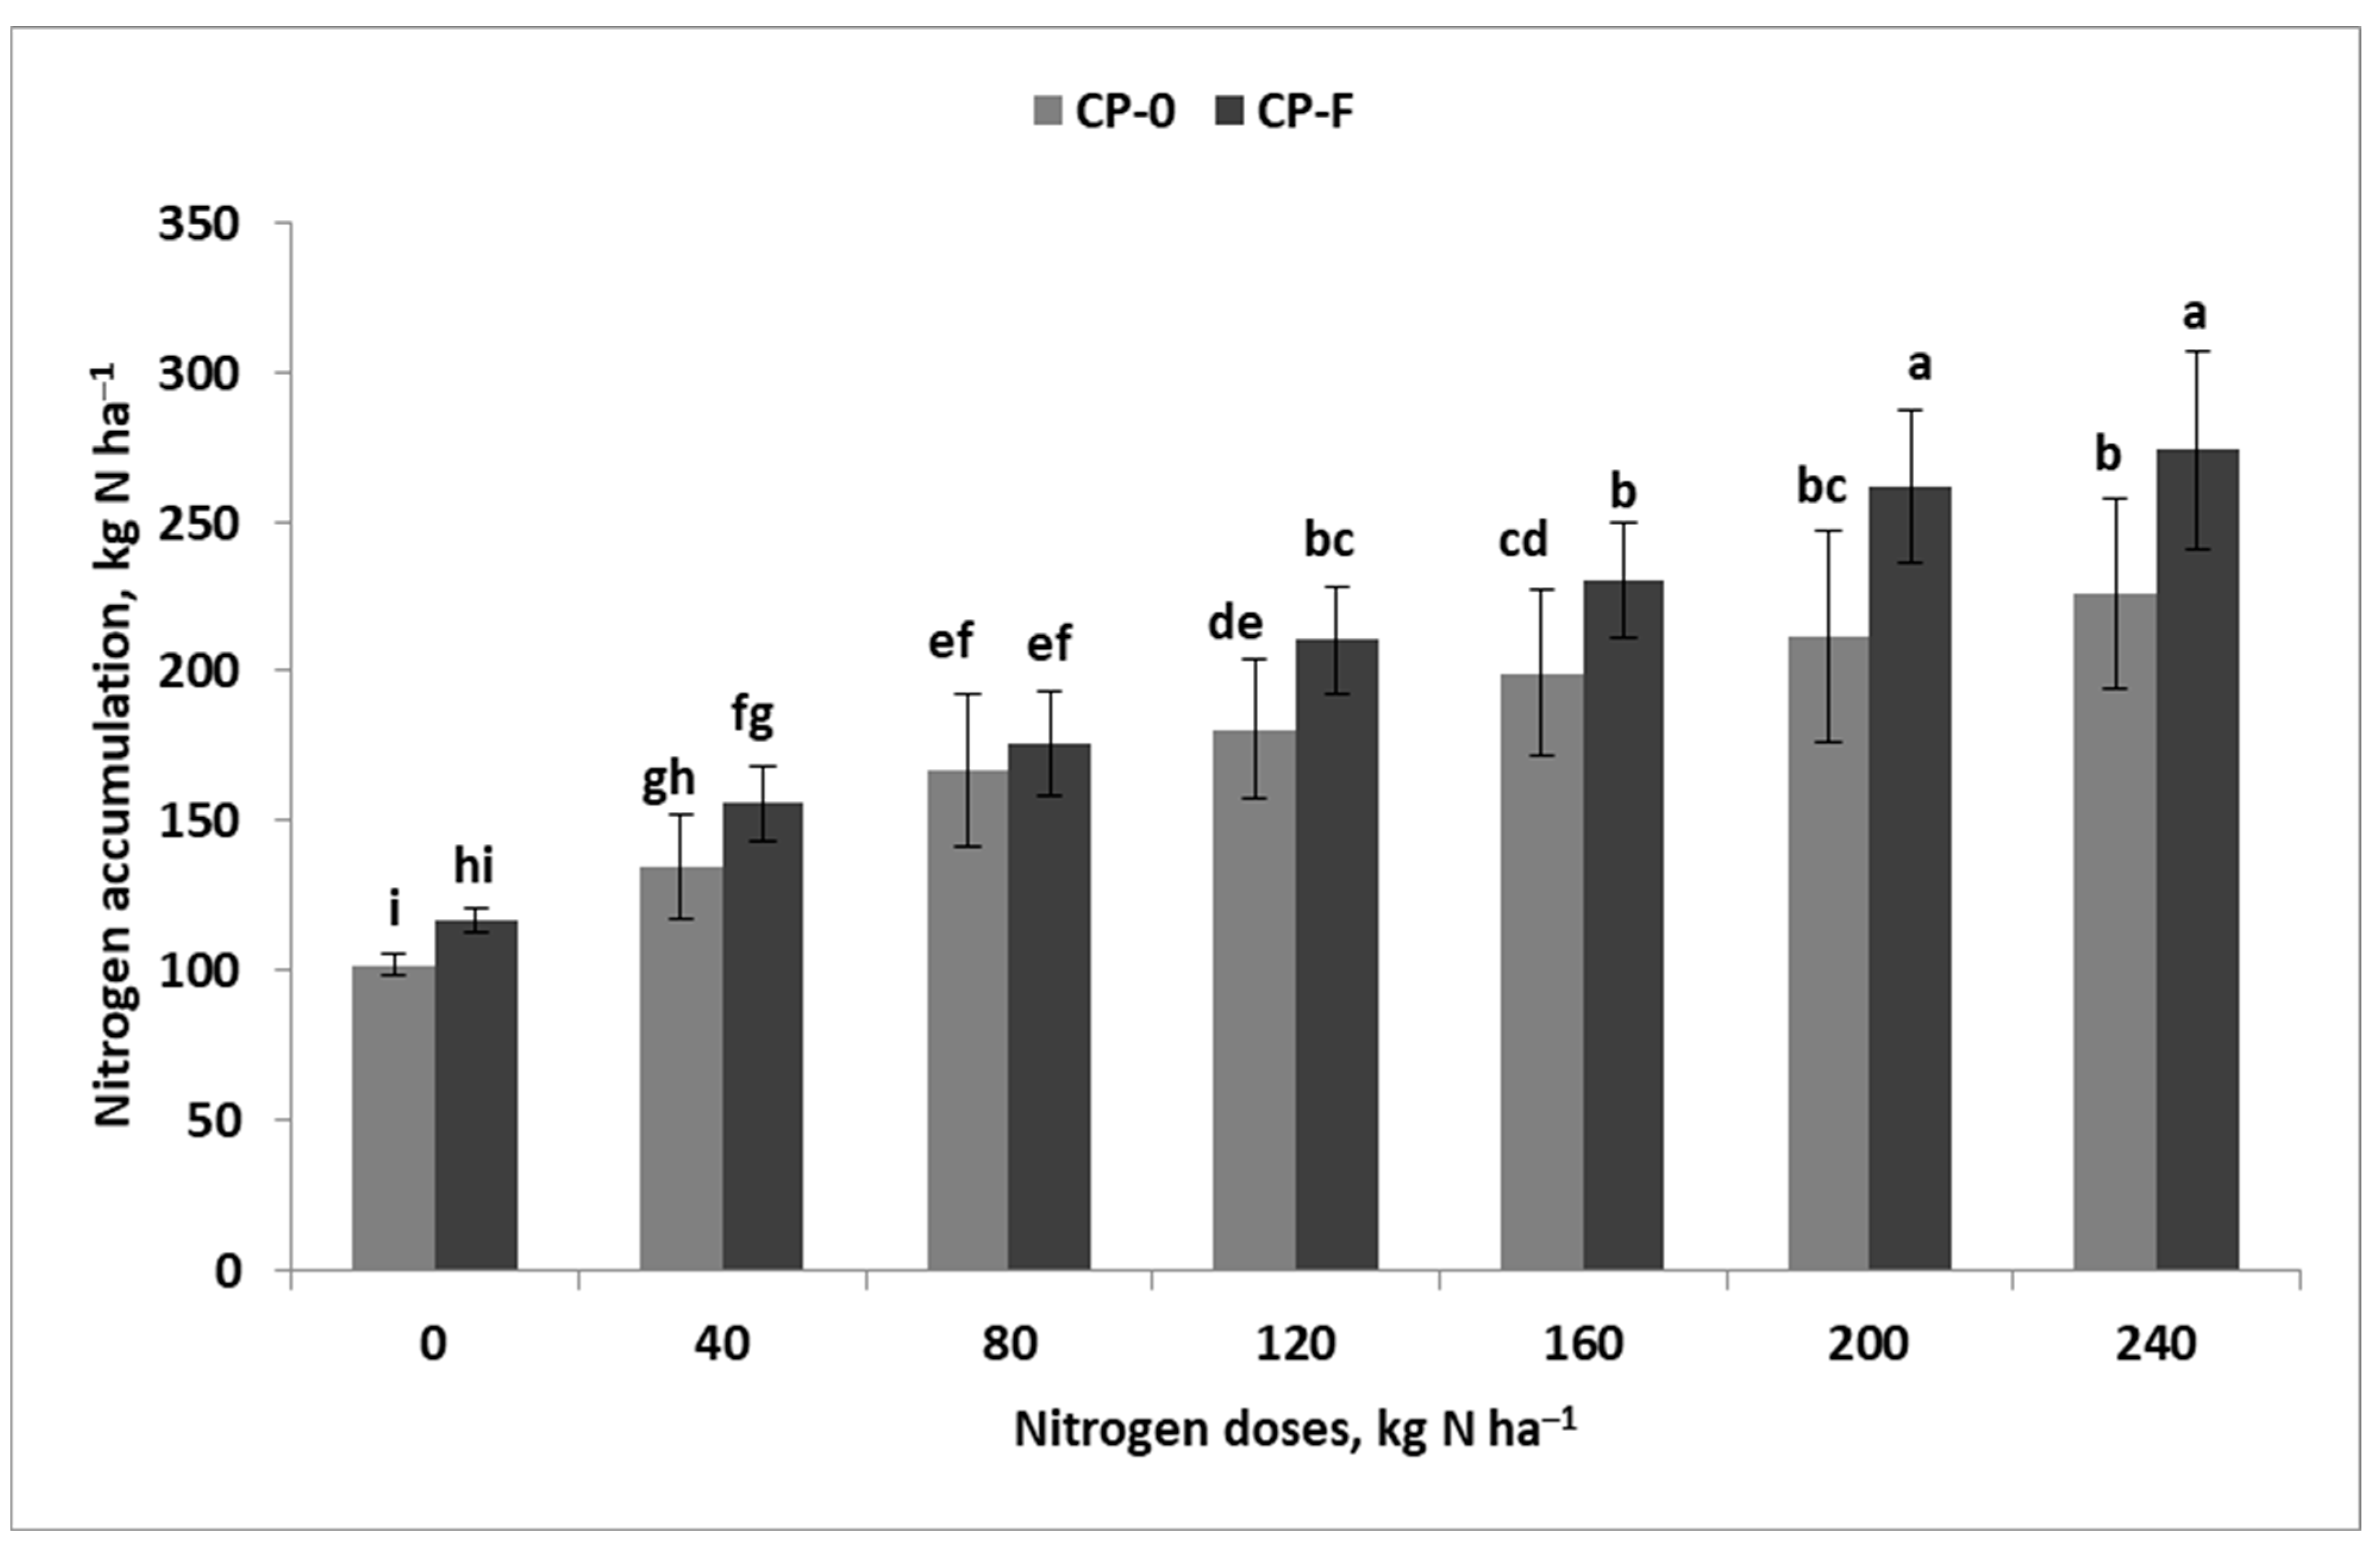
3.2. Nitrogen Pools at Harvest
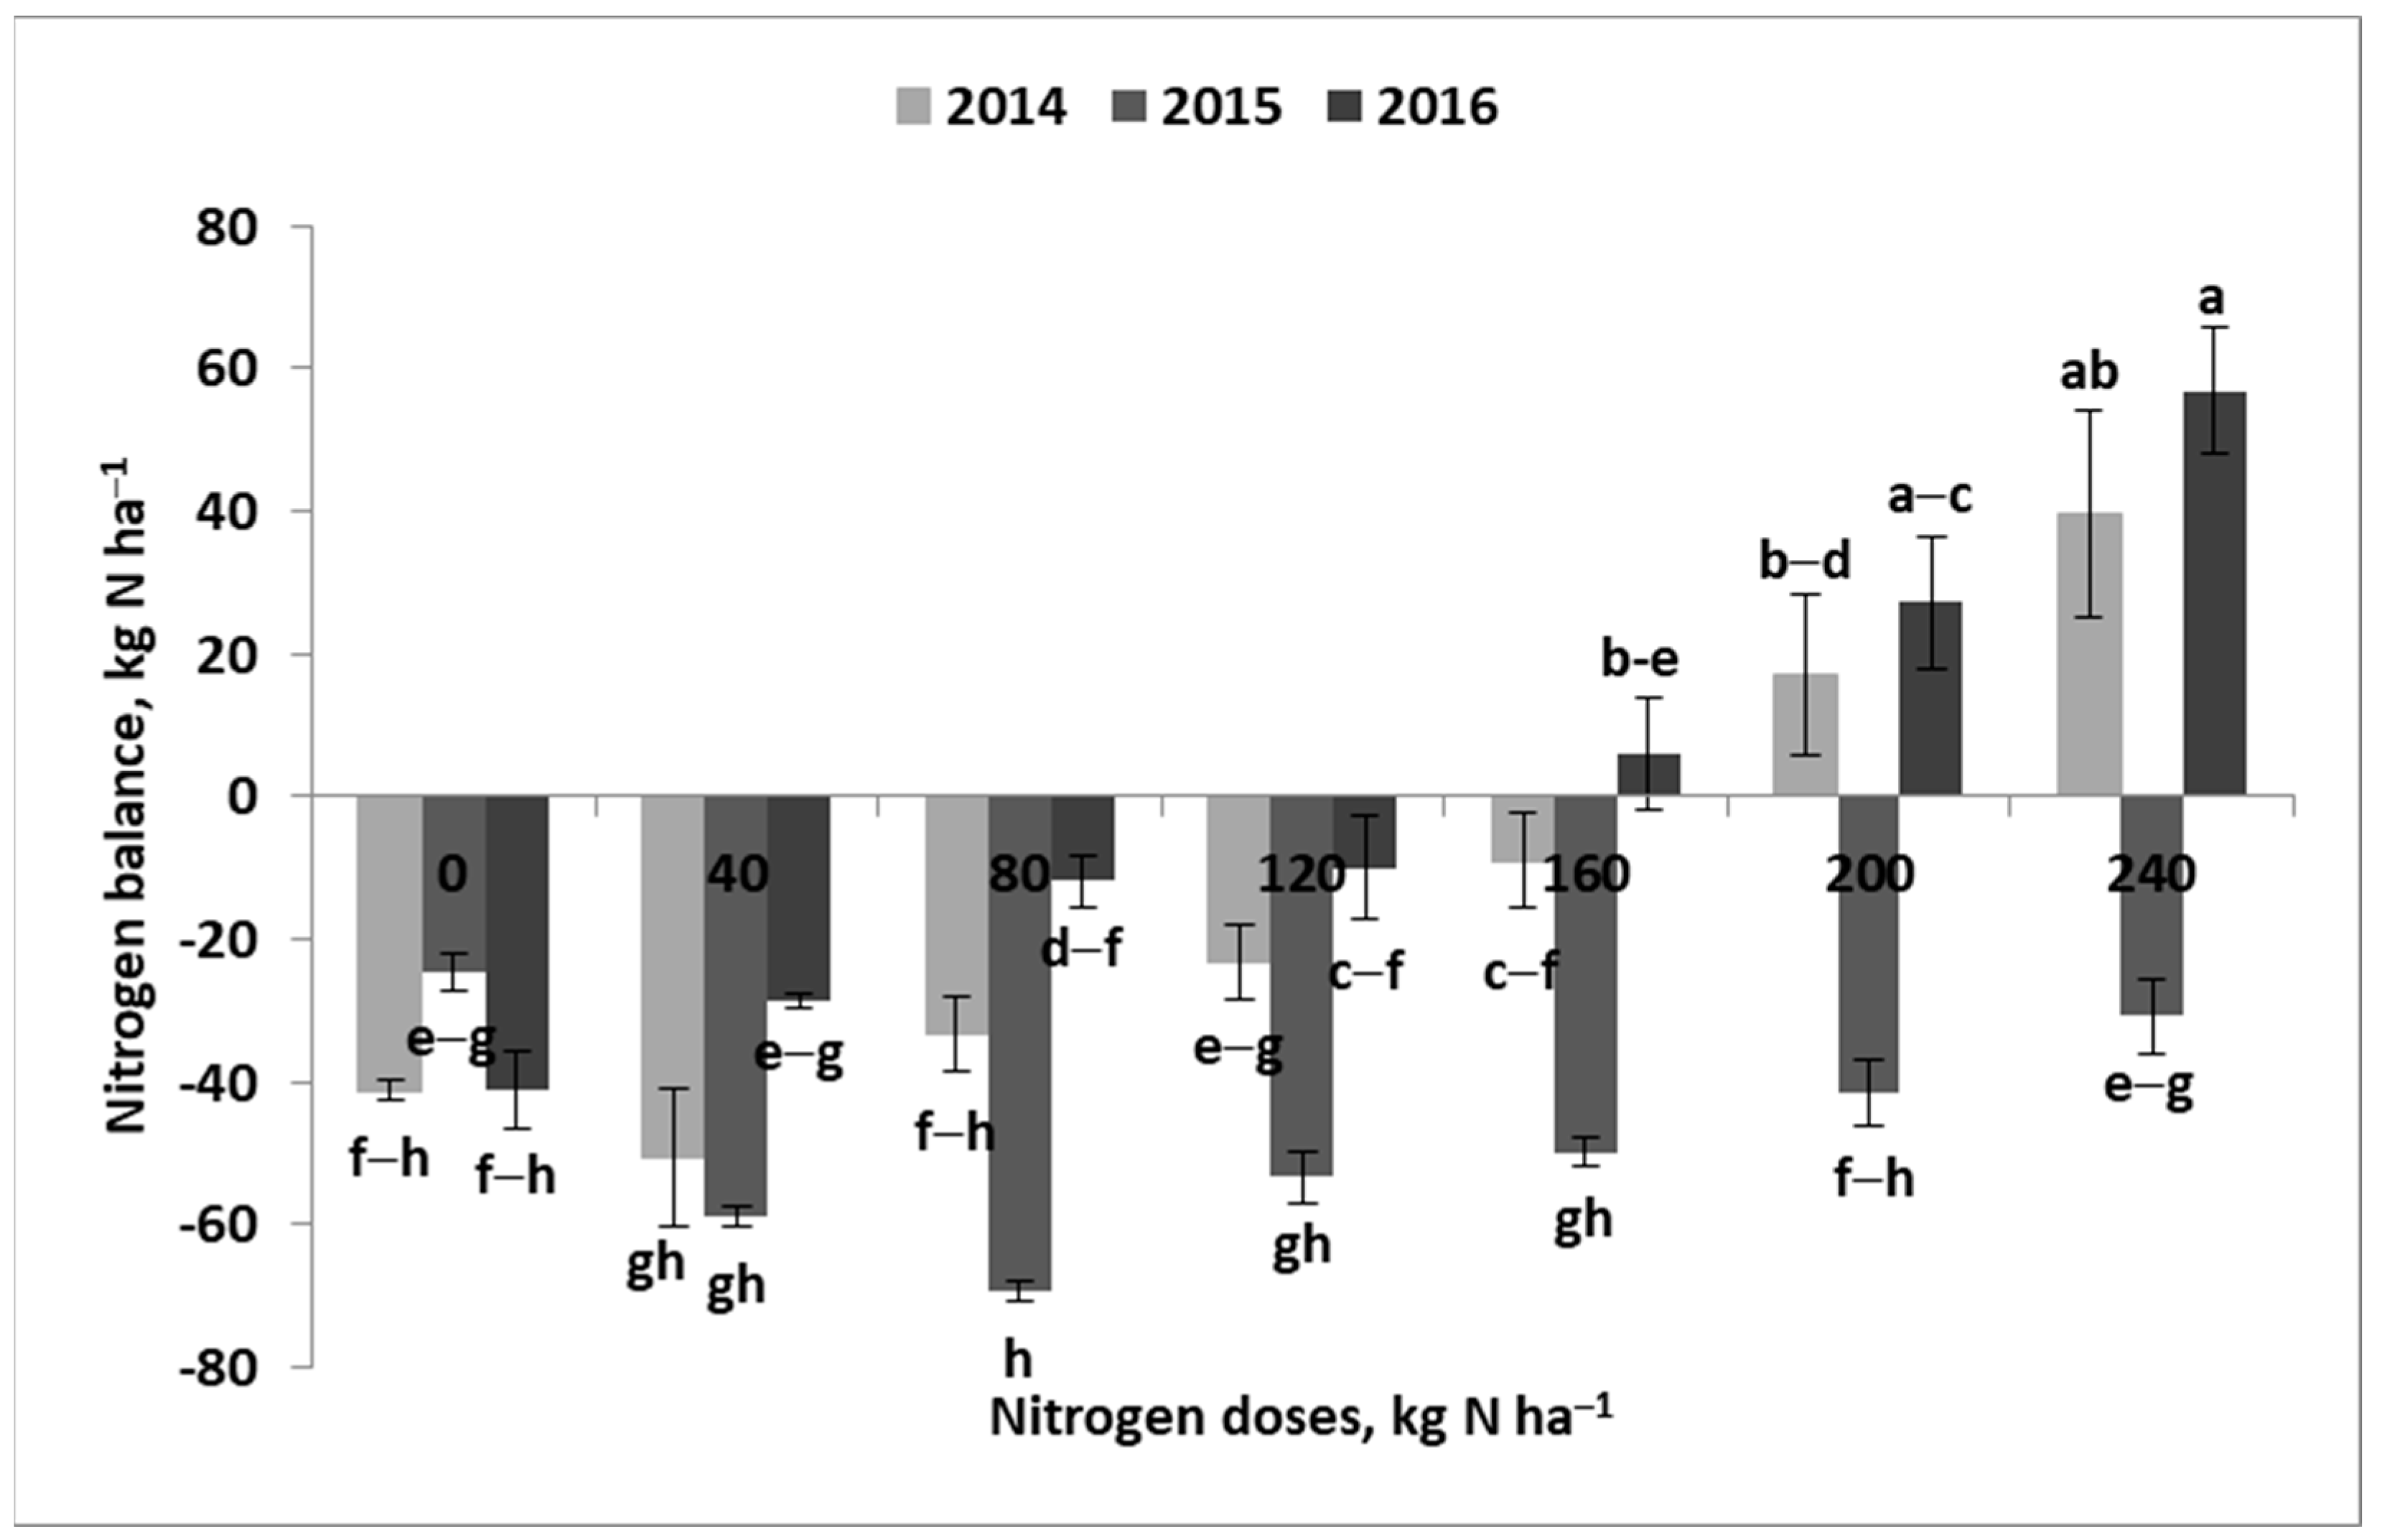
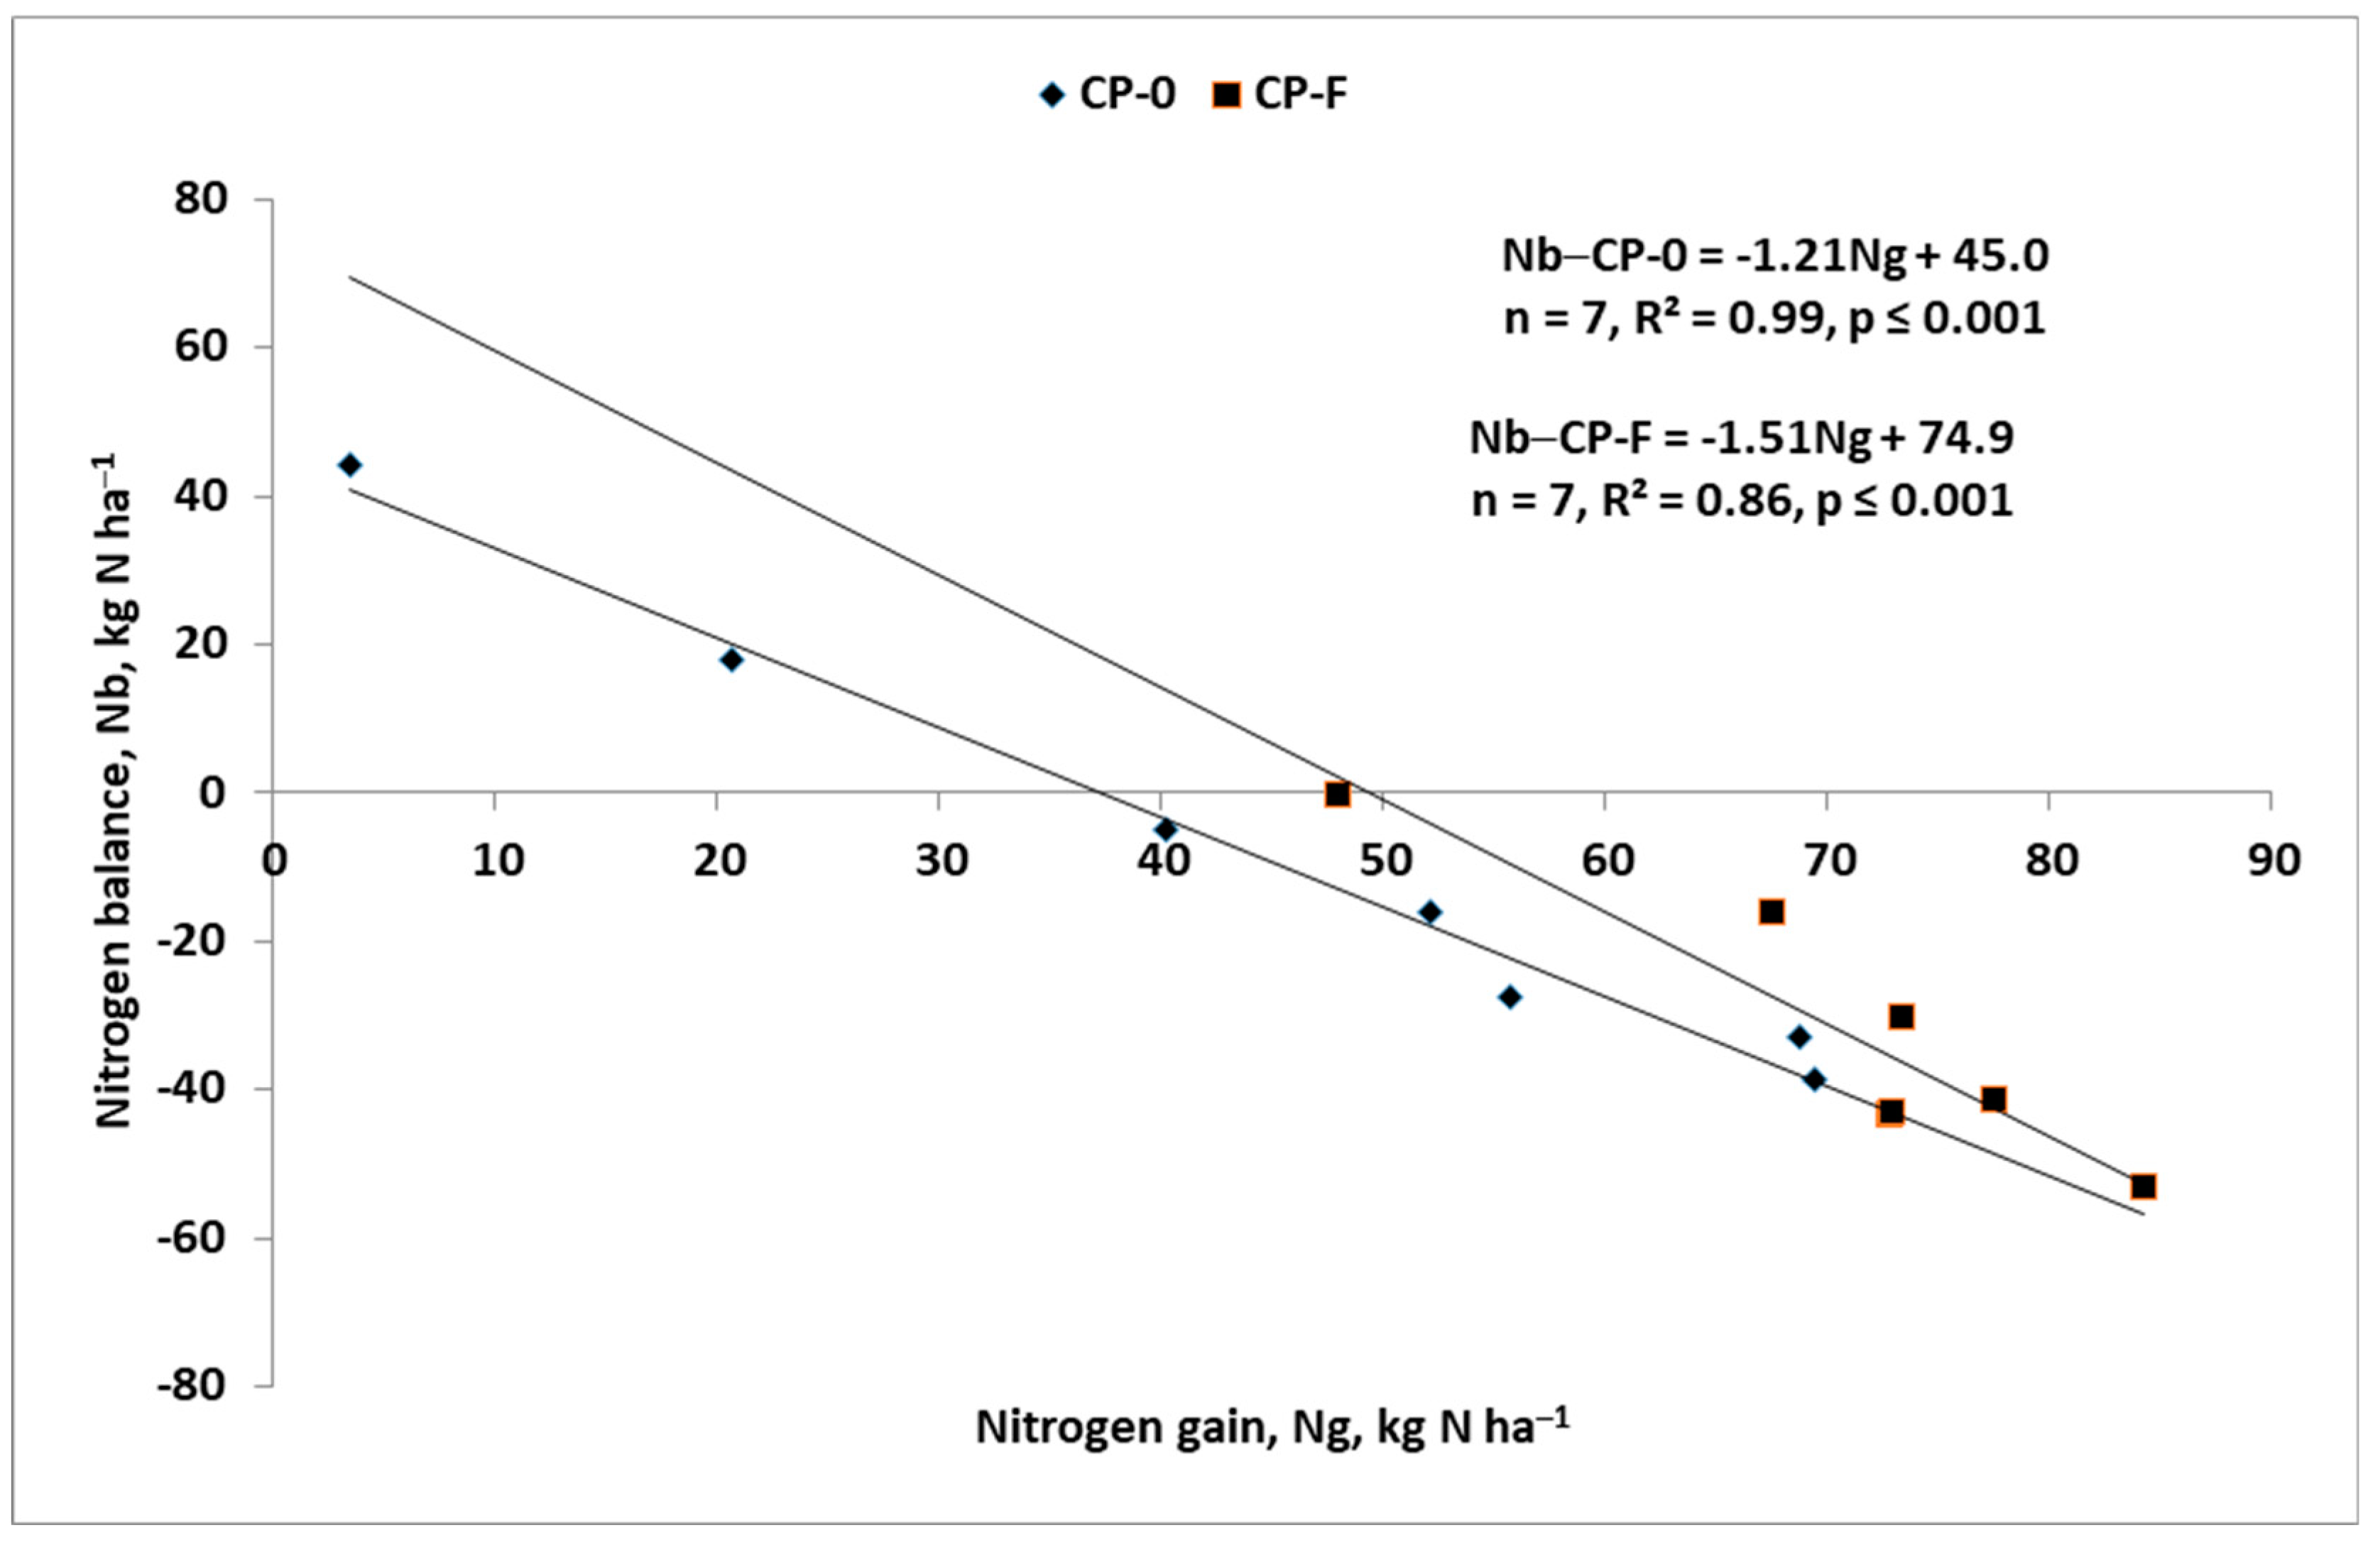
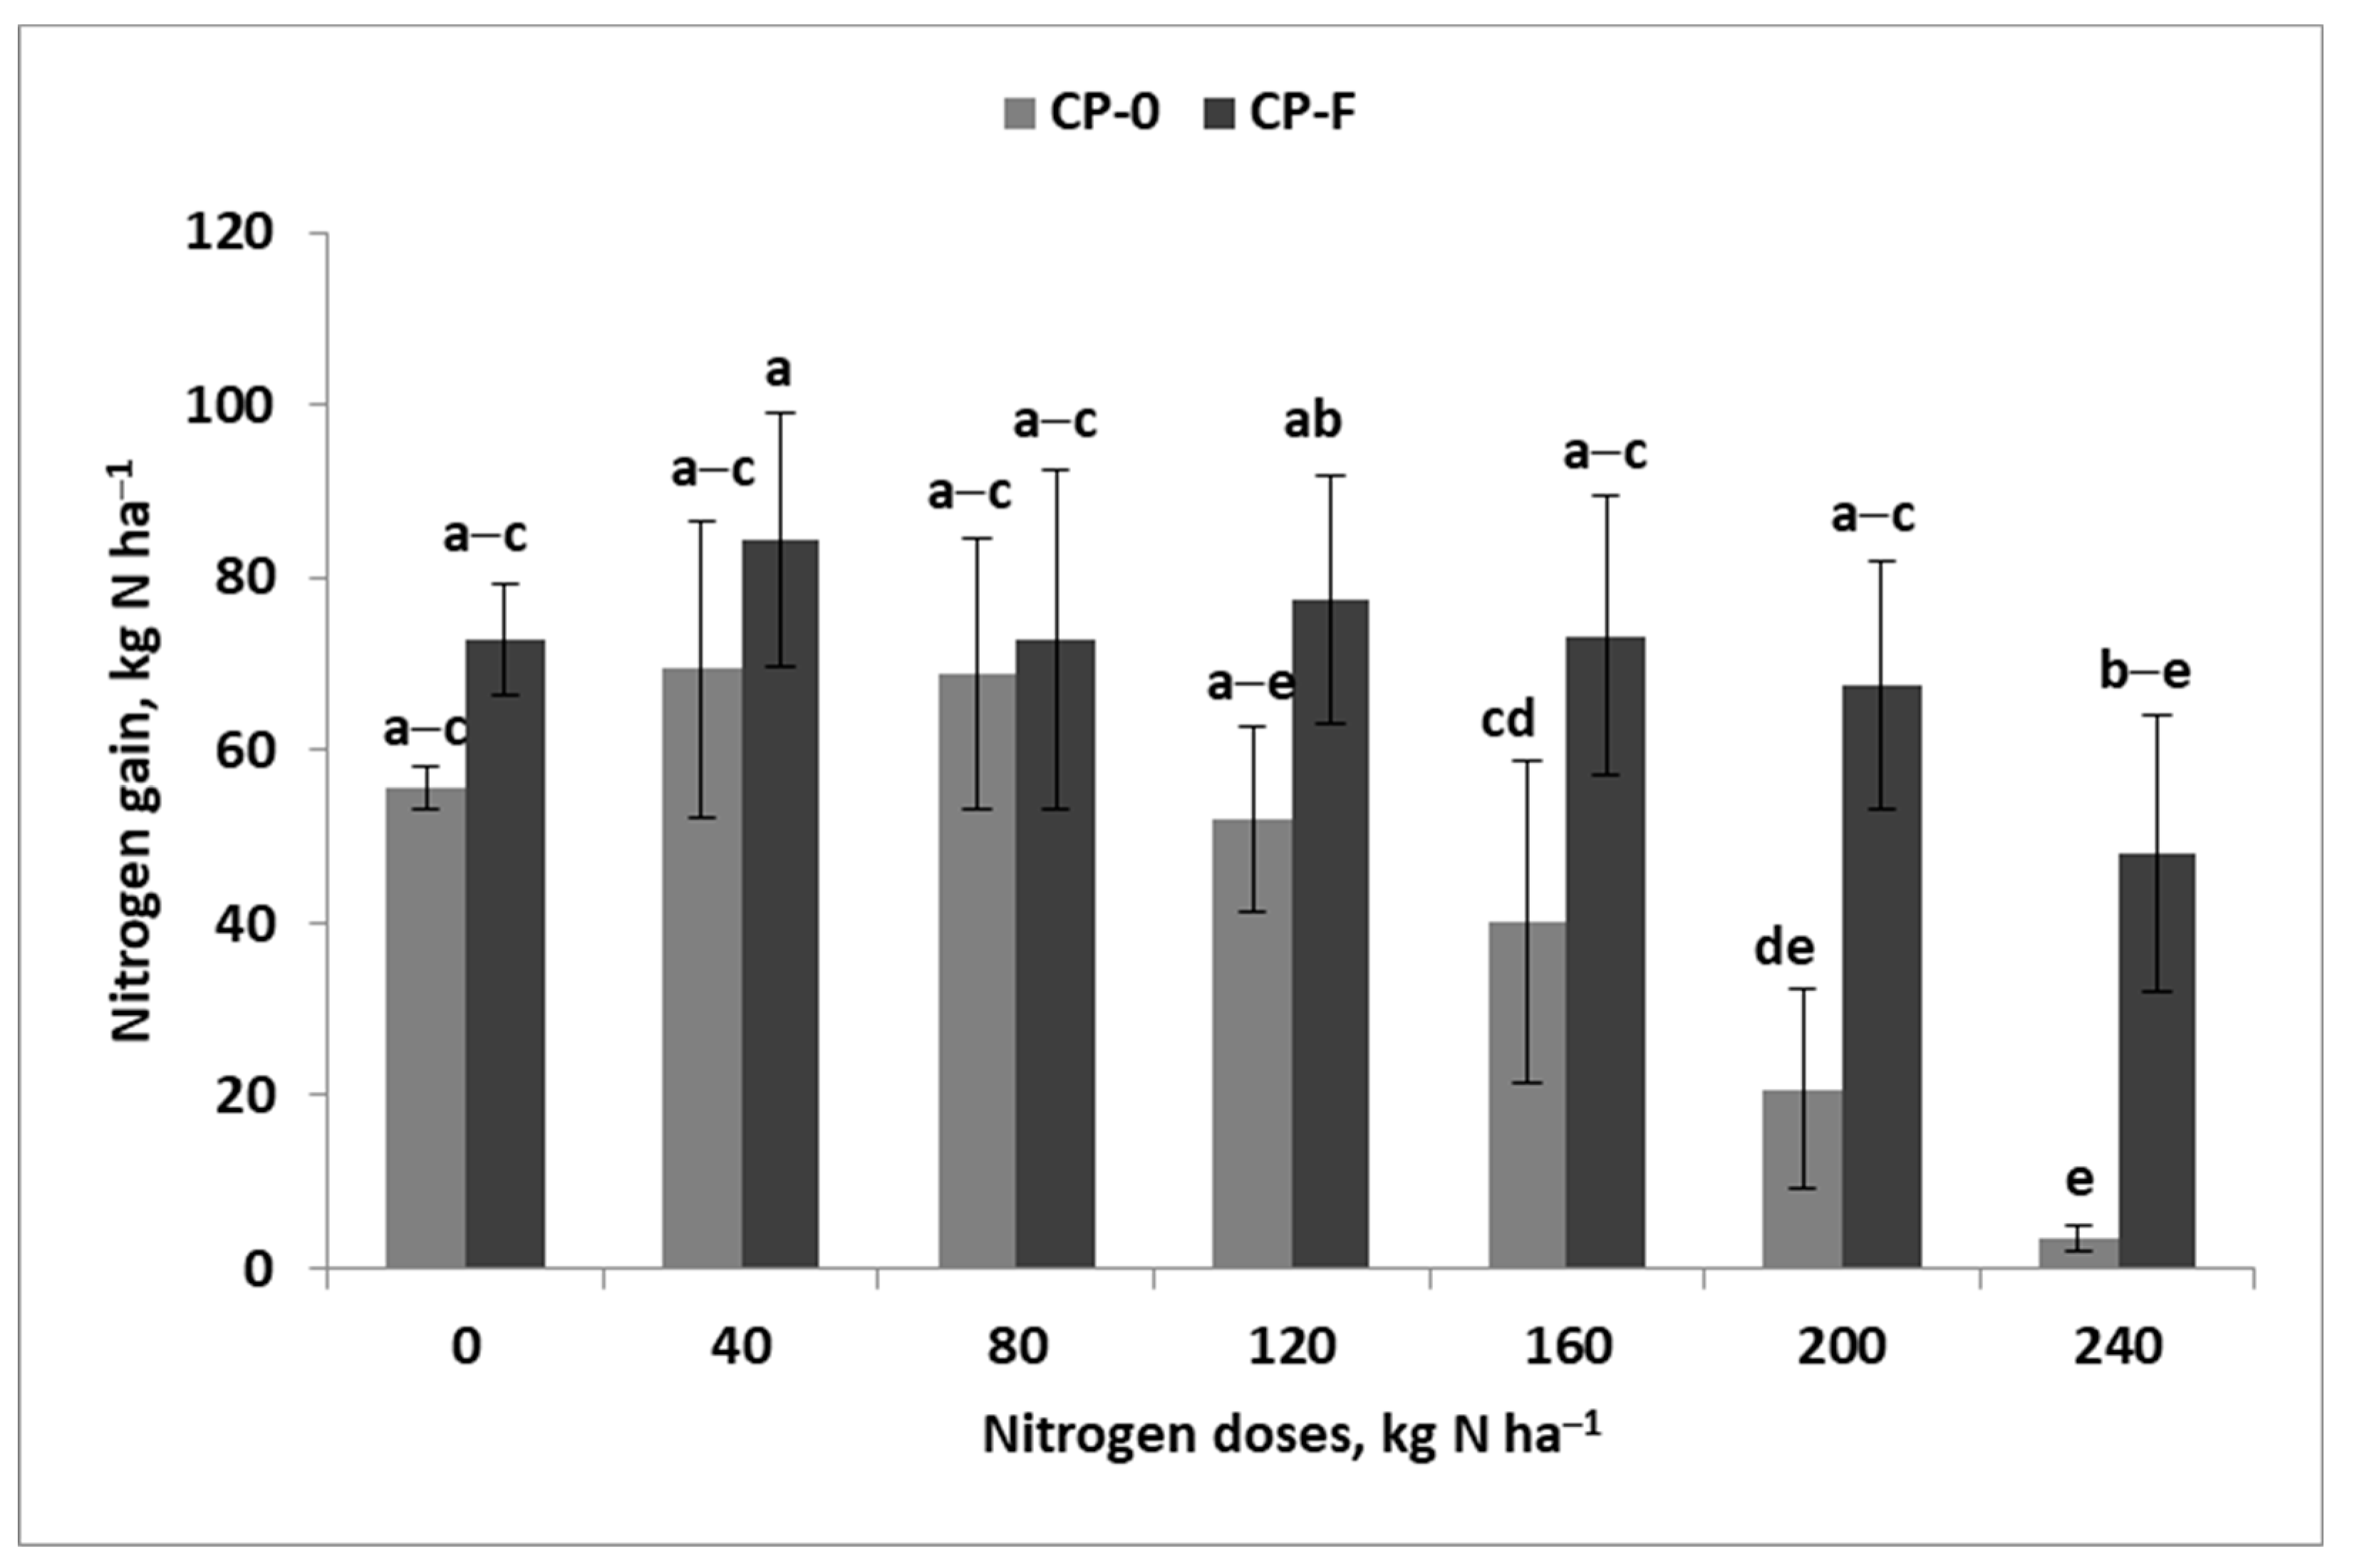
N resources in the soil–WW system at harvest include three pools: (i) grain N, i.e., N accumulated in grain (Ngr), (ii) the amount of N in harvest residues (Nhrr), (iii) the amount of residual mineral N in the soil (Nminr). All of these N pools were significantly and positively associated with GY, but the strongest correlation was noted for Ngr (r = 0.90 ***). There was also a positive relationship between this N trait and the other N pools (Table A1). The Ngr course was strongly affected by the CP × N interaction (Figure 3). Significantly higher amounts of Ngr for the CP-F system were recorded for each N plot, except for the one fertilized with 80 kg N ha−1. Grain N increased by 14.7% in the N control plot and by 24.2% in the plot fertilized with 240 kg N ha−1. In general, the rate of N accumulation in grain was significantly stronger for WW protected with fungicides, as shown for the obtained regression models:
1 . CP - 0 : N g r = 0.5 N f + 114.6 f o r n = 7 , R 2 = 0.96 , 0.001
2 . CP - F : N g r = 0.66 N f + 124.6 f o r n = 7 , R 2 = 0.99 , 0.001
The value of the slope coefficient of CP-F system compared to the CP-0 system was higher by 32% and the equation constant by 8.7%.
The second N pool concerns the amount of N in the harvest residues (Nhrr). This N pool was highly dependent on the years and experimental factors examined, but no interaction between them was found (Table 3). The lowest Nhrr was recorded in the 1st season. In other seasons, it was higher by 50%. A significantly higher Nhrr value was recorded for not-fungicide-protected WW (+9.4%). The effect of Nf doses, regardless of other factors examined, was progressive, showing a linear trend.
Both of these two wheat N pools constitute the total stock of N in WW at harvest (NA). The variability of this N characteristic depended on the Y × N and Y × CP interaction, but the former was more significant (Table 3, Figure S1). In each year, the amount of N in WW increased in line with the increase in Nf doses. Significantly greater values, starting from the plot fertilized with 40 kg N ha−1, were recorded in the 2nd season. NA was significantly associated with primary N pools at harvest, being the strongest for Ngr (r = 0.98 ***) and slightly weakly for Nhrr (r = 0.77 ***). At the same time, it was significantly affected by Nin (r = 0.90 ***) (Table A1).
The third basic component of N resources in WW after its harvest is the amount of Nmin in the soil, the so-called residual Nmin (Nminr). This N pool was significantly affected by the Y × N interaction (Table 3). Therefore, weather was the dominant factor influencing the residual Nmin content (Figure S2). Moreover, the amount Nmin in the soil varied in a relatively narrow range from 45 kg N ha−1 in a plot fertilized with 40 kg N ha−1 to 58 kg N ha−1 in the plot fertilized with 200 kg N ha−1. The largest Nmin amount, which dominated in this range, was found in 2015. The lowest Nmin values recorded in 2014 ranged from 22 to 33 kg N ha−1. A completely different Nmin trend was observed in 2016, when a linear Nmin increase was demonstrated in response to the applied Nf doses. In this particular year, the Nminr increased from 17 kg N ha−1 in the N control plot to 66 kg N ha−1 in the plot fertilized with 240 kg N ha−1.

3.3. Nitrogen Gain

The analyses of N sources for WW presented above are incomplete. One of the inorganic N pools was omitted, namely, the amount of Nmin released from soil resources in the spring part of the WW growing season. Three indices have been developed to describe this specific N pool. The first is the N balance (Nb), based on the amount of inorganic N (Nmin + Nf) introduced and removed (NA = Ngr + Nhrr) from the soil–wheat system. The variability of this N characteristic depended on the Y × N and Y × CP interactions, with the former being statistically stronger (Table 3). The decisive factor, affecting Nb variability, was the weather in consecutive growing seasons (Figure A3). The most negative N balance, regardless of N doses, was recorded in 2015. In this particular year, its values first decreased in the Nf range from 0 to 80 kg N ha−1, then recovered. However, over the whole range of the tested Nf doses, they were always negative. A completely different course of this N characteristic was recorded in other years. In 2014, the Nb basically followed the linear regression model, but positive values were first noted in the plot with 200 kg N ha−1. In 2016, this trend was almost identical, but positive Nb values were achieved first in the plot fertilized with 160 kg N ha−1.
The pool of Nmin released from the soil N stock during the growing season was called N gain 89 (Ng89). This N pool showed a significant response to experimental factors and the years. The highest Ng89 values were recorded in 2015. In the remaining years, they were significantly lower (approximately by 50%) (Table 3). However, the amount of Ng89 actually depended the CP × N interaction (Figure 4). The application of fungicides to WW, averaged over Nf doses, increased this N pool by 60%. The use of fungicides in the control N plot increased the Ng89 pool by 30.3% (from 56 to 73 kg N ha−1). The Ng89 pool on the CP-0 object was the highest on plots fertilized with 40 and 80 kg N ha−1 and then strongly decreased. Compared to the N control plot, it increased by 23.2% (from 56 to 69 kg N ha−1). On the CP-F object, the highest Ng89 was recorded in the plot fertilized with 40 kg N ha−1. It was higher by 15% (from 73 to 84 kg N ha−1) compared to the corresponding N control plot. At the same time, it was higher by 21.7% to the corresponding plot on the CP-0. In addition, this particular N trait showed high stability for the Nf doses ranging from 0 to 160 kg N ha−1. The course of Ng89, as shown in Figure 4, can be presented in the form of a regression model. The obtained data fit the quadrate regression model well:
CP - 0 :   N g 89 = 0.0018 N 2 + 0.17 N + 60.4   f o r   n = 7 ,   R 2 = 0.97 ,   p   0.01
CP - F :   N g 89 = 0.0013 N 2 + 0.21 N + 74.5   f o r   n = 6 ,   R 2 = 0.95 ,   p   0.05
The maximum Ng89 value for the CP-0 system of 64.4 kg N ha−1 was recorded for Nf of 94.4 kg N ha−1. At the same time, for the CP-F system, these values were 83.0 kg N ha−1 and 80.8 kg N ha−1, respectively. This means that they were larger at lower Nf doses.
The relationship between Ng89 and Nb clearly explains the effect of fungicide use on N economy in WW (Figure A4). Regardless of the level of this crop protection with fungicides, the obtained relationships showed a downward trend. The slope coefficient was more negative for CP-F than CP-0, but started from a significantly higher level, as indicated by a constant value (75.9 vs. 45.0 for CP-F and CP-0, respectively). Negative Nb values indicate a net increase in the content of Nmin. Ng89, assuming no change in Nmin resources during the spring vegetation of WW, i.e., for Nb = 0.0 kg N ha−1, reached +37.2 and +49.6 kg N ha−1 for the non-protected and fungicide-protected crop.
The total amount of Nin and Ng89 pools constitute the total inorganic N stock (Nint) in the spring part of WW vegetation. This aggregate index was largely driven by years and experimental factors. The impact of years was quite clear, and the highest Nint in the soil–WW system was recorded in 2015. In 2014, it was lower by 28.5% and by 22.3% in 2016. Fungicide protection of wheat increased Nint significantly by 9.8% (Table 3). However, a decisive impact on the variability of Nint was by the CP × N interaction (Figure 5). Its values increased gradually, regardless of the level of crop protection, in accordance with the increased Nf doses. Significant differences between both treatments began first with the plot fertilized with 120 kg N ha−1. The resulting linear models are as follows:
CP - 0 :   N i n t = 0.75 N i n t + 183.1   f o r   n = 7 ,   R 2 = 0.97 ,   p   0.001  
CP - F :   N i n t = 0.90 N i n t + 190   f o r   n = 7 ,   R 2 = 0.99 ,   p   0.001  
The key differences between both fungicide treatments concern the initial Nint and the slope coefficient values. Both characteristics were much lower for the CP-0 system by 4.4% and 16.7% compared to the CP-F system.

3.4. Nitrogen Gap—Second

Nint was then used to calculate the actual productivity of inorganic N in the soil–WW system (Partial Factor Productivity of Nint, PFP-Nint) during the spring part of the growing season. The variability of PFP-Nint depended on the interaction of both experimental factors with years, but no interaction between them was found (Table 3). In 2014 and 2015, relative stability of the index was observed in the Nf range of 0–80 kg N ha−1). In general, regardless of growing seasons, the course of the PFP-Nint showed a decreasing trend in response to increasing Nf doses. In the assessment of this N trait, the most important were attributes of the obtained linear models, reflecting the effect of years (Figure S3). The constants of the developed equations decreased in the order: 2014 (42.7 kg N ha−1) > 2015 (36.1 kg N ha−1) > 2016 (29.1 kg N ha−1). At the same time, the slope coefficient was much larger in 2014 compared to other years, indicating a stronger PFP-Nint decline in response to the increasing Nint. PFP-Nint was weakly related to both Nb and Ng89, but strongly to Nin (Table A1).
The total N gap (NGt) was calculated on the basis of PFPint. This N pool was highly dependent on the years and experimental factors examined, but no interaction between them was found (Table 3). With respect to years, the highest NGt of almost 100 kg N ha−1 was recorded in 2016. In 2014, it was almost 5-times lower. In 2015, NGt was much lower compared to 2016, but at the same time, it was almost three times larger than in 2014. The effect of fungicide use was quite obvious. A significantly higher absolute NGt value was found for the CP-0 system. Increasing Nf doses significantly increased absolute NGt values, consistent with a linear regression model. It should be emphasized that NGt significantly correlated with NG (r = 0.90 ***). At the same time, it correlated negatively with the main N wheat traits, especially with Nhrr (r = −0.89 ***) and also with Nminr (r = −0.63 ***) (Table A1).
The N recovery rate (NR) showed a response to the interaction of years with experimental factors, but no interaction between them was found (Table 3). Of the two significant interactions, Y × CP was the stronger (Figure A5). The effect of CP varied in subsequent years of study. In 2014, significantly higher NR was recorded for the CP-F system. An opposite situation was recorded in 2015, while in 2016, no difference between crop protection systems was found. The NR trend in subsequent years of study was highly specific. In each season, the highest NR values were recorded for the plot fertilized with 40 kg N ha−1 and the lowest for the plot fertilized with 240 kg N ha−1. However, in 2014 and 2015, the NR trend followed a quadratic regression model (Figure S4). Additionally, in 2015, NR values in the entire range of tested Nf doses were above the threshold value of 100%. In 2016, such a level was found only for a plot fertilized with 40 kg N ha−1. In 2016, the NR trend followed a linear regression model, decreasing with increasing Nf doses.

4. Discussion

4.1. Nitrogen Pools

The total amount of inorganic N in the soil–winter-crop system in the spring part of the growing season consists of three pools [7]. The main question is as follows: to what extent do these resources determine the grain yield? The effect of both initial N pools (Nmin + Nf), defined as N input (Nin), on the GY of WW was significant but not dominant (R2 = 0.32 ***). A much stronger relationship was found for Nin with the grain N (Ngr89, R2 = 0.70 ***). Regardless of weather conditions in subsequent growing seasons, the key factor affecting both wheat traits was plant protection using fungicides. The net increase in Ngr (ΔNgr) due to the use of fungicides was consistent with the amount of Nin in the soil–winter-wheat system:
Δ N g r = 0.16 N i n + 7.31   f o r   n = 7 ,   R 2 = 0.77 ,   p   0.001
The slope coefficient of the above equation clearly suggests a higher N supply to WW treated with fungicides. The difference between both fungicide protection systems in the plots with the highest Nin reached approximately 50 kg N ha−1. This value is equal with the GY increase of 2.2 t ha−1. This increase was confirmed in the CP-F system. In addition, this difference clearly indicates a good supply of N to the fungicide-treated WW during the grain filling period (GFP), which was confirmed by Szczepaniak [25]. As is known, only when there is an excess of N accumulated in the grain in relation to its mass, the grain N concentration increases [26,27].
To explain the phenomenon obtained, it is first necessary to recognize the association between fungicide protection of WW and the amount of Ng89. This is the third main pool of inorganic N for WW, which appears in the spring part of the growing season [7,14]. This N pool, considered separately, was important in GY formation but was not a key factor (R2 = 0.27 ***). At the same time, no significant effect of Ng89 on Ngr was found. It can therefore be concluded that the effect of Ng89 on WW must have occurred before flowering. These relationships indirectly suggest that the yield-forming effect of Ng89 resulted from its effect on CGD of WW, while being neutral on the protein content in the grain [28,29].
The ΔNg89 trend, confirming the significant impact of fungicide protection on WW, showed a quite specific response in relation to Nf doses. The entire course of Ng89, considered in relation to Nf doses, can be divided into two parts. The obtained relationships are illustrated by the following set of equations:
Low   N   doses :   Δ N g 89 = 0.16 N f + 18.4   f o r   n = 3 ,   R 2 = 0.87 ,   p   0.05  
High   N   doses :   Δ N g 89 = 0.0016 N f 2 + 0.75 N f + 42.4   f o r   n = 4 ,   R 2 = 0.92 ,   p   0.05
Generally, as shown in Figure 4, the net amount of Ng89, regardless of WW protection with fungicides, increased in the Nf range from 0 to 80 kg N ha−1. The recorded decrease in ΔNg89, as shown in Equation (25), indicates the occurrence of a phenomenon called “the N priming effect” [30]. This phenomenon was revealed in the reaction of WW plants to insufficient Nf supply during the critical stages of yield formation. The plants suffering from N deficiency stimulated the mineralization processes of organic N in the soil. This hypothesis is justified by the fact that the highest demand for N in WW occurs in the phase of intensive stem and ear growth (BBCH 40–49), which determines CGD [31]. In the second, much larger range of Nf doses examined, the ΔNg89 trend was consistent with the quadratic regression model. For Nfop of 234 kg N ha−1, a ΔNg89 amounted to 45.5 kg N ha−1. This amount of inorganic N released from soil N resources on the fungicide-treated object is almost the same as the amount of N accumulated in the grain (Equation (24)). These two relationships, obtained independently of each other, indicate that the available N resources during the grain filling period of GY development are the basic source of grain N and, thus, protein in the grain. However, their use depends on the wheat canopy index, i.e., CGD, which is formulated before flowering [28,29,32].
However, only the inclusion of all three inorganic N resources in the aggregated index, defined as the total N input (Nint), allowed us to explain the variability of WW grain yields in subsequent growing seasons (R2 = 0.66 ***) and, even more strongly, the variability of Ngr (R2 = 0.94 ***). The strength of these two relationships confirms the importance of N supply for the grain N content [13].
An important resource of inorganic N in the soil that requires consideration, mainly from the point of view of environmental protection, is residual N (Nminr) [33]. In the studied case, the Nminr content depended mainly on the course of weather during the consecutive growing seasons and on the Nf doses applied. In general, the obtained values were low (<50 kg N ha−1) according to EU standards, ranging from 30 to 70 kg N ha−1 [34]. Even more, in 2014, they were below the threshold range, which proves the high yield-forming efficiency of inorganic N in the soil–WW system. Moreover, the Nminr content showed a significant and relatively high correlation with main wheat traits, including the most important Ngr (R2 = 0.42 ***) and much lower with GY (R2 = 0.24 **). This is further evidence of the importance of available N resources for the N content in grain during GFP.

4.2. Indicators of Inorganic N Economy in the Soil–Winter-Wheat System

The yield-forming effect of inorganic N on N resources in the soil–WW system was assessed using a diverse set of indicators. The basic, simple indicator is gross N productivity, relating GY to the mass of N introduced or present in the soil–crop system. So far, only the Nf dose is used in the calculation of N use efficiency (NUE) [35]. Unfortunately, this calculation procedure is subject to errors because it does not take into account soil N resources, at least the initial ones [7].
In the presented case, the initial amount of inorganic N in the N control plot (Nf control) was 108.5 kg N ha−1, allowed the production of 6 t grain ha−1. This level of GY is very high and confirms the high value of winter oilseed rape as a forecrop for WW [36,37]. The calculated PFP-Nin was 57 kg grain per kg Nin. This value is high, but in essence, it is not true. The total amount of inorganic N in the soil during the growing season of WW on the Nf control, including its amount released from soil resources, was 173 kg N ha−1. Therefore, the actual N productivity in the examined system was much lower and amounted to 34 kg grain kg−1 N. It is obvious that increasing Nf doses resulted in a progressive decline of PFP-N index. It is worth emphasizing the stability of the discussed index in the Nf ranging from 0 to 80 kg N ha−1. The reason for this phenomenon was the increase in the amount of inorganic N released from the soil, observed in this set of Nf plots (Ng89; Figure 4).
Regardless of the N resources, included in the PFP-N index calculations, its value was always higher for the CP-F system. Moreover, both PFP-N indicators were related to each other, but at the same time, they were negatively related to Nin. This relationship indicates an oversupply of inorganic N into the soil–WW system. In such a case, the only practical solution is to reduce the Nf dose applied [38]. However, this recommendation does not apply to wheat grown for flour, but it fully applies for the so-called fodder wheat [3].
The developed PFP-N indices were then used to calculate the N gap (NG), which is an indicator of Nf inefficiency in the soil–crop plant system [7,20,39]. However, it can also be used to assess the inefficiency of inorganic N present in the soil–crop system during the growing season. Regardless of the calculation basis, both examined NG indicators clearly showed a significant and negative relationship with the initial amount of inorganic N in the soil–winter-wheat system. The developed models are as follows:
CP - 0 :   N G = 0.8 N i n + 87.4   f o r   n = 7 ,   R 2 = 0.98 ,   p   0.001
CP - F :   N G = 0.7 N i n + 85.0   f o r   n = 7 ,   R 2 = 0.98 ,   p   0.001
In general, the amount of saved N (ΔNG) due to the protection of WW with fungicides increased in accordance with the Nf dose increase. The dependence obtained is described by a linear regression model:
Δ N G = 0.11 N i n 2.3   f o r   n = 7 ,   R 2 = 0.82 ,   p   0.001
The obtained models clearly showed that NG increased in line with increasing Nin. The observed trend was both much slower and, at the same time, much lower for WW treated with fungicide. For example, NG on the plot fertilized with 200 kg N ha−1 decreased by 36 kg N ha−1. The practical significance of NGt resulted from a clearer differentiation of the variability of this characteristics in subsequent years of the study.
The analysis of N management in the soil–winter-wheat system was summarized with the classic N indicator, i.e., N recovery (NR). This study revealed four important messages. Firstly, NR, despite variability between years, was very high, even in 2016 with a low yield. Secondly, its trend in the first two seasons followed a quadratic regression model, which indirectly indicates an exponential decline in NR in the low ranges of Nf doses. This type of tendency was related to the “N priming effect”, observed for N doses of 40 and 80 kg N ha−1. Third, this observation was confirmed by a significant linear relationship between Ng89 and NR (R2 = 0.64). In fact, a better fit was obtained with the quadratic regression model (Figure A6). The most important information resulting from this relationship is Ng89 of 70.1 kg N ha−1, as the required amount of inorganic N released from soil resources during the winter wheat growing season to meet the NR threshold of 100%. This condition was met in 2015 for the entire range of Nf doses and in 2014 for a plot fertilized with 40 kg N ha−1 but protected with fungicide. Fourth, NR showed no significant relationships with basic N pools during winter wheat harvest (Ngr, Nhrr, Nminr). This means that regardless of weather conditions in a given growing season, there was a balance between the supply of N from the applied Nf and its use by WW. These relationships indeed indicate that the amount of inorganic N released from soil resources during the winter wheat growing season was the main cause of seasonal variability in NR. Therefore, the variability of Ng89 should be treated as a factor explaining the seasonal variability of NR, observed in fertilizer experiments [40,41]. Full NG coverage is an extremely challenging task for the farmer due to the many factors, some out of control, responsible for N use efficiency [42]. In the conducted study, this effect was achieved for NR at the level of 199%. This result was recorded for a plot with Nf dose of 40 kg N ha−1 (Figure S5).

5. Conclusions

Fungicidal protection of WW is an agrotechnical solution that allows the effective use of inorganic N present in the soil in the spring part of the growing season. The amount of N “saved” in the wheat grain increases with the Nf doses applied. The key factor influencing the positive effect of fungicide use in WW was the greater amount of N released from N soil stock during the growing season. These resources acted in two ways. Firstly, they increased the density of grain in the wheat canopy (larger GY), and secondly, they covered the N demand of the growing grains during the grain filling period. The observed “N priming effect” showed a longer and more stable duration for the fungicide-treated crop.
Single, inorganic N pools can be used as predictors of grain yield, but their reliability is relatively low (significant but low R2 values). Only data taking into account the full pool of inorganic N in the soil–winter-wheat system allowed for a high and reliable prediction of GY. An even better prediction can be obtained for the amount of N stored in the grain.
The primary indicator of N economy in the soil–crop system is the Partial Factor Productivity of N applied or present in the soil. This indicator confirmed both the positive impact of the use of fungicides in WW on the productivity of inorganic N and, consequently, on the decrease in the N gap. The values of N gap were closely but negatively related to the amount of inorganic N released from the soil during the growing season. As a consequence, the fungicide protection of winter wheat increased the recovery of inorganic N introduced and present in the soil during the growing season. It can be concluded that the seasonal variability of nitrogen recovery observed in fertilizer experiments is in fact due to the variability of the amount of inorganic N released during the growing season for a given crop. Therefore, the essential challenge for scientists is to develop a reliable model for predicting the amount of inorganic N released from soil resources during the growing season of a crop. This is a necessary task to effectively control the use of N from applied fertilizer.

Supplementary Materials

The following supporting information can be downloaded at: https://www.mdpi.com/article/10.3390/agronomy14081785/s1, Figure S1. The effect of N doses in consecutive growing seasons on N accumulation in winter wheat; Figure S2. The effect of N doses in consecutive growing seasons on the content of residual mineral N; Figure S3. Trend of the Partial Factor Productivity of the total N in the soil–winter-wheat system during consecutive growing seasons; Figure S4. The trend of N recovery during consecutive growing seasons; Figure S5. The relationship between N recovery and N gap.

Author Contributions

Conceptualization, A.A. and W.S.; methodology, A.A. and W.S.; software, T.S.; validation, A.A. and W.S.; formal analysis, T.S.; investigation, W.S. and T.S.; resources, W.S.; data curation, T.S.; writing—original draft preparation, W.S.; writing—review and editing, A.A.; visualization, W.S.; supervision, A.A.; project administration, T.S. All authors have read and agreed to the published version of the manuscript.

Funding

The publication was financed by the Polish Minister of Science and Higher Education as part of the Strategy of the Poznan University of Life Sciences for 2024–2026 in the field of improving scientific research and development work in priority research areas.

Data Availability Statement

The original contributions presented in the study are included in the article/Supplementary Material, and further inquiries can be directed to the corresponding author/s.

Conflicts of Interest

Author Tomasz Szymański was employed by the company Saaten-Union Polska, sp. z o.o. The remaining authors declare that the research was conducted in the absence of any commercial or financial relationships that could be construed as a potential conflict of interest.

Appendix A

Table A1. Matrix of correlation of nitrogen soil resources, pools and indices, n = 36.
TraitsNinPFP-NinNGNgrNhrrNANminrNbNg89NintPFP-NintNGtNR
GY0.57 ***0.08−0.100.90 ***0.33 *0.82 ***0.49 **−0.35*0.52 ***0.81 ***0.20−0.090.49 **
Nin1.00−0.72 ***−0.88 ***0.84 ***0.83 ***0.90 ***0.61 ***0.48 **−0.240.89 ***−0.58 ***−0.79 ***−0.35 *
PFP-Nin 1.000.92 ***−0.30−0.78 ***−0.44 **−0.29−0.75 ***0.61 ***−0.44 **0.90 ***0.85 ***0.79 ***
NG 1.00−0.49 **−0.82 ***−0.60−0.45 ***−0.80 ***0.60 ***−0.61 ***0.82 ***0.90 ***0.67 ***
Ngr 1.000.63 ***0.98 ***0.62 ***−0.050.270.97 ***−0.20−0.49 **0.15
Nhrr 1.000.77 ***0.58 ***0.37 ***−0.140.77 ***−0.79 ***−0.89 ***−0.21
NA 1.000.65 ***0.050.190.99 ***−0.36*−0.62 ***0.08
Nminr 1.000.080.290.74 ***−0.42 **−0.63 ***0.18
Nb 1.00−0.93 ***0.06−0.60 ***−0.55 ***−0.79 ***
Ng89 1.000.220.42 **0.300.80 ***
Nint 1.00−0.39 *−0.66 ***0.10
PFP-Nint 1.000.93 ***0.55 **
NGt 1.000.45 **
***, **, * indicate significant differences at p < 0.001, p < 0.01 and p < 0.05, respectively. Legend: GY—grain yield; Nin—mineral nitrogen input into the soil–crop system; PFP-Nin—partial factor productivity of N input in the soil–crop system; NG—nitrogen gap; Nhrr—N in straw and harvest residues; NA—nitrogen accumulation in wheat; Nminr—residual mineral N at harvest; Nb—nitrogen balance; Ng89—nitrogen gain in the soil–crop system; Nint—total nitrogen in the soil–crop system; PFP-Nint—productivity of total N input in the soil–crop during the whole growing season; NR—nitrogen recovery.

Appendix B

Figure A1. The effect of nitrogen doses against winter wheat fungicide protection systems on grain yield. Similar letters indicate a lack of significant differences between experimental treatments using Tukey’s test. The vertical bar in the column is the standard error of the mean. Legend: CP-0, CP-F—fungicide protection systems, without and with use of fungicides.
Agronomy 14 01785 g0a1
Figure A2. The effect of nitrogen doses in consecutive growing seasons on the Partial Factor Productivity of nitrogen initial input. Similar letters indicate a lack of significant differences between experimental treatments using Tukey’s test. The vertical bar in the column is the standard error of the mean. Legend: 2014, 2015, 2015—consecutive growing seasons.
Agronomy 14 01785 g0a2
Figure A3. The effect of nitrogen doses in consecutive growing seasons on nitrogen balance. Similar letters indicate a lack of significant differences between experimental treatments using Tukey’s test. The vertical bar in the column is the standard error of the mean. Legend: 2014, 2015, 2015—consecutive growing seasons.
Agronomy 14 01785 g0a3
Figure A4. The effect of nitrogen released from soil resources on nitrogen balance in two systems of winter wheat protection with fungicides. Legend: CP-0, CP-F—fungicide protection systems, without and with use of fungicides.
Agronomy 14 01785 g0a4
Figure A5. The effect of two systems of winter wheat protection with fungicides in consecutive years of the study on nitrogen recovery. Similar letters indicate a lack of significant differences between experimental treatments using Tukey’s test. The vertical bar in the column is the standard error of the mean. Legend: CP-0, CP-F—fungicide protection systems, without and with use of fungicides.
Agronomy 14 01785 g0a5
Figure A6. The relationship between the nitrogen gain during the growing season of winter wheat and nitrogen recovery.
Agronomy 14 01785 g0a6

References

  1. Shewry, P.R.; Hey, S.J. The contribution of wheat to human diet and health. Food Energy Secur. 2015, 493, 178–202. [Google Scholar] [CrossRef] [PubMed]
  2. Nucia, A. Białka gluteninowe—Charakterystyka i ich wpływ na właściwości reologiczne pszenicy. Agron. Sci. 2018, 73, 5–16. [Google Scholar] [CrossRef]
  3. Klikocka, H.; Szczepaniak, W. Energy crises—Alternative use of winter bread wheat grain depending on protein content. Agronomy 2023, 13, 861. [Google Scholar] [CrossRef]
  4. Iwańska, M.; Paderewski, J.; Stępień, M.; Rodrigues, P.C. Adaptation of winter wheat cultivars to different environments: A case study in Poland. Agronomy 2020, 10, 632. [Google Scholar] [CrossRef]
  5. Hawkesford, M.J.; Riche, A.B. Impacts of G x E x M on nitrogen use efficiency in wheat and future prospects. Front. Plant Sci. 2020, 11, 1157. [Google Scholar] [CrossRef] [PubMed]
  6. Luce, M.S.; Whalen, J.K.; Ziadi, N.; Zebarth, B.J. Nitrogen dynamics and indices to predict soil nitrogen supply in humid temperate soils. Adv. Agron. 2011, 112, 55–102. [Google Scholar]
  7. Grzebisz, W.; Łukowiak, R.; Sassenrath, G. Virtual nitrogen as a tool for assessment of nitrogen at the field scale. Field Crops Res. 2018, 218, 182–184. [Google Scholar] [CrossRef]
  8. Olfs, H.-W.; Blankenau, K.; Brentrup, F.; Jasper, J.; Link, A.; Lammel, J. Soil-and plant-based nitrogen-fertilizer recommendations in arable farming. J. Plant Nutr. Soil Sci. 2005, 168, 414–431. [Google Scholar] [CrossRef]
  9. Barłóg, P.; Łukowiak, R.; Grzebisz, W. Predicting the content of soil mineral nitrogen based on the content of calcium chloride-extractable nutrients. J. Plant Nutr. Soil Sci. 2017, 180, 624–635. [Google Scholar] [CrossRef]
  10. Łukowiak, R.; Barłóg, P.; Grzebisz, W. Soil mineral nitrogen and the rating of CaCl2 extractable nutrients. Plant Soil Environ. 2017, 63, 177–183. [Google Scholar] [CrossRef]
  11. Kong, L.G.; Xie, Y.; Hu, L.; Feng, B.; Li, S.D. Remobilization of vegetative nitrogen to developing grain in wheat (Triticum aestivum L.). Field Crops Res. 2016, 196, 134–144. [Google Scholar] [CrossRef]
  12. Hodgkinson, L.; Dodd, I.C.; Binley, A.; Ashton, R.W.; White, R.P.; Watts, C.W.; Whalley, W.R. Root growth in field grown winter wheat: Some effects of soil conditions, season and genotype. Eur. J. Agron. 2017, 91, 74–83. [Google Scholar] [CrossRef]
  13. Giordano, N.; Sadras, V.O.; Lollato, R.P. Late-season nitrogen application increases grain protein concentration and is neutral for yield in wheat. A global meta-analysis. Field Crops Res. 2023, 290, 108740. [Google Scholar] [CrossRef]
  14. Łukowiak, R.; Grzebisz, W.; Ceglarek, J.; Podolski, A.; Kaźmierowski, C.; Piekarczyk, J. Spatial variability of yield and nitrogen indicators–a crop rotation approach. Agronomy 2020, 10, 1959. [Google Scholar] [CrossRef]
  15. Taiz, L. Agriculture, plant physiology, and human population growth: Past, present, and future. Theor. Exp. Plant Physiol. 2013, 25, 167–181. [Google Scholar] [CrossRef]
  16. Simón, M.R.; Fleitas, M.C.; Castro, A.C.; Schierenbeck, M. How foliar fungal diseases affect nitrogen dynamics, milling, and end-use quality of wheat. Front. Plant Sci. 2020, 11, 569041. [Google Scholar] [CrossRef] [PubMed]
  17. Figueoroa, M.; Hammond-Kosack, K.E.; Solomon, P.S. A review of wheat disease—A field perspective. Mol. Plant Pathol. 2018, 19, 1523–1536. [Google Scholar] [CrossRef]
  18. Castro, A.C.; Fleitas, M.C.; Schierenbeck, M.; Gerard, G.S.; Simón, M.R. Evaluation of different fungicides and nitrogen rates on grain yield and bread-making quality in wheat affected by Septoria tritici blotch and yellow spot. J. Cereal Sci. 2018, 83, 49–57. [Google Scholar] [CrossRef]
  19. Matzen, N.; Jørgensen, J.R.; Holst, N.; Jørgensen, L.N. Grain quality in wheat—Impact of disease management. Eur. J. Agron. 2019, 103, 152–164. [Google Scholar] [CrossRef]
  20. Grzebisz, W.; Diatta, J.; Barłóg, P.; Biber, M.; Potarzycki, J.; Łukowiak, R.; Przygocka-Cyna, K.; Szczepaniak, W. Soil Fertility Clock—Crop rotation as a paradigm in nitrogen fertilizer productivity control. Plants 2022, 11, 2841. [Google Scholar] [CrossRef]
  21. Mehlich, A. Mehlich 3 soil test extractant: A modification of Mehlich 2 extractant. Com. Soil Sci. Plant Anal. 1984, 15, 1409–1416. [Google Scholar] [CrossRef]
  22. Kęsik, K. Application of the Mehlich 3 method in the fertilizer advisory system. Stud. I Rap. IUNG-PIB 2016, 48, 95–104. (In Polish) [Google Scholar]
  23. Zbíral, J. Determination of plant-available micronutrients by the Mehlich 3 soil extractant—A proposal of critical values. Plant Soil Environ. 2016, 62, 527–531. [Google Scholar] [CrossRef]
  24. PN-EN ISO 20483:2014-02; Cereal Grains and Pulses—Determination of Nitrogen Content and Conversion to Crude Protein—Kjeldahl Method. PKN: Warsaw, Poland, 2015; p. 24.
  25. Szczepaniak, W.; Grzebisz, W.; Potarzycki, J. Yield Predictive Worth of Pre-Flowering and Post-Flowering Indicators of Nitrogen Economy in High Yielding Winter Wheat. Agronomy 2023, 13, 122. [Google Scholar] [CrossRef]
  26. Ellmann, T. Effect of intensity of agricultural techniques and grain storage on technological quality of winter wheat, Part I. Quality traits of grain and flour. Acta Sci. Polonorum. Agric. 2011, 10, 27–36. [Google Scholar]
  27. Meng, Q.; Yue, S.; Chen, X.; Cui, Z.; Ye, Y.; Ma, W.; Tong, Y.; Zhang, F. Understanding dry matter and nitrogen accumulation with time-course for high-yielding wheat production in China. PLoS ONE 2013, 8, e68783. [Google Scholar] [CrossRef]
  28. Duan, J.; Wu, Y.; Zhou, Y.; Ren, X.; Shao, Y.; Feng, W.; Zhu, Y.; Wang, Y.; Guo, T. Grain number response to pre–anthesis dry matter and nitrogen in improving wheat yield in the Huang–Huai Plain. Sci. Rep. 2018, 8, 7126. [Google Scholar] [CrossRef]
  29. Grzebisz, W.; Szczepaniak, W.; Potarzycki, J.; Biber, M. Prediction of grain yield and gluten content in winter wheat bread wheat based on nutrient content in plant parts during the Critical Cereal Window. Agronomy 2023, 13, 2649. [Google Scholar] [CrossRef]
  30. Jenkinson, D.S.; Fox, R.H.; Rayner, J.H. Interactions between fertilizer nitroegen and soil nitrogen: The so called “priming” effect. Eur. J. Soil Sci. 2006, 36, 425–444. [Google Scholar] [CrossRef]
  31. Xie, Q.; Mayes, S.; Sparkes, D.L. Preanthesis biomass accumulation and plant organs defines yield components in wheat. Eur. J. Agron. 2016, 81, 15–26. [Google Scholar] [CrossRef]
  32. Szczepaniak, W.; Nowicki, B.; Bełka, D.; Kazimierowicz, A.; Kulwicki, M.; Grzebisz, W. Effect of foliar application of micronutrients and fungicides on the nitrogen use efficiency in winter wheat. Agronomy 2022, 12, 257. [Google Scholar] [CrossRef]
  33. D’Haene, K.; Salomez, J.; De Neve, S.; De Waele, J.; Hofman, G. Environmental performance of nitrogen fertilizer input by the EU Nitrates Directive. Agric. Ecosys. Environ. 2014, 192, 67079. [Google Scholar]
  34. De Waele, J.; D’Haene, K.; Salomez, J.; Hofman, G.; De Neve, S. Simulating the environmental performance of post-harvest management measures to comply with the UU Nitrates Directive. J. Environ. Manag. 2017, 187, 513–526. [Google Scholar] [CrossRef] [PubMed]
  35. Dobermann, A. Nitrogen use efficiency—State of the art. In Proceedings of the IFA International Workshop on Enhanced Efficiency Fertilizers, Frankfurt, Germany, 28–30 June 2005; pp. 1–16. [Google Scholar]
  36. Wanic, M.; Denert, M.; Treder, K. Effect of forecrops on the yield and quality of common wheat and spelt wheat grain. J. Elem. 2019, 24, 369–383. [Google Scholar] [CrossRef]
  37. Litke, L.; Gaile, Z.; Ruža, A. Effect of nitrogen rate and forecrop on nitrogen use efficiency in winter wheat (Triticum aestivum). Agron. Res. 2019, 17, 582–592. [Google Scholar]
  38. Faber, A.; Jarosz, Z.; Rutkowska, A.; Jadczyszyn, T. Reduction of nitrogen losses in winter wheat grown on light soils. Agronomy 2021, 11, 2337. [Google Scholar] [CrossRef]
  39. Grzebisz, W.; Łukowiak, R. Nitrogen gap amelioration is a core for sustainable intensification of agriculture—A concept. Agronomy 2021, 11, 419. [Google Scholar] [CrossRef]
  40. Hlisnikovsky, L.; Menšik, L.; Kunzová, E. The development of winter wheat yield and quality under different fertilizer regomes and soil-climatic conditions in the Czech Republic. Agronomy 2020, 10, 1160. [Google Scholar] [CrossRef]
  41. Potarzycki, J.; Wendel, J. The effect of sulfur carriers on nitrogen use efficiency in potatoes—A case study. Agronomy 2023, 13, 2470. [Google Scholar] [CrossRef]
  42. Wallace, A.; Wallace, G.A. Closing the Crop-Yield Gap through Better Soil and Better Management; Wallace Laboratories: Los Angeles, CA, USA, 2003; p. 162. [Google Scholar]
Figure 1. Daily mean air temperature and precipitation at the Experimental Station Smolice during the study.
Agronomy 14 01785 g001
Figure 2. The effect of nitrogen doses against winter wheat fungicide protection systems on N gap. Similar letters indicate a lack of significant differences between experimental treatments using Tukey’s test. The vertical bar in the column is the standard error of the mean. Legend: CP-0, CP-F—fungicide protection systems, without and with use of fungicides.
Agronomy 14 01785 g002
Figure 3. The effect of nitrogen doses against the fungicide protection system of winter wheat on grain nitrogen. Similar letters indicate a lack of significant differences between experimental treatments using Tukey’s test. The vertical bar in the column is the standard error of the mean. Legend: CP-0, CP-F—fungicide protection systems, without and with use of fungicides.
Agronomy 14 01785 g003
Figure 4. The effect of nitrogen doses against winter wheat fungicide protection systems on nitrogen gain during the growing season. Similar letters indicate a lack of significant differences between experimental treatments using Tukey’s test. The vertical bar in the column is the standard error of the mean. Legend: CP-0, CP-F—fungicide protection systems, without and with use of fungicides.
Agronomy 14 01785 g004
Figure 5. The effect of nitrogen doses against winter wheat fungicide protection systems on the total nitrogen input to the soil–winter-wheat system. Similar letters indicate a lack of significant differences between experimental treatments using Tukey’s test. The vertical bar in the column is the standard error of the mean. Legend: CP-0, CP-F—fungicide protection systems, without and with use of fungicides.
Agronomy 14 01785 g005
Table 1. Soil agrochemical characteristics in consecutive growing seasons 1–5.
Soil, cmpH 1Corg 2P 3KMgCaCuMnZnFeNmin 4
%mg kg−1kg ha−1
2013/2014
0–306.91.3234 VH 5231 M105 VL988 L0.4 L27.2 L3.6 M536 H86.4
30–606.71.1234 VH237 M103 VL876 L0.4 L25.7 L3.5 M541 H
2014/2015
0–307.12.2185 H185 M165 M2045 M3.5 M85.5 M6.3 H268 M129
30–607.22.1161 H157 L155 L2063 M3.5 M93.8 M5.6 H26 9 M
2015/2016
0–306.61.6202 VH281 M165 M1480 L2.8 M61.9 M6.1 H347 M110
30–606.61.4139 H222 M163 L1504 L2.5 M62.0 M3.7 M231 M
1 1.0 M KCl soil/solution ratio 1:2.5 m/v; 2 loss-on ignition; 3 including all macro- and micronutrients Mehlich 3 [21]; 4 0.01 dm−3 CaCl2, soil/solution ratio 1:5 m/v; 5 availability classes: VL—very low; L—low; M—medium; H—high; VH—very high [22,23].
Table 2. Primary sources and indices of nitrogen economy in winter wheat.
VariableLevel of VariableNinGYPFP-NinYGNG
kg ha−1t ha−1kg kg−1 Nt ha−1kg ha−1
Year (Y)2014206.3 c8.8 b48.2 a−3.7 a−61.7 a
2015249.0 a11.0 a46.5 b−4.8 b−68.8 b
2016230.0 b6.6 c31.1 c−7.4 c−121.7 c
Fc, p ne736 ***441 ***611 ***611 ***
Crop ProtectionCP-0228.48.1 b38.9 b−5.8 b−95.0 b
(CP)CP-F228.49.4 a45.0 a−4.4 a−73.1 a
Fc, p ne205 ***137 ***205 ***205 ***
0108.56.0 e57.0 a−0.6 a−9.1 a
Nitrogen rates40148.57.8 d52.7 b−1.3 b−20.9 b
(N), kg N ha−180188.58.7 c46.4 c−2.7 c−44.8 c
120228.59.4 b41.0 d−4.5 d−74.5 d
160268.49.5 b35.4 e−6.8 e−111.9 e
200308.49.9 a b31.9 f−8.9 f−146.0 f
240348.510.2 a29.1 f−11.0 g−181.4 g
Fc, p ne137 ***237 ***1030 ***1030 ***
Source of variation for the studied interactions
Y × CP -************
Y × N -************
CP × N -***ns******
Y × CP × N -nsnsnsns
Similar letters means a lack of significant differences using Tukey’s test; *** indicates significant difference at p < 0.001; ne—not estimated. Legend: Nin—mineral nitrogen input into the soil–crop system at the beginning of the growing season; PFP-Nin—partial factor productivity of N input; YG—yield gap; NG—nitrogen gap.
Table 3. Nitrogen pools, resources and indices at winter wheat harvest.
VariableLevel of
Variable
NgrNhrrNANminrNbNg89NintPFP-NintNGtNR
kg N ha−1kg kg−1 Nkg N ha−1%
Year (Y)2014174.9 b45.8 b220.7 c25.7 c−14.4 b40.0 b246.3 c36.6 a−22.2 a87.5 b
2015229.9 a66.0 a295.9 a48.4 a−46.9 c95.5 a344.4 a32.4 b−64.8 b132.2 a
2016162.3 c68.0 a230.2 b37.3 b−0.2 a37.5 b267.5 b25.3 c−99.3 c69.3 c
Fc, p 264 ***45.5 ***214 ***48.9 ***73.2 ***91.4 ***228 ***306 ***179 ***61 ***
Crop ProtectionCP-0184.4 b62.6 a237.0 b35.8−8.6 a44.3 b272.8 b30.5 b−65.8 b94.3
(CP)CP-F203.6 a57.2 b260.9 a38.5−32.4 b70.9 a299.4 a32.4 a−58.5 a98.4
Fc, p 131 ***6.7 *54.4 ***2.1 ns54.5 ***45.3 ***45.3 ***25.4 ***4.8 *0.7 ns
0109.3 f34.8 e144.1 g28.7 d−35.6 d64.3 ab172.7 f35.4 a−18.6 a-
Nitrogen rates40145.3 e49.3 d194.5 f30.8 cd−46.1 d76.8 a225.3 e34.4 a−27.5 a134.1 a
(N), kg N ha−180171.6 d55.1 cd226.7 e32.7 cd−38,2 d70.9 a259.3 d33.8 ab−36.5 ab103.2 b
120195.6 c61.7 bc257.3 d36.0 b–d−28.8 cd64.8 ab293.3 c32.0 b−54.5 b94.3 bc
160214.9 b71.1 ab286.0 c39.1 a–c−17,6 c56.7 ab325.1 b29.4 c−82.4 cd88.7 c
200236.6 a70.9 ab307.5 b45.0 ab0.9 b44.1 bc352.5 a27.9 cd−100.5 cd81.7 cd
240249.9 a76.6 a326.6 a47.7 a21.0 a25.8 c374.2 a27.2 d−114.9 d76.0 d
Fc, p 222 ***28.0 ***231 ***8.3 ***32.2 ***11.2 ***189 ***44.4 ***72.6 ***12.6 ***
Source of variation for the studied interactions
Y × CP **ns*******ns***
Y × N ***ns*****************ns*
CP × N ***nsnsnsns**nsnsns
Y × CP × N nsnsnsnsnsnsnsnsnsns
Similar letters means a lack of significant differences using Tukey’s test; ***, **, * indicate significant differences at p < 0.001, p < 0.01 and p < 0.05, respectively. Legend: Ngr—N amount in grain; Nhrr—N amount in harvest residues; NA—N accumulated in wheat at harvest; Nminr—residual mineral N at harvest; Nb—nitrogen balance; Ng89—nitrogen gain in the soil–winter-wheat system; Nint—total nitrogen input in the soil–winter-wheat system; PFP-Nint partial factor productivity of the total N input into the soil–winter-wheat system; NGt—actual nitrogen gap; NR—nitrogen recovery.
Disclaimer/Publisher’s Note: The statements, opinions and data contained in all publications are solely those of the individual author(s) and contributor(s) and not of MDPI and/or the editor(s). MDPI and/or the editor(s) disclaim responsibility for any injury to people or property resulting from any ideas, methods, instructions or products referred to in the content.

