Article

Soil and Plant Nitrogen Management Indices Related to Within-Field Spatial Variability

by
Remigiusz Łukowiak
1,*,
Przemysław Barłóg
1 and
Jakub Ceglarek
2
1
Department of Agricultural Chemistry and Environmental Biogeochemistry, Poznan University of Life Sciences, Wojska Polskiego 28, 60-637 Poznań, Poland
2
Environmental Remote Sensing and Soil Science Research Unit, Faculty of Geographical and Geological Sciences, Adam Mickiewicz University, Krygowskiego 10, 61-680 Poznań, Poland
*
Author to whom correspondence should be addressed.
Agronomy 2024, 14(8), 1845; https://doi.org/10.3390/agronomy14081845 (registering DOI)
Submission received: 5 July 2024 / Revised: 9 August 2024 / Accepted: 14 August 2024 / Published: 20 August 2024
(This article belongs to the Special Issue Nitrogen Cycle in Farming Systems—2nd Edition)

Abstract

:
Field zones at risk of low nitrogen use efficiency (NUE) can be identified by analyzing in-field spatial variability. This hypothesis was validated by analyzing soil mineral nitrogen (Nmin) and several plant and soil N management indices. The research was conducted in Karmin (central Poland) during two growing seasons, with winter oilseed rape (2018/2019) and winter wheat (2019/2020). The study showed that the crop yield was positively related to Nmin. However, this N trait did not explain all the observed differences in the spatial variation of crop yield and plant N accumulation. In addition, the soil N management indices were more spatially variable during the growing season than the plant N management indices. Particularly high variability was found for the indices characterizing the N surplus in the soil-plant system. The calculated N surplus (Nb = N fertilizer input − N seed output) ranged from −62.8 to 80.0 kg N ha−1 (coefficient of variation, CV = 181.2%) in the rape field and from −123.5 to 8.2 kg N ha−1 (CV = 60.2%) in the wheat field. The spatial distribution maps also confirm the high variability of the parameters characterizing the post-harvest N surplus, as well as the total N input (soil + fertilizer) to the field with rape. The results obtained indicate that a field N balance carried out in different field zones allows a more accurate identification of potential N losses from the soil-plant system.

1. Introduction

A key yield-forming factor is nitrogen (N) fertilization. At the biochemical and physiological level, this nutrient is positively coupled to CO2 assimilation, and its deficiency causes significant disturbances in the photosynthesis and biosynthesis of numerous organic compounds, as well as dry matter distribution in the plant [1,2]. The yield-forming functions of N relate to the stimulation of plant growth, the development of yield components and the improvement of yield quality related to protein content [3,4]. At the beginning of the 1960s, global consumption of mineral N fertilizers in agriculture was at a level of 11.5 Tg year−1. In 2021, this value was almost 10 times higher and reached 108.7 Tg year−1. In comparison, over the same period, cereal production (barley, maize, oats, rice, rice, triticale, and wheat) increased from 800 to 2900 Tg year−1 [5]. Meeting the needs of the human population in 2050 will require a further increase in crop production. Total demand for cereals is projected to increase by 56% over the levels recorded at the beginning of the 21st century [6]. About 45% of this increase will be for maize, 26% for wheat and 8% for rice. Achieving this target will require either an increase in N fertilizer use or improvements in nitrogen fertilizer efficiency [7,8]. Depending on the scenario, global synthetic nitrogen fertilizer use in 2050 could range from 85 Tg N year−1 in an optimistic scenario to 260 Tg N year−1 in a pessimistic one [9]. One of the basic assumptions for the optimistic scenario is an increase in nitrogen use efficiency (NUE). This indicator is generally defined as the difference between nitrogen inputs and outputs in agricultural soil-plant systems [10]. The average NUE rate worldwide is estimated to be between 30% and 50% [11]. However, NUE values vary widely between regions and countries around the world. In Europe and the USA, NUE values can be as high as 60–69%, while in China and India, they are lower at around 20–30% [12]. The optimum range of NUE values is between 50–90% [13]. Lower values indicate low efficiency of N fertilization and high losses of the nutrient from the soil-plant system. This type of N management has a negative impact on the current financial situation of farms and on the state of the environment [14]. The N not taken up by the plants is dispersed in the environment either by leaching or by gaseous emissions to the atmosphere [15]. The result of leaching is excessive eutrophication of land and marine waters [16]. The second phenomenon releases ammonia and nitrous oxide (N2O) into the atmosphere. The first compound increases the degree of acidification of the environment, and the second enhances the greenhouse effect [17,18].
Primary efforts to improve NUE include genotype modification and the development of higher productivity varieties [19]. Another area of activity is to create optimal conditions for plants to take up water and nitrogen from the soil, to provide plants with components that control nitrogen uptake and metabolism, and to minimize the negative effects of so-called reducing factors, i.e., pressure from factors such as diseases, pests or weeds [20]. In turn, activities strictly related to fertilization have been defined and structured in the form of a concept called 4R Nutrient Stewardship [21]. In general, it is a set of principles and recommendations for optimizing fertilizer use, regardless of the region of the world. It is based on four pillars of key decisions: (1) selecting the right nutrient source, (2) the right rate, (3) the right timing of application, (4) and the right placement. Implementing the second point requires a full knowledge of the nutrient needs of the crop and the mineral nitrogen (Nmin) content of the soil. Both variables are needed to estimate the optimum dose of N fertilizer [22]. The implementation of point two of the 4R Nutrient Stewardship Framework is also directly related to the implementation of Pillar 4, referred to as ‘right placement’. This concept refers to improving NUE through a number of different fertilizer application methods and technologies, such as broadcast, band, and/or row applications [20,23]. This approach includes Site-Specific Nutrient Management (SSNM). The application of SSNM is based on an assessment of the spatial variability of nutrient levels in a field and, on this basis, the calculation of optimal fertilizer doses precisely tailored to the fertilizer requirements of a defined small area of crop [24,25]. This is made possible by a range of advanced diagnostic and information systems such as remote sensing, GPS, and GIS systems [26]. However, their usefulness depends on a well-done calibration using standard methods for chemical analysis of soil and plant material and yield determination [27]. Analyzing the temporal and spatial variability of soil Nmin is particularly important in this research area [28,29]. This is due to several facts: (i) the forms of Nmin, nitrate, and ammonium nitrogen (NO3-N and NH4-N) differ in their mobility and rate of transformation in the soil; (ii) Nmin shows seasonal variation determined by soil moisture, temperature, and microbial activity; (iii) NO3-N can be taken up by plants from a depth of 150 cm [30,31,32]. The existing knowledge of the spatial variability of Nmin in the soil is not sufficient to make reliable recommendations for optimal doses in precision agriculture. This is partly because of the different growing conditions of crops. In addition, crops have different N requirements. For example, winter oilseed rape and winter wheat require relatively high doses of N from fertilizer [33,34]. At the same time, both species are very sensitive to environmental factors that alter nitrogen uptake, such as water stress [35]. Thus, under heterogeneous field conditions, there may be a deficit of N in some parts of the field and a surplus in other parts of the field, resulting in excessive N losses from the soil-plant system.
In the present study, it was hypothesized that variation in field Nmin would directly influence yield variability and N use efficiency. Studies were conducted to test this hypothesis: (1) to assess the spatial variability of Nmin content before spring development of winter oilseed rape and winter wheat and after their harvest; (2) to assess the variability of yield, accumulation, and use of nitrogen by plants; (3) to determine the relationship between yield and various soil nitrogen management indices; and (4) to produce maps illustrating the variability of the parameters studied in the context of possible recommendations for precision fertilization.

2. Materials and Methods

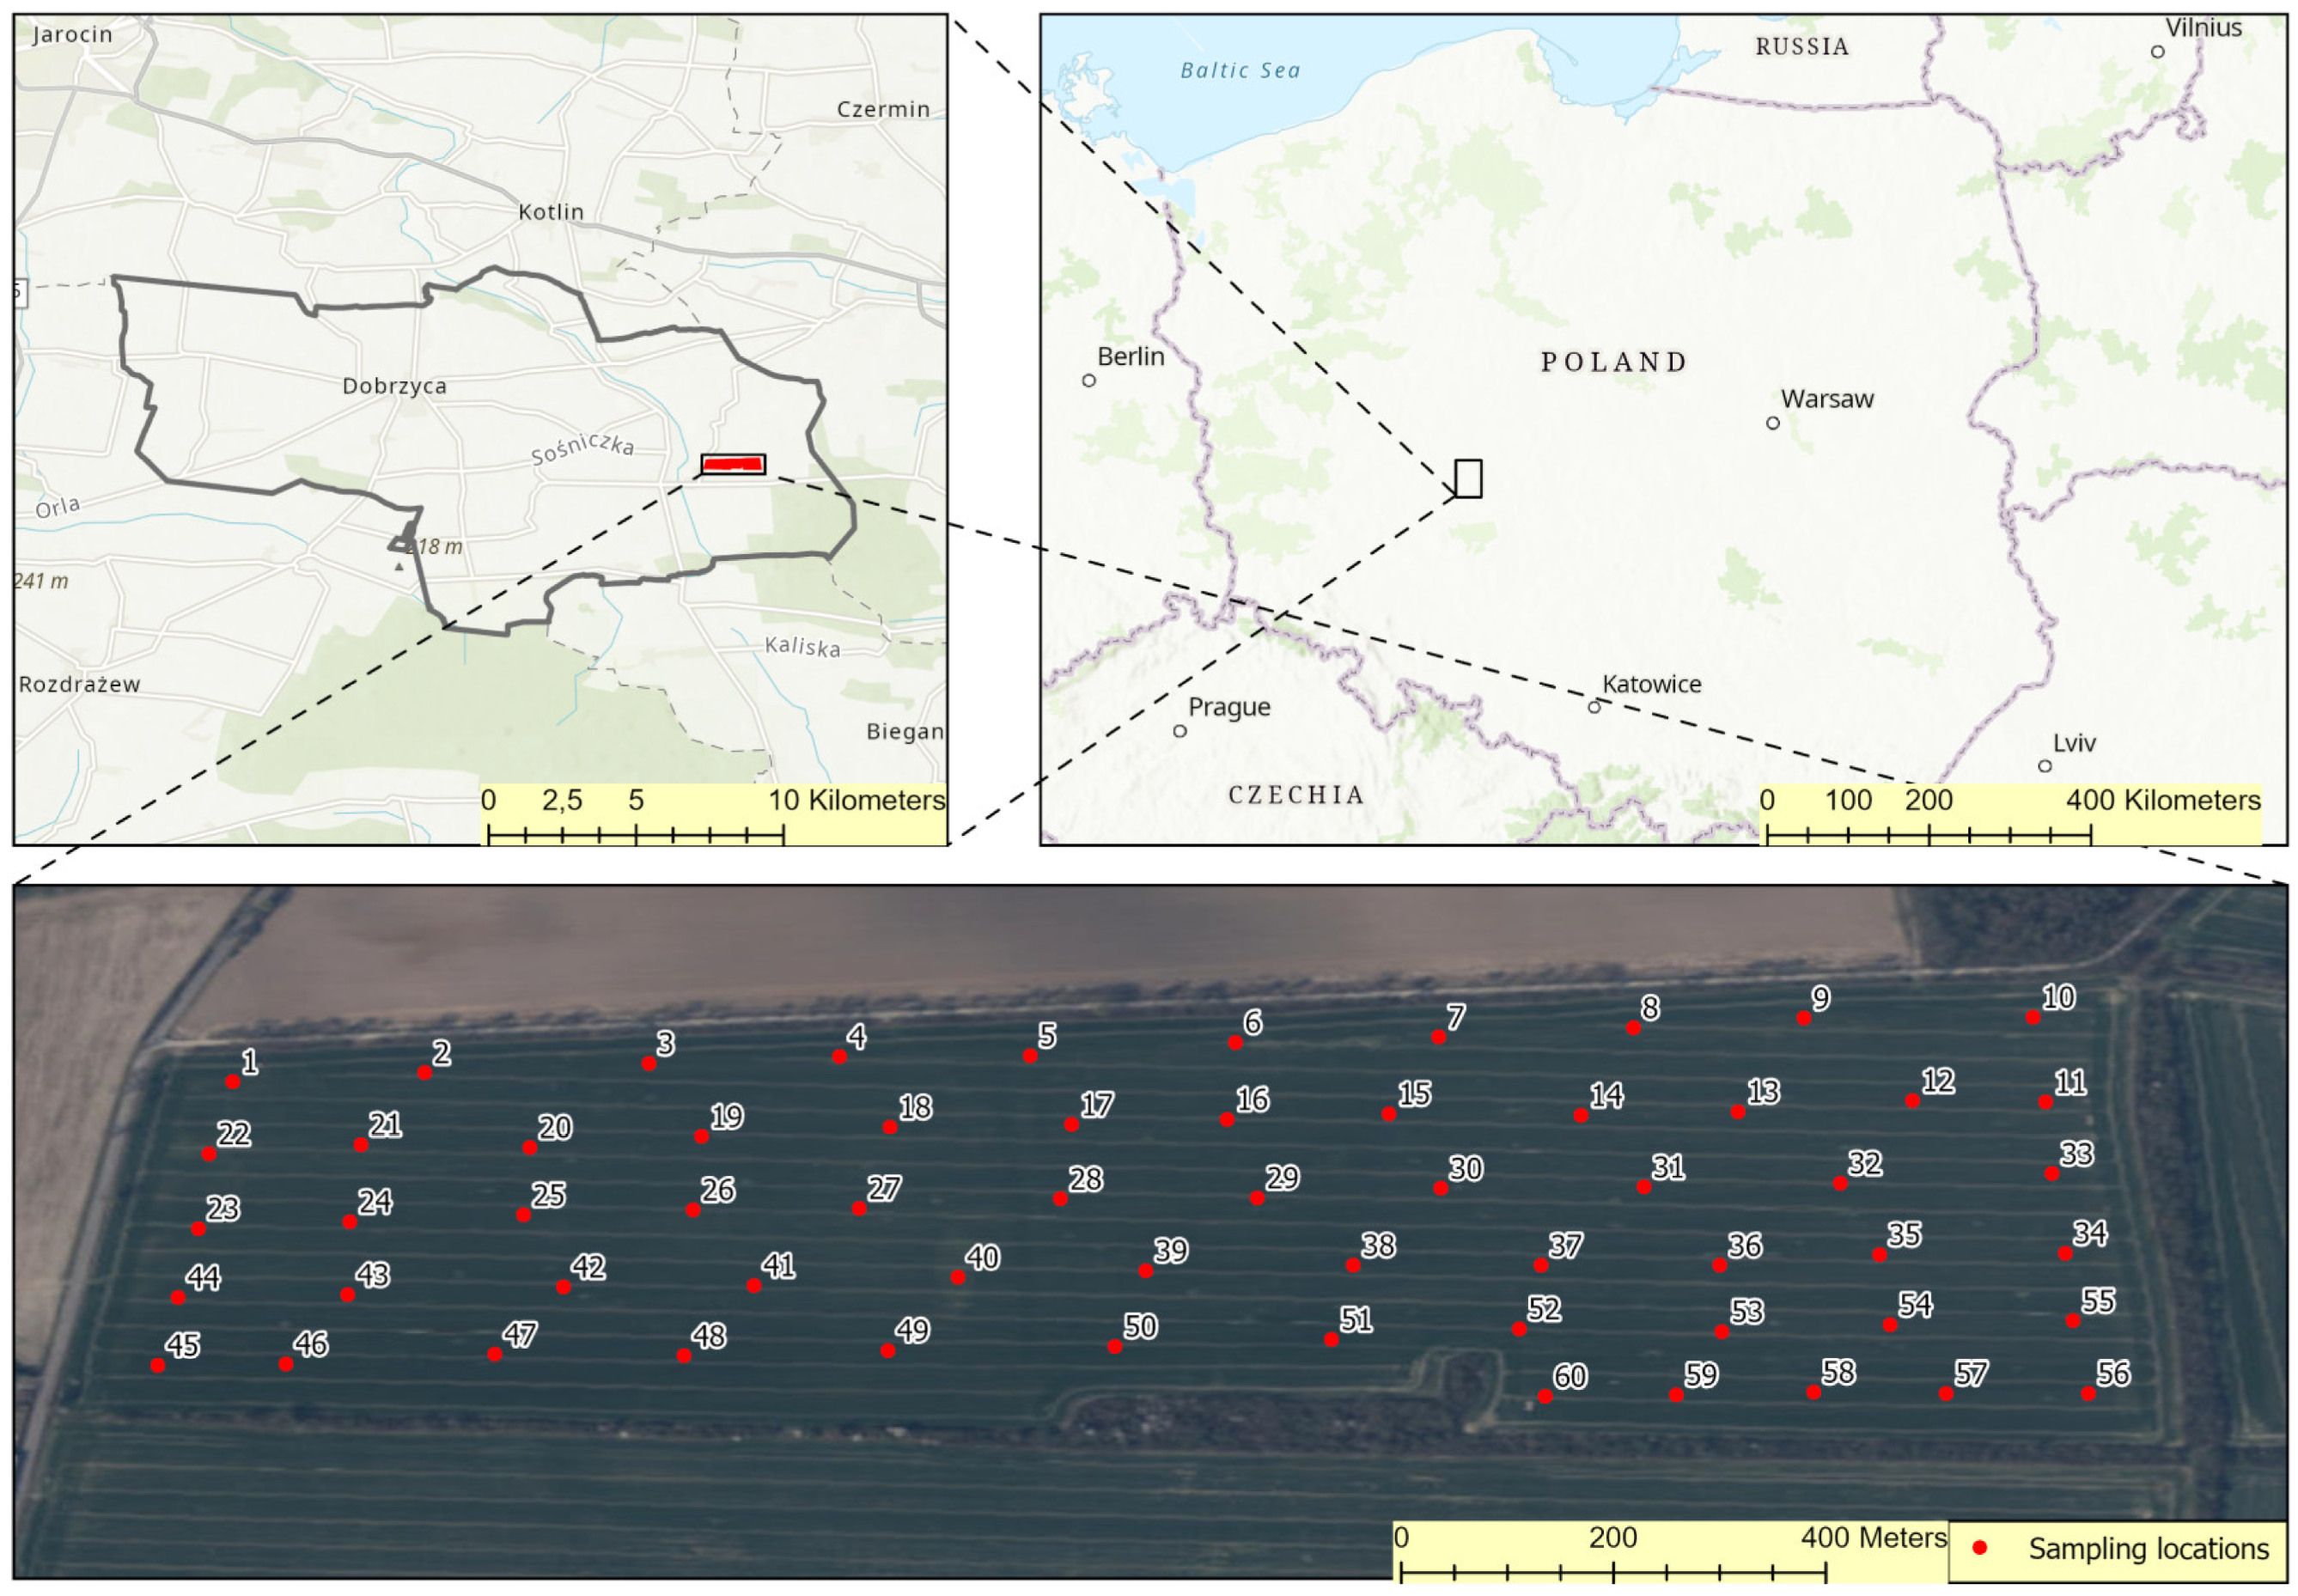
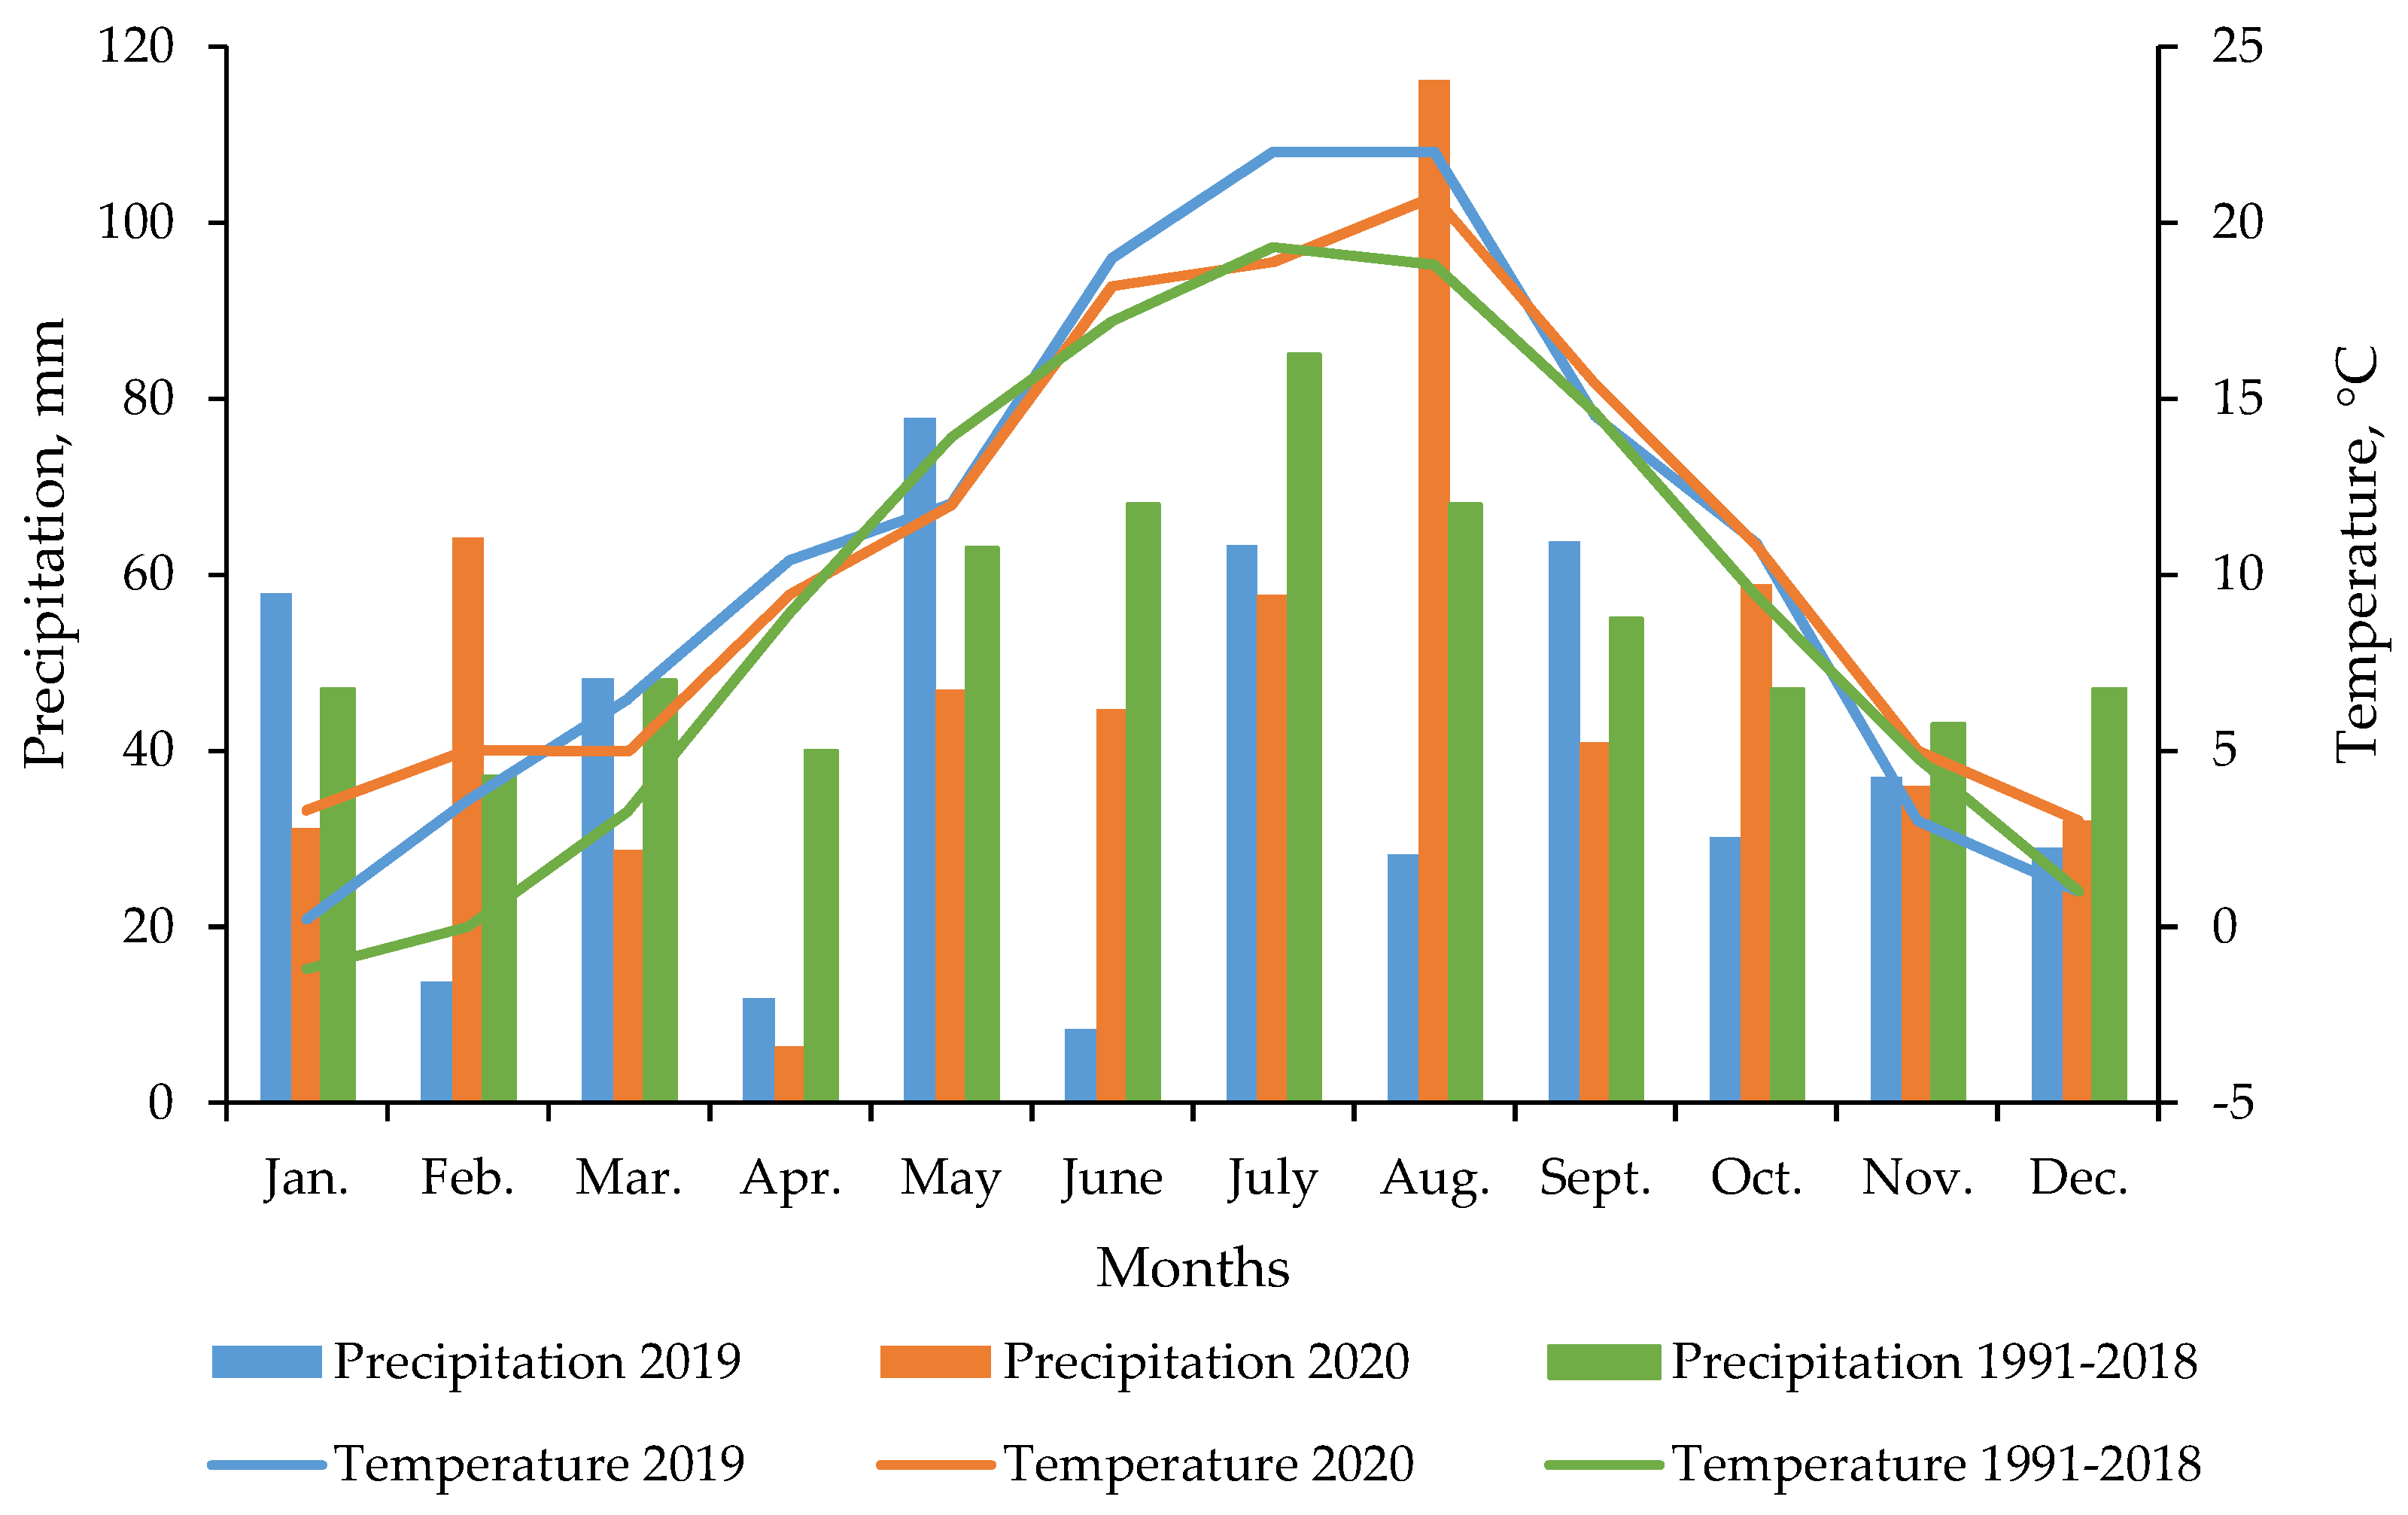
2.1. Field Location and Site Description

Field research was carried out in Karmin in central Poland (51°83′ N; 17°69′ E). Soil and crop samples were collected in two growing seasons: 2018/2019 and 2019/2020. Winter oilseed rape (Brassica napus L.) was grown in the first season, and winter wheat (Triticum aestivum L.) in the second. The field selected for analysis is part of a typical large arable farm. The area of the analyzed field is 45 ha. The location, shape, and exact dimensions of the field are shown in Figure 1.
The average altitude of the field is 70 m a.s.l., and the topography is flat with a relative slope of 0.5 m. According to the World Reference Base for Soil Resources (WRB) soil classification [36], the taxonomic unit of the soil is Haplic Luvisols, developed on postglacial sediments. The topsoil (0–30 cm) was characterized by loamy sand, and the subsoil (below 30 cm) by sandy loam. The detailed contents of the different soil particles are given in Table 1. As can be seen from the table, clay particle content was subject to the highest horizontal and vertical variability. This was particularly true of the topsoil (0–30 cm). The lowest variability, as determined by the values of the coefficient of variation (CV), was obtained for the sand fraction. The soil reaction was acidic in the topsoil and slightly acidic in the deeper soil layers [37]. Among the agrochemical parameters, this property was subject to the least variability. The total soil carbon (TSC) content in the topsoil was 12.4 g kg−1, corresponding to 21.4 g kg−1 of soil organic matter (traces of carbonates were found in the soil). The TSC content in the topsoil was subject to higher horizontal variability than in the deeper soil layers. With increasing sampling depth, the contents of plant-available forms of phosphorus (P) and potassium (K) decreased, but the contents of magnesium (Mg) and calcium (Ca) increased. According to the Polish Soil Classification system, topsoil P was in the high class, and K and Mg were in the very high class [37]. Of the nutrients assessed, the highest coefficient of variation was found for Ca in the 0–30 and 61–90 cm, and for P in the 30–60 cm soil depth (Table 1).
The field studied is located in a temperate climate zone, classified as intermediate between Atlantic and continental. In this zone, weather conditions are very variable during the growing season. This is particularly true for the distribution of rainfall over the months. The long-term mean annual precipitation was 648 mm, and the mean annual temperature was 9.2 °C. During the study years (2019, 2020), the total precipitation was lower than for many years and amounted to 469 and 564 mm, respectively. On the other hand, mean temperatures were higher than the long-term average, at 10.4 and 10.6 °C respectively. The most unfavorable conditions for vegetation were in 2019. In that year, total precipitation in June was significantly lower than the long-term average (Figure 2).

2.2. Soil Sampling

The spatial variation of soil parameters on the field was estimated based on 60 sampling points, from which soil samples were collected and taken for laboratory analysis. The coordinates of those sampling points were recorded using NTP60RTK GPS receivers with an accuracy of under 1 m. The first soil samples were taken at the beginning of August 2018, immediately after the harvest of the forecrop (winter wheat) and before the application of mineral fertilizer and sowing of winter oilseed rape. The aim was to obtain a general characterization of the soil conditions in the field, which is presented in Table 1. Subsequent sampling dates were during the growing season of rape and wheat. The sampling dates were as follows: (1) before the start of spring vegetation—28 February and 2 March 2020; (2) immediately after harvest—2 August 2019 and 22 July 2020. At each sampling point, soil samples were taken from three soil layers: 0–30, 30–60, and 60–90 cm. The bulk sample consisted of 3–5 individual samples taken close to fixed points. The total number of soil samples in the two growing seasons (rape and winter wheat) was 720. Soil samples were collected manually using an Edelmann auger manufactured by Eijkelkamp (Giesbeek, The Netherlands).

2.3. Agrotechnics Practices

Conventional cultivation methods were used for soil preparation. After the harvest of the crop preceding rape, lime (CaCO3) was applied to the whole field. This was followed by shallow stubble plowing (0.12 m) and harrowing. After 2 weeks, rape seed was sown at the same time as a full application of NPK complex fertilizer (6:20:30) using strip-till technology. The fertilizer rate was 300 kg ha−1. The doses of N, P, and K are given in Table 2. Rape seed of the hybrid variety Kuga was sown on 16 August. It is a variety with high yield potential, lodging resistance, and high oil content. The sowing density of rape was 40 seeds per 1 m2, and the row spacing was 0.45 m. At the beginning of spring regrowth, kieserite (MgSO4-H2O; 25% MgO, and 50% SO3) was applied, followed by ammonium nitrate (NH4NO3; 34% N). Ammonium nitrate fertilization was repeated at the beginning of main shoot elongation. Calendar dates for fertilization and N rates are listed in Table 2.
Before sowing wheat, standard stubble cultivation was carried out (12 cm depth + harrowing), further plowing was carried out in mid-September (25 cm depth), and then the field was harrowed. NPK complex fertilizer 6:20:30 was applied at a rate of 300 kg ha−1 before sowing. Winter wheat of the Artist variety was sown in early October. A sowing rate of 140 kg ha−1 was applied, with a row spacing of 0.125 m and a target density of 280–300 plants per 1 m2 at emergence. In spring, ammonium nitrate was applied at a total rate of 102 kg N ha−1, divided into three parts: the first N dose was applied before the start of vegetation, the second at the end of tillering and the third at the flag leaf stage (Table 2).
Irrespective of the crop grown, standard chemical protection of the plantation against weeds and pathogens was applied in each growing season, including the use of herbicides, fungicides, and insecticides, according to the principles of integrated pest management.

2.4. Plant Sampling

Winter oilseed rape was harvested by hand at the beginning of August 2019 (Table 2). The harvested area was 3 m2 (3 × 1 m2) at each sampling point. After harvest, seed, and residue yields were analyzed separately. The wheat was harvested by hand in the second half of July. The harvest area was the same as for rape. The yields of grain and straw were also measured separately.

2.5. Soil Samples Analysis

The bulk soil samples were divided into two parts. In the first, which was not dried, the Nmin content was determined. The remaining soil was dried at room temperature (20 °C). The soil was then ground in a porcelain mortar and sieved to 2 mm. The granulometric composition was determined using the Casagrande areometric method modified by Prószynski. Soil pH was measured in a 1 M KCl solution (soil/solution ratio 1:2.5, w/v). Total soil carbon (TSC) content was determined using an ELTRA CS-2000 analyzer (ELTRA GmbH, Haan, Germany). The contents of plant-available forms of P, K, Mg, and Ca were determined by the Mehlich 3 method [38]. The concentration of P in M3 extracts was measured using the ammonium molybdate method and a Jasco V-630 UV-VIS spectrophotometer (Jasco International Co., Ltd., Tokyo, Japan). The concentrations of cations (K, Mg, and Ca) in the Mehlich 3 solution were analyzed by atomic absorption spectrometry (AAS) (ThermoScientific iCE 3000 Series, Thermo Fisher Scientific Inc., Waltham, MA, USA). Soil Nmin (NH4-N and NO3-N forms) was determined in field-fresh soil samples. After the removal of stones and organic impurities, 20 g of soil samples were shaken with 100 mL of a 0.01 M CaCl2 solution; soil/solution ratio 5:1; m/v [39]. The extraction time was 1 h. Concentrations of NH4-N and NO3-N were determined by the colorimetric method using flow injection analysis (FIAstar 5000, FOSS Tecator AB, Höganäs, Sweden). The Griess–Ilosvay reaction was used to determine nitrates (V) after their reduction to nitrites (III). A mixture of three FOSS pH color indicators was used to determine ammonium nitrogen. Total soil Nmin was the sum of NH4-N and NO3-N for all soil layers (in 0–90 cm) and was expressed in kg N ha−1.

2.6. Plant Samples Analysis

The N content of the plant material was analyzed separately in seed/grain and post-harvest residues. The Kjeldahl method was used for its determination. Plant samples were burnt in concentrated sulfuric acid in the presence of a mixture of copper sulfate and potassium sulfate at 410 °C using a thermal block. This was followed by distillation using a distillation unit (FOSS Tecator AB, Höganäs, Sweden). Nitrogen accumulation in the plants was calculated, taking into account the nitrogen content and air-dry weight of the individual plant parts.

2.7. Plant Nitrogen Management Indices

The following indices were used to evaluate the nitrogen management of the test plants:
  • Total N accumulation,
Nt = Ns + Nr (kg ha−1)
2.
N harvest index,
NHI = (Ns × 100)/Nt (%)
3.
Unit N uptake,
UNU = Nt/Ys (kg t−1)
4.
Unit N productivity,
UNP = Ys/Nt (kg kg−1)
5.
Partial factor productivity of N input,
PFP = Ys/Nin (kg kg−1)
where Ys—seed/grain yield, t ha−1 or kg ha−1; Ns, Nr—amount of N in seeds/grain, and harvest residues, kg ha−1, respectively; Nin—input of N from soil and fertilizers, kg ha−1.
Field-site variability of soil N management was assessed using the following algorithms and indices [29,40]:
6.
N fertilizers balance,
Nb = Nf − Ns (kg ha−1)
7.
Efficiency of N fertilization,
NEb = (Ns × 100)/Nf (%)
8.
N input from soil and fertilizers,
Nin = Nmin/S + Nf (kg ha−1)
9.
N input balance,
Ninb = Nin − Nt (kg ha−1)
10.
N mineralized during the growing season,
Ngain = Nmin/H − Ninb (kg ha−1)
11.
Total N input,
NinT = Nin + Ngain (kg ha−1)
12.
N input efficiency,
NEin = (Ns/Nin) × 100 (%)
13.
Total N input efficiency,
NEin = (Ns/Nin) × 100 (%)
where Nf —amount of N in mineral fertilizers, kg ha−1; Ns—amount of N in seeds/grain, kg ha−1; Nt—total N uptake, kg ha−1; Nmin/S—the amount of soil mineral N at the spring regrowth in 0–90 cm soil depth, kg ha−1; Nmin/H —the amount of soil mineral N after crop harvest in 0–90 cm soil depth, kg ha−1.

2.8. Statistical and Spatial Variation Analyses

Descriptive statistics were used to assess the variability of the parameters and indices studied, such as mean, minimum, maximum, standard deviation, skewness, kurtosis, and coefficient of variation (CV). The evaluation of the variables based on the CV was carried out using the ranges proposed by Wilding and Drees [41]. According to the proposed ranges, CV < 15% is considered low, 15% < CV < 35% moderate, and > 35% high sample variation. The normality of the distribution of certain characteristics was assessed using the Kolmogorov–Smirnov (K–S) test. The distribution of variables was also assessed, taking into account the critical values of skewness and kurtosis calculated using the Monte Carlo method for a population of n = 60 and for α = 0.05 [42]. The Mann–Whitney U test was used to evaluate statistical differences between the two groups of dataset (spring vs. harvest or rape vs. wheat). Output from this test is shown in the level of significance (p-value).
Relationships between parameters were analyzed using stepwise backward multiple regression and principal component analysis (PCA). Regarding the PCA method, principal components (PCs) with eigenvalues ≥ 1 were considered for further analysis. In addition, the variables whose PC loadings explained at least 50% of the variability were used to interpret the PCs, where the active variables are marked, as well as the variables treated as supplementary (dependent) variables. Basic statistical analyses and PCA were performed using Statistica 13.3 software (StatSoft, Inc., Tulsa, OK, USA, 2013).
The spatial variation of the variables was calculated using the Random Trees Regression Model, estimating them based on satellite data from PlanetScope. The PlanetScope is a flock of miniature satellites that collect data in the form of multispectral imagery, consisting of RGB and Near-Infrared bands, with 3 m spatial resolution and one day of revisit time. Access to the PlanetScope data was granted through the Education and Research Program (https://www.planet.com/industries/education-and-research/, accessed on 7 May 2024). Firstly, the satellite imagery was downloaded, and the reflectance values for each satellite band from the sampled locations were collected. Then, the statistical relationship between them and soil variables was calculated using the Train Random Trees Regression Model tool from the Image Analyst Toolbox in ArcGIS Pro. In each case, the procedure outputs the coefficient of determination calculated on the points that were randomly selected as testing samples (20% of all samples) and the relative importance of explanatory variables in contribution to predicting the target variable. After the relationship between explanatory variables and a target dataset was obtained, the Predict Using Regression Model tool was used to predict variable values in the non-sampled locations using the multiple regression method. The predictions were obtained as raster files with the same spatial resolution as a source product (3 m). Before the publication of the final maps, the resulting prediction rasters were smoothed with a 4 × 4 Cubic spatial filter, reducing the noise and improving the readability of the data.

3. Results

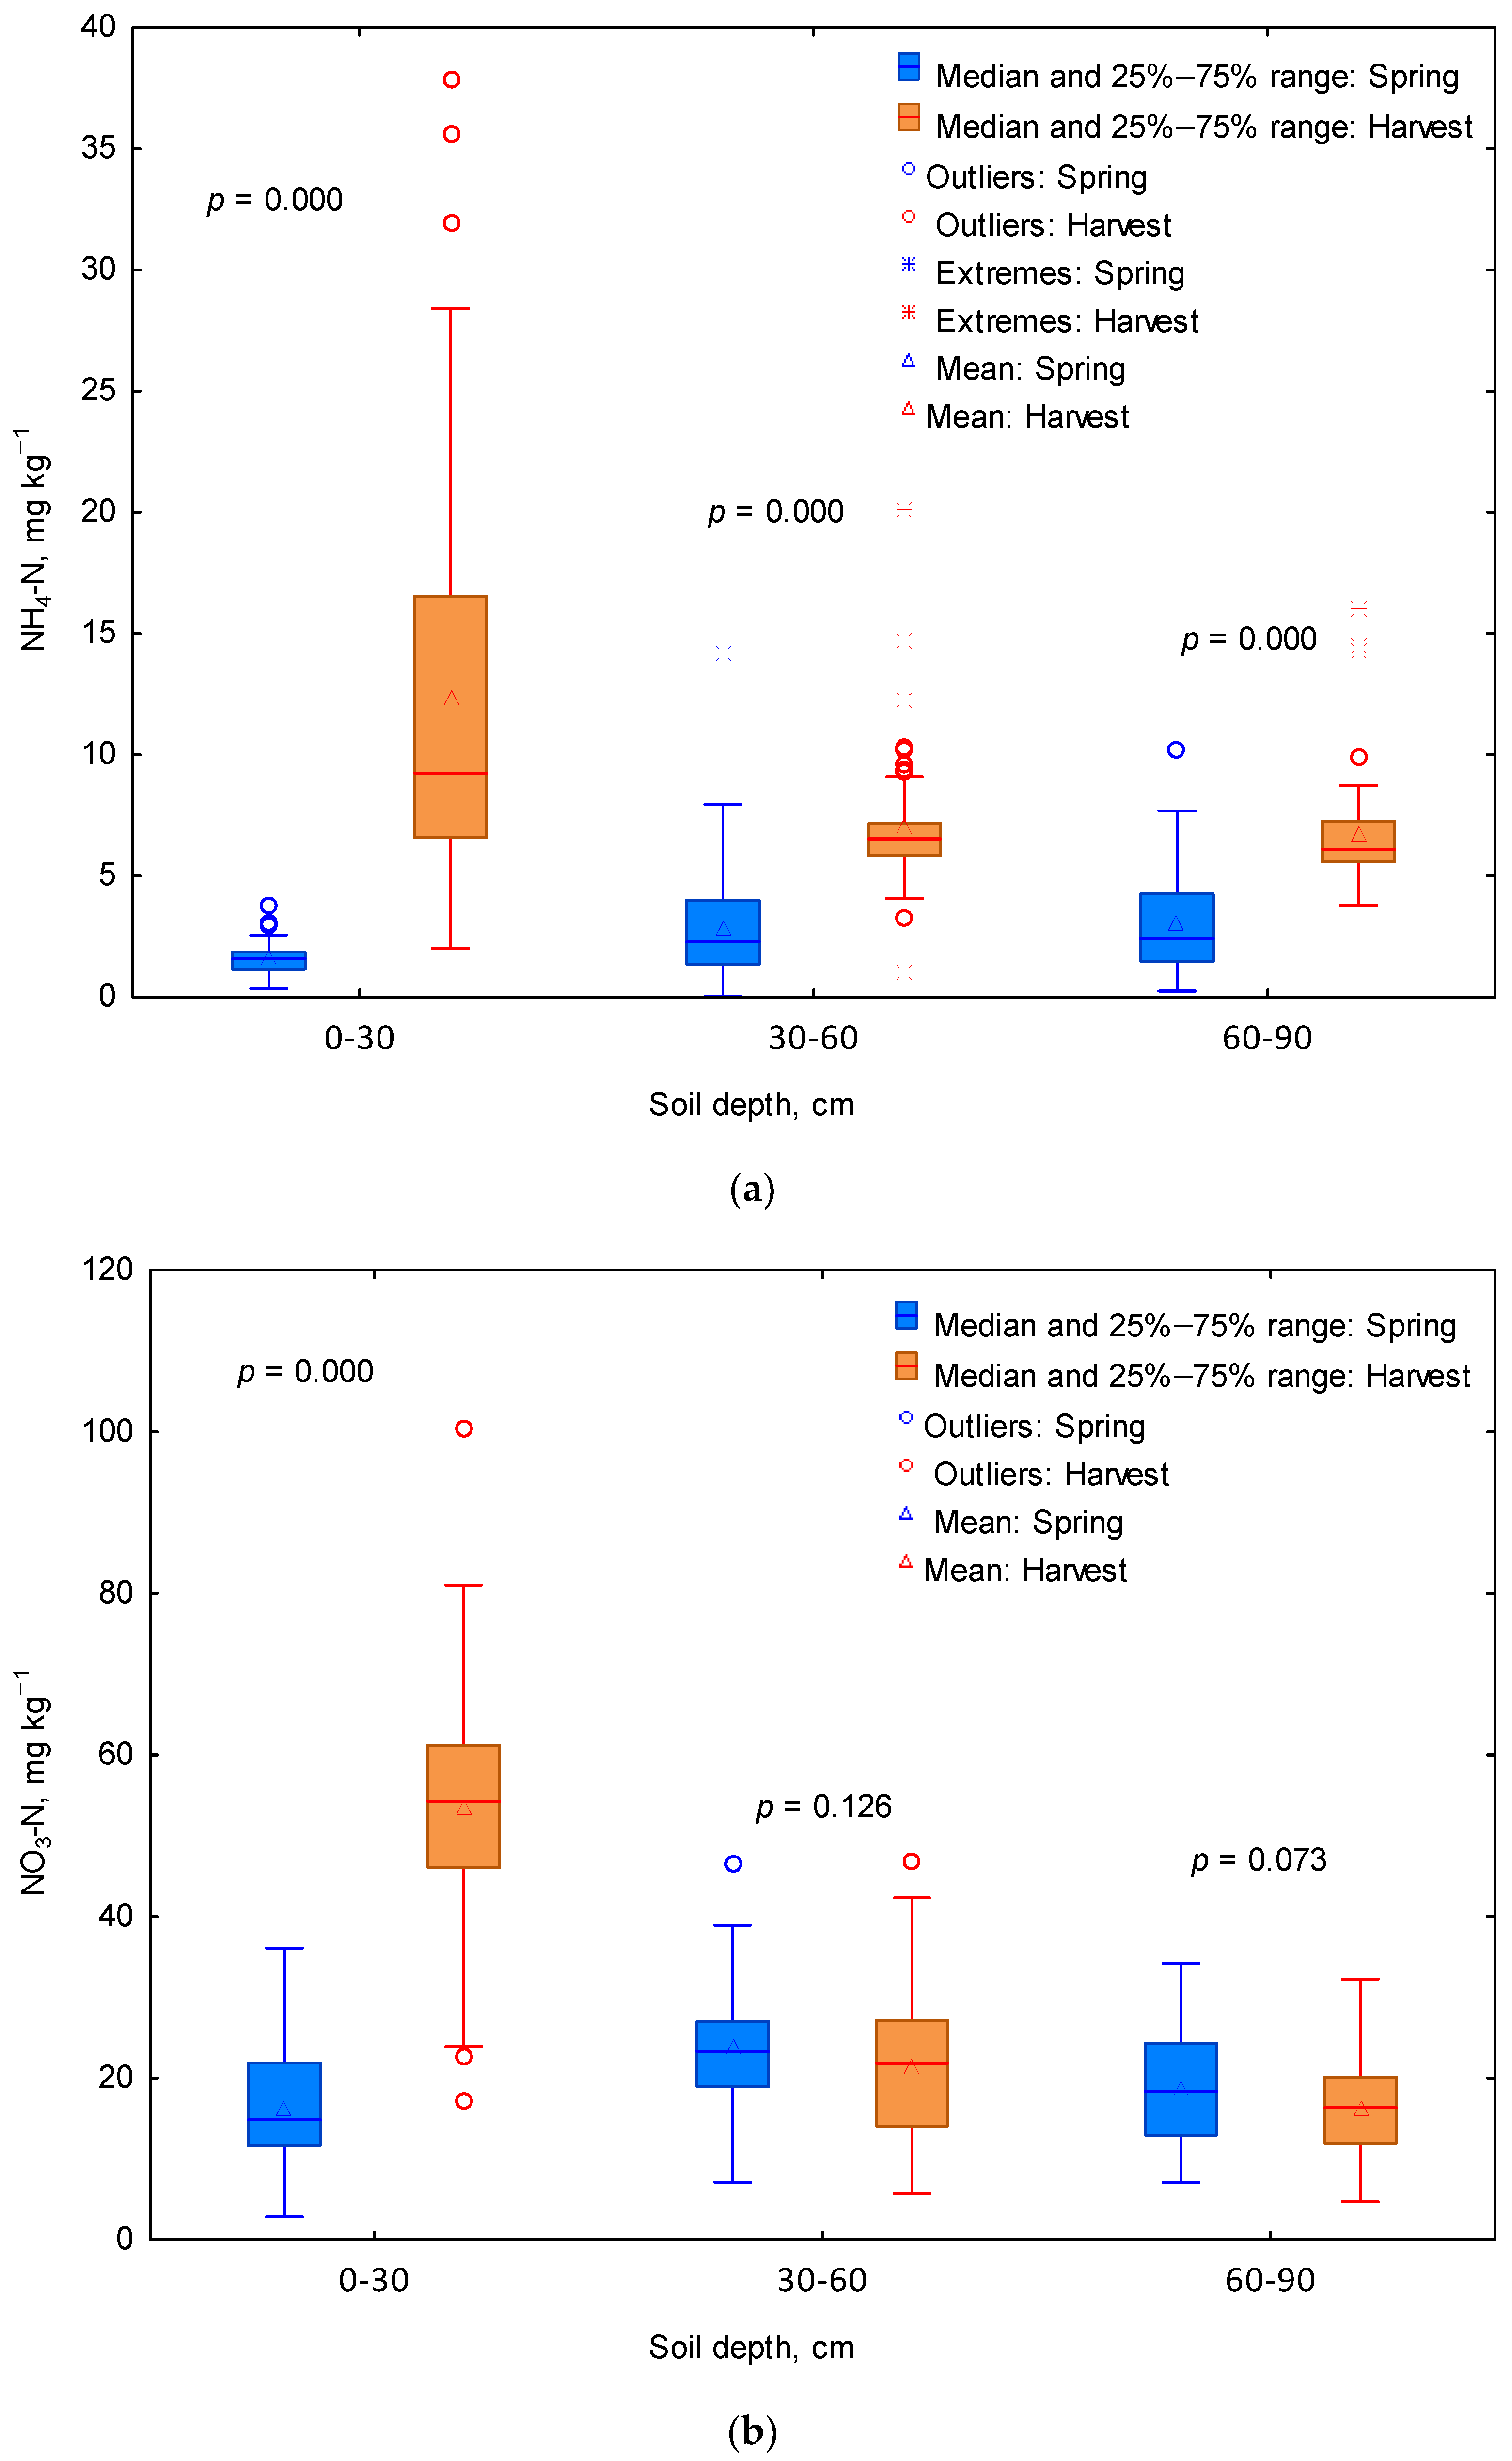
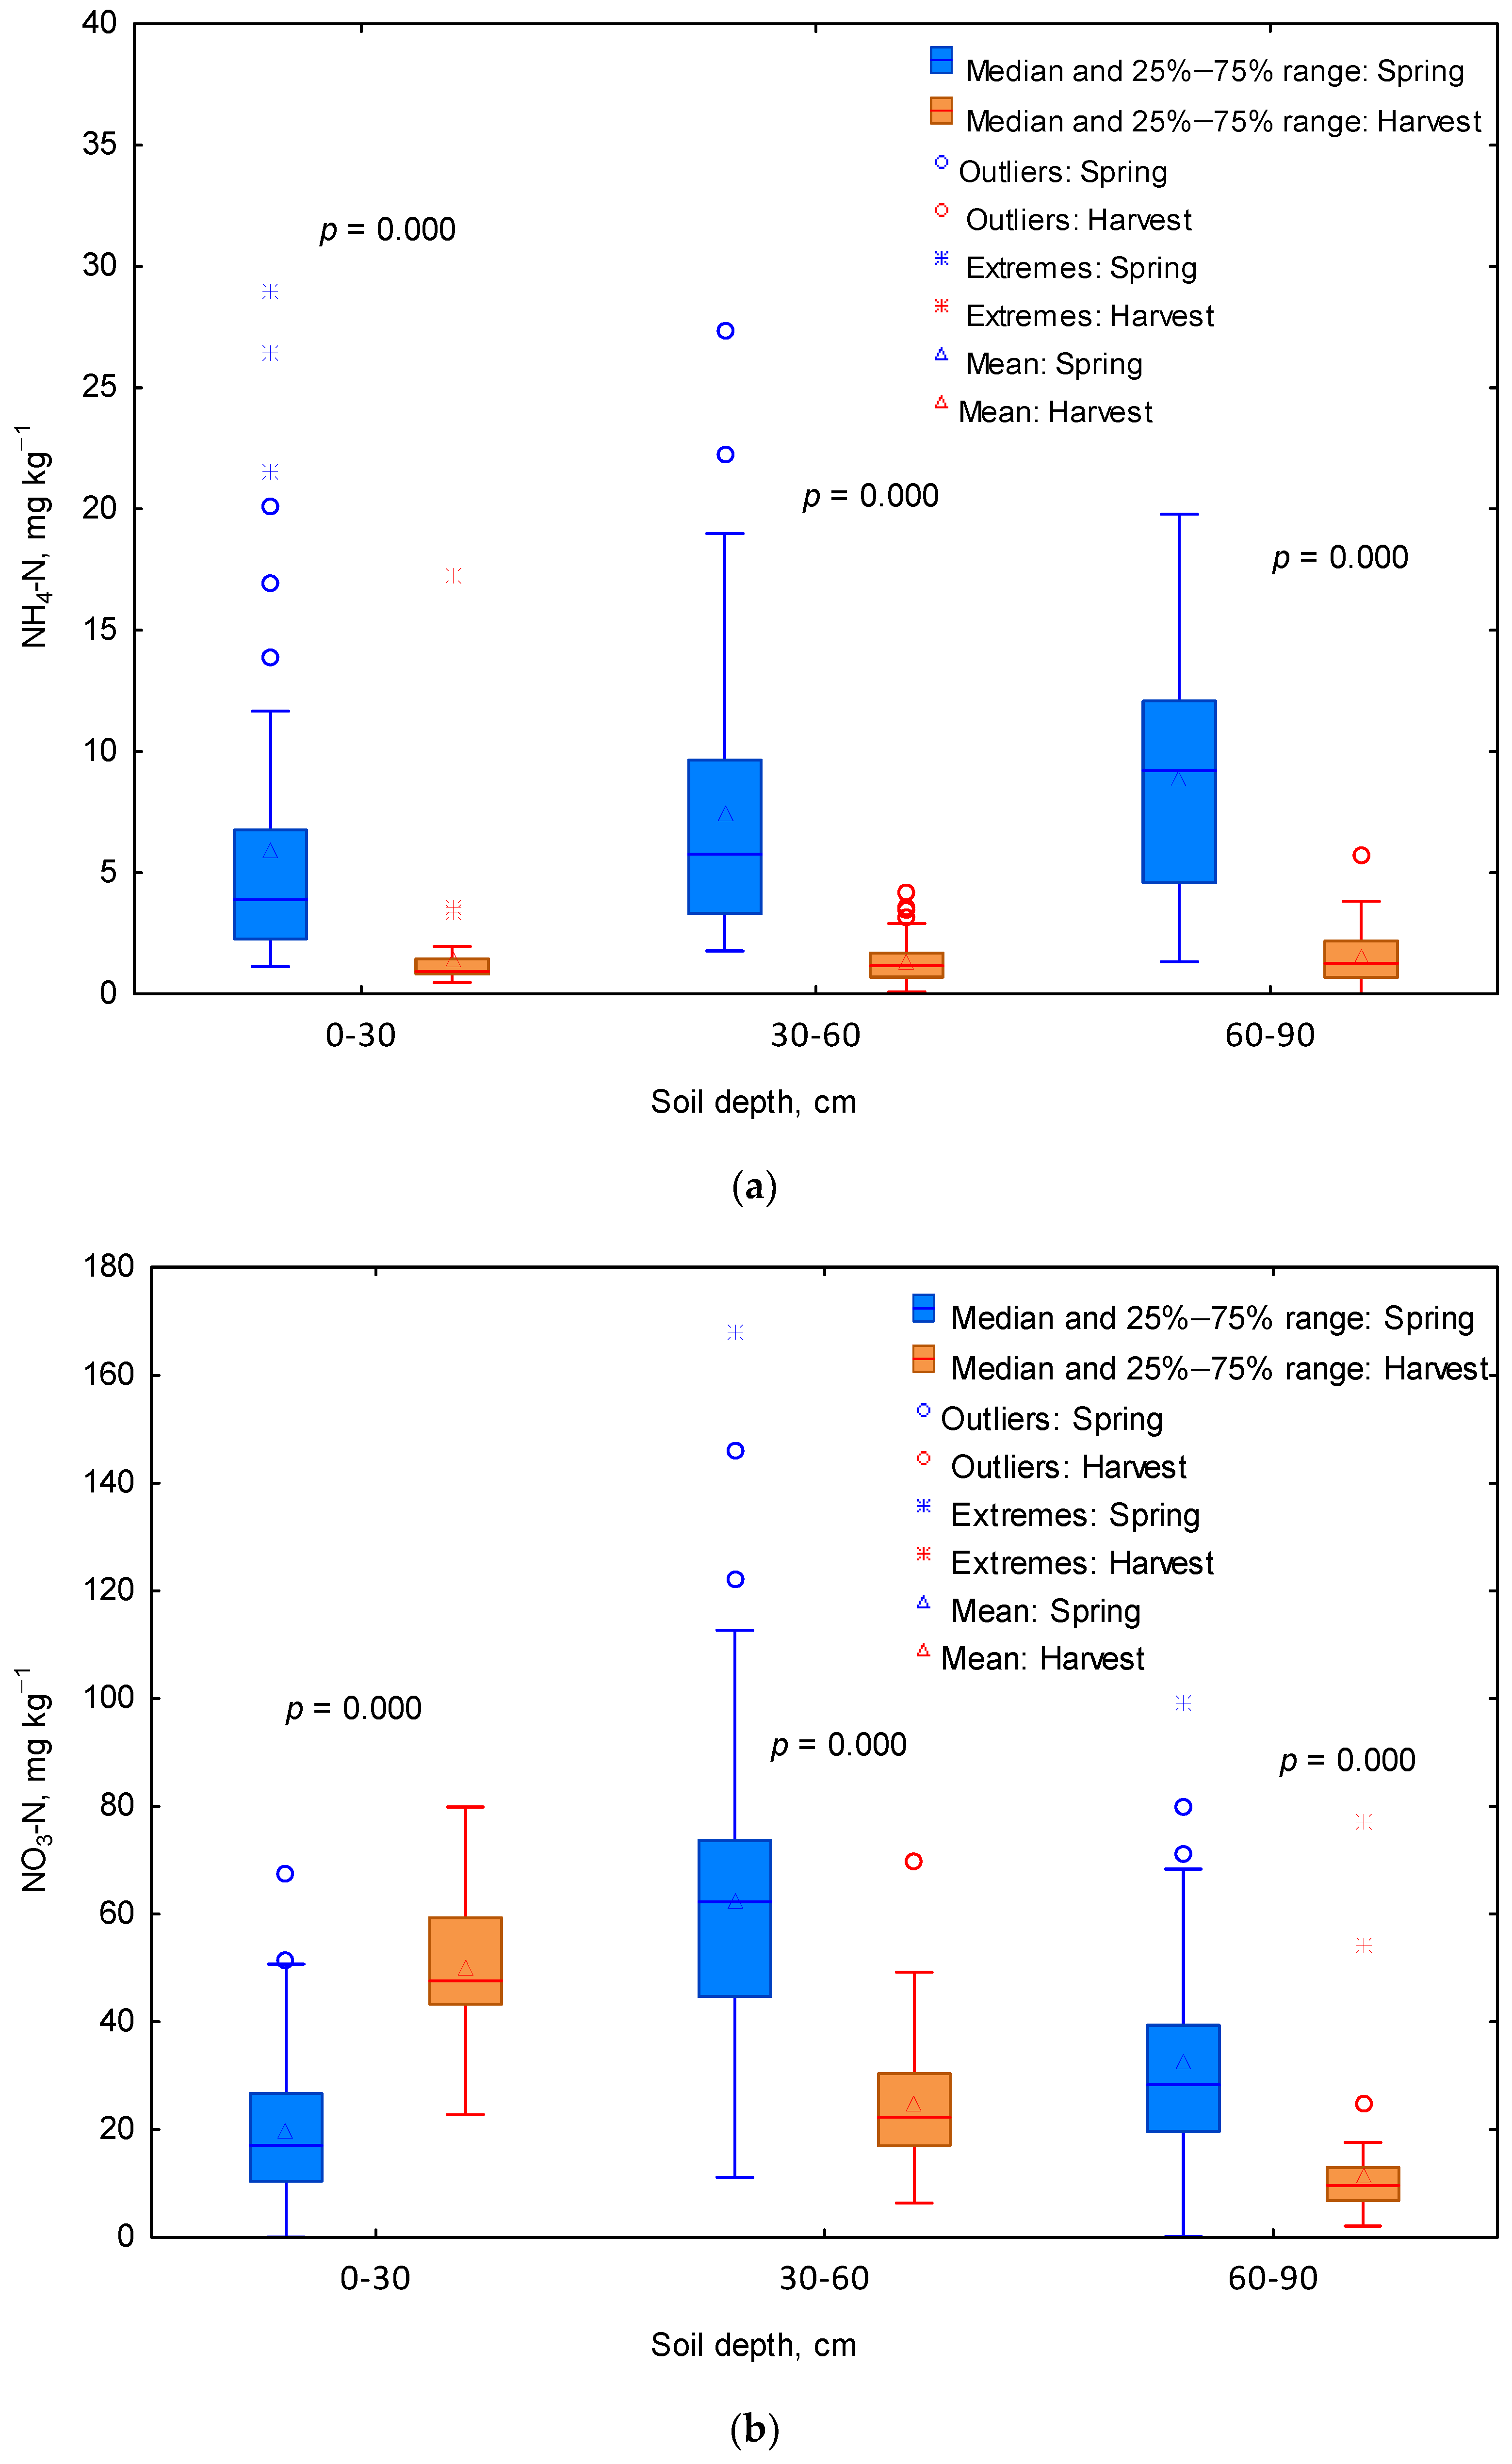
3.1. Mineral N Content of the Soil

The NH4-N content of the soil at the beginning of the rape growing season was between 1.6–3.0 kg ha−1. The greatest variability in NH4-N content was found in the 30–60 cm soil depth (coefficient of variation, CV, was 79.7%). The lowest CV value was found in the 0–30 cm soil depth (39.2%). After the harvest of rape, NH4-N content increased significantly compared to spring (Figure 3a). The highest increase in average NH4-N content was found in the 0–30 cm soil depth. It was 10.8 kg ha−1 (Figure 3a). In the other two layers (30–60 and 60–90 cm), the increase in NH4-N was lower, 4.1 and 3.7 kg ha−1, respectively. The 0–30 cm soil depth also showed the highest variability in NH4-N content (CV = 65.1%). Furthermore, there was a clear difference between the mean and the median, indicating a positively skewed distribution of the data. The data were not normally distributed. In the other layers, the CVs were 33.3% and 37.6%.
The NO3-N content in spring ranged from 16.1–23.8 kg ha−1 (Figure 3b). The NO3-N content was the most variable in the 0–30 cm soil depth (CV = 45.3%) and the least variable in the 30–60 cm soil depth (CV = 29.5%). After the rape harvest, the soil NO3-N content in the 0–30 cm soil depth increased more than 3-fold. In contrast, the NO3-N content in the other, deeper soil layers decreased insignificantly (Figure 3b).
In the season with wheat, the NH4-N content ranges from 6.0 to 8.9 kg ha−1 (Figure 4a). There was also a trend for the NH4-N content to increase with soil sampling depth. In contrast to the first season, the highest variability of NH4-N was found in the 0–30 cm soil depth (CV = 99.4%). Another difference was the decrease of the NH4-N content in the soil after the crop harvest. At the same time, the CV values for this form of N increased (67.3–147.3%).
A different nitrate profile was observed in the wheat season compared to the rape season. There was a clear dominance of NO3-N in the 30–60 cm soil layer (CV = 77.1%). After the wheat harvest, the NO3-N content in the 0–30 cm soil depth increased by 30.4 kg ha−1. However, in the other two soil layers, the amount of this form of N decreased by 37.8 and 20.9 kg ha−1 (Figure 4b).
The total Nmin content showed less horizontal variation in the field than the NH4-N and NO3-N content in specific soil layers, irrespective of the growing season (Table 3). In the season with rape, total mineral nitrogen (sum of NH4-N and NO3-N in 0–90 cm soil depth) in spring averaged 66.6 kg ha−1. It increased by +76.8% after the rape harvest. In the wheat season, an average of 137.3 kg ha−1 Nmin was found in the soil in spring. In contrast to the season with rape, the Nmin content decreased significantly by 34.2% after the winter wheat harvest (Table 3).
At the beginning of 2019, the total Nmin content of the soil (0–90 cm) was only determined by nitrate:
Nmin/S = 5.82 + 1.04 NO3-N/0–30 + 1.04 NO3-N/30–60 + 1.01 NO3-N/60–90; R2 = 0.94; p < 0.001.
After rape harvest, NH4-N in 0–30 cm soil depth was also a significant component of the regression equation explaining total Nmin content:
Nmin/H = 27.5 + 0.93 NO3-N/0–30 + 1.38 NO3-N/30–60 + 0.87 NH4-N/0–30; R2 = 0.89; p < 0.001.
The total Nmin content in the spring of 2020 was dependent on the nitrate content in all soil depths:
Nmin/S = 17.5 + 1.30 NO3-N/0–30 + 1.00 NO3-N/30–60 + 0.96 NO3-N/30–60; R2 = 0.94; p < 0.001.
In contrast, after the wheat harvest, the total Nmin content was determined only by the NO3-N content in the first two layers:
Nmin/H = −1.27 + 1.13 NO3-N/0–30 + 1.41 NO3-N/30–60; R2 = 0.88; p < 0.001.

3.2. Crop Yields and Indices of N Management

Descriptive statistics characterizing the yield levels of the crops tested are presented in Table 4 and Table 5. For rape, the CV values for seed yield (Ys) and crop residues (Yr) were 23.5 and 32.2%, respectively. This indicates a medium level of variability in the collected data. At the same time, the maximum Ys of rape was 2.6 times higher than the minimum, and the maximum Yr was 3.8 times higher than the minimum. The variables representing Ys and Yr had an almost normal distribution. The values of skewness did not exceed the critical value of 0.59 and kurtosis ±1.0 [41]. In addition, the median values were close to the mean. N accumulation in rape was characterized by moderate CV values. N accumulation in seeds (Ns) had an almost normal distribution. In contrast to this parameter, N accumulation in crop residues (Nr) did not have a normal distribution, as evidenced by the significant value of the K–S test, as well as the values of skewness and kurtosis, which exceeded the limits. Among the crop N management indices, the lowest CV values were found for NHI and UNP. Both parameters were characterized by a normal distribution (Table 4).
The variability of grain and straw yields of winter wheat was lower than the rape. The CV values of less than 15% indicate a low variability for these characteristics. In addition, the distribution of the characteristics studied for winter wheat was closer to normal than for rape. This also applies to the parameters that describe N accumulation in grain and crop residues (Table 5).
Total nitrogen accumulation (Nt) in wheat was lower than in rape (p = 0.028). This was due to lower N accumulation in the wheat crop residues (p = 0.000). The amount of N in rape seed and wheat grain was similar (p = 0.743). This explains the slightly higher NHI value for wheat compared to rape. At the same time, the UNU was lower, but UNP and PFP were higher in wheat than in oilseed rape (for all traits p < 0.05). The distribution of the N management indices in wheat was close to normal. Only the kurtosis for NHI met the threshold for accepting a normal distribution (Table 5).
The relationships between the parameters were assessed using the PCA method (Figure 5). For the first growing season, two principal components were identified, which explained 92.9% of the total variability in the data. The first factor (PC1) explained up to 62.9% of the variability in the results. With an R2 value > 0.50, parameters such as Ys, Yr, Ns, Nr, Nt, and PFP were significant contributors to the variable. On the other hand, the PC2 component was associated with NHI, UNU, and UNP. The first group of variables formed a distinct cluster. Among the other parameters, a positive correlation was found between NHI and UNP, but a negative correlation between UNP and UNA (Figure 5a).
In the wheat season, the number of components explaining the variability in the data was 3. Together, they explained 88.3% of the total variability. Two, PC1 and PC2, were selected to project the relationship, explaining 74.5% of the total variability. Component PC1 was formed by parameters describing yield and N accumulation in plants, and PC2 by variables representing UNU and UNP (Figure 5b).

3.3. Soil N Management Indices

Parameters characterizing soil N management during the growing season with winter rape showed greater variation in CV values than in plant indices (Table 6). A high variability of data was obtained for the parameter Nb. The Nb values ranged from negative to positive. At the same time, the distribution was close to normal, with a slight shift to the right. The average N surplus from fertilizer was 19.0 kg ha−1. The efficiency of N use from fertilizers was high at 88%. The parameter Ninb, which is the difference between the total N supply (from soil and fertilizers) and the total N accumulation in plants, was even more variable. Nevertheless, the distribution of Ninb was close to normal, with low values of kurtosis and skewness. A negative value for skewness indicates left-handed asymmetry. A high variability of results was also obtained for Ngain, a parameter related to organic N mineralization during the growing season. The values of this parameter ranged from −29.6 to 334.1 kg ha−1. The mean value amounted to 122.7 kg ha−1. This high level of Nmin release from the soil resources resulted in a 51.9% increase in the mean value of NinT compared to that obtained for Nin. In addition, the CV for this parameter was higher compared to Nin but within the range defined as mean variability. In contrast, a low variability of less than 15% was obtained for the NEinT parameter.
During the growing season of winter wheat, high variability of results was obtained for the following parameters: Nb, Ninb, and Ngain (Table 7). A negative average Nb value, as well as Ninb values greater than 100%, indicate that more N was accumulated in the grain than was added to the soil in the form of mineral fertilizer. The soil was, therefore, an important source of N supply for the wheat plants during the growing season. Nitrogen input (Nin) from fertilizer and soil in spring was similar to that in rape (p = 0.111). However, N mineralization was lower, as indicated by the Ngain value. The difference was almost double. Therefore, the average total N gain was also lower. It is interesting to note that some parameters characterizing N use efficiency (NEb and NEinT) were significantly different from those obtained to those for rape (p = 0.000). Only NEin was at a comparable level (p = 0.711). It should also be added that in the winter wheat season, the distribution of all variables was close to normal. No significant K–S test values were obtained. The data set for Ngain deviated most from a normal distribution due to the high value of the kurtosis. It was greater than 2, indicating that the intensity of the extreme values was greater than in a normal distribution (Table 7).
Of the soil parameters, two PCA components explained 88.5% of the variability of the data during the first growing season. PC1 included variables associated with Nb, NEb, Ninb, Ngain, NinT, and NEin. PC2 was significantly associated with one variable, NEinT. Several parameters were positively associated with each other and formed a distinct cluster. These parameters were Ngain, NinT, Yr, NEin, NEb, and Ys (Figure 5c). The variables representing Nb and Ninb were negatively correlated with this group. Two components also explained the variation of the soil indices during the season with winter wheat. PC1 was associated with parameters such as Nb, NEb, Ninb, Ngain, NinT, and NEin. PC2 was formed by a variable representing Nin. Together, the two variables explained 86.7% of the total variation. NEinT was most positively associated with seed yield and crop residues. NEb and NinT were also positively related to grain yield. At the same time, this group of variables was negatively correlated with Nb. A negative relationship was also found between Ngain, NEin, and Ninb (Figure 5d).

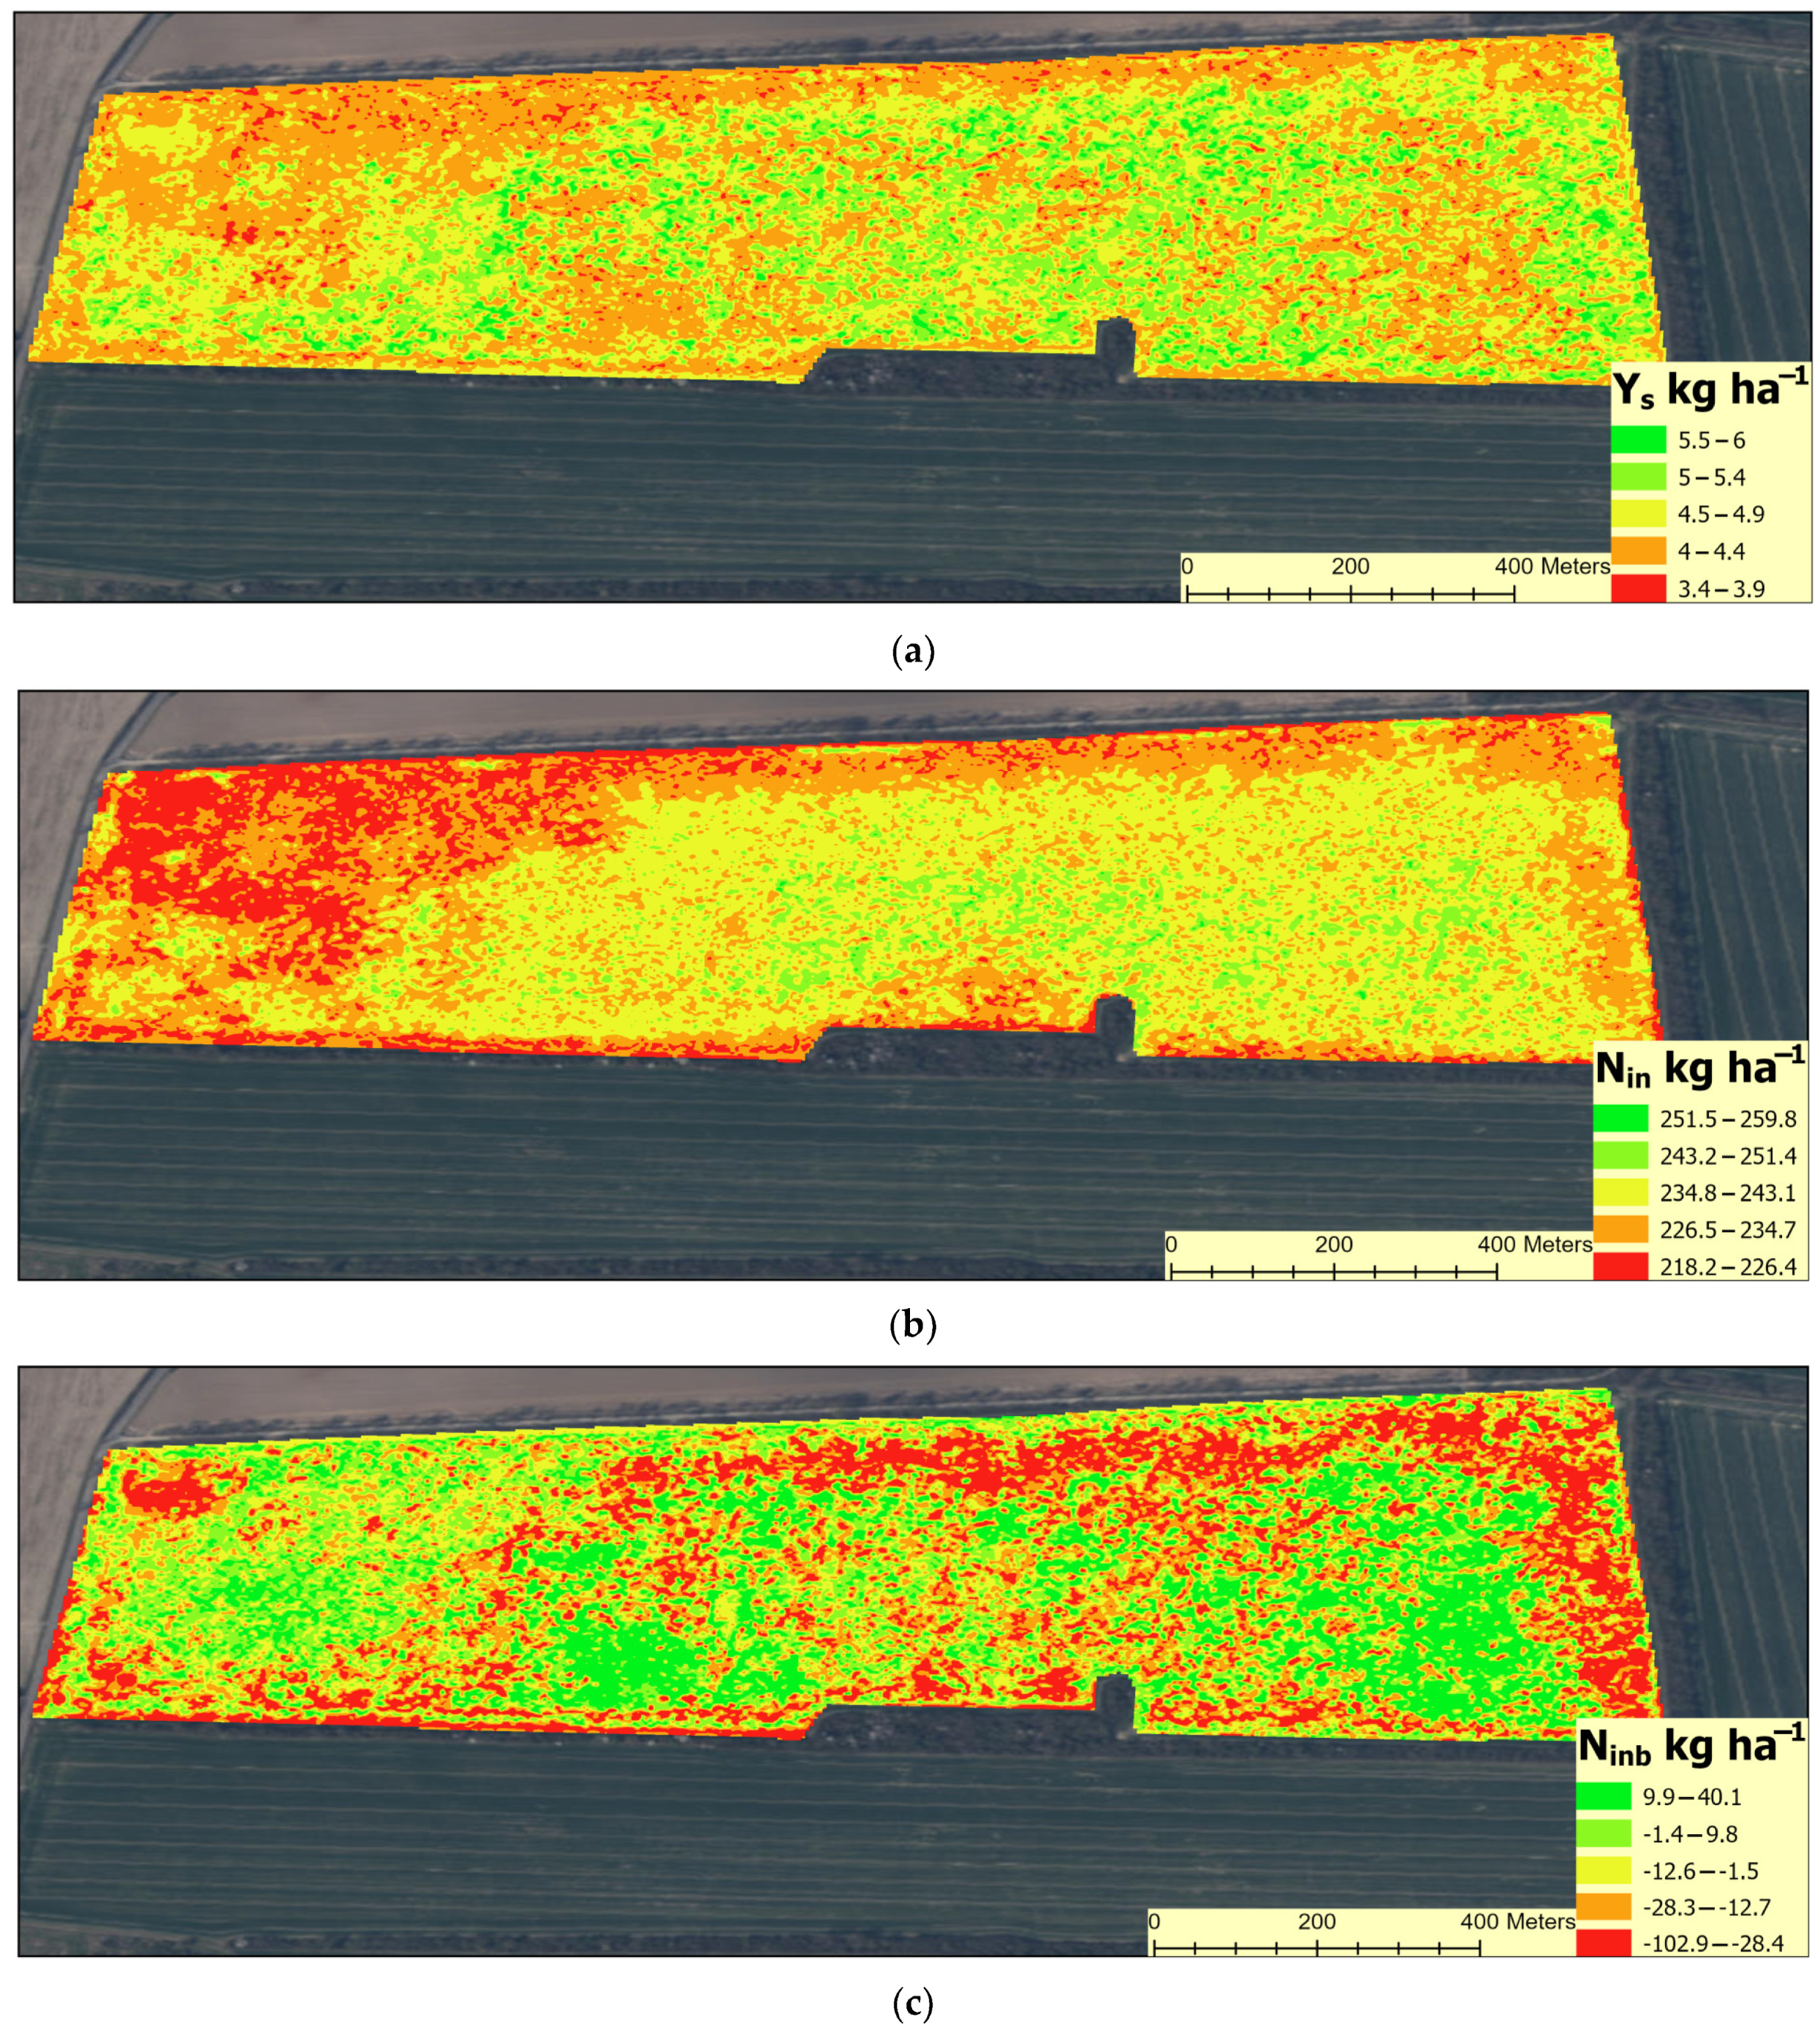
3.4. Spatial Variability of Crop Yield and N Management Indices

Two PlanetScope scenes were obtained, from 30 June 2019 and 27 July 2020, to model the spatial variability of soil parameters under the cultivation of rape and wheat, respectively. These were the first clear scenes obtained after harvesting the respective plants. The results of the regression modeling of the chosen variables are shown in Table 8, with most of these variables having a coefficient of determination (R2) calculated by a cross-validation procedure between 0.6 and 0.7. The most important bands varied for particular soil variables; interestingly, Band 2 (green) was found to be the most important overall, with the second most important being Band 4 (Near-Infrared).
The maps of the spatial distribution of Nin, Ninb, Ys, and Yg, where high values of a given property are depicted in green and low values in red, show the varying spatial distribution of the analyzed parameters. The Nin distribution differs significantly between seasons for rape and wheat. In the rape season, most low values are concentrated on the western side of the field, with high values concentrated in a belt located on the southwestern side. In the wheat season, Nin values were generally lower, except for a narrow band around the field where the values were higher. For Ninb, in the rape season, two areas of high values were found on the western and eastern sides of the field, while the distribution in the wheat season is more uniform, with the highest values on the outskirts of the field. Yield in 2019 (rape) was spatially varied, with the northwestern part of the field being less productive than the rest (Figure 6). The map showing yield distribution in 2020 (wheat) is generally uniform, except for spots of low yield, mostly in the northern and southern parts of the field (Figure 7).

4. Discussion

4.1. Soil Mineral N Content

The content and distribution of Nmin in the soil profile are the result of the interaction of a number of factors related to phenomena such as nitrogen uptake by plants, fertilization, mineralization, immobilization, leaching, and denitrification [43,44,45,46]. In our study, we found a very high variability in the content of mineral forms of nitrogen in individual soil layers. In general, the CV values for NH4-N were higher than those for NO3-N, especially in the arable layer. Such a result can be directly related to the dynamics of nitrogen release from organic residues and the transformation of this form of nitrogen, also from mineral fertilizers, into nitrates. Regardless of the growing season and crop, the accumulation of nitrogen forms in the entire soil profile led to a reduction of the CV coefficient to an average level (15–35%). At the same time, slightly higher CV values were obtained for winter wheat than for winter oilseed rape. According to the literature, the type of cropping system is one of the most important factors influencing soil Nmin [47]. In a winter wheat-winter oilseed rape-winter wheat rotation, the second crop contributes a greater biomass of crop residues to the soil, which are also richer in N. In the studies carried out, a higher Nmin content was found after the rape harvest than after the wheat harvest. The lower C:N ratio in the rape straw favored the mineralization of organic matter. At the same time, the higher organic N input differentiated the intensity of N cycling in the soil (in the field). Research shows that the activity of soil micro-organisms displays very high variability in the field, even at distances measured in centimeters, which is determined by the different physical and chemical properties of the soil [48].
In general, NH4-N content decreases with depth in the soil profile [49]. In our study, at the beginning of the growing season, the opposite trend was observed, regardless of the year of the study. The average NH4-N content in the 60–90 cm layer was significantly higher than in the 0–30 cm soil depth. The reason for this phenomenon could be the fixation of NH4+ ions by interlayers of 2:1 clay minerals. This form of nitrogen is poorly available to plants and also less susceptible to oxidation to nitrate [50]. Furthermore, NH4+ ions easily move to deeper soil layers in acidic soils characterized by a small cation exchange capacity, CEC [51]. Liming in autumn 2018 may also have increased the mobility of NH4+ ions due to competition with Ca2+ ions for binding sites in CEC. In contrast, a typical profile of soil NH4-N content was obtained after the rape harvest. The highest NH4-N content was found in the topsoil as a result of the ammonification of plant residues, most likely the pre-crop wheat residues [52]. At the same time, NH4-N was subject to nitrification, resulting in a pronounced accumulation of NO3-N in the 0–30 cm soil depth [53]. At the beginning of spring regrowth of rape, the total Nmin content of the soil was only determined by nitrate (Equation (14)). In the summer, after mineralization and ammonification, NH4-N in 0–30 cm soil depth was also a significant component of the regression equation explaining Nmin content (Equation (15)). In spring 2020 (wheat), not only was there an increase in the soil NO3-N content compared to 2019, but also in its specific content profile. Indeed, the highest NO3-N content was found in the 30–60 cm layer, followed by the 60–90 cm layer. This result confirms the leaching of NO3-N from the surface soil layers during the autumn-winter season [54]. During the growing season, nitrates accumulated in the deeper layers were taken up by the wheat. As a result, after the wheat harvest, most of the nitrate was in the 0–30 cm soil depth and the least in the deepest layer. Our own results are in line with previous studies indicating that wheat is effective in taking up Nmin from the deeper layers of the soil, particularly down to the 90 cm soil depth [54]. As the amount of nitrate in the 60–90 cm soil depth was strongly depleted, the total Nmin content was determined by the NO3-N content in the first two layers (Equation (17)).

4.2. Plant Indices of N Management

In the rape season, the CV value for the seed yield allows the variability of this trait to be classified in the medium category. The variability of wheat yield was lower than that of rape. The CV coefficient was about 14%. This may indicate a better adaptation of wheat to the use of soil nitrogen sources than rape [55]. On the other hand, the benefits of introducing precision farming technologies are controversial. According to Washmon et al. [56], the introduction of site-specific fertilization is economically justified by CV values in the range of 16–38%.
Within-field crop yield variability depends on the complex interaction of various climatic, soil, biological, and agro-technical factors [57,58,59]. In general, crop yield in dry years is positively correlated with soil properties related to water retention [60,61]. A negative relationship between yield and excessive soil moisture and/or waterlogging in wet years has also been demonstrated [62]. The spatial dependence of crop yield can be directly linked to the variable water properties of soils [63], which are determined by the varying organic matter content and soil particles [64]. In this respect, a positive correlation has been found between yield and colloidal clay content [65]. Another important factor determining yield variability in the field is the Nmin content of the soil [55]. However, the efficiency of plant use of this nutrient also depends on the water content available to plants [66]. The correlation between crop yield and other soil fertility parameters (pH, soil organic matter, salinity, total sulfur, etc.) is lower than for nitrogen [67]. The Nmin content of the soil directly effects plant nutritional status and, consequently, the indices used to assess leaf N content, such as the Normalized Difference Vegetation Index [68]. However, it was also found that Nmin was not a critical factor in the N yield response of wheat [69]. The yield effect is determined not only by the initial soil Nmin content and the applied N rates but also by the ability of the plants to convert it into yield [20]. In our studies, a positive relationship was observed between soil Nmin content in spring and the yield of the tested crops (Figure 5a,b). In addition, the figures clearly show a positive relationship between N accumulation in plants and soil Nmin. Thus, our results confirm previous studies showing that soil Nmin content is positively correlated with wheat growth and wheat grain protein content in terms of spatial variability [70]. In our studies, however, soil Nmin was not the only factor differentiating yield levels. This is indicated by the low coefficient of determination (R2) values in the regression equations for oilseed rape and wheat:
Ys = 2.237 + 0.035 Nmin; R2 = 0.25; p < 0.001; n = 60,
Yg = 5.756 + 0.015 Nmin; R2 = 0.33; p < 0.001; n = 60.
The availability of water in the field was probably the most important factor in the spatial variation in yield levels. Competition for N between different plant organs, conditioned by soil water availability, was not only the cause of the spatial variability of NHI, UNA, and UNP, but also of the lack of significant association of the above parameters with Nmin. These parameters were also weakly related to the yield level (Ys and Yg) of the plants tested. Contrary to these indices, PFP was positively related to crop yield and Nmin content. This relationship was stronger for rape than for wheat. A study by Łukowiak et al. [29] also showed that there was no significant relationship between the crop yield and the indices characterizing N management in plants such as NHI, UNA, and UNP. However, in contrast to our results, PFP was positively related to the yield of winter triticale and winter rape to the same extent.

4.3. Soil Indices of N Management

During the growing season, the average Nb budget was positive for oilseed rape and negative for winter wheat. For oilseed rape, the value obtained was within the recommended range for NEin (50–90%). The results obtained for wheat indicate a risk of N soil mining [13]. In the long term, such management may lead to a depletion of easily mineralized organic N reserves and an increase in the need for nitrogen fertilizers. On the other hand, it reduces potential nitrogen losses to the environment [71]. The results of this study are in line with other previous studies showing strong variation in the parameters characterizing the efficiency of N use in soil-plant systems [69,72]. Regardless of the crop grown, a very high variability of Nb values was obtained over the field area. At the same time, the analysis of the Nb parameter in the rape season made it possible to identify zones with high N loss potential (N surplus up to 80 kg ha−1). In contrast to the first season, the maximum gross N surplus in the wheat season was only 8 kg ha−1. After analyzing 1182 farms in Poland, Faber et al. [73] obtained a nitrogen balance in the wheat crop ranging from −76 to 130 kg N ha−1 (median was 12 kg ha−1). However, the most interesting result was that up to 49% of the farms had an NUE higher than 90%, which indicates the risk of N soil mining. Thus, N management in the field in the 2019/2020 season did not differ significantly from that throughout Poland. With regard to the spatial variability within fields, large variations in N surpluses have also been shown. According to Mittermayer et al. [74], N surpluses on a winter wheat field were calculated to range from −76.4 to 91.3 kg ha−1 (with a mean of 24.0 kg ha−1). On the other hand, Schuster et al. [46] calculated N balances in a field of winter wheat in the range of −72.7 to 72.0 kg N ha−1 (mean = 15.7 kg N ha−1). The study showed a greater spatial variability in Nb for Wrape than for wheat. The reason for this difference is the interaction of seasonal environmental and genetic factors of the plants tested. Pre-flowering N resources, despite their high remobilization potential, were insufficient to meet the needs of high-yielding rape [75]. This makes rape a highly sensitive crop to factors that interfere with N uptake during flowering and post-flowering. In 2019, rape experienced drought during the seed growth phase, which disrupted seed dry matter and nitrogen accumulation while increasing spatial variability in fertilizer N use potential.
In our study, an analysis of the N surplus was also carried out, taking into account the N supply from the soil in spring (Nin). As for each crop, the N rate in the field was constant; field-specific differences in Nin depended mainly on the Nmin content. The inclusion of N input from fertilizer reduced the CV for Nin compared to Nmin, especially in the oilseed rape season (higher N dose in fertilizer). The inclusion of soil N supply in the balance reversed the observed trend in the Nb index. On average, a higher N surplus (Ninb) was obtained for winter wheat than for oilseed rape. However, the Ninb had a very high variability in the field, higher than Nb, especially in the rape season. This is partly due to the fact that, in contrast to wheat, rape accumulates more N in the vegetative parts than in the seeds [76]. Ninb values can range from −78.9 to 102.2 kg ha−1 in rape crops, depending on the growing season and location [77]. The range of Ninb values in the field can be even wider, from −235.2 to 178.4 kg ha−1 [29]. The range for Ninb obtained in our study was narrower than that of the above-mentioned authors. However, it was wider than for Nb. This clearly indicates the need to include the Nmin pool in the estimation of potential N losses from the soil-plant system. The parameter Ninb was negatively related to the rape yield and to parameters characterizing N use efficiency. There were large N surpluses in the low-yield zones. For rape, two areas of high Ninb values were found on the western and eastern sides of the field (Figure 6). Therefore, there was a high potential risk of excessive N losses to the environment in these zones [46,78,79]. The in-field distribution of Ninb in season with winter wheat was more uniform, in general, without any particular distinction for specific management zones.
Total nitrogen input in the field during the growing season (NinT) was the sum of Nin and N released from the soil during mineralization (Ngain). The spatial variability of the Ngain index in the field was very high (CV = 57.3 and 78.0% for the first and second year of the study, respectively). During the growing season, the average Ngain was almost two times higher in oilseed rape than in winter wheat. The differences can be explained by the intensive mineralization of organic matter at higher temperatures in 2019. In the oilseed rape season, Ngain was also positively correlated with the rape crop residue biomass, indicating the direction of the mineralized N accumulation. No such relationship was found for wheat. On the other hand, an inverse trend was observed for the parameter that determines the efficiency of the use of all N sources. Higher NEinT values were obtained for wheat than for rape. Furthermore, this index was positively related to grain and crop residues (straw yield) in winter wheat, although the variability of the parameter values was very similar for both species.

5. Conclusions

The spatial variability of the soil and plant N management indices is dependent on the growing season and the type of crop. Particularly high variability was found for indices characterizing N surplus in the soil-plant system. This indicates the need to remove in-field constraints on plant N uptake and conversion into yield and to adjust N rates to varying soil conditions. In this context, the set of characteristics defining field management zones should take into account the spring Nmin supply as well as the potential for N release from soil organic matter mineralization processes. In view of the risk of excessive N dispersion in the environment, management zones should be established, especially in winter oilseed rape cropping.

Author Contributions

Conceptualization, R.Ł., P.B. and J.C.; methodology, R.Ł. and J.C.; software, R.Ł. and J.C.; validation, P.B.; formal analysis, P.B. and J.C.; investigation, R.Ł.; resources, R.Ł. and J.C.; data curation, R.Ł. and P.B.; writing—original draft preparation, R.Ł., P.B. and J.C.; writing—review and editing, P.B.; visualization, P.B. and J.C.; supervision, P.B.; project administration, R.Ł. All authors have read and agreed to the published version of the manuscript.

Funding

This research received no external funding.

Data Availability Statement

The data presented in this study are available upon request from the corresponding author.

Conflicts of Interest

The authors declare no conflicts of interest.

References

  1. Evans, J.R. Photosynthesis and nitrogen relationships in leaves of C3 plants. Oecologia 1989, 78, 9–19. [Google Scholar] [CrossRef] [PubMed]
  2. Mu, X.; Chen, Y. The physiological response of photosynthesis to nitrogen deficiency. Plant Physiol. Biochem. 2021, 158, 76–82. [Google Scholar] [CrossRef] [PubMed]
  3. Noor, H.; Ding, P.; Ren, A.; Sun, M.; Gao, Z. Effects of Nitrogen Fertilizer on Photosynthetic Characteristics and Yield. Agronomy 2023, 13, 1550. [Google Scholar] [CrossRef]
  4. Burton, A.; Häner, L.L.; Schaad, N.; Strebel, S.; Vuille-dit-Bille, N.; de Figueiredo Bongiovani, P.; Holzkämper, A.; Pellet, D.; Herrera, J.M. Evaluating nitrogen fertilization strategies to optimize yield and grain nitrogen content in top winter wheat varieties across Switzerland. Field Crops Res. 2024, 307, 109251. [Google Scholar] [CrossRef]
  5. FAOSTAT. Food and Agriculture Organization of the United Nations (FAO). Available online: https://www.fao.org/home/en (accessed on 18 April 2024).
  6. Hubert, B.; Rosegrant, M.; van Boekel, M.A.J.S.; Ortiz, R. The Future of Food: Scenarios for 2050. Crop Sci. 2010, 50 (Suppl. S1), S-33–S-50. [Google Scholar] [CrossRef]
  7. Mălinaş, A.; Vidican, R.; Rotar, I.; Mălinaş, C.; Moldovan, C.M.; Proorocu, M. Current Status and Future Prospective for Nitrogen Use Efficiency in Wheat (Triticum aestivum L.). Plants 2022, 11, 217. [Google Scholar] [CrossRef]
  8. Sapkota, T.B.; Bijay-Singh; Takele, R. Chapter Five—Improving nitrogen use efficiency and reducing nitrogen surplus through best fertilizer nitrogen management in cereal production: The case of India and China. Adv. Agron. 2023, 178, 233–294. [Google Scholar] [CrossRef]
  9. Mogollón, J.M.; Lassaletta, L.; Beusen, A.H.W.; van Grinsven, H.J.M.; Westhoek, H.; Bouwman, A.F. Assessing future reactive nitrogen inputs into global croplands based on the shared socioeconomic pathways. Environ. Res. Lett. 2018, 13, 044008. [Google Scholar] [CrossRef]
  10. Congreves, K.A.; Otchere, O.; Ferland, D.; Farzadfar, S.; Williams, S.; Arcand, M.M. Nitrogen Use Efficiency Definitions of Today and Tomorrow. Front. Plant Sci. 2021, 12, 637108. [Google Scholar] [CrossRef]
  11. Cassman, K.G.; Dobermann, A.; Walters, D.T. Agroecosystems, nitrogen-use, and nitrogen management. Ambio 2002, 31, 132–140. [Google Scholar] [CrossRef]
  12. You, L.; Ros, G.H.; Chen, Y.; Shao, Q.; Young, M.D.; Zhang, F.; de Vries, W. Global mean nitrogen recovery efficiency in croplands can be enhanced by optimal nutrient, crop and soil management practices. Nat. Commun. 2023, 14, 5747. [Google Scholar] [CrossRef] [PubMed]
  13. EU Nitrogen Expert Panel. Nitrogen Use Efficiency (NUE)—An Indicator for the Utilization of Nitrogen in Agriculture and Food Systems; Wageningen University: Wageningen, The Netherlands, 2015. [Google Scholar]
  14. Lassaletta, L.; Billen, G.; Grizzetti, B.; Anglade, J.; Garnier, J. 50 year trends in nitrogen use efficiency of world cropping systems: The relationship between yield and nitrogen input to cropland. Environ. Res. Lett. 2014, 9, 105011. [Google Scholar] [CrossRef]
  15. Martínez-Dalmau, J.; Berbel, J.; Ordóñez-Fernández, R. Nitrogen Fertilization. A Review of the Risks Associated with the Inefficiency of Its Use and Policy Responses. Sustainability 2021, 13, 5625. [Google Scholar] [CrossRef]
  16. Jwaideh, M.A.; Sutanudjaja, E.H.; Dalin, C. Global impacts of nitrogen and phosphorus fertiliser use for major crops on aquatic biodiversity. Int. J. Life Cycle Assess. 2022, 27, 1058–1080. [Google Scholar] [CrossRef]
  17. Grennfelt, P.; Hultberg, H. Effects of nitrogen deposition on the acidification of terrestrial and aquatic ecosystems. Water Air Soil Pollut. 1986, 30, 945–963. [Google Scholar] [CrossRef]
  18. Chai, R.; Ye, X.; Ma, C.; Wang, Q.; Tu, R.; Zhang, L.; Gao, H. Greenhouse gas emissions from synthetic nitrogen manufacture and fertilization for main upland crops in China. Carbon Balance Manag. 2019, 30, 20. [Google Scholar] [CrossRef] [PubMed]
  19. Hirel, B.; Tétu, T.; Lea, P.J.; Dubois, F. Improving Nitrogen Use Efficiency in Crops for Sustainable Agriculture. Sustainability 2011, 3, 1452–1485. [Google Scholar] [CrossRef]
  20. Barłóg, P.; Grzebisz, W.; Łukowiak, R. Fertilizers and Fertilization Strategies Mitigating Soil Factors Constraining Efficiency of Nitrogen in Plant Production. Plants 2022, 11, 1855. [Google Scholar] [CrossRef]
  21. Johnston, A.M.; Bruulsema, T.W. 4R Nutrient Stewardship for Improved Nutrient Use Efficiency. “SYMPHOS 2013”, 2nd International Symposium on Innovation and Technology in the Phosphate Industry. Procedia Eng. 2014, 83, 365–370. [Google Scholar] [CrossRef]
  22. Olfs, H.-W.; Blankenau, K.; Brentrup, F.; Jasper, J.; Link, A.; Lammel, J. Soil-and plant-based nitrogen-fertilizer recommendations in arable farming. J. Plant Nutr. Soil Sci. 2005, 168, 414–431. [Google Scholar] [CrossRef]
  23. Oyebiyi, F.B.; Aula, L.; Omara, P.; Nambi, E.; Dhillon, J.S.; Raun, W.R. Maize (Zea mays L.) Grain Yield Response to Methods of Nitrogen Fertilization. Commun. Soil Sci. Plant 2019, 50, 2694–2700. [Google Scholar] [CrossRef]
  24. Haberle, J.; Kroulík, M.; Svoboda, P.; Lipavský, J.; Krejčová, J.; Cerhanová, D. The spatial variability of mineral nitrogen content in topsoil and subsoil. Plant Soil Environ. 2004, 50, 425–433. [Google Scholar] [CrossRef]
  25. Cao, Q.; Cui, Z.; Chen, X.; Khosla, R.; Dao, T.H.; Miao, Y. Quantifying spatial variability of indigenous nitrogen supply for precision nitrogen management in small scale farming. Precis. Agric. 2012, 13, 45–61. [Google Scholar] [CrossRef]
  26. Radočaj, D.; Jurišić, M.; Gašparović, M. The Role of Remote Sensing Data and Methods in a Modern Approach to Fertilization in Precision Agriculture. Remote Sens. 2022, 14, 778. [Google Scholar] [CrossRef]
  27. Weiss, M.; Jacob, F.; Duveiller, G. Remote sensing for agricultural applications: A metareview. Remote Sens. Environ. 2020, 236, 111402. [Google Scholar] [CrossRef]
  28. Córdova, C.; Barrera, J.A.; Magna, C. Spatial variation in nitrogen mineralization as a guide for variable application of nitrogen fertilizer to cereal crops. Nutr. Cycl. Agroecosyst. 2018, 110, 83–88. [Google Scholar] [CrossRef]
  29. Łukowiak, R.; Grzebisz, W.; Ceglarek, J.; Podolski, A.; Kaźmierowski, C.; Piekarczyk, J. Spatial Variability of Yield and Nitrogen Indicators—A Crop Rotation Approach. Agronomy 2020, 10, 1959. [Google Scholar] [CrossRef]
  30. Luce, M.S.; Whalen, J.K.; Ziadi, N.; Zebarth, B.J. Nitrogen dynamics and indices to predict soil nitrogen supply in humid temperate soils. Adv. Agron. 2011, 112, 55–102. [Google Scholar]
  31. Barłóg, P.; Łukowiak, R.; Grzebisz, W. Predicting the content of soil mineral nitrogen based on the content of calcium chloride-extractable nutrients. J. Plant Nutr. Soil Sci. 2017, 180, 624–635. [Google Scholar] [CrossRef]
  32. Fan, J.; McConkey, B.; Wang, H.; Janzen, H. Root distribution by depth for temperate agricultural crops. Field Crops Res. 2016, 189, 68–74. [Google Scholar] [CrossRef]
  33. Malagoli, P.; Lainé, P.; Le Deunff, E.; Rossato, L.; Ney, B.; Ourry, A. Modeling nitrogen uptake in oilseed rape cv capitol during a growth cycle using influx kinetics of root nitrate transport systems and field experimental data. Plant Physiol. 2004, 134, 388–400. [Google Scholar] [CrossRef] [PubMed]
  34. Stettmer, M.; Maidl, F.-X.; Schwarzensteiner, J.; Hülsbergen, K.-J.; Bernhardt, H. Analysis of Nitrogen Uptake in Winter Wheat Using Sensor and Satellite Data for Site-Specific Fertilization. Agronomy 2022, 12, 1455. [Google Scholar] [CrossRef]
  35. Tilling, A.K.; O’Leary, G.J.; Ferwerda, J.G.; Jones, S.D.; Fitzgerald, G.J.; Rodriguez, D.; Belford, R. Remote sensing of nitrogen and water stress in wheat. Field Crops Res. 2007, 104, 77–85. [Google Scholar] [CrossRef]
  36. World Reference Base for Soil Resources 2014. Word Soil Resources Reports, 106; Food and Agriculture Organization 885 of the United Nations: Rome, Italy, 2015; Available online: http://www.fao.org/3/a-i3794e.pdf (accessed on 19 March 2024).
  37. Kęsik, K.; Jadczyszyn, T.; Lipiński, W.; Jurga, B. Adaptation of the Mehlich 3 procedure for routine determination of phosphorus, potassium and magnesium in soil. Przemysł Chem. 2015, 94, 973–976. (In Polish) [Google Scholar]
  38. Mehlich, A. Mehlich 3 soil test extractant: A modification of Mehlich 2 extractant. Commun. Soil Sci. Plant Anal. 1984, 15, 1409–1416. [Google Scholar] [CrossRef]
  39. Houba, V.J.G.; Temminghoff, E.J.M.; Gaikhorst, G.A.; van Vark, W. Soil analysis procedures using 0.01 M calcium chloride as extraction reagents. Commun. Soil Sci. Plant Anal. 2000, 31, 1299–1396. [Google Scholar] [CrossRef]
  40. Grzebisz, W.; Łukowiak, R.; Sassenrath, G.F. Virtual nitrogen as a tool for assessment of nitrogen management at the field scale: A crop rotation approach. Field Crops Res. 2018, 218, 182–194. [Google Scholar] [CrossRef]
  41. Wilding, L.P.; Dress, L.R. Spatial variability and pedology. In Pedogenesis and Soil Taxonomy; Wilding, L.P., Smeck, N., Hall, G.F., Eds.; Elsevier: Wageningen, The Netherlands, 1983; pp. 83–116. [Google Scholar]
  42. Jones, T.A. Skewness and kurtosis as criteria of normality in observed frequency distributions. J. Sediment. Res. 1969, 39, 1622–1627. [Google Scholar] [CrossRef]
  43. Robertson, G.P.; Groffman, P.M. Nitrogen transformations. In Soil Microbiology, Ecology and Biochemistry, 4th ed.; Paul, E.A., Ed.; Academic Press: Burlington, MA, USA, 2015; pp. 421–446. [Google Scholar] [CrossRef]
  44. Baxter, S.J.; Oliver, M.A.; Gaunt, J. A Geostatistical Analysis of the Spatial Variation of Soil Mineral Nitrogen and Potentially Available Nitrogen Within an Arable Field. Precis. Agric. 2023, 4, 213–226. [Google Scholar] [CrossRef]
  45. Długosz, J.; Piotrowska-Długosz, A. Spatial variability of soil nitrogen forms and the activity of N-cycle enzymes. Plant Soil Environ. 2016, 62, 502–507. [Google Scholar] [CrossRef]
  46. Schuster, J.; Mittermayer, M.; Maidl, F.X.; Nätscher, L.; Hülsbergen, K.-J. Spatial variability of soil properties, nitrogen balance and nitrate leaching using digital methods on heterogeneous arable fields in southern Germany. Precis. Agric. 2023, 24, 647–676. [Google Scholar] [CrossRef]
  47. Montemurro, F. Different Nitrogen Fertilization Sources, Soil Tillage, and Crop Rotations in Winter Wheat: Effect on Yield, Quality, and Nitrogen Utilization. J. Plant Nutr. 2009, 32, 1–18. [Google Scholar] [CrossRef]
  48. Giles, M.; Morley, N.; Baggs, E.M.; Daniell, T.J. Soil nitrate reducing processes—Drivers, mechanisms for spatial variation, and significance for nitrous oxide production. Front. Microbiol. 2012, 3, 417. [Google Scholar] [CrossRef]
  49. Riley, W.J.; Ortiz-Monasterio, I.; Matson, P.A. Nitrogen leaching and soil nitrate, nitrite, and ammonium levels under irrigated wheat in Northern Mexico. Nutr. Cycl. Agroecosyst. 2001, 61, 223–236. [Google Scholar] [CrossRef]
  50. Nieder, R.; Benbi, D.K.; Scherer, H.W. Fixation and defixation of ammonium in soils: A review. Biol. Fertil. Soils 2011, 47, 1–14. [Google Scholar] [CrossRef]
  51. De la Luz Mora, M.; Cartes, P.; Núñez, P.; Salazar, M.; Demanet, R. Movement of NO3-N and NH4+-N in an Andisol and its influence on ryegrass production in a short term study. J. Soil Sci. Plant. Nutr. 2007, 7, 46–63. [Google Scholar]
  52. Wu, H.; Zhang, Z.; Hu, C.; Liu, D.; Qiao, Y.; Xiao, Z.; Wu, Y. Short-Term Straw Return Combined with Nitrogen Fertilizer Alters the Soil Nitrogen Supply in Rice–Rapeseed Planting Systems. Agronomy 2024, 14, 1226. [Google Scholar] [CrossRef]
  53. Zhang, J.B.; Zhu, T.B.; Cai, Z.C.; Quin, S.W.; Müller, C. Effects of long-term repeated mineral and organic fertilizer applications on soil nitrogen transformations. Eur. J. Soil Sci. 2012, 63, 75–85. [Google Scholar] [CrossRef]
  54. Haberle, J.; Kusá, H.; Svoboda, P.; Klír, J. The Changes of Soil Mineral Nitrogen Observed on Farms between Autumn and Spring and Modelled with a Simple Leaching Equation. Soil Water Res. 2009, 4, 159–167. [Google Scholar] [CrossRef]
  55. Diacono, M.; Rubino, P.; Montemurro, F. Precision nitrogen management of wheat. A review. Agron. Sustain. Dev. 2012, 33, 219–241. [Google Scholar] [CrossRef]
  56. Washmon, C.N.; Solie, J.B.; Raun, W.R.; Itenfisu, D.D. Within field variability in wheat grain yields over nine years in Oklahoma. J. Plant Nutr. 2002, 25, 2655–2662. [Google Scholar] [CrossRef]
  57. McBratney, A.B.; Mendonça Santos, M.L.; Minasny, B. On digital soil mapping. Geoderma 2023, 117, 3–52. [Google Scholar] [CrossRef]
  58. Mzuku, M.; Khosla, R.; Reich, R.; Inman, D.; Smith, F.; MacDonald, L. Spatial variability of measured soil properties across site-specific management zones. Soil Sci. Soc. Am. J. 2005, 69, 1572–1579. [Google Scholar] [CrossRef]
  59. Hausherr Lüder, R.-M.; Qin, R.; Richner, W.; Stamp, P.; Streit, B.; Noulas, C. Effect of Tillage Systems on Spatial Variation in Soil Chemical Properties and Winter Wheat (Triticum aestivum L.) Performance in Small Fields. Agronomy 2019, 9, 182. [Google Scholar] [CrossRef]
  60. Irmak, A.; Batchelor, W.D.; Jones, J.W.; Irmak, S.; Paz, J.O.; Beck, H.W.; Egeh, M. Relationship between plant available soil water and yield for explaining soybean yield variability. Appl. Eng. Agric. 2002, 18, 471–482. [Google Scholar] [CrossRef]
  61. Wong, M.T.F.; Asseng, S. Determining the causes of spatial and temporal variability of wheat yields at sub-field scale using a new method of upscaling a crop model. Plant Soil 2006, 283, 203–215. [Google Scholar] [CrossRef]
  62. Maestrini, B.; Basso, B. Drivers of within-field spatial and temporal variability of crop yield across the US Midwest. Sci. Rep. 2018, 8, 14833. [Google Scholar] [CrossRef] [PubMed]
  63. Amirahmadi, E.; Ghorbani, M.; Moudrý, J.; Bernas, J.; Mukosha, C.E.; Hoang, T.N. Environmental Assessment of Dryland and Irrigated Winter Wheat Cultivation under Compost Fertilization Strategies. Plants 2024, 13, 509. [Google Scholar] [CrossRef] [PubMed]
  64. Nielsen, D.R.; Biggar, J.W.; Erh, K.T. Spatial variability of field-measured soil-water properties. Hilgardia 1973, 42, 215–259. [Google Scholar] [CrossRef]
  65. Perez-Quezada, J.F.; Pettygrove, G.S.; Plant, R.E. Spatial temporal analysis of yield and soil factors in two four-crop rotation fields in the Sacramento Valley, California. Agron. J. 2003, 95, 676–687. [Google Scholar]
  66. Sadras, V.O.; Villalobos, F.J.; Orgaz, F.; Fereres, E. Effects of water stress on crop production. In Principles of Agronomy for Sustainable Agriculture; Villalobos, F.J., Fereres, E., Eds.; Springer International Publishing: Cham, Switzerland, 2016; pp. 189–204. [Google Scholar] [CrossRef]
  67. Vaněk, V.; Balík, J.; Šilha, J.; Černý, J. Spatial variability of total soil nitrogen and sulphur content at two conventionally managed fields. Plant Soil Environ. 2008, 54, 413–419. [Google Scholar] [CrossRef]
  68. Xue, L.H.; Cao, W.X.; Luo, W.H.; Dai, T.B.; Zhu, Y. Monitoring leaf nitrogen status in rice with canopy spectral reflectance. Agron. J. 2004, 96, 135–142. [Google Scholar] [CrossRef]
  69. Feng, X.; Li, Y.; Zhao, Y.; Chen, J. Spatial Variability Analysis of Wheat Nitrogen Yield Response: A Case Study of Henan Province, China. Agronomy 2023, 13, 1796. [Google Scholar] [CrossRef]
  70. Neugschwandtner, R.W.; Bernhuber, A.; Kammlander, S.; Wagentristl, H.; Klimek-Kopyra, A.; Lošák, T.; Bernas, J.; Koppensteiner, L.J.; Zholamanov, K.K.; Ghorbani, M.; et al. Effect of Two Seeding Rates on Nitrogen Yield and Nitrogen Fixation of Winter and Spring Faba Bean. Plants 2023, 12, 1711. [Google Scholar] [CrossRef]
  71. Song, X.; Yang, G.; Yang, C.; Wang, J.; Cui, B. Spatial Variability Analysis of Within-Field Winter Wheat Nitrogen and Grain Quality Using Canopy Fluorescence Sensor Measurements. Remote Sens. 2017, 9, 237. [Google Scholar] [CrossRef]
  72. Clarke, D.E.; Stockdale, E.A.; Hannam, J.A.; Marchant, B.P.; Hallett, S.H. Spatial-temporal variability in nitrogen use efficiency: Insights from a long-term experiment and crop simulation modeling to support site specific nitrogen management. Eur. J. Agron. 2024, 158, 127224. [Google Scholar] [CrossRef]
  73. Faber, A.; Jarosz, Z.; Jadczyszyn, T. Nitrogen use efficiency of winter wheat on farms in Poland. Pol. J. Agron. 2016, 26, 21–25. [Google Scholar]
  74. Mittermayer, M.; Gilg, A.; Maidl, F.-X.; Nätscher, L.; Hülsbergen, K.-J. Site-specific nitrogen balances based on spatially variable soil and plant properties. Precis. Agric. 2021, 22, 1416–1436. [Google Scholar] [CrossRef]
  75. Grzebisz, W.; Szczepaniak, W.; Grześ, S. Sources of nutrients for high-yielding winter oilseed rape (Brassica napus L.) during post-flowering growth. Agronomy 2020, 10, 626. [Google Scholar] [CrossRef]
  76. Barłóg, P.; Grzebisz, W. Effect of timing and nitrogen fertilizers application on yielding of winter oilseed rape (Brassica napus L.). II. Nitrogen uptake dynamics and fertilizer efficiency. J. Agron. Crop Sci. 2004, 190, 314–323. [Google Scholar] [CrossRef]
  77. Łukowiak, R.; Grzebisz, W. Effect of Site Specific Nitrogen Management on Seed Nitrogen—A Driving Factor of Winter Oilseed Rape (Brassica napus L.) Yield. Agronomy 2020, 10, 1364. [Google Scholar] [CrossRef]
  78. Dalgaard, T.; Bienkowski, J.F.; Bleeker, A.; Dragosits, U.; Drouet, J.L.; Durand, P.; Frumau, A.; Hutchings, N.J.; Kedziora, A.; Magliulo, V.; et al. Farm nitrogen balances in six European landscapes as an indicator for nitrogen losses and basis for improved management. Biogeosciences 2012, 9, 5303–5321. [Google Scholar] [CrossRef]
  79. Chen, S.; Du, T.; Wang, S.; Parsons, D.; Wu, D.; Guo, X.; Li, D. Evaluation and simulation of spatial variability of soil property effects on deep percolation and nitrate leaching within a large-scale field in arid Northwest China. Sci. Total Environ. 2020, 732, 139324. [Google Scholar] [CrossRef] [PubMed]
Figure 1. Location of the study field. Soil and plant sampling points are marked with numbers from 1 to 60 (source: https://www.google.pl/maps, accessed on 7 May 2024).
Agronomy 14 01845 g001
Figure 2. Mean monthly air temperature (°C) and sum of precipitation (mm) during growing seasons in the years 2019 and 2020 on the background of the long-term averages.
Agronomy 14 01845 g002
Figure 3. Statistical overview of soil mineral content during the winter oilseed rape season (n = 60): (a) Ammonium nitrogen (NH4-N) content in spring and after harvest; (b) Nitrate (NO3-N) content in spring and after harvest.
Agronomy 14 01845 g003
Figure 4. Statistical overview of soil mineral content during the winter wheat season (n = 60). (a) Ammonium nitrogen (NH4-N) content in spring and after harvest; (b) Nitrate (NO3-N) content in spring and after harvest.
Agronomy 14 01845 g004
Figure 5. Score plot of yield parameters and nitrogen indices in first principal component (PC1) and second principal component (PC2) axes: (a) winter oilseed rape—plant N indices; (b) winter wheat—plant N indices; (c) winter oilseed rape—soil N indices; (d) winter wheat—soil N indices. *— the loadings and vectors for the supplementary variables are indicated by the red line and with an asterisk.
Agronomy 14 01845 g005
Figure 6. (a) Spatial distribution map of winter oilseed rape seed yield (Ys); (b) Spatial distribution map of N input (Nin) to rape in Spring 2019; (c) Spatial distribution map of N balance (Ninb) at the end of the growing season with rape.
Agronomy 14 01845 g006
Figure 7. (a) Spatial distribution map of winter wheat grain yield (Yg); (b) Spatial distribution map of N input (Nin) to winter wheat in Spring 2020; (c) Spatial distribution map of N balance (Ninb) at the end of the growing season with winter wheat.
Agronomy 14 01845 g007
Table 1. Particle size fractions and basic agrochemical properties of soil at the beginning of the winter oilseed rape—winter wheat crop rotation (the authors’ own results).
CharacteristicsSoil Depth
0–30 cm30–60 cm60–90 cm
MeanSDCV, %MeanSDCV, %MeanSDCV, %
Particle size fraction
Sand 1, %74.52.02.766.54.06.158.72.94.9
Coarse silt, %6.71.116.17.21.622.37.30.911.9
Fine silt, %16.12.112.812.32.218.110.211.111.3
Clay, %2.81.346.014.05.035.624.12.510.5
Agrochemical properties
pH 25.20.59.65.50.610.95.91.118.6
TSC 3, g kg−112.4212.3521.455.655.479.823.683.546.39
P 4, mg kg−1106.426.424.860.140.567.325.39.437.2
K 4, mg kg−1258.255.021.3107.248.645.3147.840.227.2
Mg 4, mg kg−1251.342.416.9282.564.722.9304.671.123.3
Ca 4, mg kg−1742.2275.237.1803.4413.651.51147.7511.244.5
1 Soil particle diameter: sand 2.0–0.05 mm; coarse silt 0.05–0.02 mm; fine silt 0.02–0.002 mm; clay < 0.002 mm; 2 in 1 M KCl (1:2.5, w/v); 3 TSC—total soil carbon; 4 plant-available form of nutrients determined by Mehlich3 method; SD—standard deviation; CV—coefficient of variation.
Table 2. Agrotechnical practices—dates of fertilization, sowing, and harvesting of winter oilseed rape and winter wheat.
Season/CropAgrotechnical Practices
LimingNPK
Complex Fertilizer
Sowing SeedsMg, S ApplicationSpring N ApplicationHarvest
2018/2019
winter oilseed rape
28 July 2018
(1.0 t ha−1 of CaCO3)
16 August 2018
(18:26:75 kg ha−1 of N, P, and K)
16 August 201821 February 2019
(15 and 20 kg ha−1 of Mg and S, respectively)
1 March 2019
12 March 2019
(102 + 68 kg N ha−1)
1 August 2019
2019/2020
winter wheat
13 September 2019
(18:26:75 kg ha−1 of N, P, and K)
12 October 2019 6 March 2020
7 April 2020
10 May 2020
(34 + 34 + 34 kg N ha−1)
21 July 2020
Table 3. Descriptive statistics of total mineral nitrogen (Nmin) content in soil depth 0–90 cm (kg ha−1) depending on the growing season and crop.
Sampling DateMeanSDCV, %MedianMin.Max.SkewnessKurtosisK–S Test, d
2019, winter rape
Spring66.315.523.464.842.9110.20.760.480.087
Harvest117.2 ***22.619.3114.866.1185.30.380.730.081
2020, winter wheat
Spring137.343.631.7142.051.2241.0−0.29−0.310.118
Harvest90.3 ***25.127.889.349.0195.41.584.920.109
SD—standard deviation; CV—coefficient of variation; K–S—Kolmogorov–Smirnov test; *** significant difference between terms of soil sampling (spring vs. harvest) at the level of p < 0.001.
Table 4. Winter oilseed rape yield, nitrogen accumulation, and indices of nitrogen management—descriptive statistics.
VariablesMeanSDCV, %MedianMinMaxSkewnessKurtosisK–S Test, d
Ys, t ha−14.521.0623.54.262.526.710.37−0.630.106
Yr, t ha−110.383.3432.29.746.4324.620.310.610.141
Ns, kg ha−1151.034.422.8146.190.0232.80.49−0.430.073
Nr, kg ha−190.733.436.984.149.1206.41.502.070.176 *
Nt, kg ha−1241.764.526.7231.6152.8424.40.990.550.097
NHI, %63.14.547.263.651.474.8−0.150.070.085
UNU, kg t−153.56.111.353.241.671.70.340.220.071
UNP, kg kg−129.91.75.829.925.934.00.13−0.290.062
PFP, kg kg−119.24.423.119.011.329.20.18−0.520.050
Ys—seed yield; Yr—harvest residues biomass (straw); Ns—N accumulated in seeds; Nr—N accumulated in harvest residues; Nt—total N uptake; NHI—nitrogen harvest index; UNU—unit N uptake; UNP—unit N productivity; PFP—partial factor productivity of N input; SD—standard deviation; CV—coefficient of variation; K–S—Kolmogorov–Smirnov test; *— d value significant at the p > 0.05.
Table 5. Winter wheat yield, nitrogen accumulation, and indices of nitrogen management—descriptive statistics.
VariablesMeanSDCV, %MedianMinMaxSkewnessKurtosisK–S Test, d
Ys, t ha−17.781.1214.47.875.3410.890.190.020.068
Yr, t ha−17.951.0813.68.095.8611.180.210.600.087
Ns, kg ha−1151.729.919.7151.893.8225.50.30−0.410.077
Nr, kg ha−161.39.515.560.942.185.20.27−0.200.082
Nt, kg ha−1213.036.217.0214.9142.5310.70.31−0.100.073
NHI, %70.93.54.971.663.476.3−0.24−0.910.085
UNU, kg t−127.42.910.727.521.533.50.03−0.640.065
UNP, kg kg−137.14.311.736.429.849.10.57−0.040.087
PFP, kg kg−133.15.315.933.524.948.90.500.060.094
Yg—grain yield; Yr—harvest residues biomass (straw); Ns—N accumulated in seeds; Nr—N accumulated in harvest residues; Nt—total N uptake; NHI—nitrogen harvest index; UNU—unit N uptake; UNP—unit N productivity; PFP—partial factor productivity of N input; SD—standard deviation; CV—coefficient of variation; K–S—Kolmogorov–Smirnov test.
Table 6. Soil nitrogen management indices in the growing season with winter oilseed rape—descriptive statistics.
VariablesMeanSDCV, %MedianMinMaxSkewnessKurtosisK–S Test, d
Nb, kg ha−119.034.4181.223.9−62.880.0−0.49−0.430.073
NEb, %88.820.322.886.052.9136.90.49−0.430.073
Nin, kg ha−1236.315.56.5234.8212.9280.20.760.480.087
Ninb, kg ha−1−5.463.81171.9−1.0−178.7112.7−0.570.100.098
Ngain, kg ha−1122.770.357.3118.2−29.6334.10.500.480.112
NinT, kg ha−1359.070.819.7345.4244.5579.80.920.780.141
NEin, %64.014.222.163.138.197.50.19−0.490.052
NEinT, %42.04.29.942.031.052.30.080.260.048
Nb—N balance (Nf–Ns); NEb—efficiency of N fertilization; Nin—N input from soil and fertilizers (Spring Nmin + Nf); Ninb—Nin balance; Ngain—N mineralized during the growing season; NinT—total N input (Nin + Ngain); NEin—efficiency of Nin; NEinT—efficiency of NinT; SD—standard deviation; CV—coefficient of variation; K–S—Kolmogorov–Smirnov test.
Table 7. Soil nitrogen management indices in the growing season with winter wheat—descriptive statistics.
VariablesMeanSDCV, %MedianMinMaxSkewnessKurtosisK–S Test, d
Nb, kg ha−1−49.729.960.2−49.8−123.58.2−0.30−0.410.078
NEb, %148.729.319.7148.892.0221.10.30−0.410.078
Nin, kg ha−1239.343.618.2244.0153.2343.0−0.29−0.310.118
Ninb, kg ha−126.339.4149.924.9−75.1131.70.110.270.083
Ngain, kg ha−164.049.978.062.3−73.6239.60.342.070.066
NinT, kg ha−1303.348.416.0301.8226.1473.40.761.080.082
NEin, %64.411.818.362.938.295.70.26−0.040.072
NEinT, %49.95.010.149.736.660.8−0.080.040.068
Nb—N balance (Nf—Ns); NEb—efficiency of N fertilization; Nin—N input from soil and fertilizers (Spring Nmin + Nf); Ninb—Nin balance; Ngain—N mineralized during the growing season; NinT—total N input (Nin + Ngain); NEin—efficiency of Nin; NEinT—efficiency of NinT; SD—standard deviation; CV—coefficient of variation; K–S—Kolmogorov–Smirnov test.
Table 8. The parameters of the regression model for the selected variables, where R2 is the coefficient of determination and B1 to B4 are blue, green, red, and near-infrared bands, respectively.
VariablesR2Band Importance
B1B2B3B4
2019, winter oilseed rape
Ys0.67190.42250.30950.26800.0000
Nin0.54550.01230.43530.31330.2391
Ninb0.60700.00000.61180.38820.0000
2020, winter wheat
Yg0.71170.29980.00340.22320.4736
Nin0.62220.00000.88780.00000.1122
Ninb0.69430.00000.25110.00000.7489
Ys—seed yield; Yg—grain yield; Nin—N input from soil and fertilizers (Spring Nmin + Nf); Ninb—Nin balance.
Disclaimer/Publisher’s Note: The statements, opinions and data contained in all publications are solely those of the individual author(s) and contributor(s) and not of MDPI and/or the editor(s). MDPI and/or the editor(s) disclaim responsibility for any injury to people or property resulting from any ideas, methods, instructions or products referred to in the content.

