Article

YOLO Recognition Method for Tea Shoots Based on Polariser Filtering and LFAnet

College of Engineering, Nanjing Agricultural University, Nanjing 210031, China
*
Author to whom correspondence should be addressed.
Agronomy 2024, 14(8), 1800; https://doi.org/10.3390/agronomy14081800
Submission received: 19 June 2024 / Revised: 23 July 2024 / Accepted: 14 August 2024 / Published: 15 August 2024
(This article belongs to the Special Issue AI, Sensors and Robotics for Smart Agriculture—2nd Edition)

Abstract

:
This study proposes a YOLOv5 inspection model based on polariser filtering (PF) to improve the recognition accuracy of the machine vision inspection model for tea leaf shoots when operating under intense outdoor light. To study the influence of the polariser parameters on the quality of the tea shoot image datasets, we improved the YOLOv5 algorithm module, inputted the results obtained from the spatial pyramid pooling structure in the backbone module into the neck module, set the up-sampling link of the neck module as a low-level feature alignment (LFA) structure, and used a bounding box similarity comparison metric based on the minimum point distance (mpdiou) to improve the accuracy of the YOLOv5 detection model. The mpdiou loss function is used to replace the original loss function. Experimental results show that the proposed method can effectively address the impact of intense outdoor light on tea identification, effectively solving the problem of poor detection accuracy of tea buds in the top view state. In the same identification environment, the model mAP50 value increased by 3.3% compared to that of the existing best mainstream detection model, and the mAP50-90 increased by 3.1%. Under an environment of light intensity greater than 5 × 10 4   L u x , the proposed YOLOv5s+LFA+mpdiou+PF model reduced the leakage detection rate by 35% and false detection rate by 10% compared to that with YOLOv5s alone.

1. Introduction

With increasing interest in the health benefits of tea [1], the area under tea plantation is also expanding. In 2022, China’s green tea production was 1,853,800 tonnes, accounting for 58.28% of its total tea production [2], and the famous green tea is the most important part of the tea economy. Currently, manual plucking is still the main method of plucking tea buds, supplemented by machinery [3]. The current tea machine plucking methods cause significant damage to the tea buds, seriously affecting the subsequent production of tea and reducing the quality of tea. Therefore, to meet the public demand for the quality and yield of fine tea, there is an urgent need for tea-plucking equipment that can replace manual labour [4].
Segmentation based on pixel-level image processing [5] is widely used for early tea bud recognition. Zhang et al. implemented the recognition of tea bud tips in the natural environment based on the colour factor method and used raster projection contours to obtain information on tea bud tip height. Yang et al. used the G component as the colour feature in the dual-threshold segmentation of background and tea buds and detected the edges of tea leaves based on shape features. Zhang et al. used an improved G-B algorithm for graying, median filtering, OTSU binarisation processing, morphological processing, and edge smoothing to extract the shape of tea buds from tea crown RGB images [6].
With the continuous development of neural networks [7], an algorithm that can quickly identify objects in an image [8], YOLO, was developed, and this model has been widely used in agriculture, such as for oranges [9] and tomatoes [10], owing to its high efficiency and rapidity. In recent years, YOLO [11] has played a crucial role in tea shoot detection; however, because the differentiation between tea shoots and background [12] is much less than that for oranges, strawberries, and other crops, the accuracy of YOLO for tea shoot recognition [13] during the early stage of use is the primary problem to be solved. Zhao et al. [14] proposed the identification of a multi-species tea shoots (IMVTS) model. The IMVTS model was proposed based on the basic framework of ECA and YOLO v7, which increased the model’s mAP value to a certain extent. Zhang et al. [3] proposed the MDY7-3PTB model, combining DeepLabv3+ and YOLOv7 for the positioning of tea buds under the complex environment of the mechanical picking of famous teas; combined with the Focal Loss function, it achieved 86.61% average iou, 93.01% accuracy, and 91.78% average recall, which improved the generality and robustness of the model. Wang et al. [15] integrated the Transformer module based on contextual information in the feature graph into the YOLOv7 algorithm to promote self-attention learning and used a bidirectional feature pyramid network, embedded coordinate attention, and SIOU loss function as the bounding box loss function, which improved the accuracy of TBC–YOLOv7 by 3.4% over the original YOLOv7. With continuous improvements in accuracy [16], an increasing number of models are being deployed in tea garden experiments. Researchers have made model improvements for the complex background environments of tea gardens. Shuai et al. [17] proposed YOLO-TEA based on the YOLOv5 network model, using up-sampling operator (CARAFE) feature up-sampling, adding a convolutional attention mechanism module (CBAM), and using a bottleneck Transformer module to inject global self-focus into the residuals, which improved the mean accuracy of recognition (mAP) value of tea buds in complex environments by 5.26%. Li et al. [18] designed deeply separable convolution instead of standard convolution and embedded a convolutional block attention module (CBAM) into the path aggregation network (PANet) to enhance the feature extraction capability of the model, which improved the average accuracy of YOLO by 1.08% in complex background environments. Chen et al. [19] applied robotics and deep learning techniques to propose a machine-based YOLOv3 algorithm and Openmv smart camera-embedded MobileNet_v2 algorithm as a classification device for visual models, which paved the way for the industrial development of a machine-based tea picking system. On this basis, researchers have optimised the model complexity to improve picking efficiency and proposed a new lightweight [20] network. Li et al. [21] proposed a YOLOv3-SPP deep learning algorithm based on channel and layer pruning, which reduced the number of parameters of the tea bud detection model, model size, and inference time by 96.82%, 96.81%, and 59.62%, respectively. Zhang et al. [22] proposed an all-day lightweight detection model (TS-YOLO) for tea buds based on YOLOv4.The feature extraction network of YOLOv4 and the standard convolution of the whole network were replaced by a lightweight neural network MobilenetV3 and depth-separable convolution. A deformable convolutional layer and coordinate attention module were added to the network to improve the detection model map compared to MobileNetV3–YOLOv4; it was able to detect tea crown buds more effectively and quickly under artificial light conditions at night. Li et al. [18] used the GhostNet lightweight network to replace the backbone of YOLOv4, which significantly reduced the computational load and complexity of the model, and they introduced the SIoU loss function to improve the training speed and detection accuracy of the model. The computational complexity of the model was reduced by 89.11%, and the number of parameters was reduced by 82.36%, which reduced the cost and difficulty of deploying the vision module of the tea-picking robot.
Although many scholars have conducted extensive research on the detection models of tea shoots, it has been found that the detection accuracy of these models decreases significantly under intense light (light intensity greater than) in practical applications. In this study, based on the dataset obtained by adding different polarisers under strong outdoor light, a YOLOv5 detection model based on polariser filtering combined with the LFAnet network is proposed, and the mpdiou loss function is introduced to enhance the detection accuracy of the model under an intense light environment and to achieve a reduction in the detection rate of tea shoots under intense light under the condition that the number of parameters, depth, and width of the model remain unchanged, to provide a new solution for the research and development of tea shoots under intense light. It also reduces the leakage detection rate of tea shoots under intense light with the same number of parameters, depth, and width and provides technical support for the development of an accurate outdoor tea shoot picking machine. The technical implementation process is shown in Figure 1.

2. Materials and Methods

2.1. Image Dataset Acquisition

The dataset used in this study was obtained from a tea garden in Juyuanchun, Yangzhou City, Jiangsu Province. The tea varieties in the tea garden were all Longjing 43, which were photographed by an Intel ZED mini binocular camera whose image resolution is 3072 × 4096 (Yingmeizhi Technology Development Co., Ltd., Beijing, China), and the ambient light intensity was measured by a DELISI high-precision illuminance meter (Delixi Electric Ltd., Yueqing, China). Data enhancement was performed on some of the images in the dataset, and the dataset was classified. A total dataset of 2000 images was acquired, and the ratio of training/validation/test sets was approximately 7:2:1; the open-source tool labelimg was used to annotate the images (Table 1).

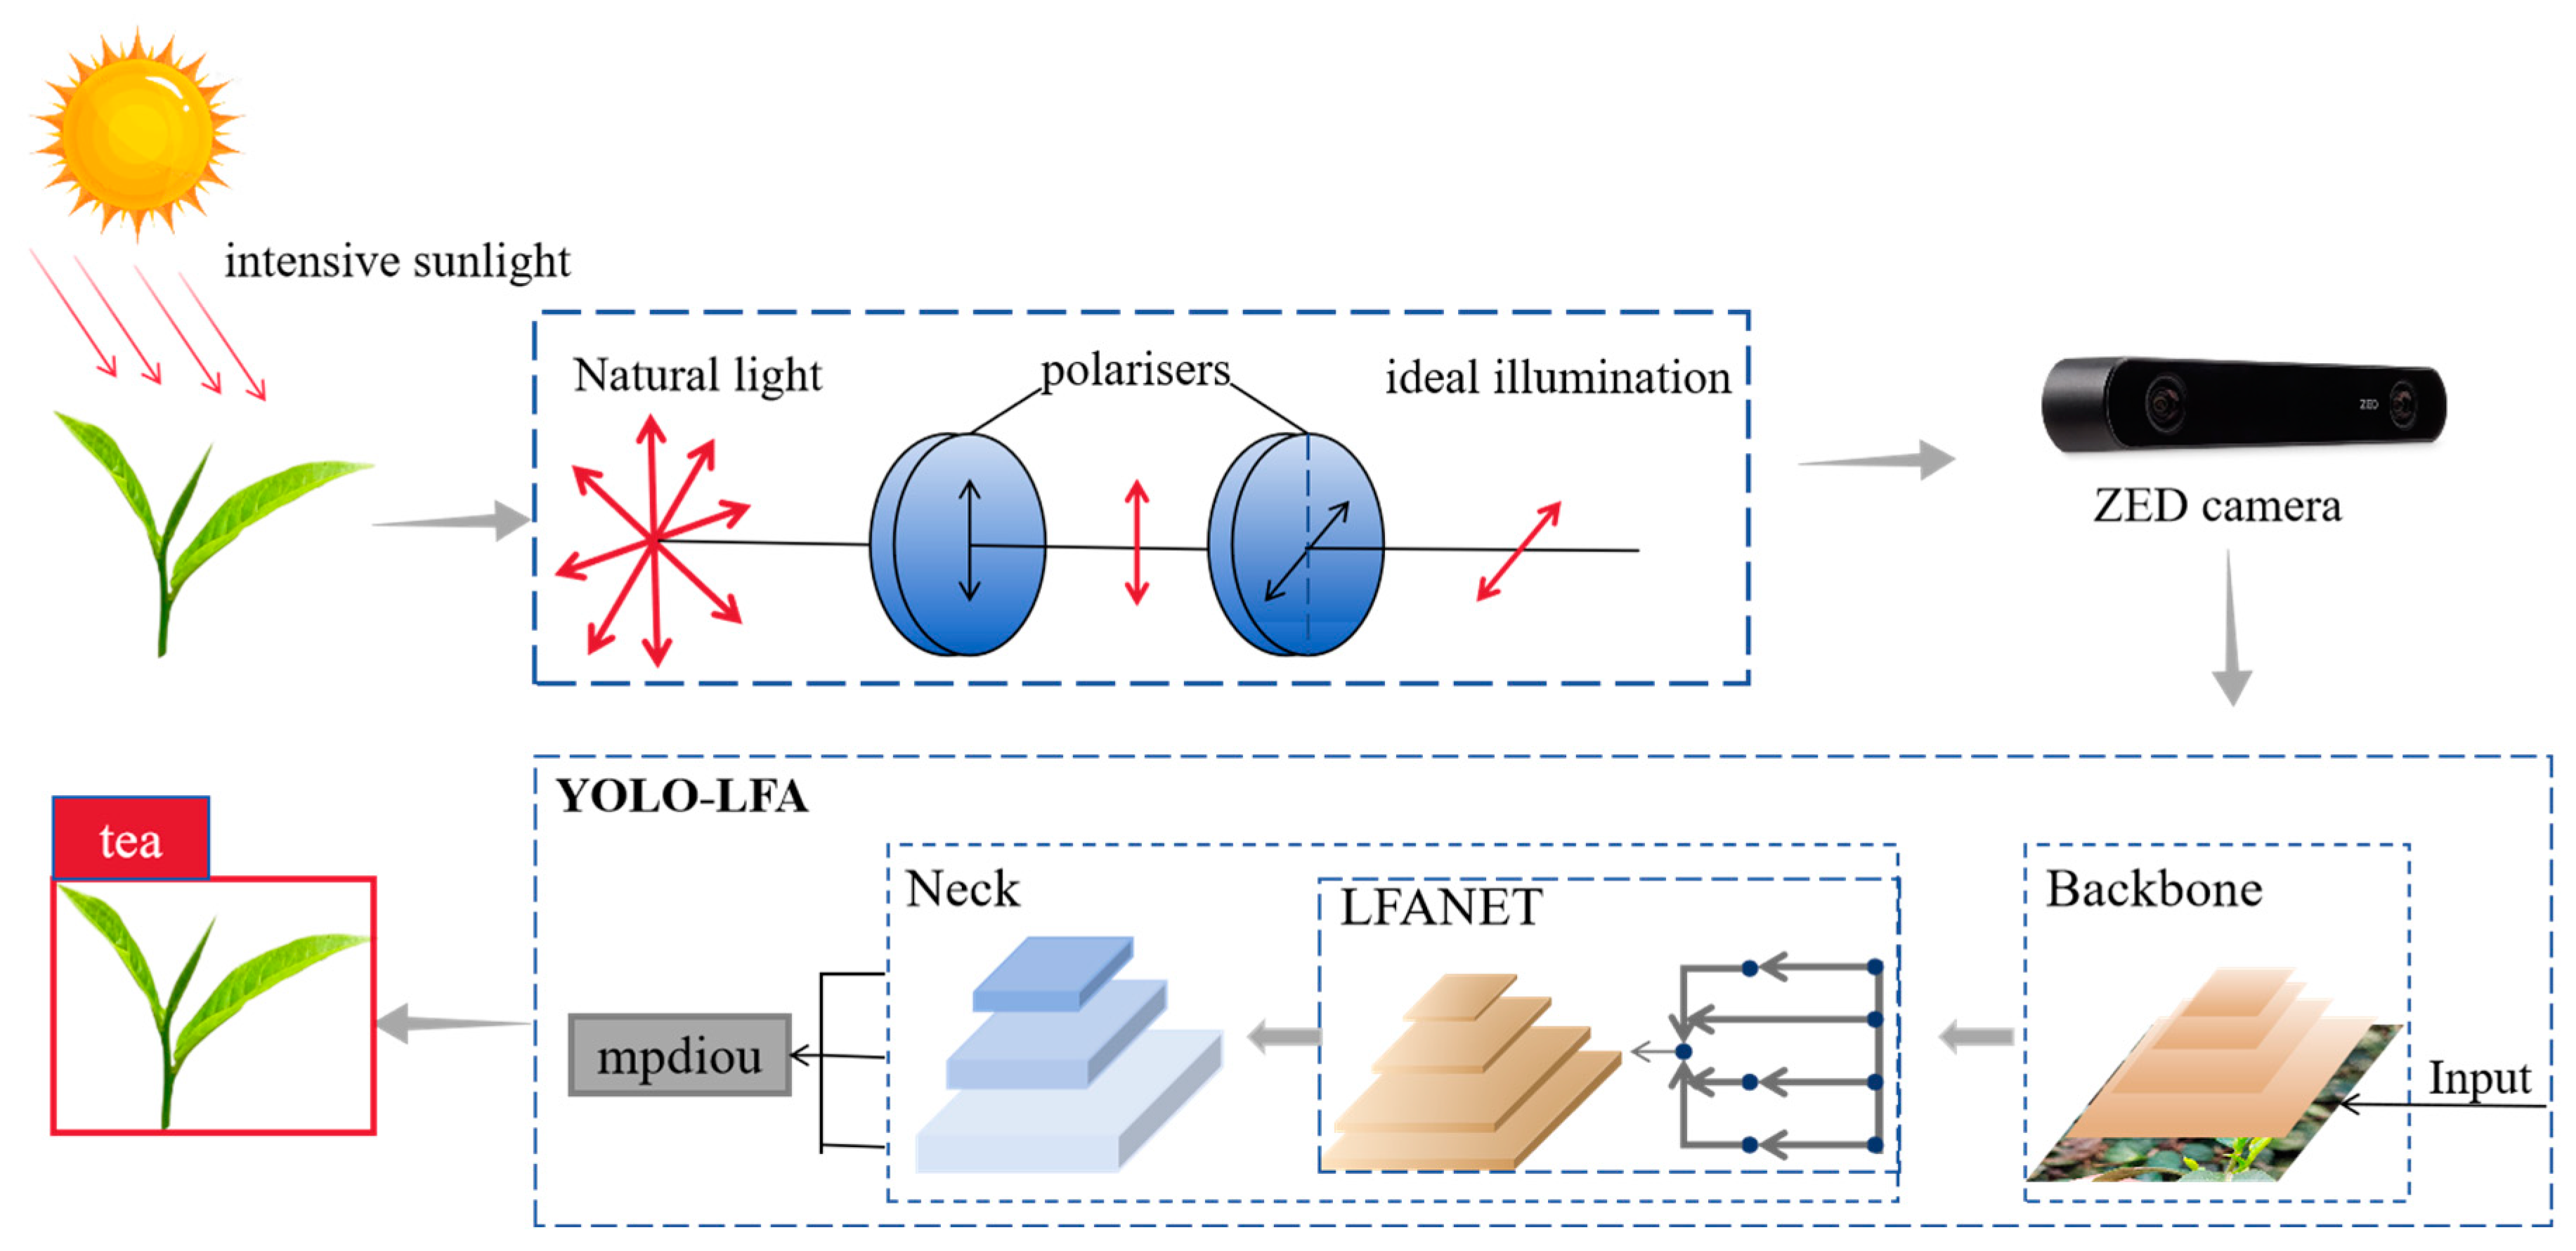
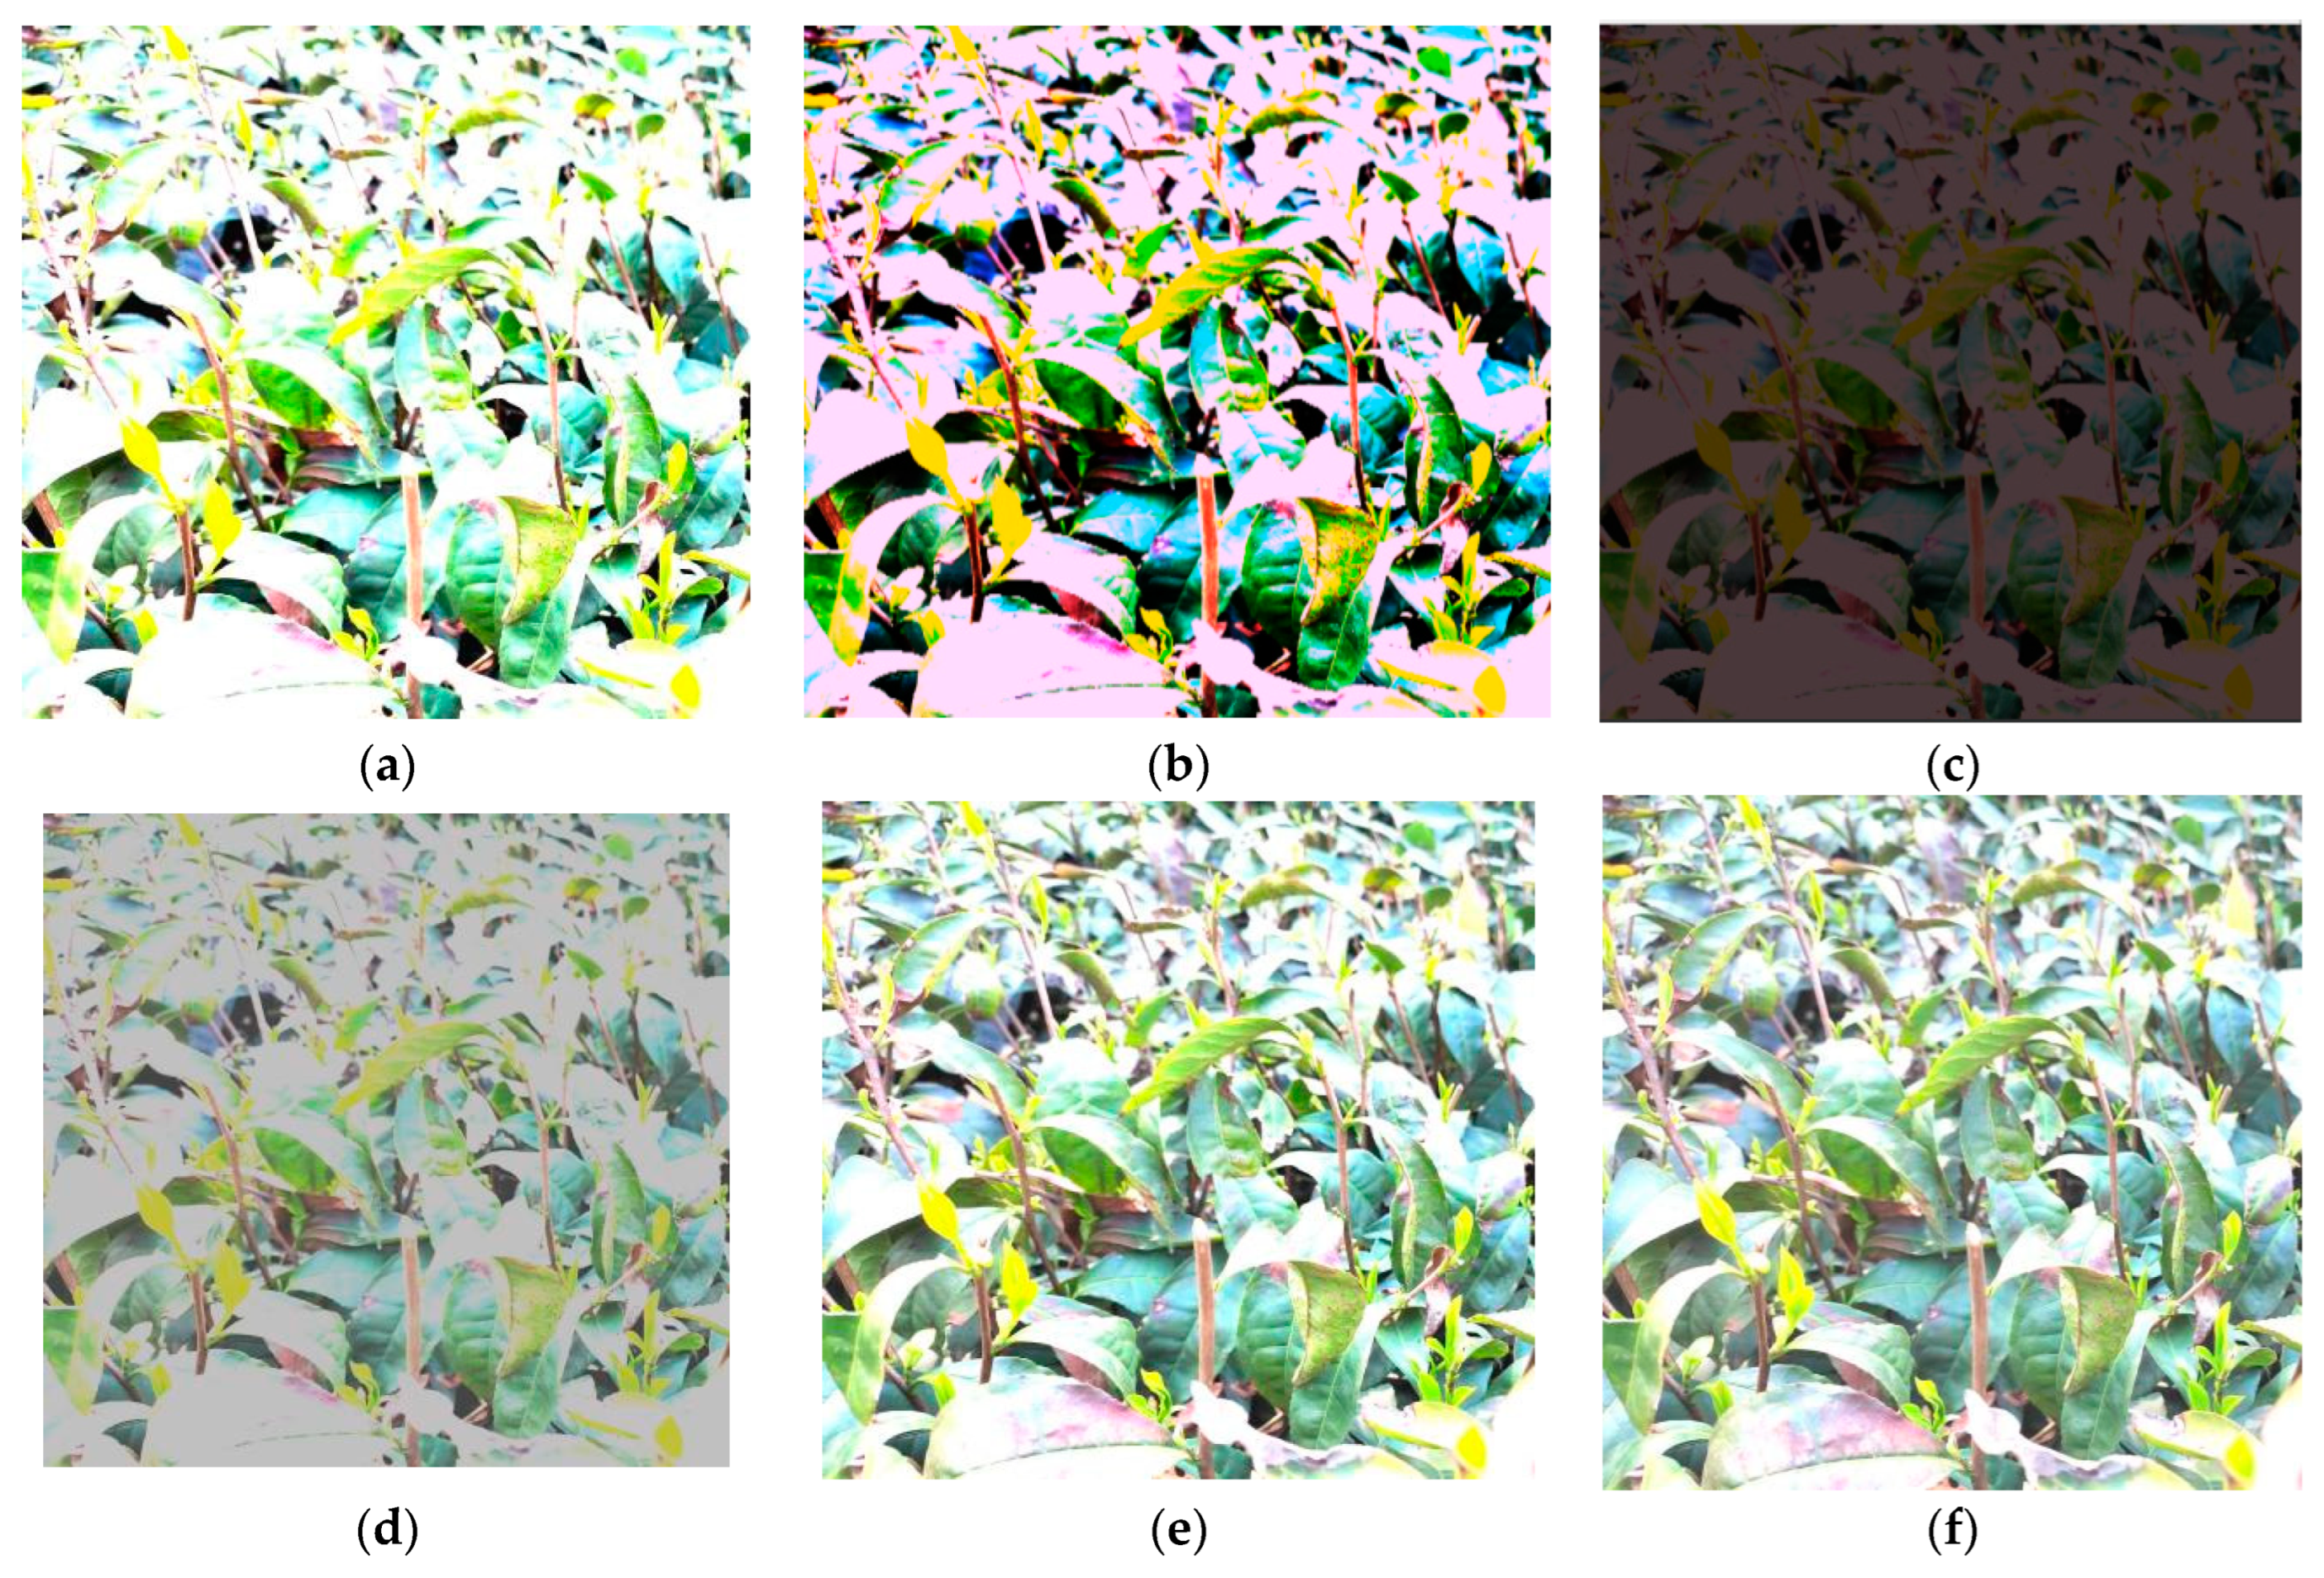
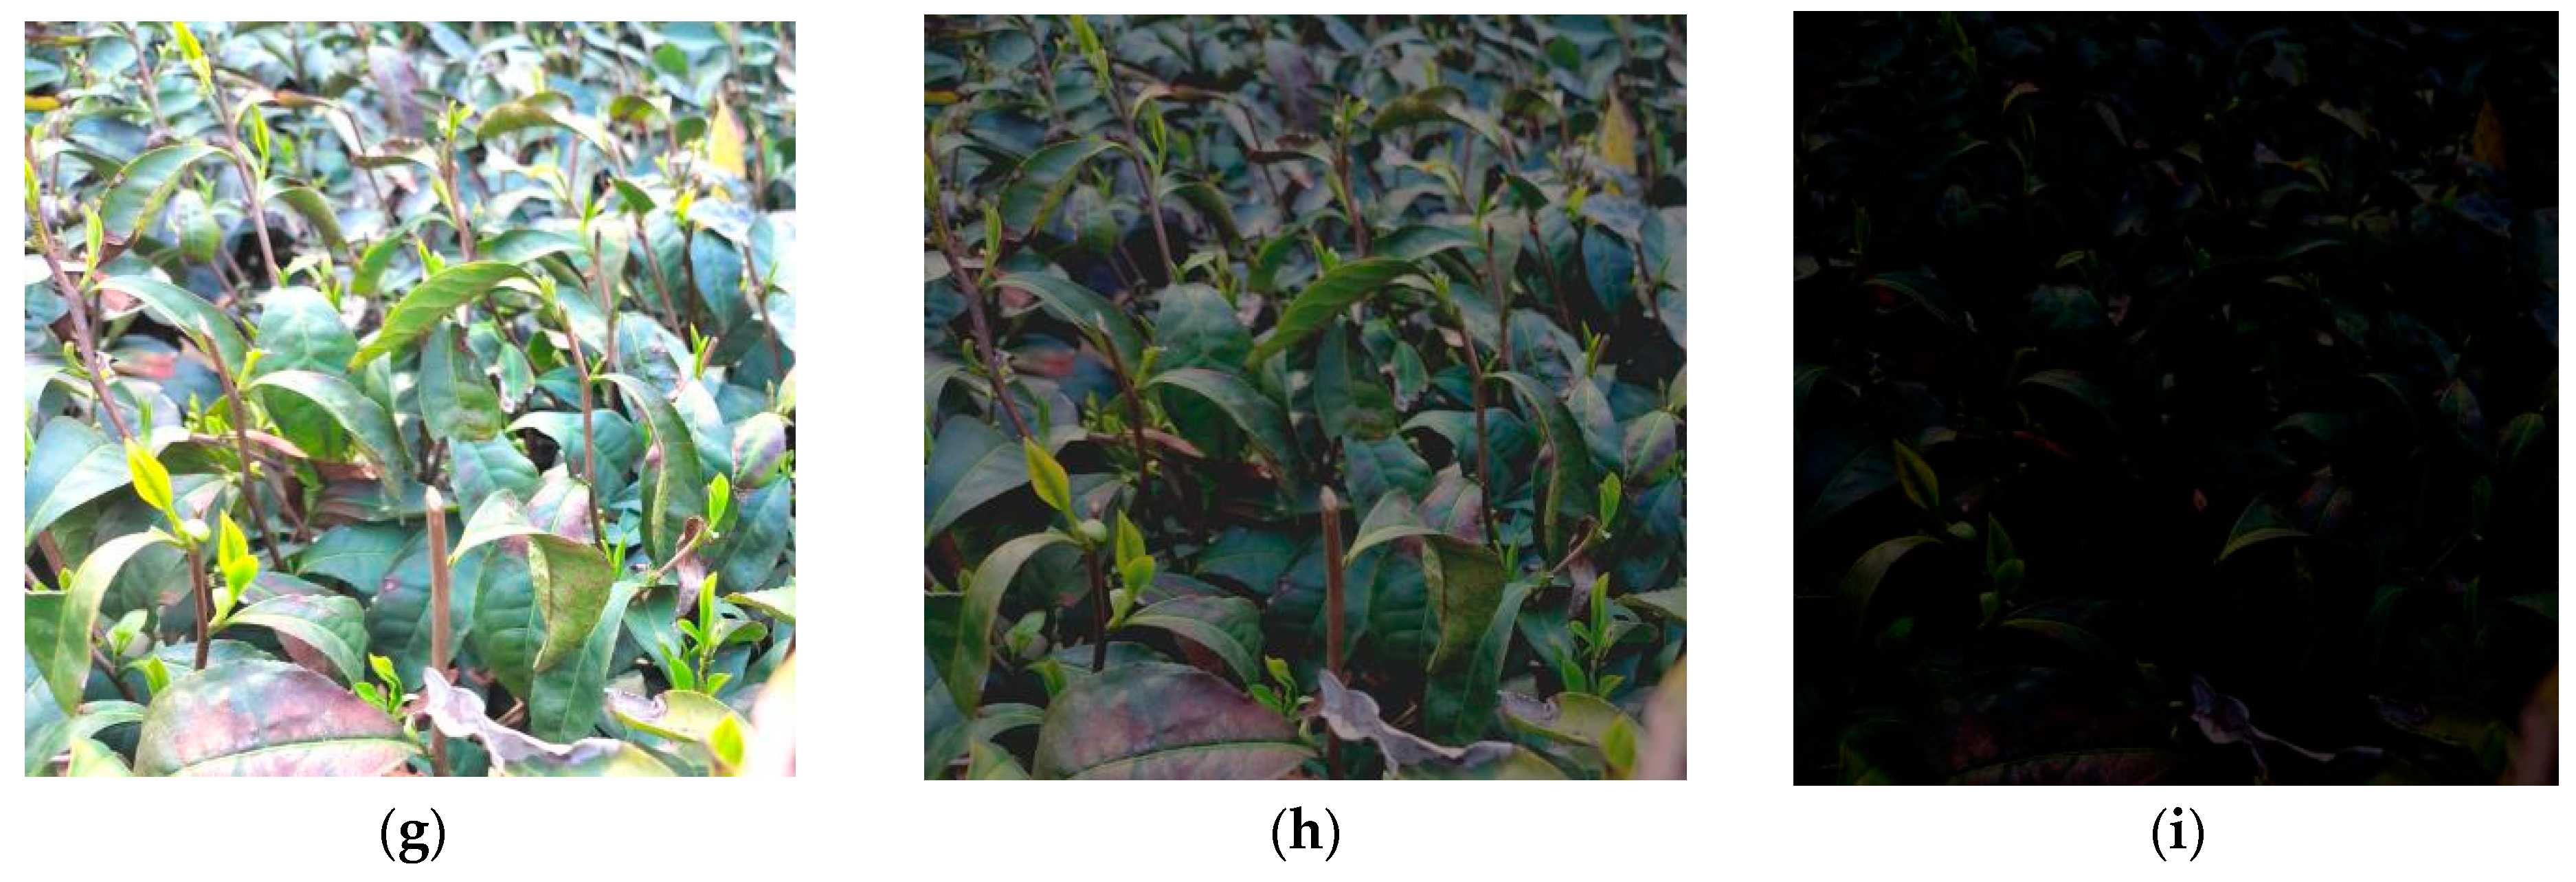
2.2. Intense Light Image Processing

Under intense light, the reflection of light caused by microstructures, such as stomata and hairs on the surface of tea leaves, will produce intense light on the surface of tea leaves, and this intense light will greatly affect machine vision recognition. In this study, two methods, image preprocessing and polariser filtering, were used to compare the effects of intense light image processing.
In this study, structural similarity (SSIM) [23], peak signal-to-noise ratio (PSNR) [24], and entropy [25] were selected as evaluation criteria for image quality.
(1)
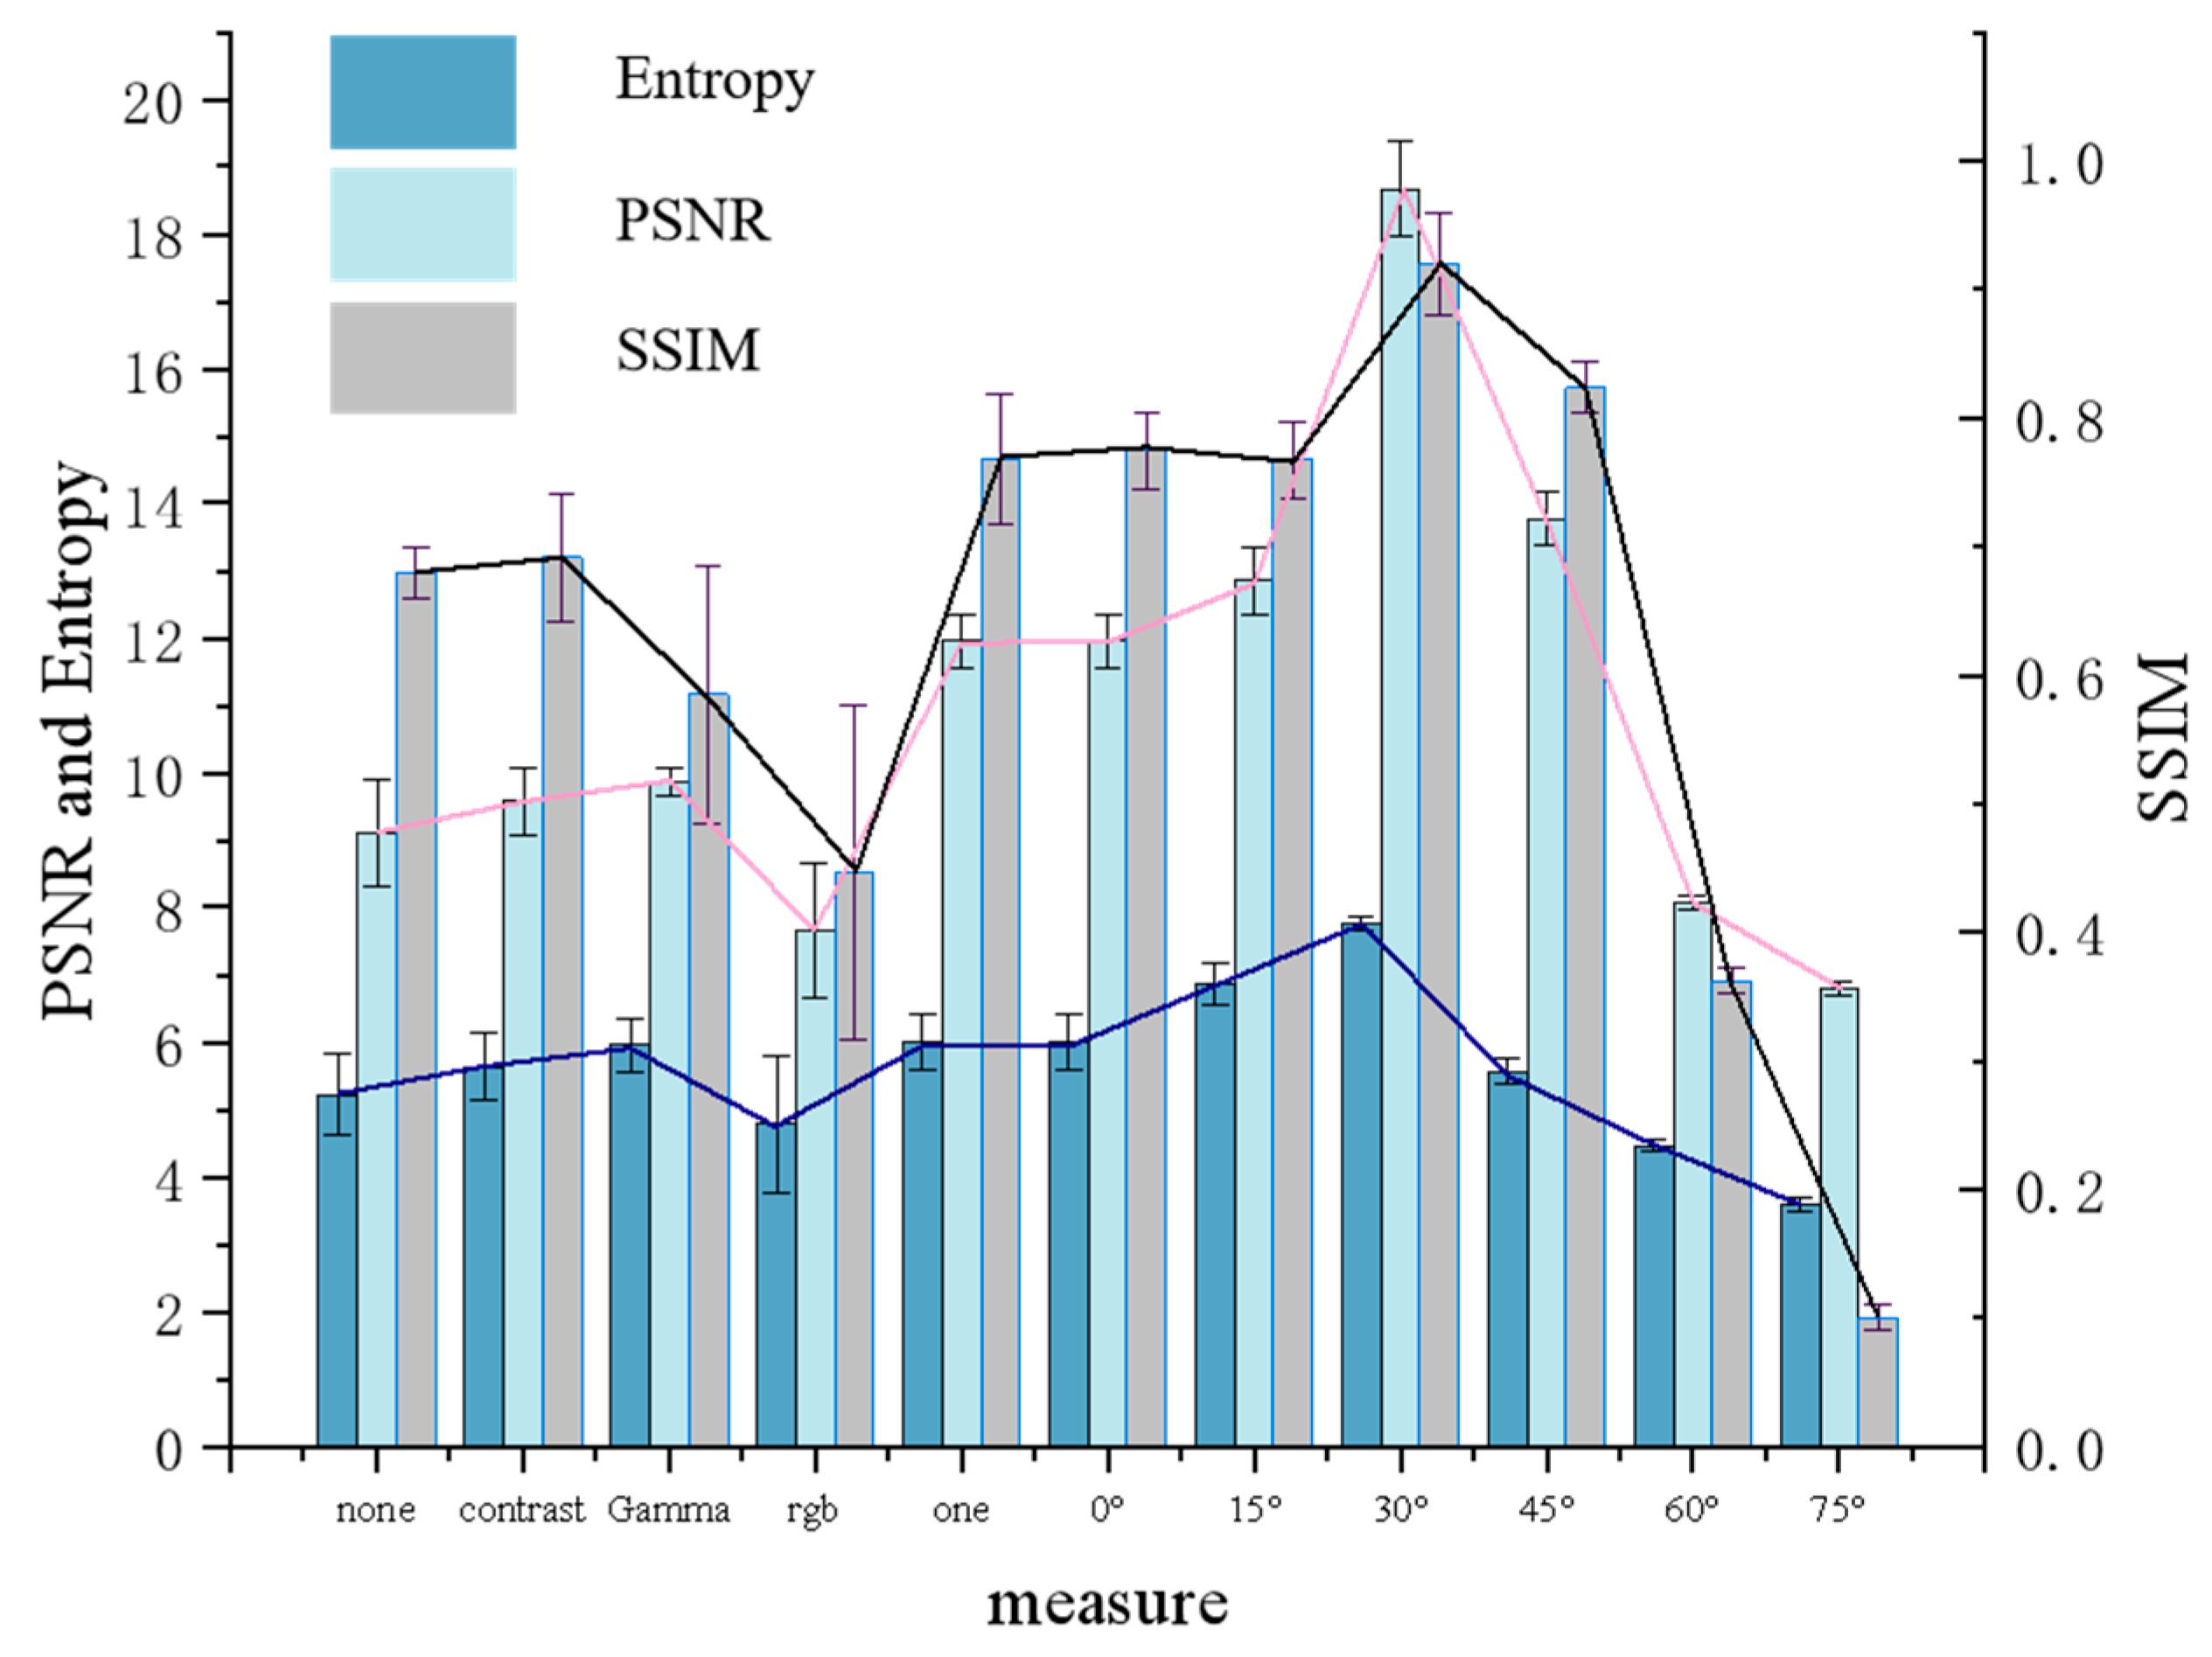
SSIM characterises the similarity of two images. This index assessed the degree of similarity between two images based on their brightness, contrast, and structural similarities and according to the proportion of each factor, as shown in Equation (1). To evaluate the quality of the processed image, processed image x and ideal image y can be selected to determine the structural similarity. The luminance and contrast of the x and y images are calculated based on the luminance value of each pixel of each channel of the two images, and the SSIM of the two images is measured by the degree of change in the pixel gray value of the image, as shown in Equation (2). The closer the value of SSIM is to 1, the higher the degree of similarity of the x and y images. When the SSIM value is less than 0.7, it can be considered that the degree of similarity between the x and y images is low.
S S I M ( x , y ) = [ l ( x , y ) ] α · [ c ( x , y ) ] β · [ s ( x , y ) ] γ
l ( x , y ) = 2 μ x μ y + C 1 μ x 2 + μ y 2 + C 1 c ( x , y ) = 2 δ x δ y + C 2 δ x 2 + δ y 2 + C 2 s ( x , y ) = δ x y + C 3 δ x δ y + C 3
C 1 = ( K 1 L ) 2 C 2 = ( K 2 L ) 2
In Equation (1), l ( x , y ) represents the luminance similarity, c ( x , y ) represents the contrast similarity, and s ( x , y ) represents the structural similarity of the x and y images. In Equation (2), μ x , μ y represent the luminance mean of each channel of the x and y images (RGB images), and δ x , δ y represent the luminance standard deviation of each channel of the x and y images, respectively. The standard deviation of luminance, δ x y represents the luminance covariance between the two images. C 1 , C 2 , C 3 are used to prevent the denominator of the fractional part of the computation from converging to 0 and leading to instability of the system. The calculations are as follows:
K 1 1 , K 2 1 , L = 255
C 3 = C 2 2
In this study,
K 1 = 0.01 , K 2 = 0.03
and the brightness, contrast, and structural similarity weighting factors were
α = 1 , β = 1 , γ = 1
(2)
PSNR characterises the difference between two images and is used to quantitatively assess the gap between the processed image and ideal image; the larger the PSNR value, the closer the image is to the ideal image. A PSNR value less than 10 dB indicates that there is a large difference between the image and ideal image, and the quality of the image processing is poor. The formula for calculating PSNR is as follows:
P S N R = 10 l o g z 2 M S E
M S E = 1 m n i = 0 m 1 j = 0 n 1 [ I ( i , j ) K ( i , j ) ] 2
where MSE is the average of the mean square error of the pixel values of the three RGB channels of images I and K at coordinates ( i , j ) . z is the difference between the maximum and minimum gray values obtained from the image.
(3)
Entropy measures the amount of information contained in an image. The higher the entropy value, the more informative the image is. The information content of an image is quantitatively calculated using the distribution of the gray values of the image, as shown in Equation (10).
E n t r o p y = P ( a ) l o g P ( a )
where a is the gray value, and P ( a ) is the probability distribution of pixel points with gray value a.

2.2.1. Image Preprocessing

In this study, the preprocessing of intense light images was performed from three aspects: contrast adjustment, hue value adjustment, and gamma value adjustment. The brightness contrast [26] of the image was adjusted based on the linear transformation of the grayscale of the image, as shown in Equation (11).
y = [ x 127.5 × ( 1 B ) ] × k + 127.5 × ( 1 + B )
k = t a n 45 + 44 × c 180 × π
where B ∈ [−1,1], c ∈ [−1,1]. y is the adjusted value on each channel of the image, and x is the value before each channel is adjusted. Then, only the contrast changes when B = 0, and only the brightness changes when c = 0.
Gamma [27] adjustment is a method of nonlinear tonal editing of an image and is calculated using Equation (13)
V o u t = A V i n γ
where V i n is the normalised value of each channel of the RGB image, γ is the nonlinear adjustment parameter of the hue, V o u t is the output pixel value of V i n after adjustment, and A is a constant coefficient.

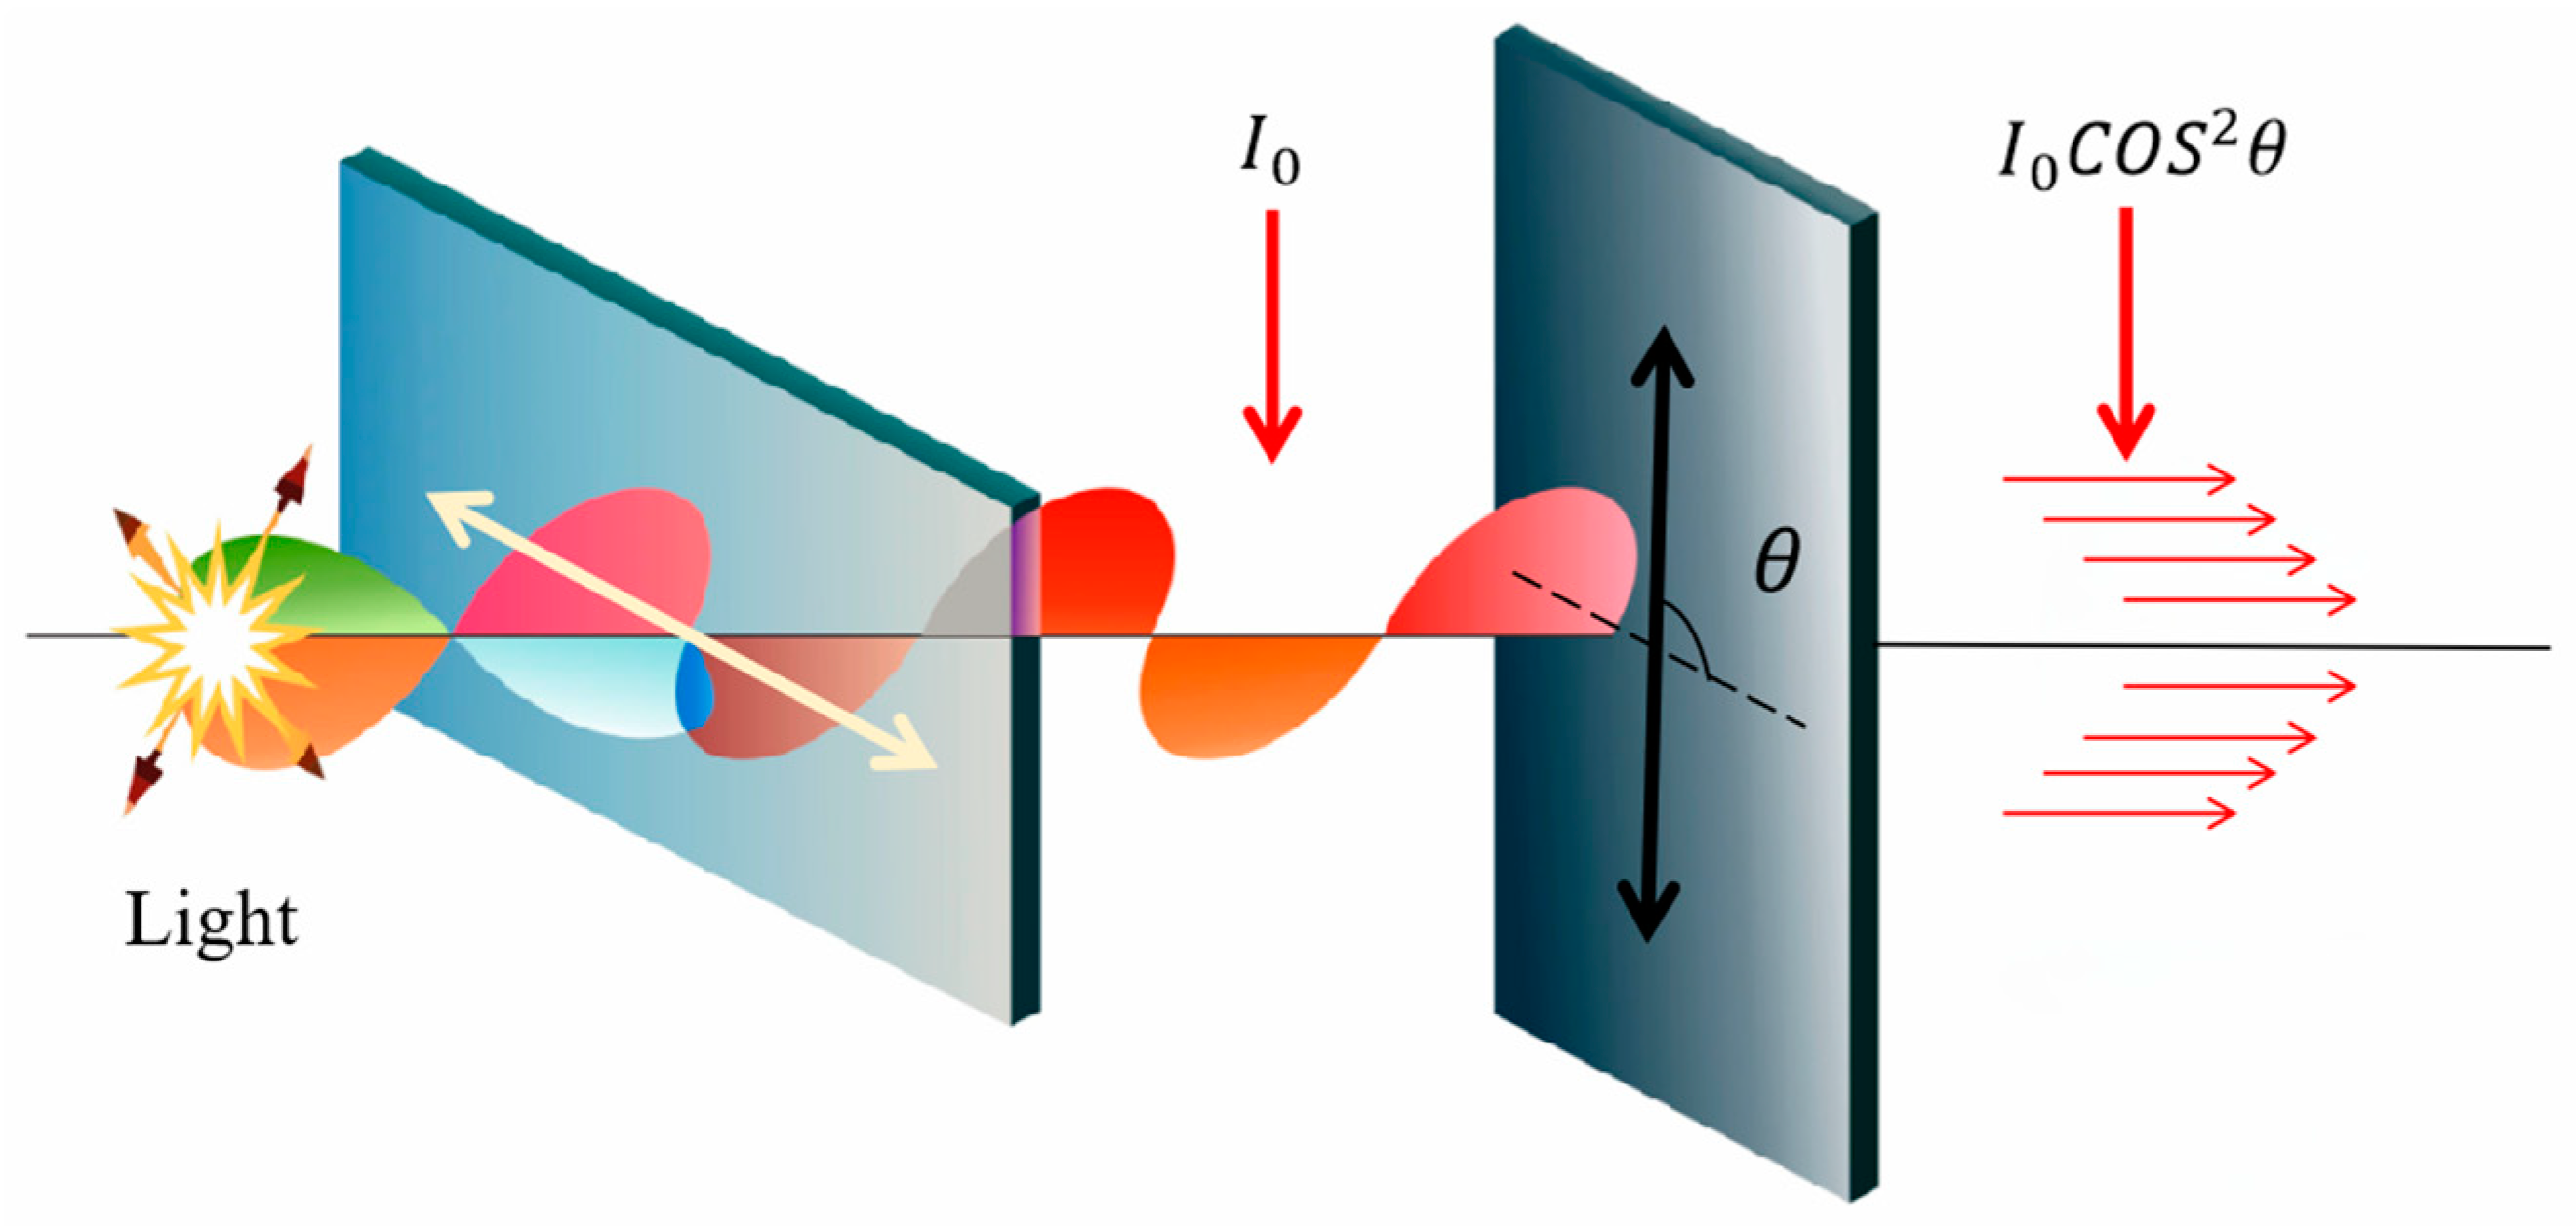
2.2.2. Polariser Filtering

Polarisers are widely used in everyday photography and often contain special molecular or lattice structures that absorb light vibrating in a particular direction. These molecules or structures absorb light perpendicular to their direction and have little effect on light parallel to their direction.
The polariser uses a Pl high-transmittance linear polariser. According to the polariser principle, light that does not satisfy the polarisation direction of the polariser is filtered out. However, when the light intensity is 5 × 10 4   L u x and above, the reflected light intensity on the surface of the tea leaves, especially old leaves, still affects the normal recognition of the camera after the polariser’s light intensity is selected once, resulting in an overexposure phenomenon in the camera’s imaging, which greatly impairs the quality of the image. At this time, we employ the Malus theorem, i.e., the light intensity of I 0 line polarised light, through another line polariser, when the light intensity will become the original C O S 2 θ as follows:
I = I 0 × C O S 2 θ
where I is the intensity of light through two linear polarisers, I 0 is the intensity of natural light through a linear polariser, and θ is the angle between the direction of light vibration of the incident linearly polarised light and the direction of polarisation of the polariser. This principle is illustrated in Figure 2.
As shown in Figure 2, natural light is a uniform vibration of light in all directions; after passing through the first polariser, the light intensity of the natural light will become I 0 and change from unpolarised light to linearly polarised light and, when the linearly polarised light passes through the second polariser whose polarisation direction is θ with the angle of θ to the linearly polarised light, the light intensity will become I 0 C O S 2 θ , and the direction of polarisation will be changed. In practice, two polarisers with a right angle can be designed according to this principle to reduce camera overexposure and optimise intense light images.

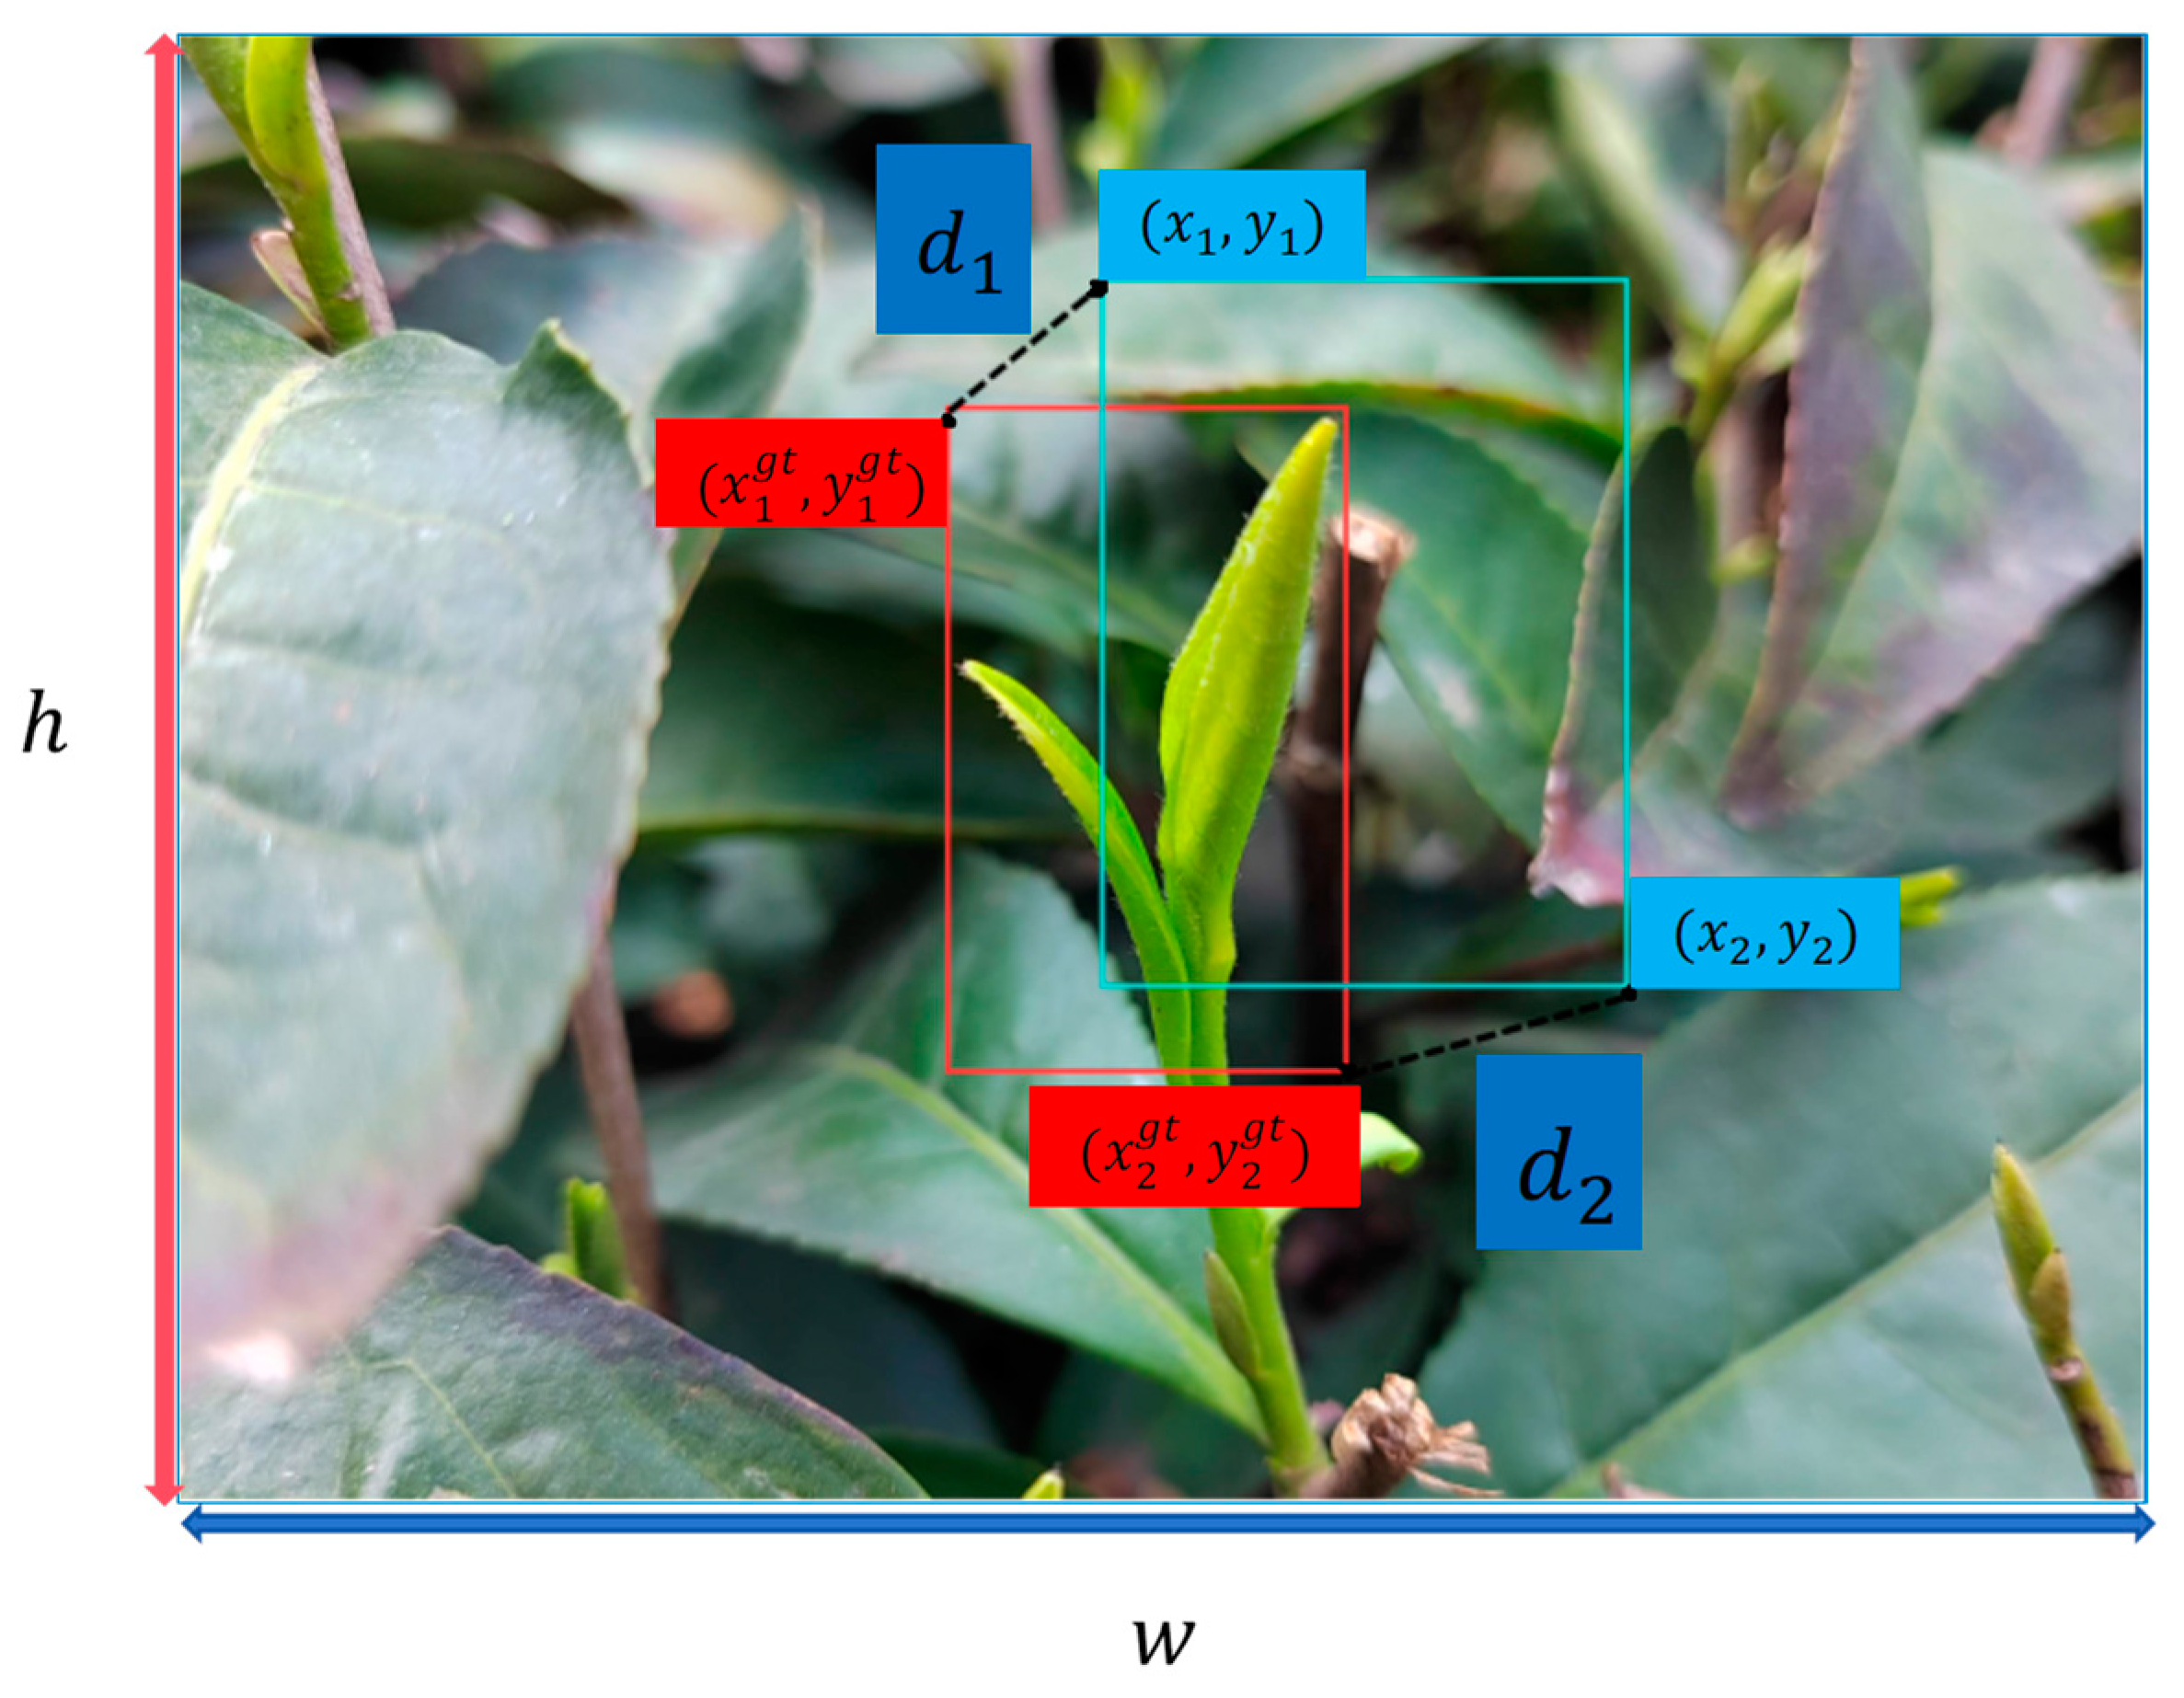
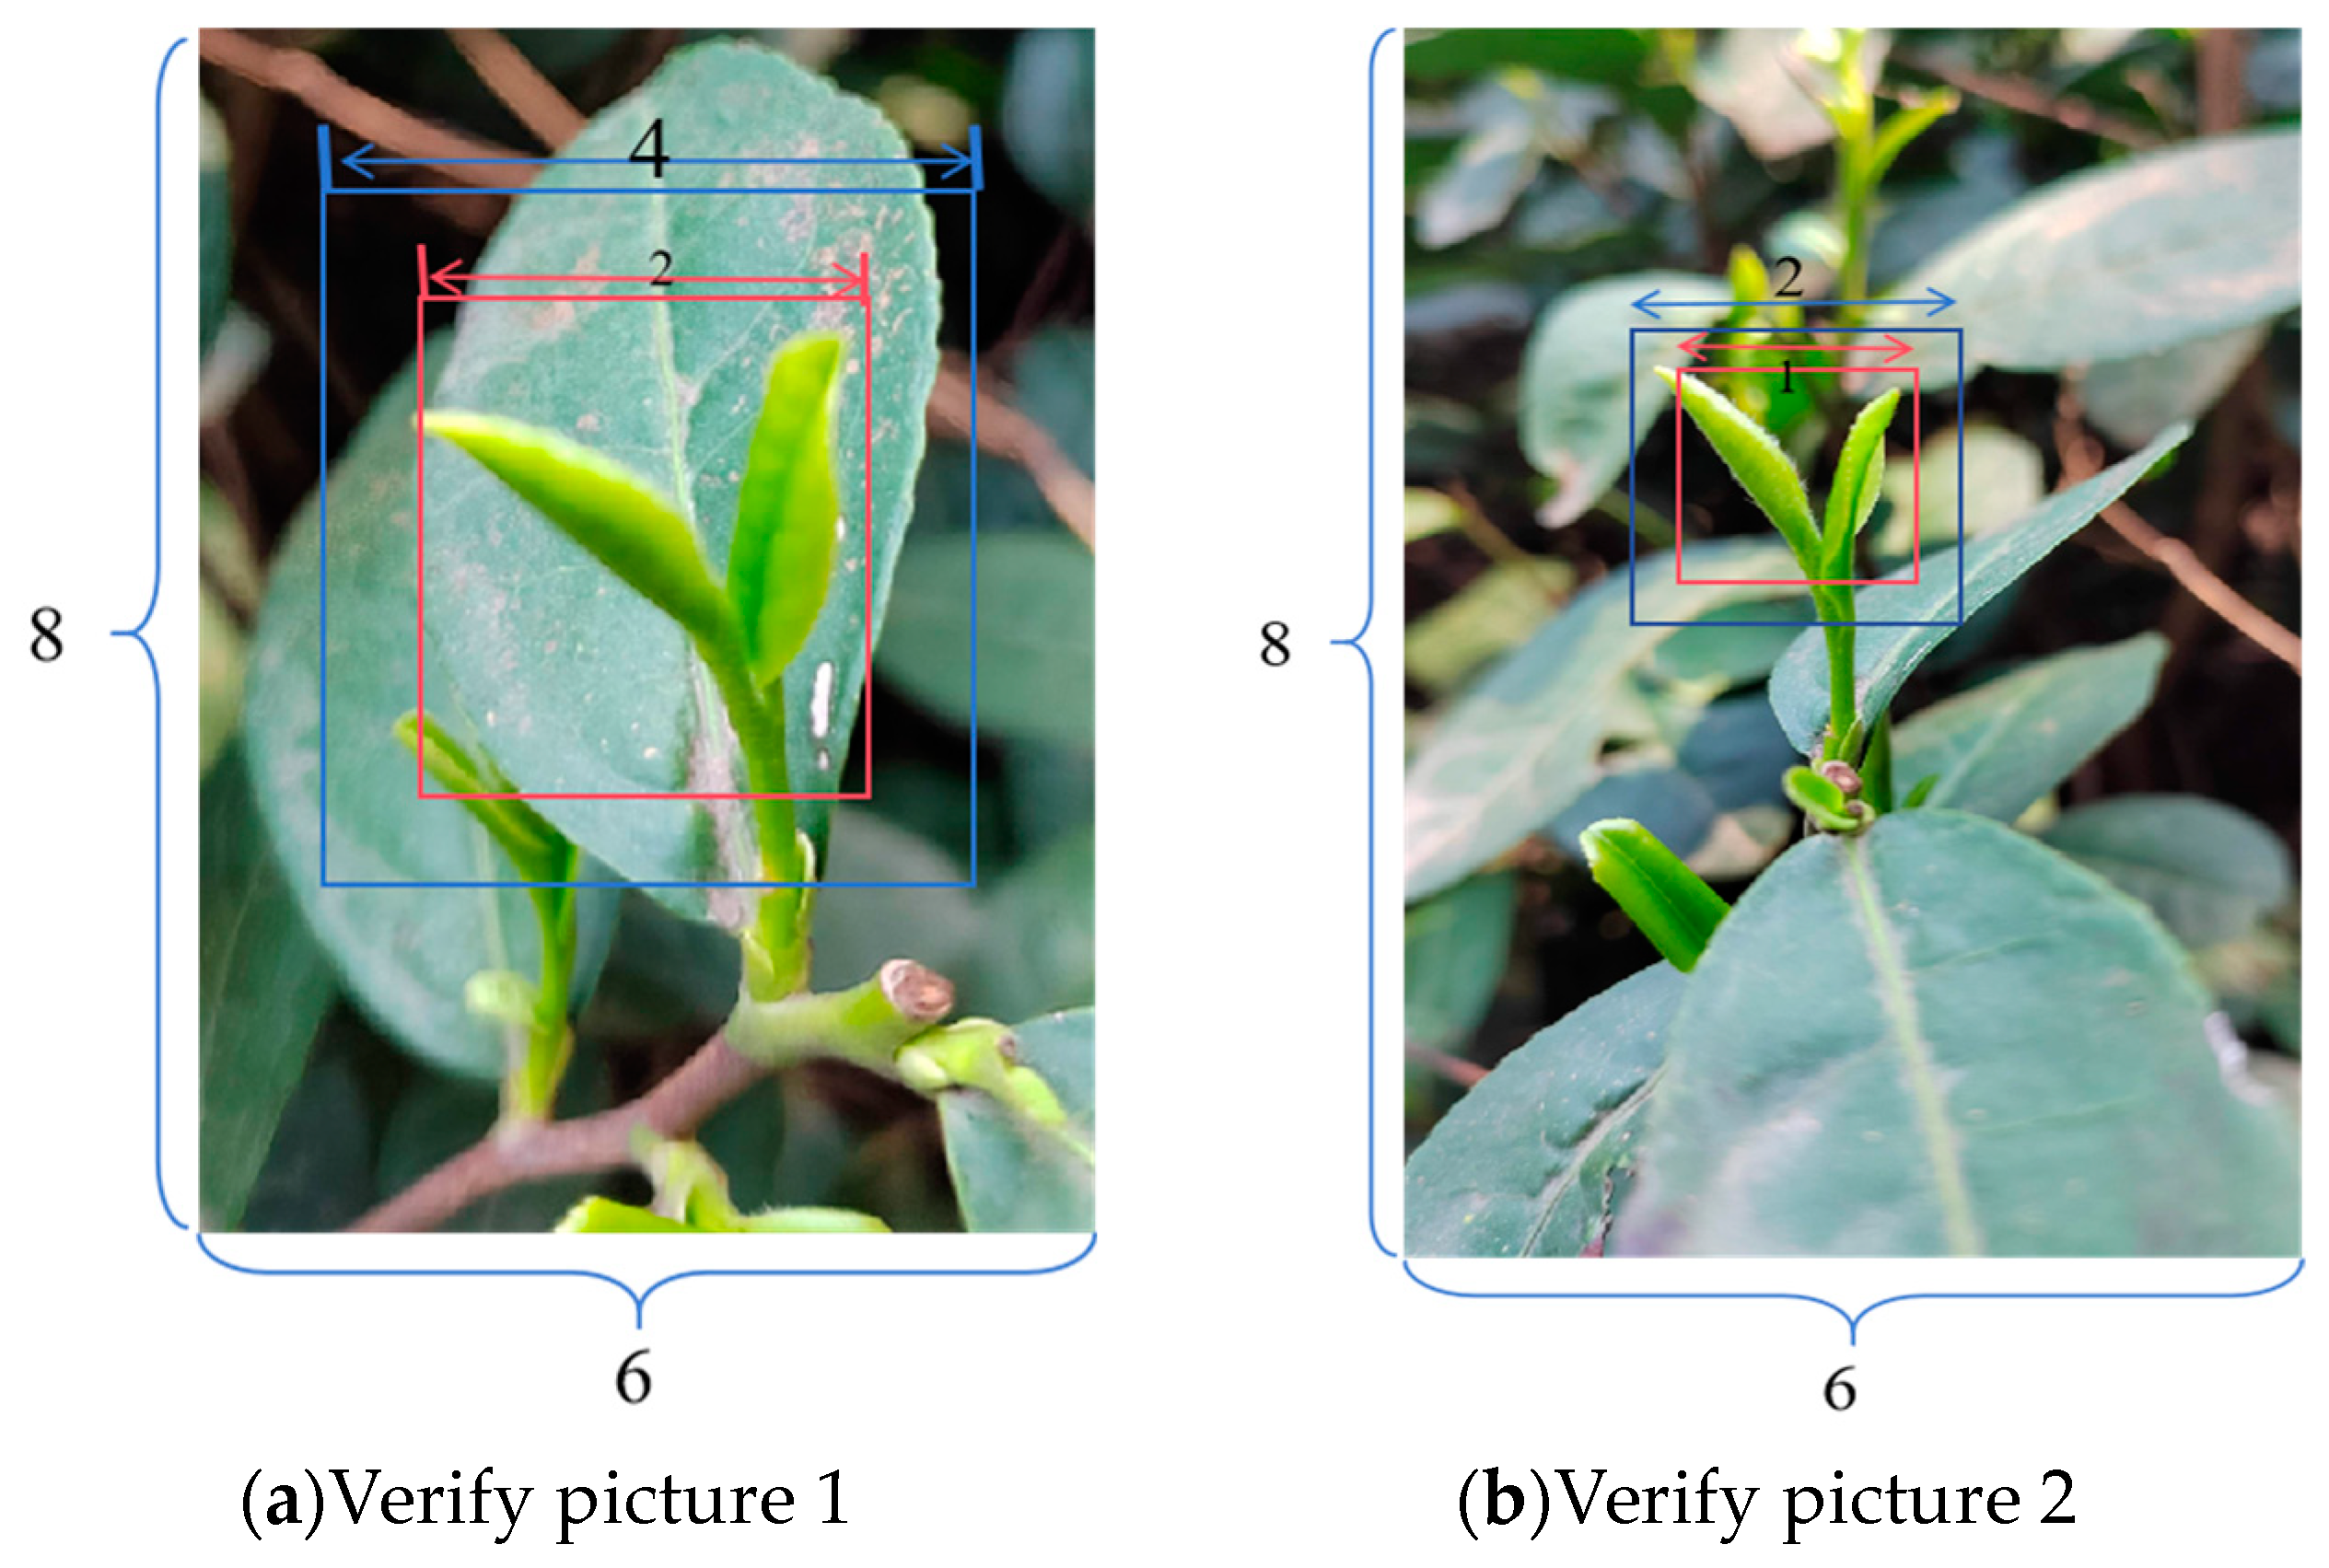
2.3. Machine Vision Inspection Based on YOLO+LFA+mpdiou

Based on the above research, even after it has been processed by the polariser, the accuracy cannot meet the requirements of automatic tea picking. In this study, we propose a method that focuses on the extraction of low-level features (LFA), as shown in Figure 3. In this paper, the results obtained after feature fusion (SPPF) of the spatial pyramid pooling structure in the backbone module of YOLOv5 algorithm module are inputted into the neck module, and the up-sampling link of the neck module is set to be the Lowlevel Feature Alignment (LFA) structure of this paper, and the final iou loss function is replaced by mpdiou, as in Figure 3a.
As shown in Figure 3b, the structure consists of three parts: feature alignment module (FAM), information fusion module (IFM), and information injection module (inject). The data collection process consists of two steps. First, the FAM collects and aligns the features at different levels. IFM then fuses the aligned features to generate global information. After obtaining the fused global information from the collection process, the injection module injects this information using a simple attention operation to enhance the branch detection. In this branch, the output features B1, B2, B3, and B4 obtained from the backbone network are selected for fusion to obtain high-resolution features that retain a small amount of target information.
An average pooling (AvgPool) operation is used in the low-FAM (Low-FAM) to down-sample the input features and achieve uniform size. The Low-FAM technique ensures efficient aggregation of information and minimises computational complexity by resizing the features to the smallest feature size of the group to obtain Falign. The choice of target alignment size is based on two conflicting considerations: larger feature sizes are preferred to retain more low-level information, and the computational latency of subsequent blocks increases as the feature size increases. To control the delay of the intermediate layer, it is necessary to keep the feature size small; therefore, Falign is chosen as the target size for feature alignment so that the model can be accurate without any significant decrease in speed. The low-IFM (Low-IFM) contains multiple layers of reparameterised convolutional blocks (Repconv_Blocks) and splitting operations. Repconv_Blocks accept Falign as input, and the generated features are subsequently split into inject_P4 and inject_P3 in the channel dimension and then fused with different levels of features for input into the subsequent neck network.
However, when a low-level feature alignment scheme is used, the network is less accurate in framing prior frames. In the original iou loss function, YOLOv5 uses the calculation
i o u ( B p , B g t ) = a r e a ( B P B g t ) a r e a ( B p B g t )
Then, the loss is defined as
L i o u = 1 i o u ( B p , B g t )
where Bp is the prediction regression frame, Bgt is the real regression frame, and area is the area to be calculated. From the calculation of the loss function, it can be seen that the main problems of the calculation method are: (1) when the prediction frame and real frame do not overlap at all, the loss is 1, which cannot reflect the distance of the prediction frame from the real frame; (2) when the real frame contains the prediction frame and the size of the real frame and prediction frame is fixed, iou is a fixed value and, no matter where the prediction frame is in the real frame, it is impossible to reflect the accuracy of the prediction. In particular, the second problem greatly affects the accuracy of tea bud recognition in this network structure. Based on this problem, Zheng et al. [28] proposed a new method to calculate the loss function Ciou, which is currently the best loss function:
x 1 c = m i n ( x 1 B , x 1 B g t ) ,   x 2 c = m a x ( x 2 B x 2 B g t )
y 1 c = m i n ( y 1 B , y 1 B g t ) ,   y 2 c = m a x ( y 2 B y 2 B g t )
C = ( x 2 c x 1 c ) 2 + ( y 2 c y 1 c ) 2
C i o u ( B p , B g t ) = i o u ( B p , B g t ) d 2 c 2 α v
v = 4 π ( a r c t a n w g t h g t a r c t a n w h ) 2
α = v 1 i o u ( B p , B g t ) + v
where C is the diagonal length of the smallest rectangular box that can frame the real box and predicted box, d is the distance between the real box and centre of the predicted box, v is the normalisation of the difference between the aspect ratio of the predicted box and real box, and α is a balancing factor that weighs the loss due to the aspect ratio and loss due to the iou part. However, Ciou loses its superiority when the predicted and real bounding boxes have the same aspect ratio but different widths and lengths. Based on this, this study innovatively proposes the mpdiou loss function for the tea bud detection model, which uses the geometrical nature of the input picture in the bounding box regression, as shown in Equation (24).
d 1 = ( x 1 x 1 g t ) 2 + ( y 1 y 1 g t ) 2 ,   d 2 = ( x 2 x 2 g t ) 2 + ( y 2 y 2 g t ) 2
m p d i o u = i o u ( B p , B g t ) d 1 2 w 2 + h 2 d 2 2 w 2 + h 2
L m p d i o u = 1 m p d i o u
where h and w are the height and width of the input image, respectively, ( x 1 g t , y 1 g t ) are the coordinates of the upper left corner of the real frame B g t , ( x 2 g t , y 2 g t ) are the coordinates of the lower right corner of the real frame B g t , ( x 1 , y 1 ) are the coordinates of the upper left corner of the prediction frame B, ( x 2 , y 2 ) are the coordinates of the lower right corner of the prediction frame B, and d 1 , d 2 are the respective distances between the vertices of the upper left and lower right corners of the prediction frame. A schematic diagram is shown in Figure 4.
From Equations (15)–(25), it can be seen that the loss function not only simplifies the computation process and accelerates the computation speed of the model but also makes use of the geometrical properties of the entire picture. The function considers all factors involved in the mainstream iou loss function and solves the problem of ineffectiveness when the predicted and real frames have the same aspect ratio but different widths and heights. For a large number of pictures for the loss function value calculation, the best and worst two pictures were selected as examples, and a simplified experimental demonstration diagram is shown in Figure 5.
Figure 5 shows the case in which the side length ratio of the real frame and predicted frame is the same but the size is different. As shown in Figure 5a, the picture width is 6 cm, the height is 8 cm, and the height and width of the prediction box are 4 cm, and the height and width of the real box are 1 cm. As shown in Figure 5b, the picture width is 6 cm, the height and width of the prediction box are 2 cm, and the height and width of the real box are 1 cm. To show that the mpdiou of this study works better than the current best loss function in this case, the researchers calculated L C i o u and L m p d i o u of Figure 5 to obtain the following Table 2.
Referring to the values in the table, it can be seen that the L m p d i o u proposed here shows an improvement of approximately 0.01–0.03 compared with the currently used L C i o u loss function when the aspect ratios of the real and predicted frames are the same but the frames are different sizes.

3. Results and Discussion

3.1. Image Processing Experiment

According to Equations (11)–(13), image preprocessing was carried out on the test set with a light intensity greater than 5 × 10 4   L u x , and the SSIM, PSNR, and entropy values were calculated according to Equations (1)–(10) for the three methods of contrast adjustment, hue value adjustment, and gamma value adjustment, respectively. Then, the team took pictures with one polariser and two polarisers with angles θ of 0°, 15°, 30°, 45°, 60°, and 75° as experimental pictures when the light intensity in the tea plantation was greater than 5 × 10 4   L u x and compared the effects of different ways of adding polarisers on the images using the three indexes of SSIM, PSNR, and Entropy. Two polarisers with angle θ of 0° in the experiment were used to exclude other interferences to ensure that the experiments were in line with the theory. The ideal image used in the experiment was that without intense light. A record of the experiment is shown in Figure 6.
Analysing Figure 6, it can be seen that, when using the image preprocessing method to optimise the dataset of RGB images captured by the depth camera under the condition of light intensity greater than 5 × 10 4   L u x , the mean values of SSIM, entropy, and PSNR after the contrast adjustment were improved by 3.3%, 8.1%, and 5.3%, respectively, and the Gamma values of the adjusted dataset images were improved by 13.4% and 7.7% compared to the original images under the intense light condition. The mean values of entropy and PSNR of the adjusted images were improved by 13.4% and 7.7% compared to the original image, but this adjustment method resulted in a decrease of 10.1% in the mean value of SSIM, and the mean values of SSIM, entropy, PSNR decreased by 29.7%, 9.2%, and 15.7%, respectively, after the adjustment of RGB values. The above results show that the image preprocessing method has a limited restoration degree for intense light-infested images, and the quality of the obtained image is poorer than that of the ideal image in the three aspects of brightness, contrast, and structure. Moreover, the PSNR value of the image obtained after image preprocessing was not more than 10 dB; according to the judgment index of the PSNR value, this data shows that the image is more cluttered than the ideal image, and it is unsuitable for visual recognition. The entropy value was not greater than 6, which indicates that the loss of image features was too large, the target features were not obvious, and the information content of the image was too small. In summary, current image preprocessing algorithms cannot solve the problem of visual recognition of tea leaves under intense light.
According to the line graph in Figure 5, the mean values of SSIM, entropy, and PSNR of the image evaluation indexes reach the peak when two polarisers with a 30° angle were installed, and the mean values of SSIM, entropy, and PSNR increased by 35.7%, 90.1%, and 33.3% to reach 0.91, 7.31, and 18.2 dB, respectively. Compared with the image preprocessing algorithms, the images processed by this method are much higher quality than those by existing image preprocessing algorithms in terms of information content and are more similar to the structure of the ideal image. Moreover, the noise content is reduced, and the quality of the images is greatly improved. However, as the angle between the two polarisers gradually increases, the values of SSIM, entropy, and PSNR begin to decrease, and, according to Equation (14), because the light intensity decreases significantly at this time, the camera exposure degree is too low, which impairs the image quality.
In summary, under intense light, selecting two polarisers with appropriate angles can effectively improve the image quality and solve the problem of camera overexposure due to intense light. The experimental effects of image processing on the dataset used in this study are shown in Figure 7.

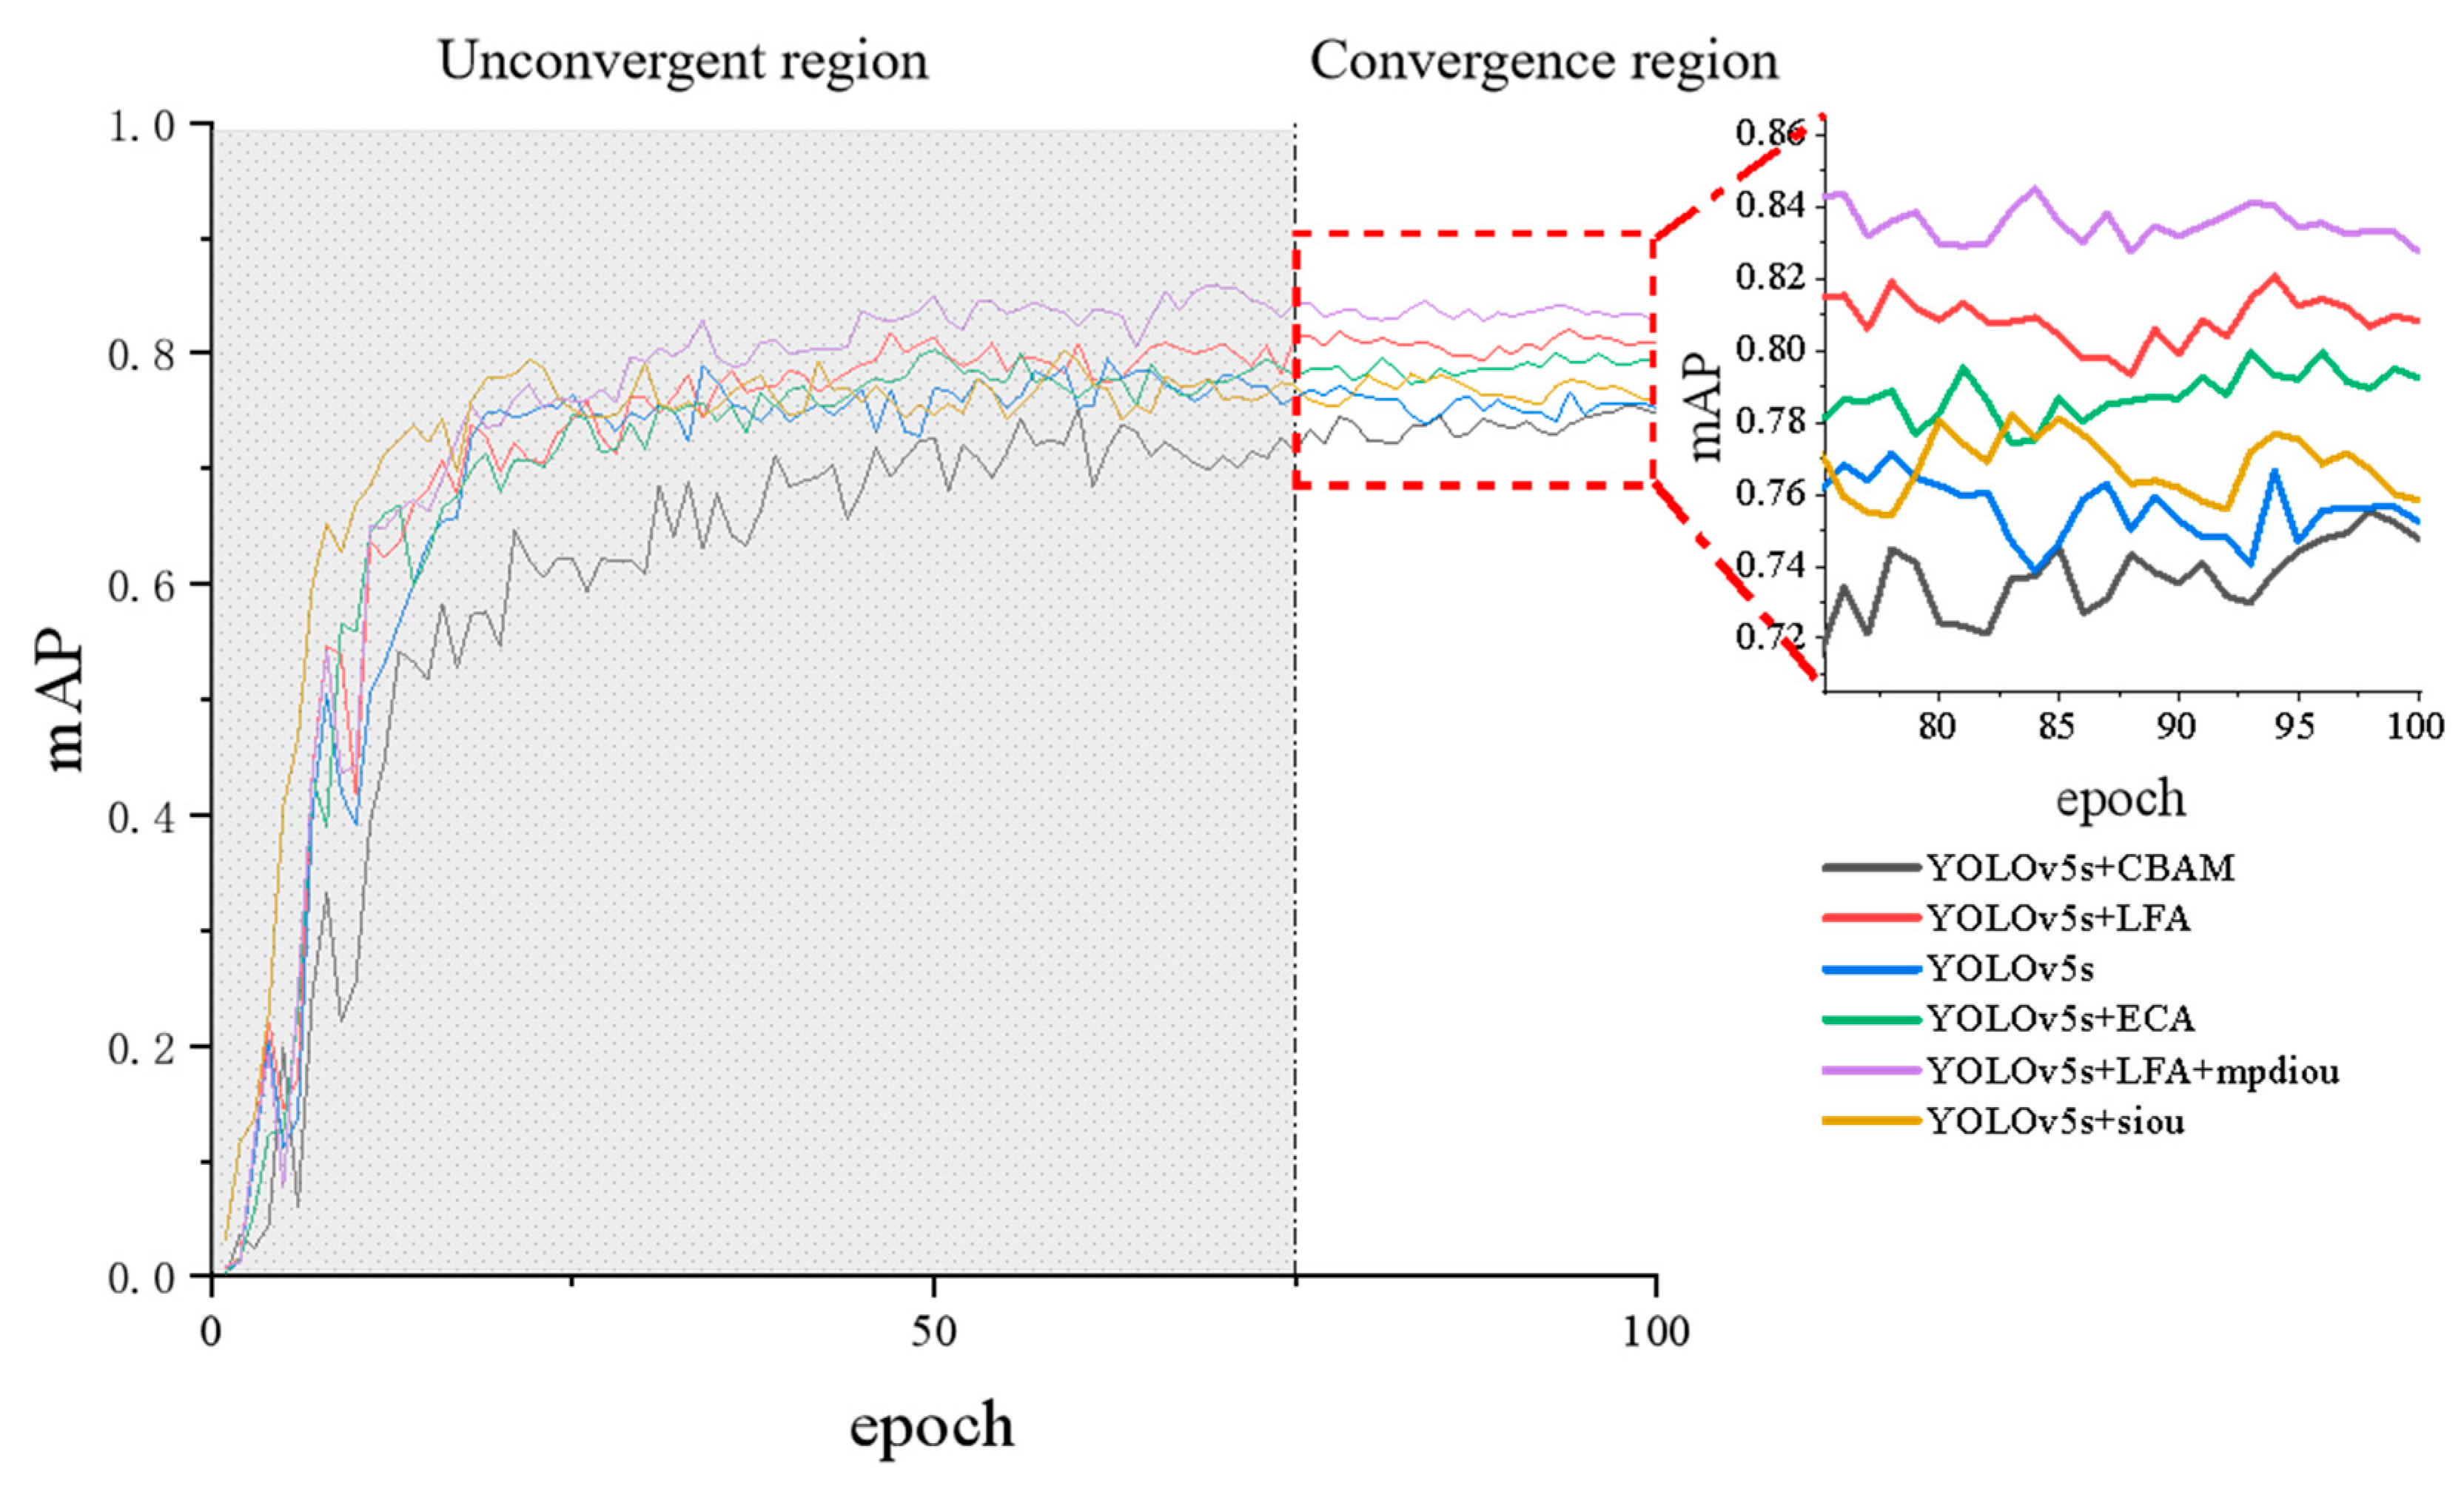
3.2. Evaluation of YOLO+LFA+mpdiou Performance

Based on the above theoretical analysis, we first trained the model on the training set to evaluate its detection effect. In this study, the model was evaluated using several metrics [29], including (mean average precision (mAP), (giga floating-point operations per second (GFlops), and parameters (Params). The above parameters were chosen because AP and mAP consider recall and precision, whereas GFlops is an important computational speed indicator, and parameters are important to consider the model complexity [30]. The formulas are as follows:
R e c a l l = T P T P + F N
P r e c i s i o n = T P T P + F P
A P = i = 1 n 1 ( r i + 1 r i ) p i n t e r p ( r i + 1 )
m A P = i = 1 K A P i K
where TP is the number of predicted positive samples that are correct, TN is the number of predicted negative samples that are correct, FP is the number of predicted positive samples that are negative, and FN is the number of predicted negative samples that are positive. The AP value is calculated using the area under the curve (AUC) calculation method, that is, by calculating the area of the interpolated precision–recall curve enveloped by the X-axis. The mAP calculation formula involves K categories.
The proposed models were compared with the existing YOLOv5s, YOLOv5s+CBAM [13], YOLOv5s+ECA [14], and YOLOv5s+siou [15] models. First, several models were trained with 1450 training set images and, by comparing the magnitude of precision, recall, mAP50, mAP50_95, Params, and GFlops values of each model, we obtained Table 3 and plotted the mAP curves of each model on one axis, as shown in Figure 8 and Table 3.
Table 3 shows that YOLO+LFA+mpdiou performed best when mAP50, mAP50_95, GFlops, and Params are used in combination. The mAP50 values of the YOLOv5s+LFA+mpdiou model are 4.5%, 8.3%, 4.3%, and 3.3% higher than those of the YOLOv5s, YOLOv5s+CBAM, YOLOv5s+ECA, and YOLOv5s+siou, respectively. Compared with YOLOv5s, YOLOv5s+CBAM, YOLOv5s+ECA, and YOLOv5s+siou, the GFlops of the YOLOv5s+LFA+mpdiou model increased by 13.29%, 17.76%, 14.74%, and 19.33%, respectively The parameters of the models also increased by 13.26%, 18.57%, 13.01%,and 12.56% respectively but, considering the overall performances of the models with mAP50 and mAP50_95, YOLOv5s+LFA+mpdiou is still the best.
The mAP50 and mAP50_95 values of YOLOv5s+LFA were 2.1% and 3.6% lower than those of YOLOv5s+LFA+mpdiou, the number of parameters was only 0.1 M lower than that of YOLOv5s+LFA+mpdiou, and the values of GFlops are the same. Therefore, the performance of YOLOv5s+LFA+mpdiou is better than that of YOLOv5s+LFA.
Considering the current problem of tea bud detection, i.e., the accuracy cannot meet the requirements, resulting in a large number of tea buds being missed, a small increase in the number of parameters and floating-point operations in exchange for an increase in mAP value is worthwhile; therefore, the proposed tea bud detection model shows the best performance among current models.

3.3. Evaluation of the Effect of Each Model in Different Environments

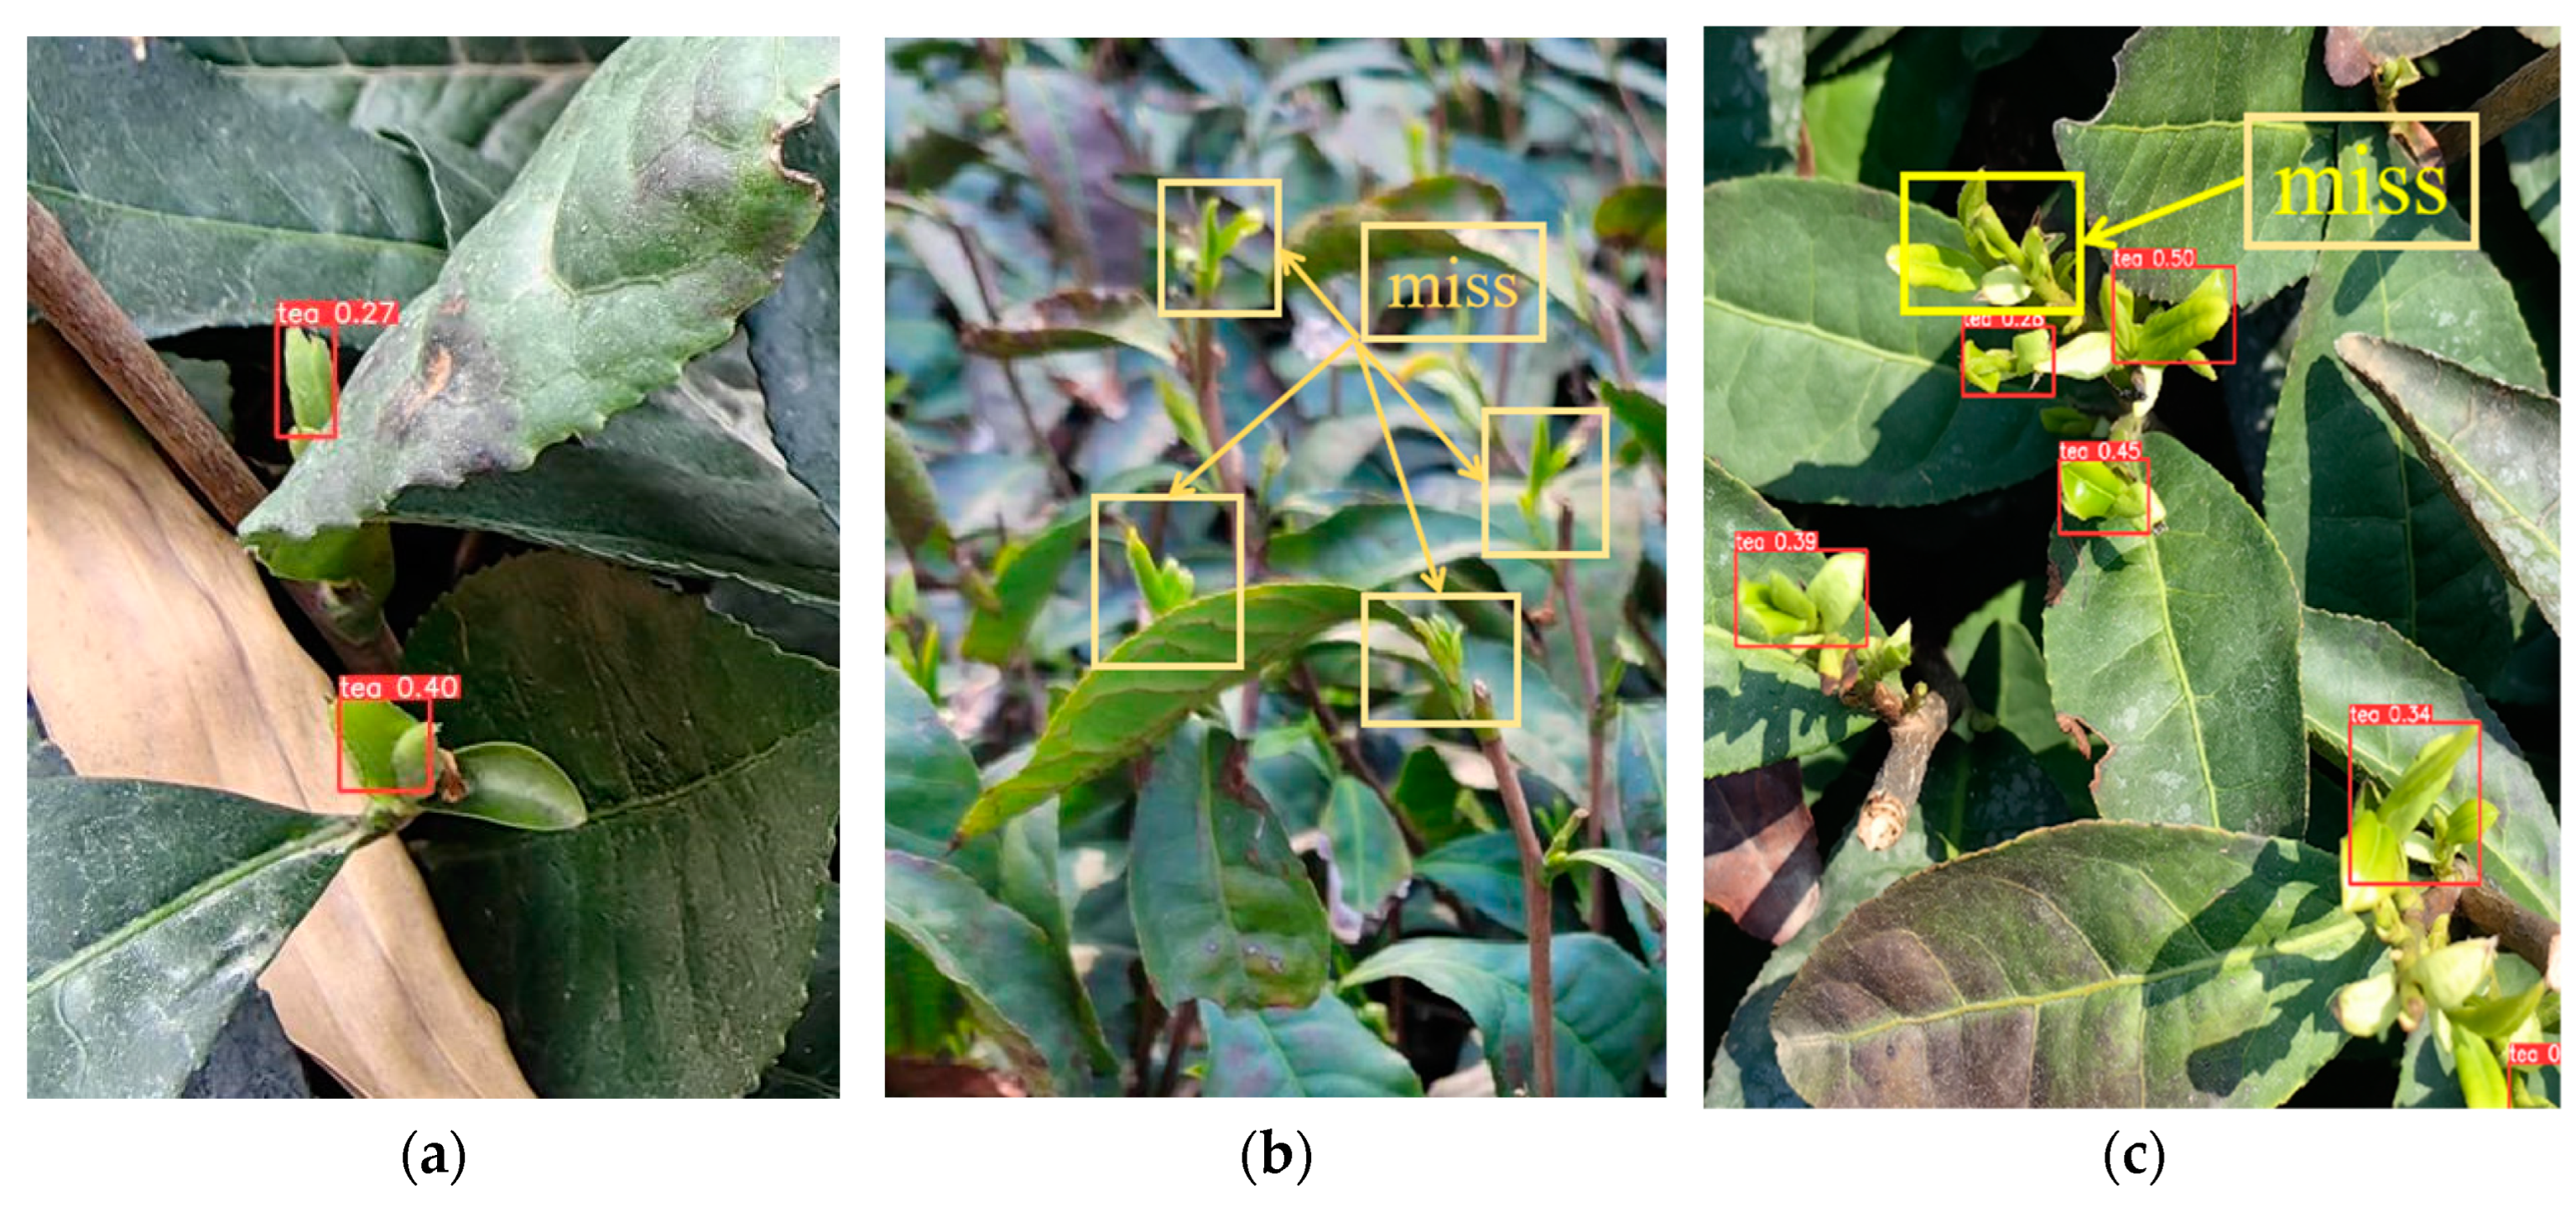
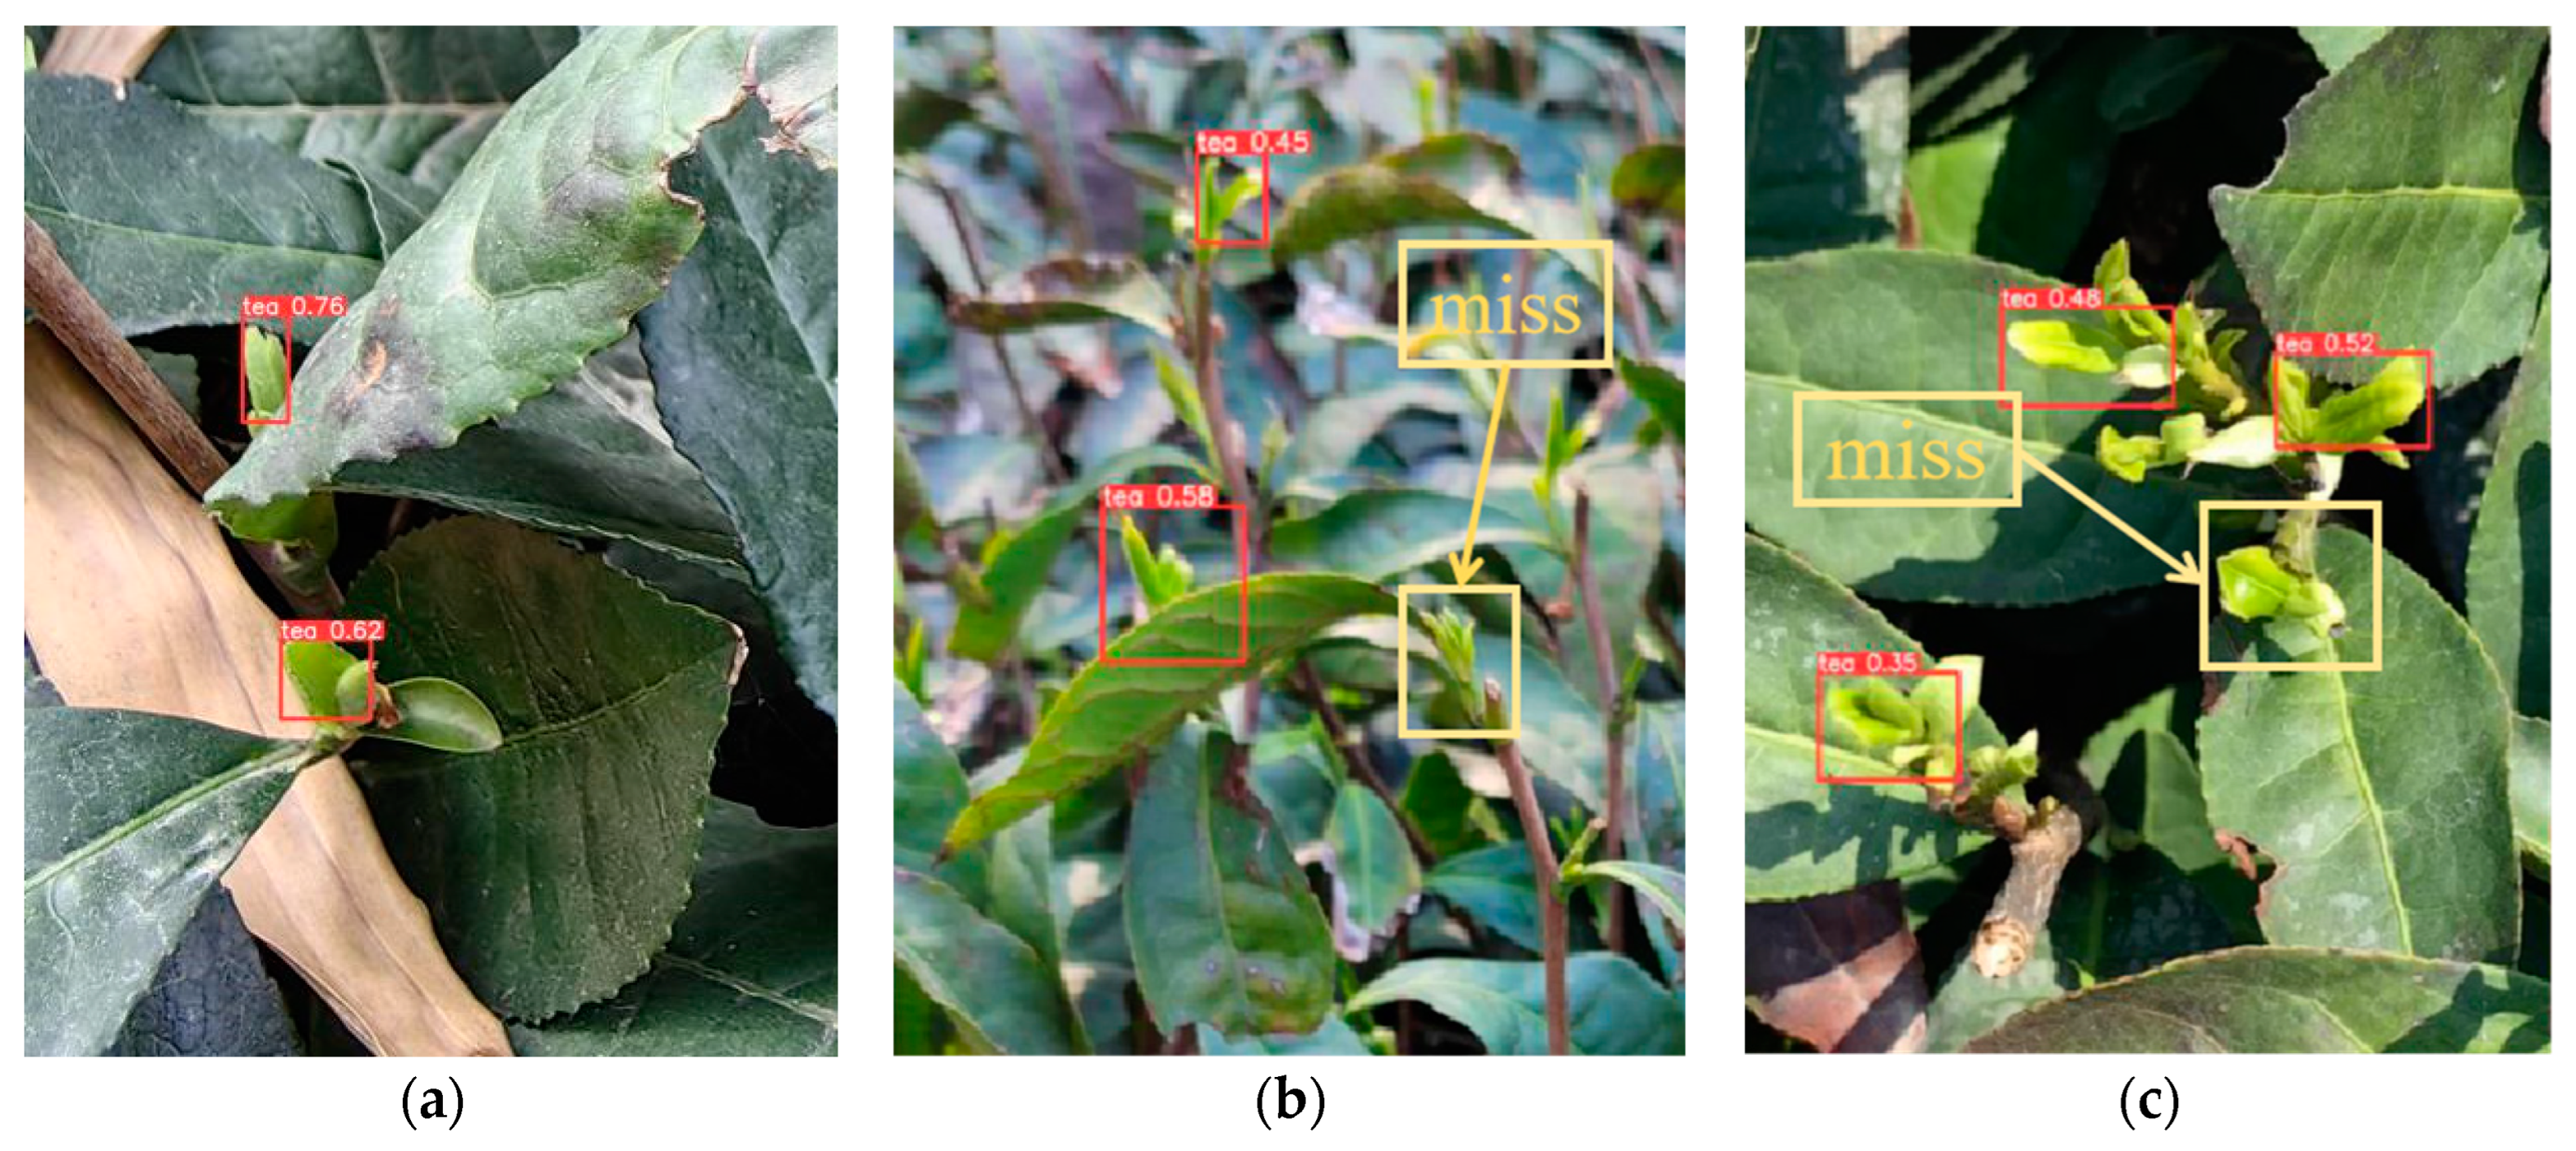
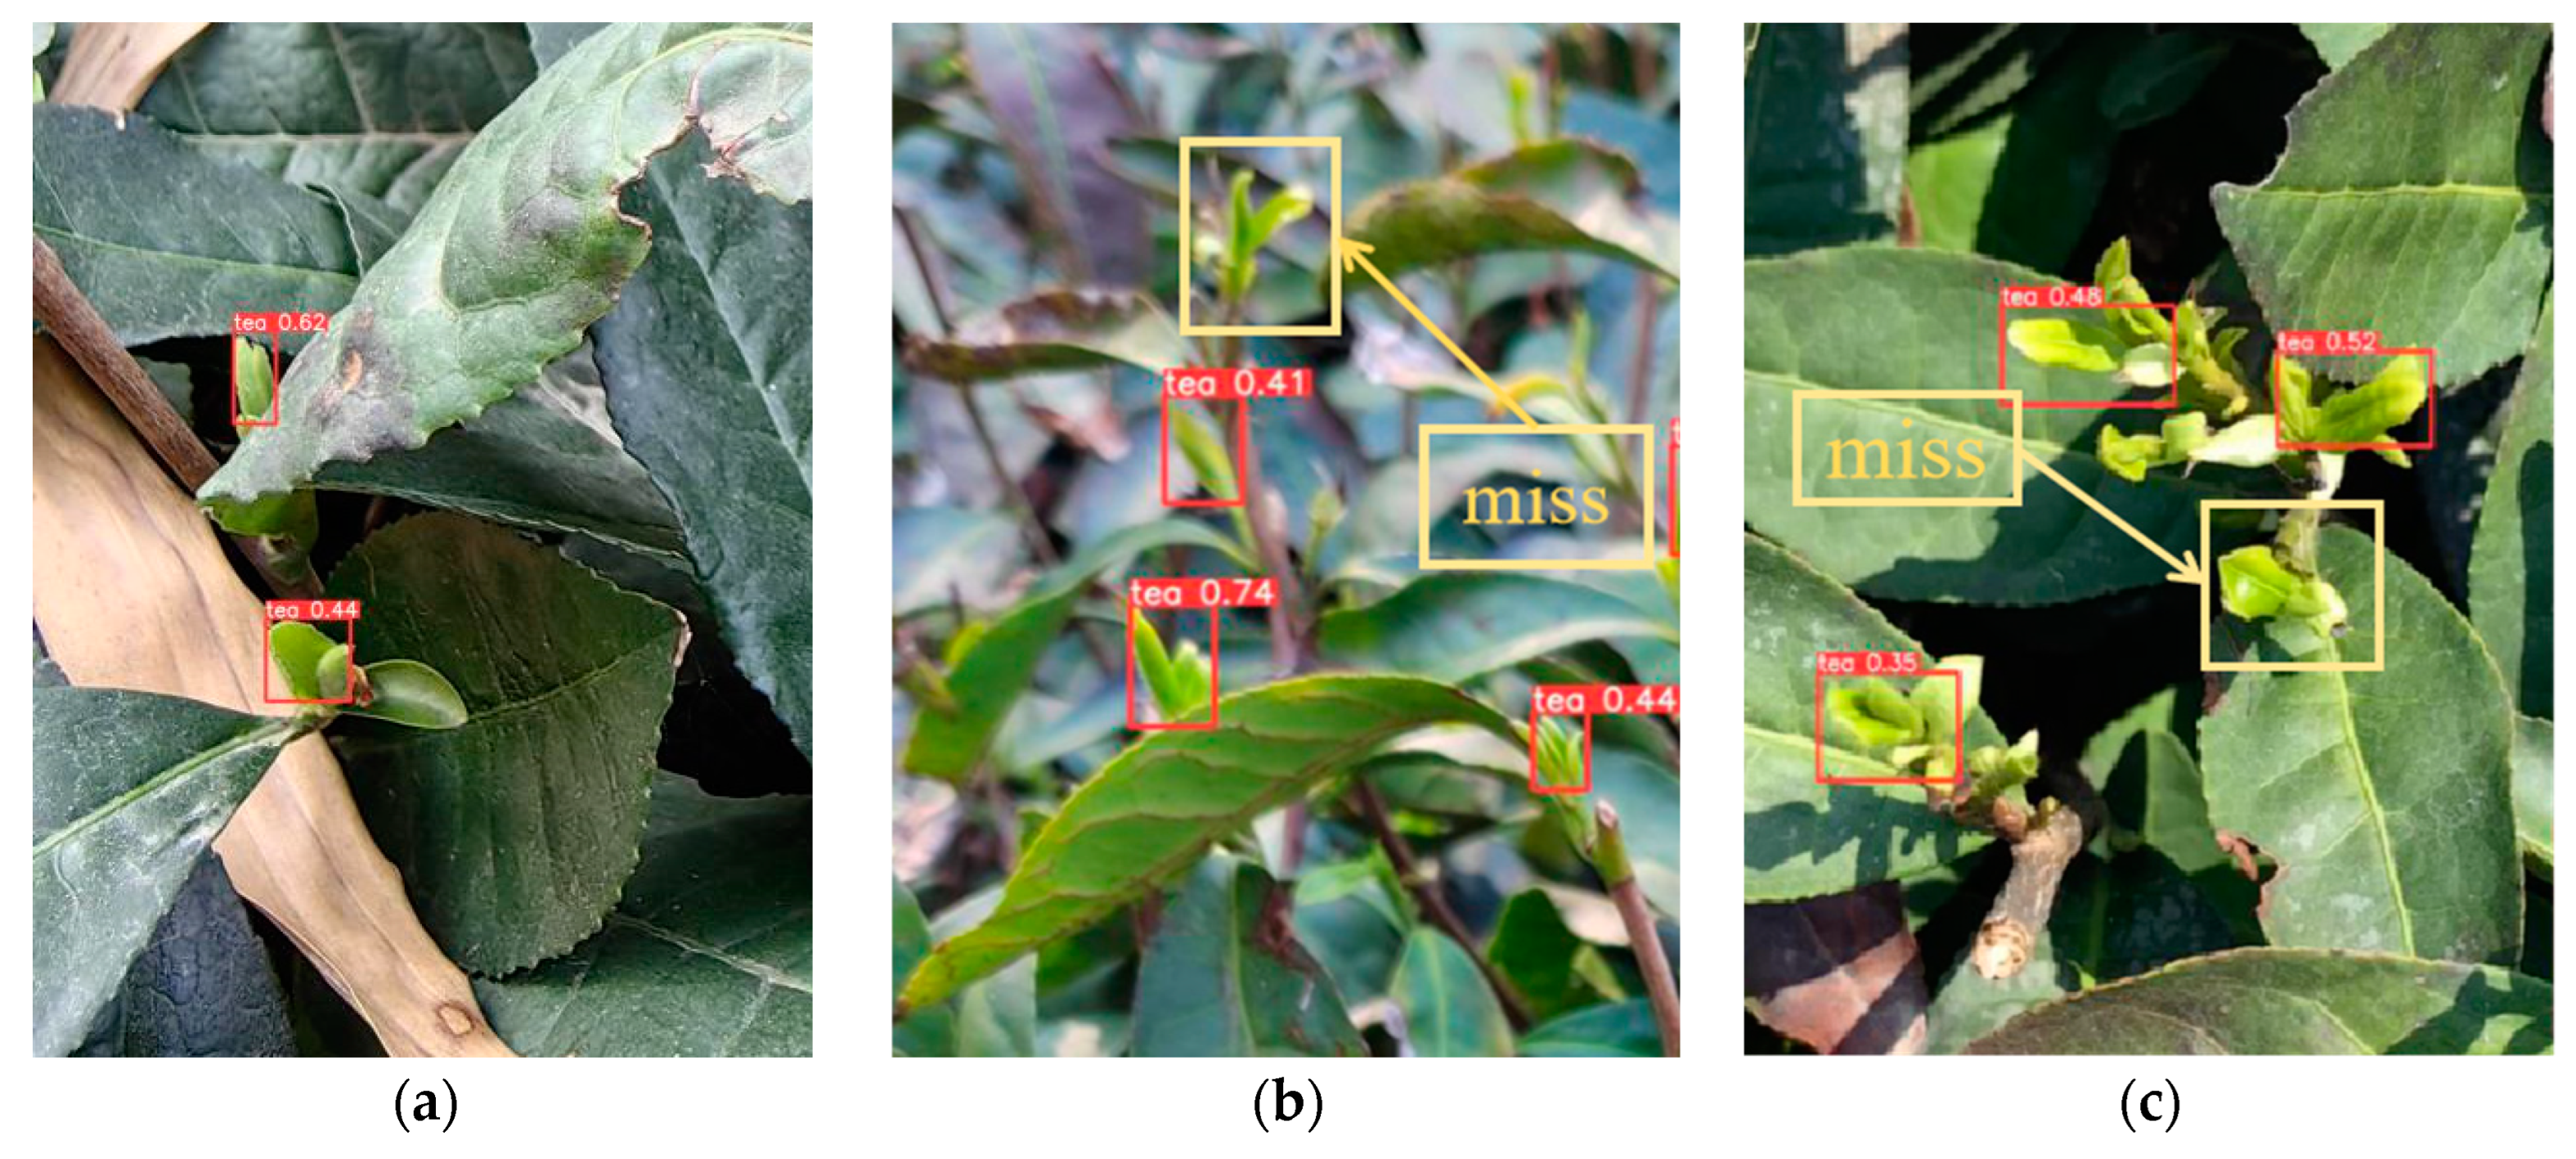
3.3.1. General Light Intensity Test

The researchers applied the trained YOLOv5s, YOLOv5s+CBAM, YOLOv5s+ECA, YOLOv5s+siou, and YOLOv5s+LFA+mpdiou models to a test set with a light intensity of 1 × 10 3 3 × 10 4   L u x and observed the leakage and false rates of each model.
As can be seen from Figure 9, Figure 10, Figure 11, Figure 12 and Figure 13, the improved YOLOv5s+LFA+mpdiou has the best comprehensive recognition effect and is the most accurate and comprehensive for the recognition of tea with different numbers of buds and complex backgrounds. YOLOv5s, YOLOv5s+CBAM, YOLOv5s+ECA, and YOLOv5s+siou have different degrees of omissions in the identification of tea buds, as shown in the orange box in Figure 9a, and these models have serious omissions or drastically reduced accuracy when tea buds are partially obscured. As shown in the orange boxes in the figure, these models have serious leakage detection or a sharp decrease in accuracy when the tea buds are partially occluded, as shown in Figure 9a,b, while YOLOv5s+LFA+mpdiou does not have the same accuracy in detecting the tea buds of small targets compared to YOLOv5s, YOLOv5s+CBAM, YOLOv5s+ECA, and YOLOv5s+siou, nor does it have a different degree of omission in identifying the tea buds, as shown in Figure 9a,b. No missed detections were observed. The iou values of tea buds are also higher when the proposed model in this study detects under top-view condition, as shown in Figure 9 and Figure 13c. The proposed model has an average improvement of 300%, 40%, 100%, and 120% compared to YOLOv5s, YOLOv5s+CBAM, YOLOv5s+ECA, and YOLOv5s+siou for the detection of tea buds under top-view conditions, respectively. Moreover, YOLOv5s+LFA+mpdiou solves the problem of under-detection of tea buds from the top view. The leakage detection problem of tea buds in top view is very serious in YOLOv5s, YOLOv5s+CBAM, YOLOv5s+ECA, YOLOv5s+siou, as shown in Figure 9, Figure 10, Figure 11, Figure 12c and Figure 13, there is no leakage detection in YOLOv5s+LFA+mpdiou.
Subsequently, the researchers produced statistics and calculations of the leakage detection rate and false rate for the images in the test set with a light intensity of 1 × 10 3 3 × 10 4   L u x .
Under normal light conditions, the numbers of false detections of YOLOv5s, YOLOv5s+CBAM, YOLOv5s+ECA, and YOLOv5s+siou were significantly higher than that of the YOLOv5s+LFA+mpdiou model. In actual agricultural harvesting, people often need to determine a confidence range of the tea buds identified by the network; the higher the confidence, the higher the number of tea buds, and the more tea buds will be in line with the famous tea buds. However, if the confidence level is too high, it will cause leakage of the tea buds For the miss and false rates, the following formulas were used:
m i s s r a t e + R e c a l l = 1
f a l s e r a t e = F P T N + F P
According to Equations (30) and (31), the researchers calculated statistics for the misdetection rate in the test set with a light intensity of 1 × 10 3 3 × 10 4   L u x , and the comparison is shown in Table 4.
The miss rate is the ratio of identified tea buds to the total number of tea buds, and the false rate is the ratio of identified non-tea buds to the total number of identified tea buds. It can be seen that the YOLOv5s+LFA+mpdiou model in practical application at iou = 0.5 achieved a miss rate 2.7% lower than the optimal value in YOLOv5s, YOLOv5s+CBAM, YOLOv5s+ECA, and YOLOv5s+siou, and the false rate is approximately 5.7% lower than the optimal value. At iou = 0.6, the miss rate of the YOLOv5s+LFA+mpdiou model is 4.9% lower than the optimal value in YOLOv5s, YOLOv5s+CBAM, YOLOv5s+ECA, YOLOv5s+siou. 4.9% and the false rate is 1.3% lower than the optimal value in YOLOv5s, YOLOv5s+CBAM, YOLOv5s+ECA, YOLOv5s+siou. At iou = 0.7, the misdetection rate of the YOLOv5s+LFA+mpdiou model is 4.5% lower than the optimal value of YOLOv5s, YOLOv5s+CBAM, YOLOv5s+ ECA, YOLOv5s+siou, and the false rate is 6.8% lower. At iou = 0.8, the miss rate of the YOLOv5s+LFA+mpdiou model is reduced by 3.3% compared to YOLOv5s YOLOv5s, YOLOv5s+CBAM, YOLOv5s+ECA, YOLOv5s+siou, and the false rate is reduced by 4.0%. The YOLOv5s+LFA+mpdiou model outperforms the YOLOv5s, YOLOv5s+CBAM, YOLOv5s+ECA, and YOLOv5s+siou models in terms of accuracy under all iou parameters. This will be of great significance for the automation and precision of tea picking in the future.

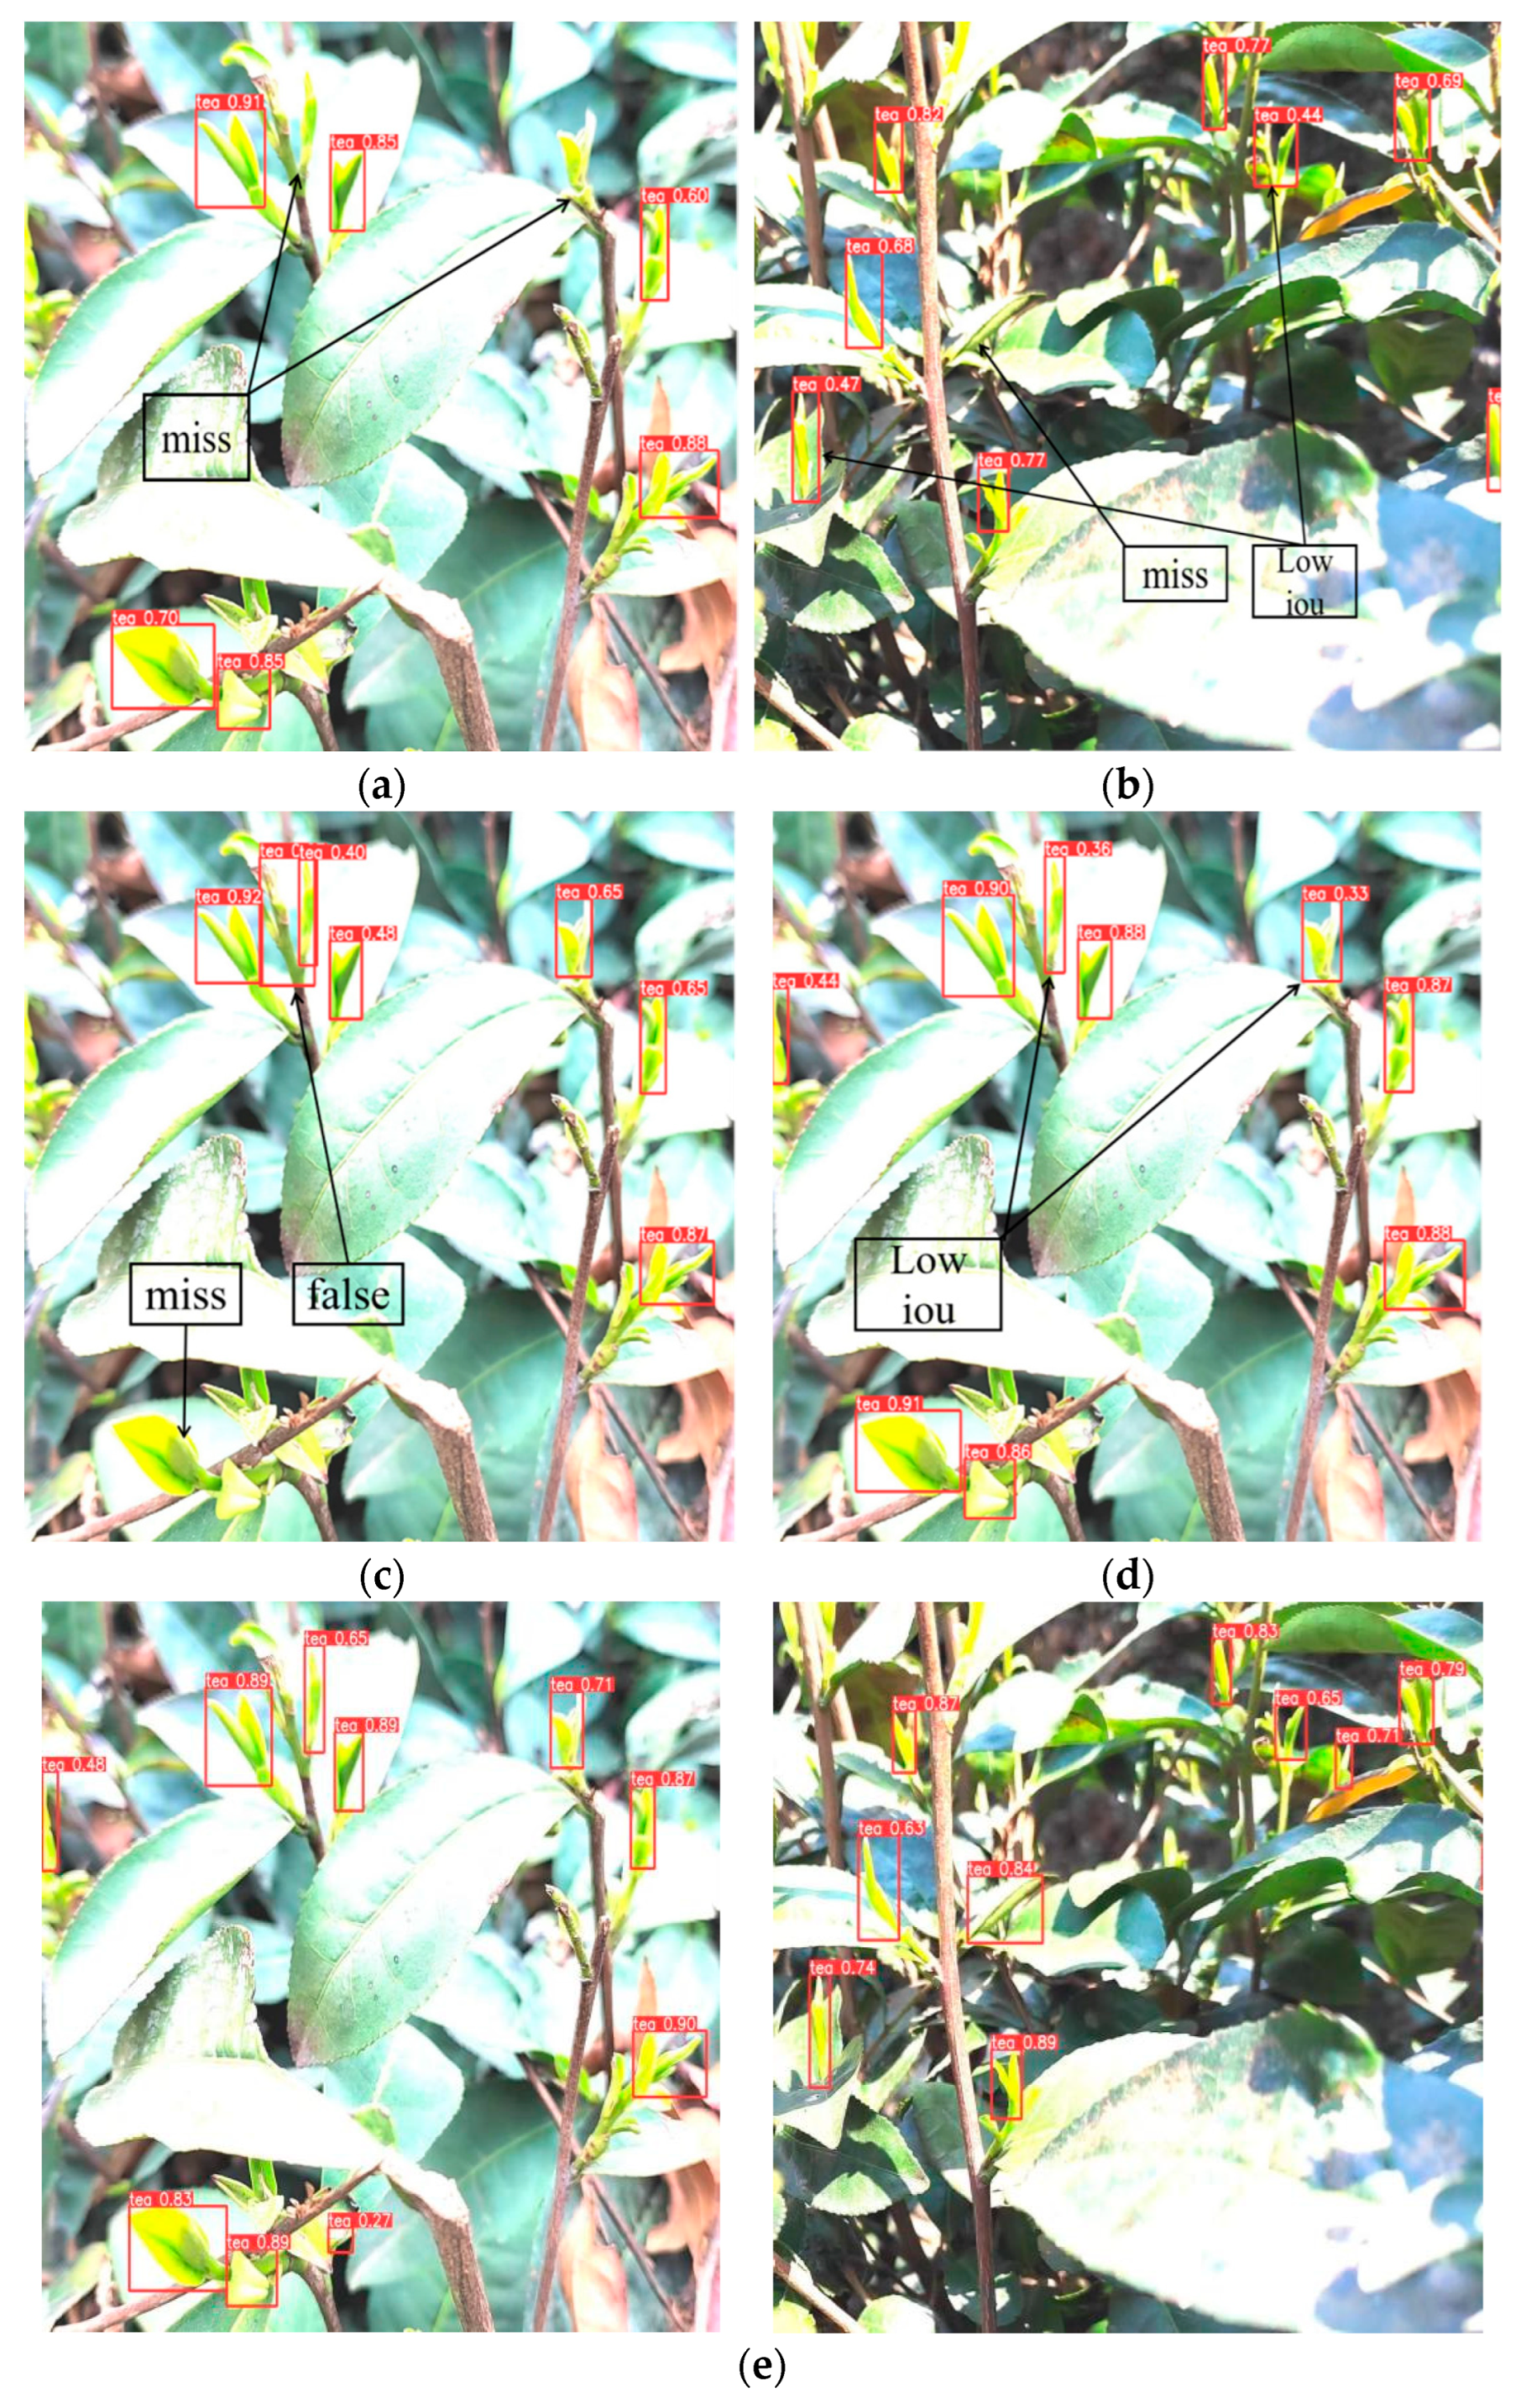
3.3.2. Intense Light Test

The researchers also applied the proposed model to a test set with a light intensity greater than 5 × 10 4   L u x to observe the model’s resistance to intense light and compared it with other detection models, as shown in Figure 14.
From the above effect diagrams, it can be seen that the YOLOv5s+LFA+mpdiou model also shows good superiority and robustness compared to YOLOv5s, YOLOv5s+CBAM, YOLOv5s+ECA, and YOLOv5s+siou when used under the influence of intense light. As can be seen in Figure 14, YOLOv5s, YOLOv5s+CBAM, YOLOv5s+ECA, and YOLOv5s+siou are affected to a greater extent in the intense light-infested regions, which recognises some of the strong-light regions as tea shoots, resulting in omission, misdetection, and poor accuracy. This is unfavourable for future deployment in automated tea picking, whereas the proposed model is not affected by intense light and can still accurately identify tea shoots without false detection.

3.4. YOLOv5s+LFA+mpdiou+PF Test

3.4.1. Normal Light Intensity Test

Based on the experiments involving the YOLO model improvement and PF image preprocessing methods, the researchers further explored the use of the YOLO+LFA+mpdiou+PF method in daily outdoor situations without intense light (light intensity: 1 × 10 3 1 × 10 4   L u x ) and in nighttime low light situations (light intensity: ~ 0.1 1   L u x ). The researchers deployed the YOLO+LFA+mpdiou+PF model on an actual tea plantation and calculated the misdetection and omission rates of each model under light intensities of 1 × 10 3 1 × 10 4   L u x and 0.1 1   L u x . The experimental results are presented in Table 5.
Analysing the above table, in the daily outdoor situation without intense light, the gain in the detection effect caused by adding a polariser and not adding a polariser is not very obvious; in the absence of adding the appropriate angle of the polariser, the miss rate of the YOLOv5s+LFA+mpdiou model is even higher than that of the YOLOv5s+PF+LFA+mpdiou model by 0.05%, and in the outdoor situation of low light, the detection accuracy of tea buds is weakened. At this time, the tea bud detection environment needs light; according to the Malus theorem, the polariser will make the light intensity weaker, which will weaken the accuracy of tea bud detection. In this case, the best YOLOv5s+LFA+mpdiou can improve by approximately 4% compared to YOLOv5s. It can be seen that, in the case of no intense light outdoors, the YOLOv5s+LFA+mpdiou method has a higher detection accuracy than the method with the addition of a polariser, and the miss rate can be increased by 5% and false rate by approximately 6%. In the case of low light outdoors, the miss rate of YOLOv5s+LFA+mpdiou can be increased by 5% and false rate by 6% compared to the method with the addition of a polariser. Not only that, but the model proposed in this paper is also a great improvement over the current model. In the absence of strong outdoor light, the missed detection rate and false detection rate of the YOLOv5s+LFA+mpdiou model were 3.25% and 4.3% lower than those of the most effective YOLOv5s+ECA, respectively, and the missed detection rate and false detection rate of the YOLOv5s+LFA+mpdiou model were 2.89% and 3.2% lower than those of the most effective YOLOv5s+ECA in outdoor low light, respectively.

3.4.2. Intense Light Test

After the researchers verified the effect of the model under normal light conditions, the PF and LFA+mpdiou models were combined to verify the effectiveness of the proposed method at light intensities greater than 5 × 10 4   L u x . The researchers deployed the model in a tea plantation with a light intensity greater than 5 × 10 4   L u x , and the detection threshold iou was taken as 0.7. The false and misdetection rates of the model were calculated. The experimental results are shown in Figure 15.
Analysis of Figure 15 reveals that the miss rates of YOLOv5s+siou, YOLOv5s+ECA, and YOLOv5s+CBAM decrease by 3.25%, 2.57%, and 0.95%, and the misdetection rates decrease by 1.09%, 0.17%, and 0.87%, respectively, when the light intensity is greater than 5 × 10 4   L u x , and the effects are not satisfactory. Meanwhile, the proposed YOLOv5s+PF+LFA+mpdiou model has a lower misdetection rate at light intensities above 5 × 10 4   L u x , and it has a better performance. The YOLOv5s+PF+LFA+mpdiou model can detect most of the tea buds when the light intensity is greater than 5 × 10 4   L u x , the miss rate and false rate decreased by 36.12% and 14.57%, respectively, compared with those of YOLOv5s, and the miss rate and false rate of this model were only 9.32% and 6.42%.

4. Conclusions

4.1. Conclusions

Based on the above experimental results, the researchers obtained the following conclusions:
(1)
When the outdoor strong light exceeds the intensity of ambient lighting, the PF method proposed in this study can significantly enhance image quality, as evidenced by a 35.7% increase in SSIM, 90.1% improvement in PSNR, and 33.3% boost in entropy compared to the original image. In other words, selecting two polarisers at appropriate angles for capturing images under intense lighting conditions can effectively prevent overexposure and improve the overall image quality.
(2)
The YOLOv5+LFA method proposed in this study enhances the detection accuracy across varying lighting conditions, including strong, ordinary, and low light conditions. Compared to the current mainstream detection algorithms’ optimal mAP value, our model achieved an approximate 4% enhancement.
(3)
The YOLOv5+LFA+mpdiou+PF method presented in this research effectively addresses the challenges posed by strong light in tea bud visual recognition tasks. Compared to existing mainstream methods, it reduces misdetection rates by approximately 35% while also decreasing false positive rates by approximately 10%. However, when operating outdoors without significantly strong or weak lighting conditions present, this model may not be necessary; instead, utilising the proposed YOLOv5s+LFA+mpdiou approach will suffice to improve tea bud picking accuracy by approximately 4% compared with the current optimal mainstream detection model.

4.2. Future Work

Although the improved polariser filter and YOLO algorithm methods introduced in this study successfully tackle tea bud recognition issues under intense lighting conditions, different processing approaches should be selected based on the specific levels of illumination intensity encountered during practical applications. Moving forward, the researchers aim to further automate these technologies and select suitable methods outlined in this study according to the prevailing lighting conditions.

Author Contributions

Conceptualization, J.P.; methodology, J.P.; validation, J.P. and Y.Z.; formal analysis, J.P.; resources, Y.Z., J.X., Y.S. and X.W.; data curation, Y.Z. and X.W.; writing—original draft, J.P.; writing—review and editing, X.W. and J.P.; visualization, J.P.; supervision, X.W.; project administration, Y.Z. and X.W.; funding acquisition, Y.Z. All authors have read and agreed to the published version of the manuscript.

Funding

This research was supported by the Jiangsu Province modern agricultural machinery equipment and technology demonstration project (NJ2023-07), National key research and development plan (2023YFD2000303-04), and Key R&D Program of Jiangsu Province (BE2021016).

Data Availability Statement

The datasets presented in this article are not readily available because the data set is the result of long-term collection and is time dependent. Requests to access the datasets should be directed to [email protected].

Acknowledgments

Jinyi Peng would like to thank Yongnian Zhang for support and for patience, company, and encouragement.

Conflicts of Interest

The authors declare that they have no known competing financial interests or personal relationships that could appear to have influenced the work reported in this paper.

References

  1. Higdon, J.V.; Frei, B. Tea catechins and polyphenols: Health effects, metabolism, and antioxidant functions. Crit. Rev. Food Sci. Nutr. 2003, 43, 89–143. [Google Scholar] [CrossRef] [PubMed]
  2. Zhang, J.X.; Feng, W.Z.; Xiong, Z.C.; Dong, S.; Sheng, C.Y.; Wu, Y.D.; Deng, G.J.; Deng, W.W.; Ning, J.M. Investigation of the effect of over-fired drying on the taste and aroma of Lu’an Guapian tea using metabolomics and sensory histology techniques. Food Chem. 2024, 437, 137851. [Google Scholar] [CrossRef]
  3. Zhang, F.Y.; Sun, H.W.; Xie, S.; Dong, C.W.; Li, Y.; Xu, Y.T.; Zhang, Z.W.; Chen, F.N. A tea bud segmentation, detection and picking point localization based on the MDY7-3PTB model. Front. Plant Sci. 2023, 14, 1199473. [Google Scholar] [CrossRef]
  4. Luo, K.; Zhang, X.C.; Cao, C.M.; Wu, Z.M.; Qin, K.; Wang, C.; Li, W.Q.; Chen, L.; Chen, W. Continuous identification of the tea shoot tip and accurate positioning of picking points for a harvesting from standard plantations. Front. Plant Sci. 2023, 14, 1211279. [Google Scholar] [CrossRef] [PubMed]
  5. Ren, S.Q.; He, K.M.; Girshick, R.; Sun, J. Faster R-CNN: Towards Real-Time Object Detection with Region Proposal Networks. In Proceedings of the 29th Annual Conference on Neural Information Processing Systems (NIPS), Montreal, QC, Canada, 7–12 December 2016; Volume 39, pp. 1137–1149. [Google Scholar] [CrossRef]
  6. Zhang, L.; Zhang, H.D.; Chen, Y.D.; Dai, S.H.; Li, X.M.; Imou, K.; Liu, Z.H.; Li, M. Real-time monitoring of optimum timing for harvesting fresh tea leaves based on machine vision. Int. J. Agric. Biol. Eng. 2019, 12, 6–9. [Google Scholar] [CrossRef]
  7. LeCun, Y.; Bengio, Y.; Hinton, G. Deep learning. Nature 2015, 521, 436–444. [Google Scholar] [CrossRef]
  8. Redmon, J.; Divvala, S.; Girshick, R.; Farhadi, A. You Only Look Once: Unified, Real-Time Object Detection. In Proceedings of the 2016 IEEE Conference on Computer Vision and Pattern Recognition (CVPR), Seattle, WA, USA, 27–30 June 2016. [Google Scholar] [CrossRef]
  9. Mirhaji, H.; Soleymani, M.; Asakereh, A.; Mehdizadeh, S.A. Fruit detection and load estimation of an orange orchard using the YOLO models through simple approaches in different imaging and illumination conditions. Comput. Electron. Agric. 2021, 191, 106533. [Google Scholar] [CrossRef]
  10. Liu, J.; Wang, X.W. Tomato Diseases and Pests Detection Based on Improved Yolo V3 Convolutional Neural Network. Front. Plant Sci. 2020, 11, 898. [Google Scholar] [CrossRef] [PubMed]
  11. Redmon, J.; Farhadi, A. YOLO9000: Better, Faster, Stronger. In Proceedings of the 30th IEEE/CVF Conference on Computer Vision and Pattern Recognition (CVPR), Honolulu, HI, USA, 21–26 July 2017; pp. 6517–6525. [Google Scholar] [CrossRef]
  12. Bouwmans, T.; Jayed, S.; Sultana, M.; Jung, S.K. Deep neural network concepts for background subtraction: A systematic review and comparative evaluation. Neural Netw. 2019, 117, 8–66. [Google Scholar] [CrossRef]
  13. Cao, M.L.; Fu, H.; Zhu, J.Y.; Cai, C.G. Lightweight tea bud recognition network integrating GhostNet and YOLOv5. Math. Biosci. Eng. 2022, 19, 12897–12914. [Google Scholar] [CrossRef]
  14. Zhao, R.M.; Liao, C.; Yu, T.J.; Chen, J.N.; Li, Y.T.; Lin, G.C.; Huan, X.L.; Wang, Z.M. IMVTS: A Detection Model for Multi-Varieties of Famous Tea Sprouts Based on Deep Learning. Horticulturae 2023, 9, 819. [Google Scholar] [CrossRef]
  15. Wang, S.Y.; Wu, D.S.; Zheng, X.Y. TBC-YOLOv7: A refined YOLOv7-based algorithm for tea bud grading detection. Front. Plant Sci. 2023, 14, 1223410. [Google Scholar] [CrossRef] [PubMed]
  16. Zhong, L.H.; Hu, L.N.; Zhou, H. Deep learning based multi-temporal crop classification. Remote Sens. Environ. 2019, 221, 430–443. [Google Scholar] [CrossRef]
  17. Shuai, L.Y.; Mu, J.; Jiang, X.Q.; Chen, P.; Zhang, B.D.; Li, H.D.; Wang, Y.C.; Li, Z.Y. An improved YOLOv5-based method for multi-species tea shoot detection and picking point location in complex backgrounds. Biosyst. Eng. 2023, 231, 117–132. [Google Scholar] [CrossRef]
  18. Li, J.; Li, J.H.; Zhao, X.; Su, X.H.; Wu, W.B. Lightweight detection networks for tea bud on complex agricultural environment via improved YOLO v4. Comput. Electron. Agric. 2023, 211, 107955. [Google Scholar] [CrossRef]
  19. Chen, C.L.; Lu, J.Z.; Zhou, M.C.; Yi, J.; Liao, M.; Gao, Z.M. A YOLOv3-based computer vision system for identification of tea buds and the picking point. Comput. Electron. Agric. 2022, 198, 107116. [Google Scholar] [CrossRef]
  20. Fu, L.H.; Yang, Z.; Wu, F.Y.; Zou, X.J.; Lin, J.Q.; Cao, Y.J.; Duan, J.L. YOLO-Banana: A Lightweight Neural Network for Rapid Detection of Banana Bunches and Stalks in the Natural Environment. Agronomy 2022, 12, 391. [Google Scholar] [CrossRef]
  21. Li, Y.T.; He, L.Y.; Jia, J.M.; Chen, J.N.; Lyu, J.; Wu, C.A.Y. High-efficiency tea shoot detection method via a compressed deep learning model. Int. J. Agric. Biol. Eng. 2022, 15, 159–166. [Google Scholar] [CrossRef]
  22. Zhang, Z.; Lu, Y.Z.; Zhao, Y.Q.; Pan, Q.M.; Jin, K.; Xu, G.; Hu, Y.G. TS-YOLO: An All-Day and Lightweight Tea Canopy Shoots Detection Model. Agronomy 2023, 13, 1411. [Google Scholar] [CrossRef]
  23. Osokin, A.; Sidorov, D. Modification of SSIM Metrics. In Proceedings of the 13th International Scientific Conference on Information Technologies and Mathematical Modelling (ITMM), Anzhero Sudzhensk, Russia, 20–22 November 2014; Volume 487, pp. 351–355. [Google Scholar]
  24. Qian, Z.X.; Wang, W.W.; Zhang, X.P. Generalized Quality Assessment of Blocking Artifacts for Compressed Images. In Proceedings of the 9th International Forum on Digital TV and Wireless Multimedia Communication, IFTC 2012, Shanghai, China, 9–10 November 2012. [Google Scholar]
  25. Kattumannil, S.K.; Sreedevi, E.P.; Balakrishnan, N. A Generalized Measure of Cumulative Residual Entropy. Entropy 2022, 24, 444. [Google Scholar] [CrossRef]
  26. Malik, S.; Soundararajan, R. A Model Learning Approach for Low Light Image Restoration. In Proceedings of the IEEE International Conference on Image Processing (ICIP), Electr Network, Abu Dhabi, United Arab Emirates, 25–28 September 2020; pp. 1033–1037. [Google Scholar]
  27. Farid, H. Blind inverse gamma correction. IEEE Trans. Image Process. 2001, 10, 1428–1433. [Google Scholar] [CrossRef] [PubMed]
  28. Zheng, Z.H.; Wang, P.; Ren, D.W.; Liu, W.; Ye, R.G.; Hu, Q.H.; Zuo, W.M. Enhancing Geometric Factors in Model Learning and Inference for Object Detection and Instance Segmentation. IEEE Trans. Cybern. 2022, 52, 8574–8586. [Google Scholar] [CrossRef] [PubMed]
  29. Yan, B.; Fan, P.; Lei, X.Y.; Liu, Z.J.; Yang, F.Z. A Real-Time Apple Targets Detection Method for Picking Robot Based on Improved YOLOv5. Remote Sens. 2021, 13, 1619. [Google Scholar] [CrossRef]
  30. Qi, J.T.; Liu, X.N.; Liu, K.; Xu, F.R.; Guo, H.; Tian, X.L.; Li, M.; Bao, Z.Y.; Li, Y. An improved YOLOv5 model based on visual attention mechanism: Application to recognition of tomato virus disease. Comput. Electron. Agric. 2022, 194, 106780. [Google Scholar] [CrossRef]
Figure 1. Tea buds detection process. According to experiments and a large literature review, RGB camera and ZED camera have the same effect on color image imaging, because the experimental effect display of two cameras at the same time will cause redundancy in the article, so the experimental idea of this paper is described by using the ZED camera as an example.
Agronomy 14 01800 g001
Figure 2. Schematic diagram of the polariser principle.
Agronomy 14 01800 g002
Figure 3. Network structure improvement diagram: (a) Schematic diagram of YOLO+LFA+mpdiou network structure; (b) LFA network structure diagram.
Agronomy 14 01800 g003
Figure 4. mpdiou parameter schematics.
Agronomy 14 01800 g004
Figure 5. mpdiou effect demonstration diagram.
Agronomy 14 01800 g005
Figure 6. Graph of experimental data with image processing.
Agronomy 14 01800 g006
Figure 7. Effects of different image processing methods: (a) None; (b) Gamma; (c) RGB value; (d) Contrast; (e) 0°; (f) 15°; (g) 30°; (h) 45°; (i) 75°.
Agronomy 14 01800 g007aAgronomy 14 01800 g007b
Figure 8. mAP curves for different models.
Agronomy 14 01800 g008
Figure 9. YOLOv5s detection effect diagram.
Agronomy 14 01800 g009
Figure 10. YOLOv5s+CBAM detection results.
Agronomy 14 01800 g010
Figure 11. YOLOv5s+ECA detection effect diagram.
Agronomy 14 01800 g011
Figure 12. YOLOv5s+siou detection effect diagram.
Agronomy 14 01800 g012
Figure 13. YOLOv5s+LFA+mpdiou detection effect diagram.
Agronomy 14 01800 g013
Figure 14. Detection effect of each model under intense light: (a) YOLOv5s; (b) YOLOv5s+ECA; (c) YOLOv5s+CBAM; (d) YOLOv5s+siou; (e)YOLOv5s+LFA+mpdiou.
Agronomy 14 01800 g014
Figure 15. Comparison of the effect of different improvement methods.
Agronomy 14 01800 g015
Table 1. Datasets.
Table 1. Datasets.
Quantity (Sheets)Ambient Light Intensity
Training set1450 1 × 10 3   L u x ~ 3 × 10 4   L u x
Validation set400 1 × 10 3   L u x ~ 3 × 10 4   L u x
Test set50 5 × 10 4   L u x ~ 7 × 10 4   L u x
50 1 × 10 3   L u x ~ 3 × 10 4   L u x
50 0.1   L u x ~ 10   L u x
Note: Noon light intensity on sunny days in summer ranges from 6 × 10 4 to 1 × 10 5   L u x , and on sunny days in spring and autumn, it ranges from 3 × 10 4 to 7 × 10 4   L u x .
Table 2. Comparison of different loss functions.
Loss FunctionValue
L C i o u (a) 0.75
(b) 0.75
L m p d i o u (a) 0.79
(b) 0.76
Table 3. Comparison of values of indicators in different models.
ModelPrecisionRecallmAP50mAP50_95Params/MGFlops/G
YOLOv5s87.3%64.1%79.1%51.4%7.01282215.8
YOLOv5s+CBAM72.5%72.0%74.7%45.5%6.70526815.2
YOLOv5s+ECA84.1%68.0%79.3%48.5%7.18588115.6
YOLOv5s+siou81.6%72.9%80.3%51.7%7.01282215.0
YOLOv5s+LFA84.7%70.3%81.5%51.2%8.29634217.9
YOLOv5s+LFA+mpdiou84.5%75.5%83.6%54.8%8.39786317.9
Table 4. Leakage and misdetection rates for each model with different thresholds.
ThresholdModelsMiss RateFalse Rate
iou = 0.5YOLOv5s8.2%24.7%
YOLOv5s+CBAM10.4%26.9%
YOLOv5s+ECA5.2%20.1%
YOLOv5s+siou7.4%21.8%
YOLOv5s+LFA+mpdiou2.5%14.4%
iou = 0.6YOLOv5s10.3%20.1%
YOLOv5s+CBAM13.9%21.3%
YOLOv5s+ECA9.0%17.2%
YOLOv5s+siou11.6%19.8%
YOLOv5s+LFA+mpdiou5.1%15.9%
iou = 0.7YOLOv5s13.1%13.1%
YOLOv5s+CBAM15.9%15.5%
YOLOv5s+ECA11.5%11.4%
YOLOv5s+siou14.4%14.0%
YOLOv5s+LFA+mpdiou7.0%4.6%
iou = 0.8YOLOv5s16.5%9.7%
YOLOv5s+CBAM19.3%10.5%
YOLOv5s+ECA14.5%8.1%
YOLOv5s+siou16.1%8.5%
YOLOv5s+LFA+mpdiou11.2%4.1%
Table 5. Miss rate and false rate of different models under normal light intensity.
Experimental EnvironmentProcessing MethodMiss RateFalse Rate
Without intense lightYOLOv5s14.56%8.2%
YOLOv5s+PF13.98%8.2%
YOLOv5s+LFA+mpdiou9.96%3.9%
YOLOv5s+PF+LFA+mpdiou10.01%3.9%
YOLOv5s+CBAM15.33%8.5%
YOLOv5s+ECA13.21%8.2%
YOLOv5s+siou14.22%8.3%
Low lightYOLOv5s29.76%19.88%
YOLOv5s+PF32.44%21.65%
YOLOv5s+LFA+mpdiou25.72%15.73%
YOLOv5s+PF+LFA+mpdiou30.01%18.43%
YOLOv5s+CBAM30.51%20.11%
YOLOv5s+ECA28.61%18.93%
YOLOv5s+siou28.81%19.41%
Disclaimer/Publisher’s Note: The statements, opinions and data contained in all publications are solely those of the individual author(s) and contributor(s) and not of MDPI and/or the editor(s). MDPI and/or the editor(s) disclaim responsibility for any injury to people or property resulting from any ideas, methods, instructions or products referred to in the content.

