
Converse Responses of Biochar Application on N2O Emissions in Soils at Different pH Values in a Subtropical Citrus Orchard


Abstract

1. Introduction
2. Materials and Methods
2.1. Soil and Biochar Characteristics
2.2. pH Regulation
2.3. Experimental Design
2.4. Chemical Analysis
2.5. PCR Analysis
2.6. Data and Statistical Analysis
3. Results
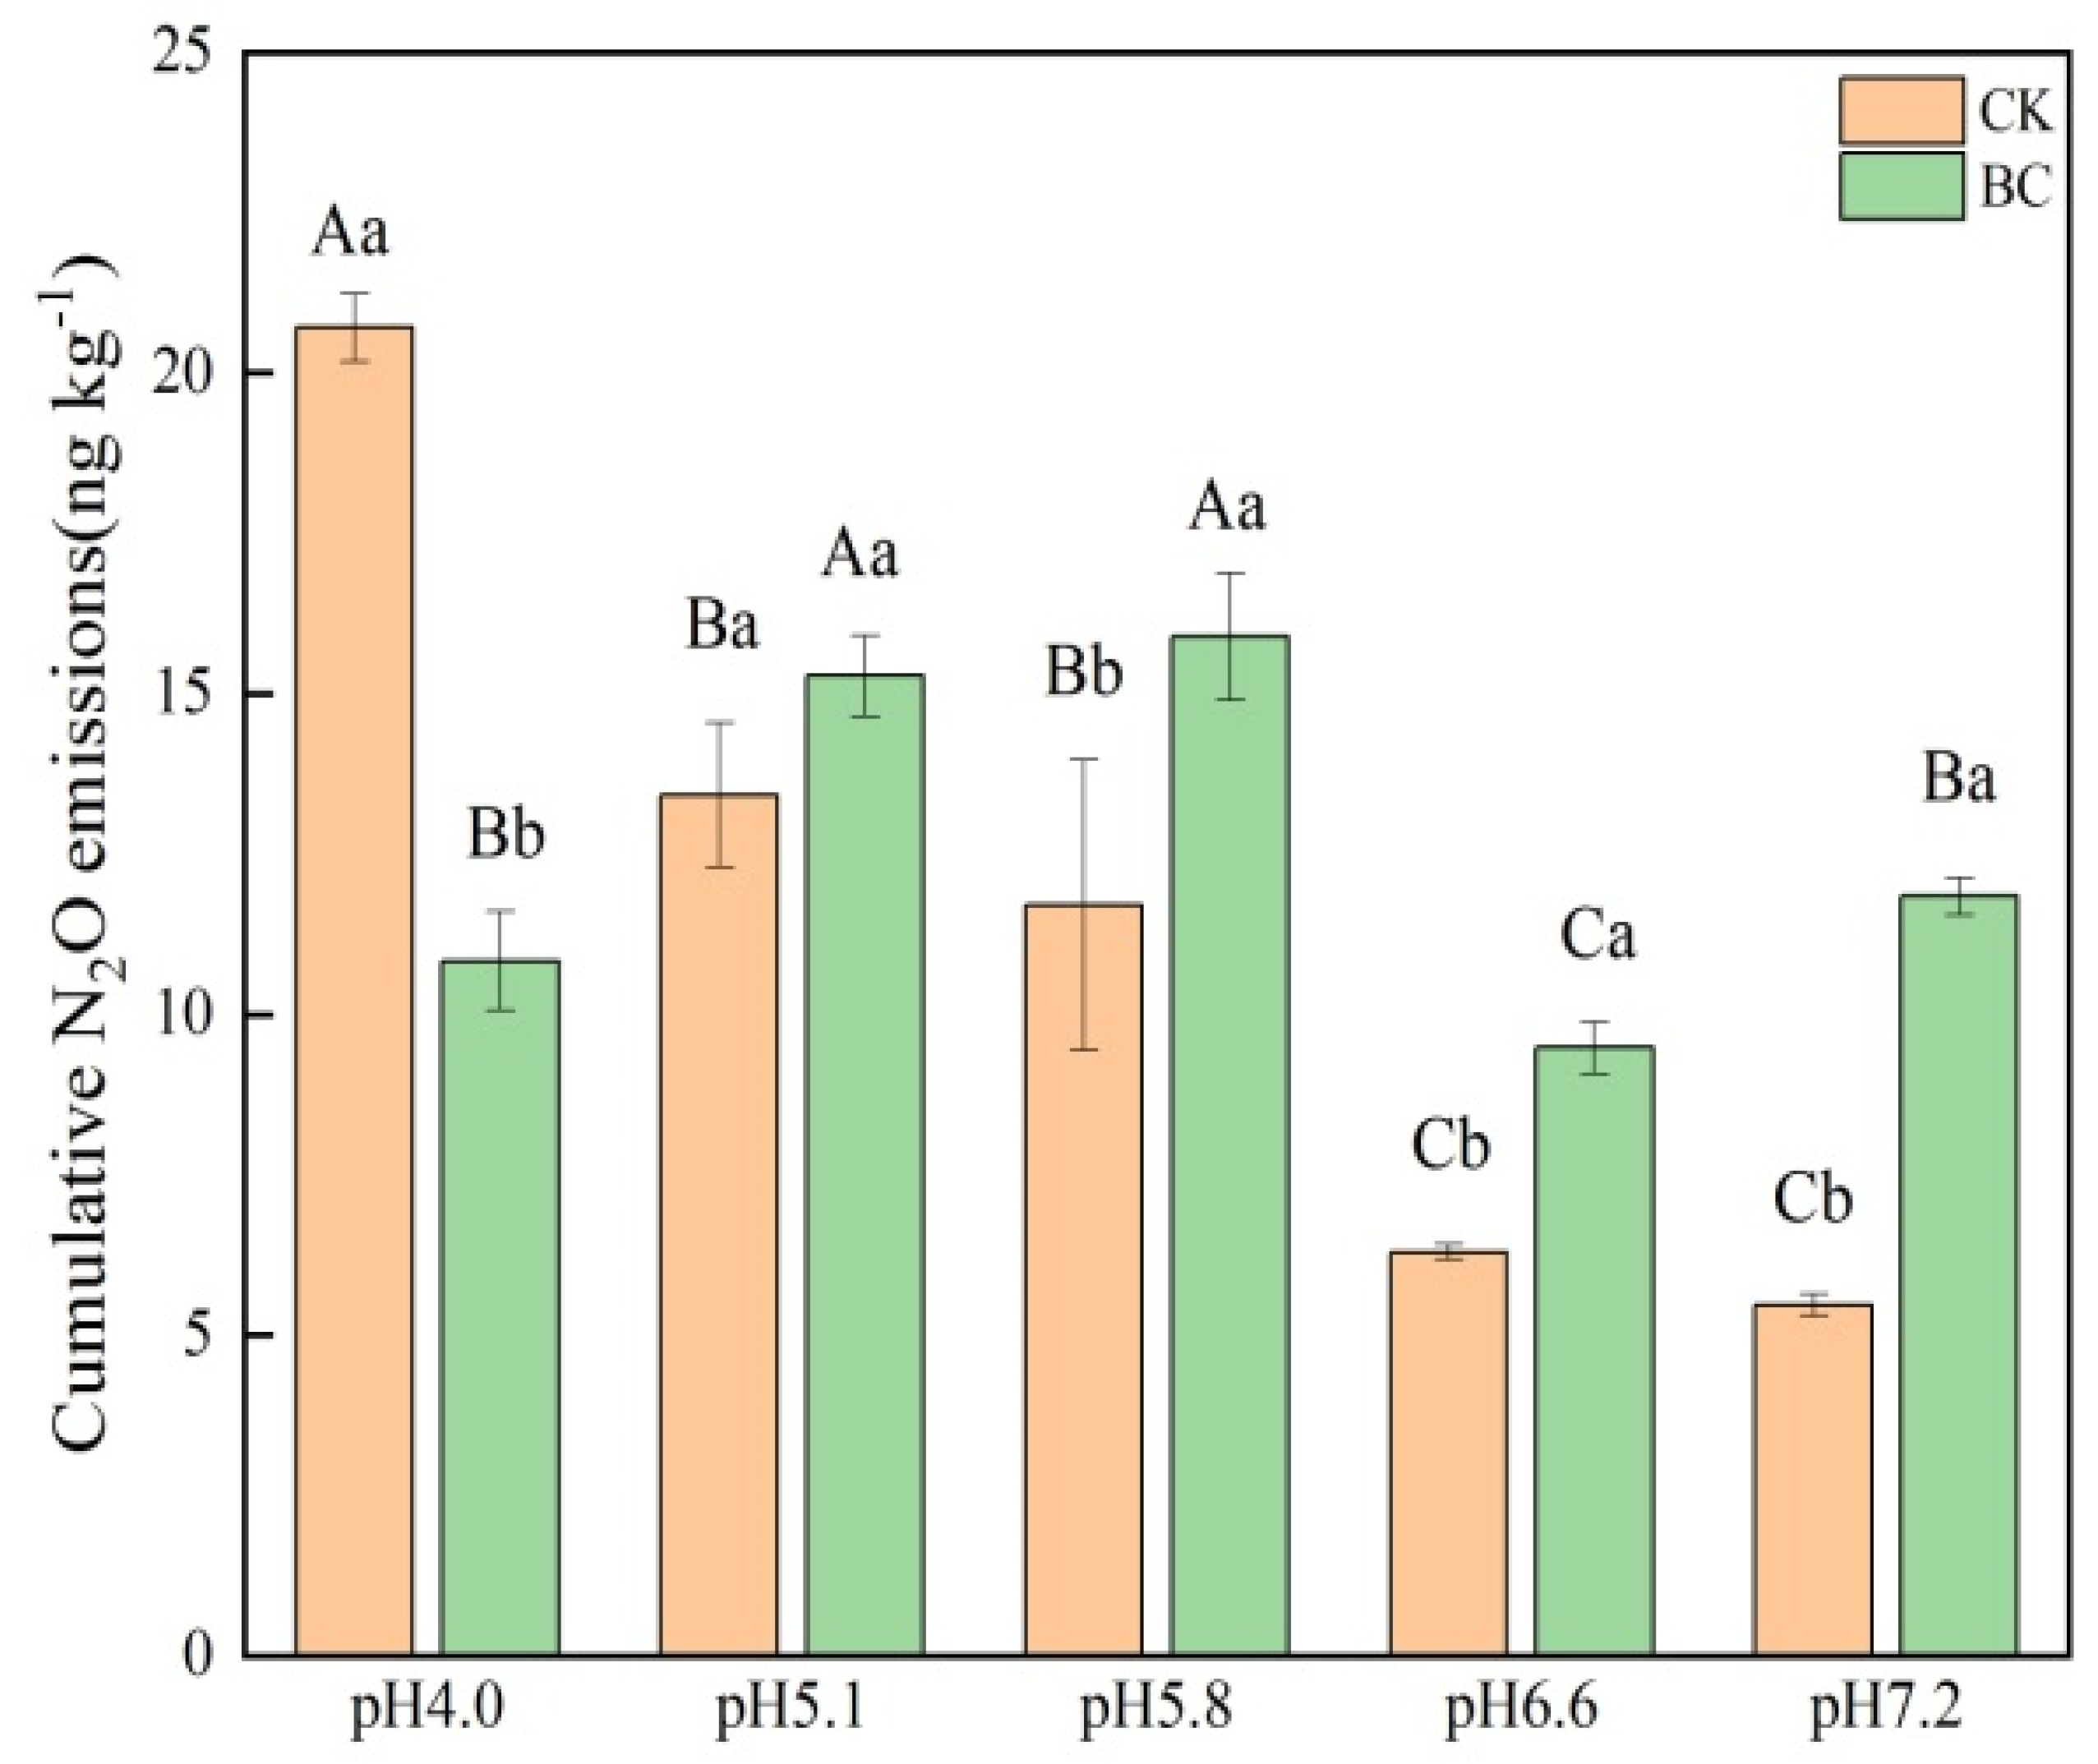
3.1. N2O Emissions
3.2. Soil Chemical Properties
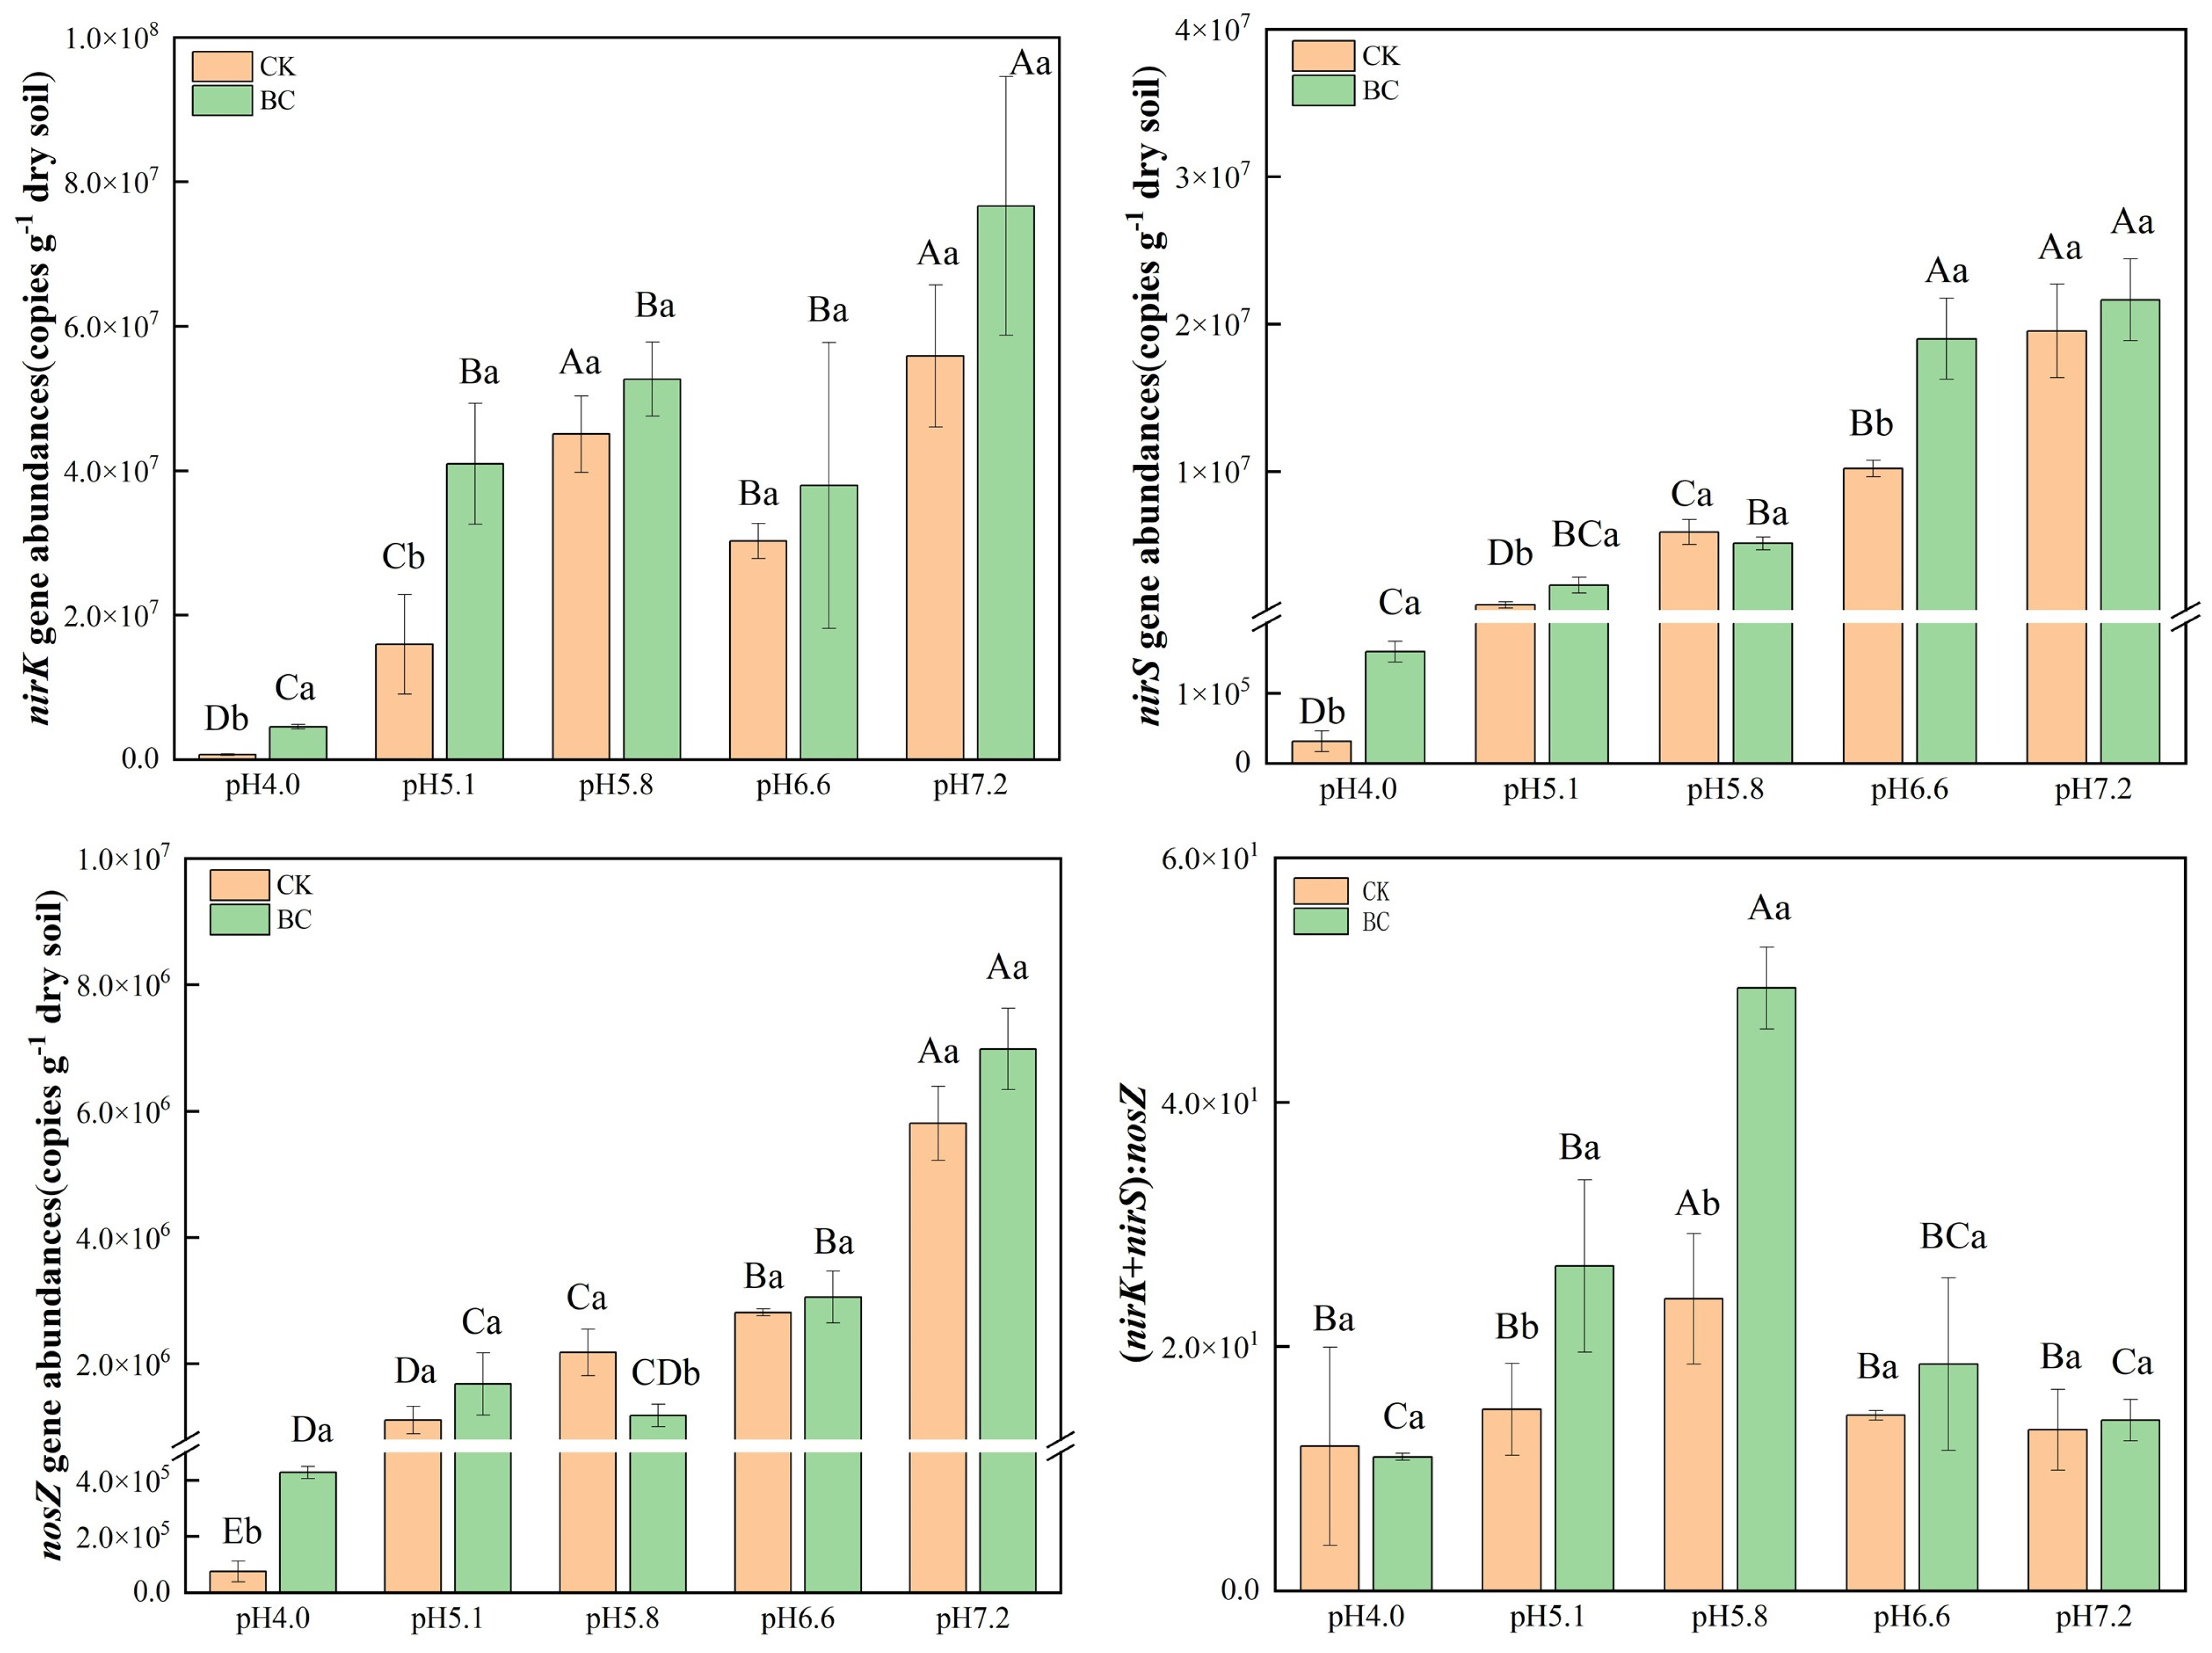
3.3. Abundance Levels of Different N Functional Genes
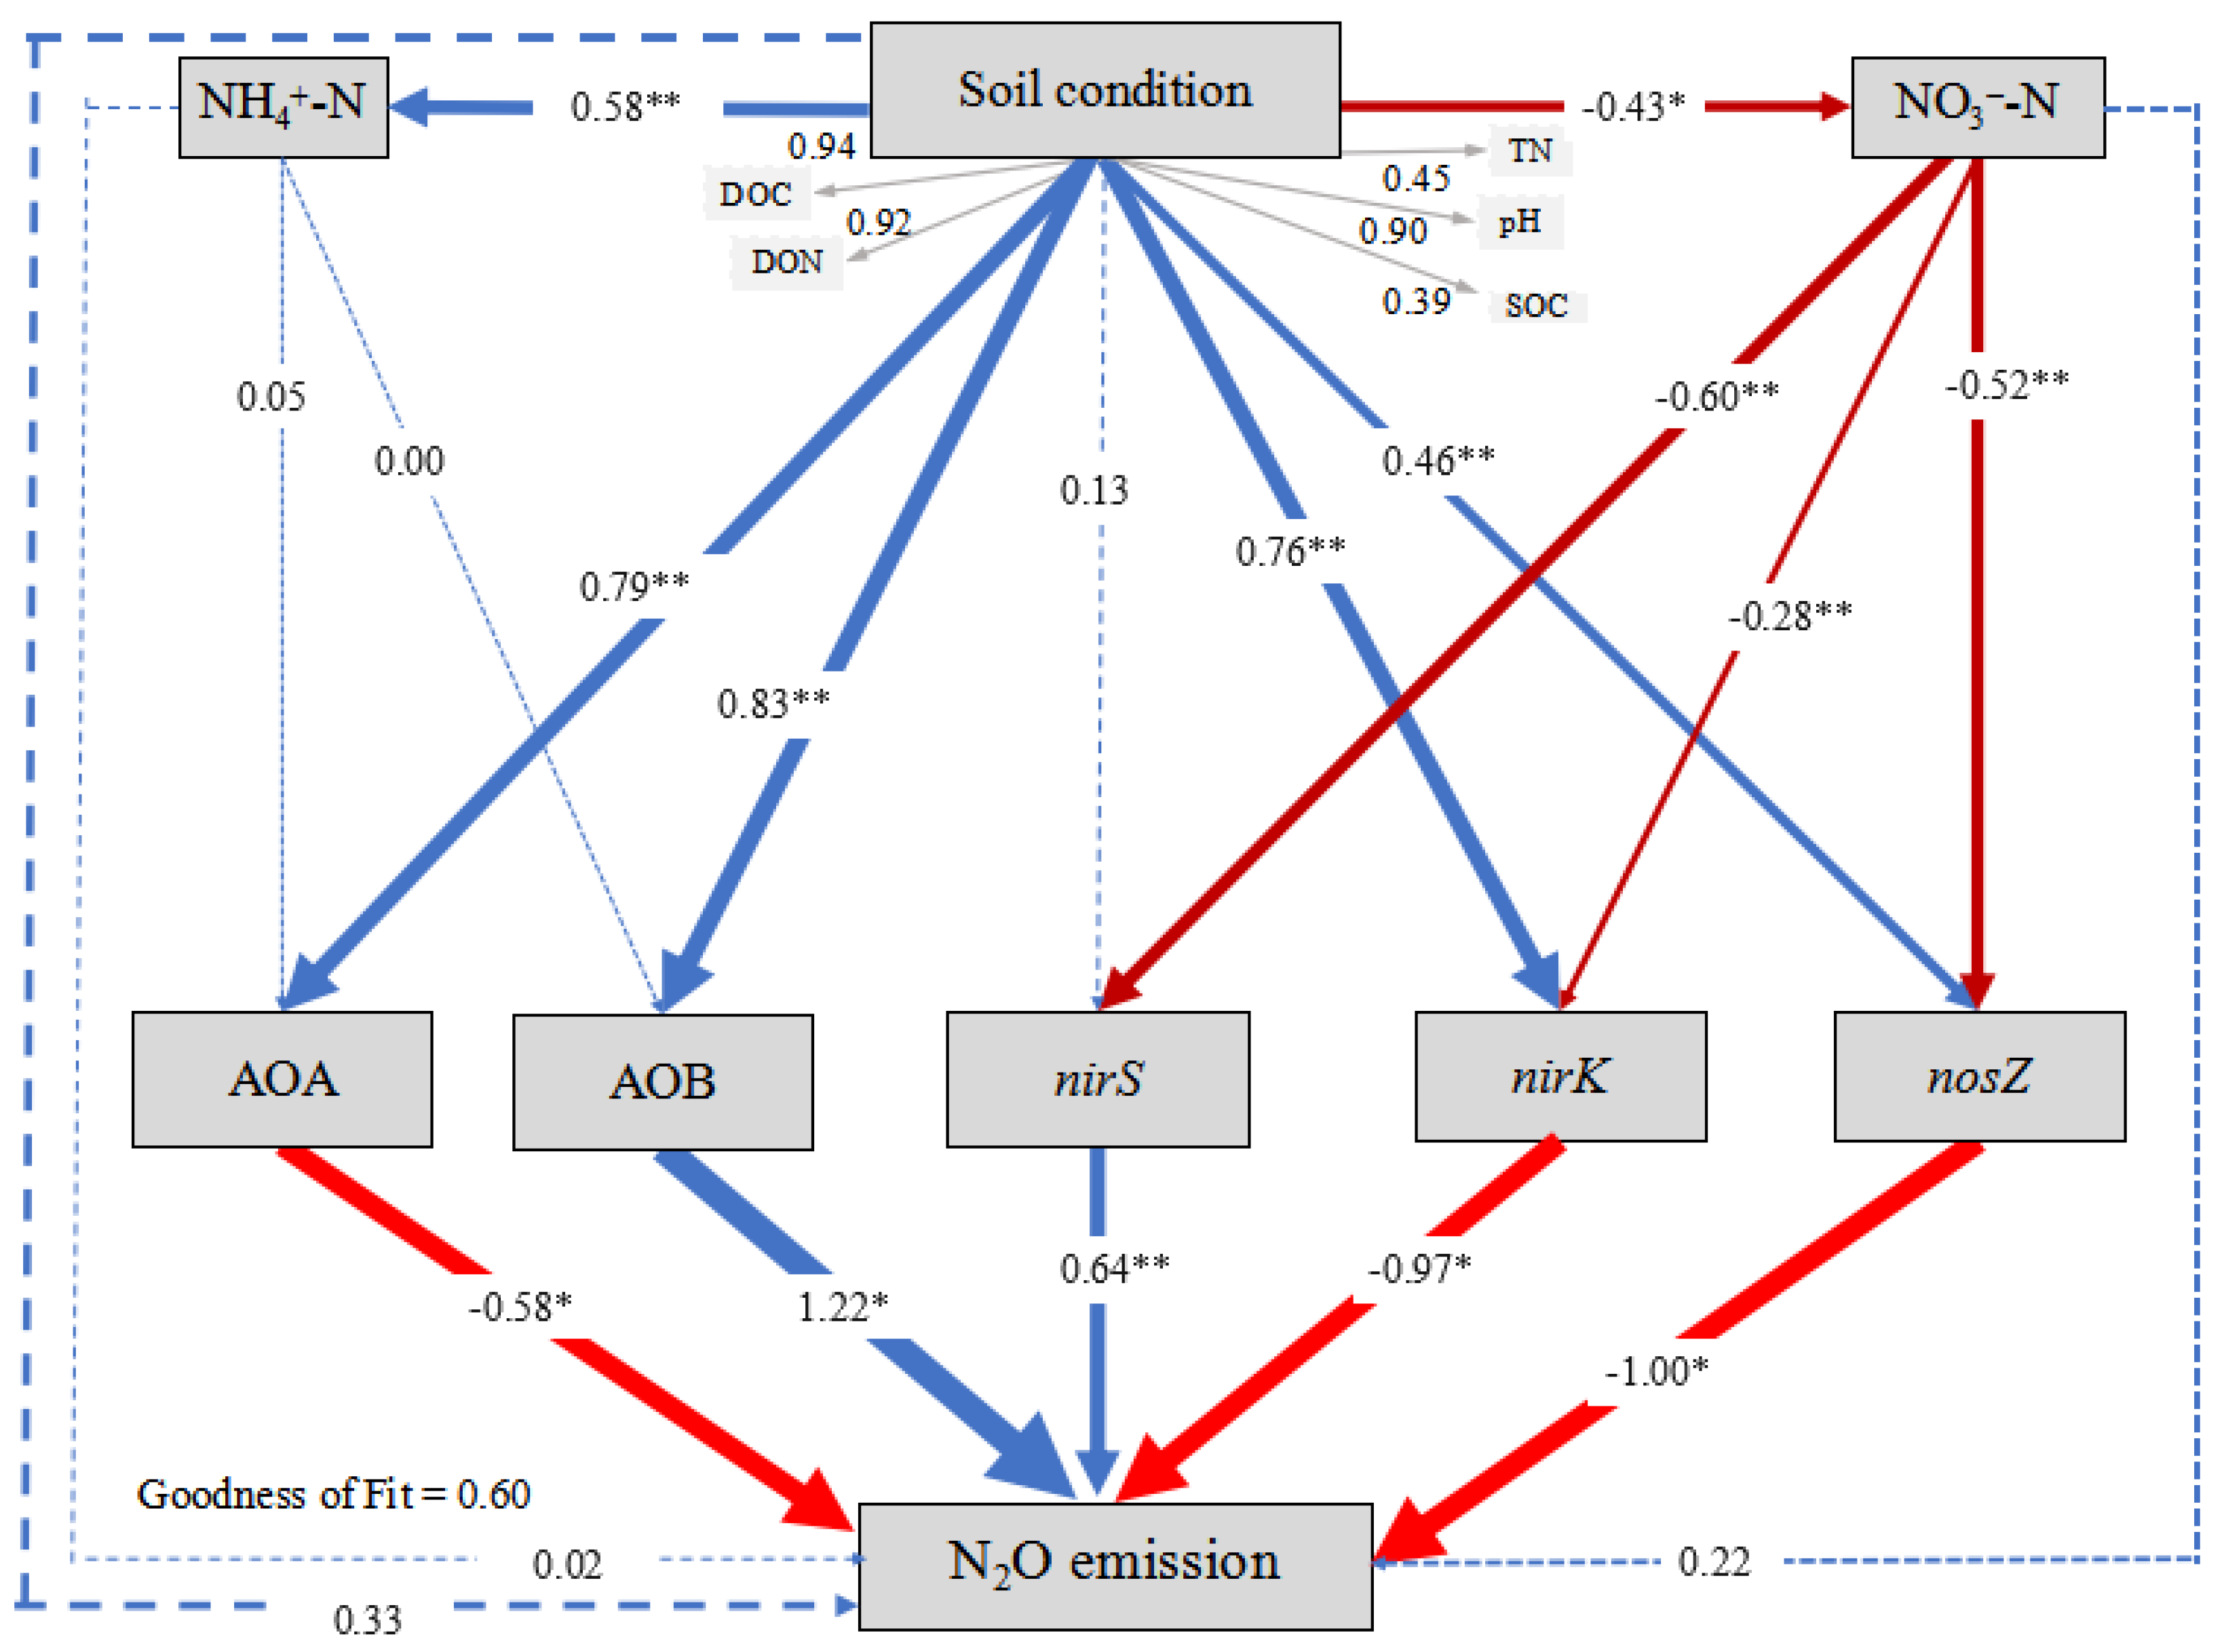
3.4. PLS-PM Analysis
4. Discussion
5. Conclusions
Supplementary Materials
Author Contributions
Funding
Data Availability Statement
Conflicts of Interest
References
- Zou, Y.; Ning, D.; Huang, Y.; Liang, Y.; Wang, H.; Duan, L.; Yuan, T.; He, Z.; Yang, Y.; Xue, K.; et al. Functional structures of soil microbial community relate to contrasting N2O emission patterns from a highly acidified forest. Sci. Total Environ. 2020, 725, 138504. [Google Scholar] [CrossRef] [PubMed]
- Zheng, Q.; Ding, J.; Lin, W.; Yao, Z.; Li, Q.; Xu, C.; Zhuang, S.; Kou, X.; Li, Y. The influence of soil acidification on N2O emissions derived from fungal and bacterial denitrification using dual isotopocule mapping and acetylene inhibition. Environ. Pollut. 2022, 303, 119076. [Google Scholar] [CrossRef]
- Kaushal, R.; Hsueh, Y.-H.; Chen, C.-L.; Lan, Y.-P.; Wu, P.-Y.; Chen, Y.-C.; Liang, M.-C. Isotopic assessment of soil N2O emission from a sub-tropical agricultural soil under varying N-inputs. Sci. Total Environ. 2022, 827, 154311. [Google Scholar] [CrossRef] [PubMed]
- Tian, H.; Xu, R.; Canadell, J.G.; Thompson, R.L.; Winiwarter, W.; Suntharalingam, P.; Davidson, E.A.; Ciais, P.; Jackson, R.B.; Janssens-Maenhout, G.; et al. A comprehensive quantification of global nitrous oxide sources and sinks. Nature 2020, 586, 248–256. [Google Scholar] [CrossRef]
- Shcherbak, I.; Millar, N.; Robertson, G.P. Global metaanalysis of the nonlinear response of soil nitrous oxide (N2O) emissions to fertilizer nitrogen. Proc. Natl. Acad. Sci. USA 2014, 111, 9199–9204. [Google Scholar] [CrossRef]
- Wu, Y.; Li, Y.; Wang, H.; Wang, Z.; Fu, X.; Shen, J.; Wang, Y.; Liu, X.; Meng, L.; Wu, J. Response of N2O emissions to biochar amendment on a tea field soil in subtropical central China: A three-year field experiment. Agric. Ecosyst. Environ. 2021, 318, 107473. [Google Scholar] [CrossRef]
- Baggs, E.M.; Smales, C.L.; Bateman, E.J. Changing pH shifts the microbial sourceas well as the magnitude of N2O emission from soil. Biol. Fertil. Soils 2010, 46, 793–805. [Google Scholar] [CrossRef]
- Cheng, Y.; Zhang, J.B.; Wang, J.; Cai, Z.C.; Wang, S.Q. Soil pH is a good predictor of the dominating N2O production processes under aerobic conditions. J. Plant Nutr. Soil Sci. 2015, 178, 370–373. [Google Scholar] [CrossRef]
- Cheng, Y.; Cai, Z.; Chang, S.X.; Wang, J.; Zhang, J. Effects of soil pH and salt on N2O production in adjacent forest and grassland soils in central Alberta, Canada. J. Soils Sediments 2013, 13, 863–868. [Google Scholar] [CrossRef]
- Aamer, M.; Shaaban, M.; Hassan, M.U.; Ying, L.; Haiying, T.; Qiaoying, M.; Munir, H.; Rasheed, A.; Xinmei, L.; Ping, L.; et al. N2O Emissions Mitigation in Acidic Soil Following Biochar Application Under Different Moisture Regimes. J. Soil Sci. Plant Nutr. 2020, 20, 2454–2464. [Google Scholar] [CrossRef]
- Shaaban, M.; Peng, Q.-A.; Bashir, S.; Wu, Y.; Younas, A.; Xu, X.; Rashti, M.R.; Abid, M.; Zafar-ul-Hye, M.; Núñez-Delgado, A.; et al. Restoring effect of soil acidity and Cu on N2O emissions from an acidic soil. J. Environ. Manag. 2019, 250, 109535. [Google Scholar] [CrossRef]
- Zheng, X.; Guo, B.; Liu, H.; Wu, Y.; Yu, J.; Ding, H.; Jiang, X.; Luo, Q.; Zhang, Y. Low pH inhibits soil nosZ without affecting N2O uptake. J. Soils Sediments 2022, 23, 422–430. [Google Scholar] [CrossRef]
- Zhang, Y.; Zhao, J.; Huang, X.; Cheng, Y.; Cai, Z.; Zhang, J.; Müller, C. Microbial pathways account for the pH effect on soil N2O production. Eur. J. Soil Biol. 2021, 106, 103337. [Google Scholar] [CrossRef]
- Qu, Z.; Wang, J.; Almøy, T.; Bakken, L.R. Excessive use of nitrogen in Chinese agriculture results in high N2O/(N2O+N2) product ratio of denitrification, primarily due to acidification of the soils. Glob. Chang. Biol. 2014, 20, 1685–1698. [Google Scholar] [CrossRef] [PubMed]
- Enaime, G.; Bacaoui, A.; Yaacoubi, A.; Lübken, M. Biochar for Wastewater Treatment—Conversion Technologies and Applications. Appl. Sci. 2020, 10, 3492. [Google Scholar] [CrossRef]
- He, X.; Lu, H.-l.; Wu, C.-m.; Xu, R.-k. Effects of inorganic alkalis and organic anions in biochars on acidic paddy soil resistance to acidification. J. Soils Sediments 2022, 22, 1201–1213. [Google Scholar] [CrossRef]
- Zhang, Y.; Cheng, X.; Wang, Z.; Tahir, M.H.; Wang, M. Co-pyrolysis of peanut shell with phosphate fertilizer to improve carbon sequestration and emission reduction potential of biochar. Fuel Process. Technol. 2022, 236, 107435. [Google Scholar] [CrossRef]
- Borchard, N.; Schirrmann, M.; Cayuela, M.L.; Kammann, C.; Wrage-Mönnig, N.; Estavillo, J.M.; Fuertes-Mendizábal, T.; Sigua, G.; Spokas, K.; Ippolito, J.A.; et al. Biochar, soil and land-use interactions that reduce nitrate leaching and N2O emissions: A meta-analysis. Sci. Total Environ. 2019, 651, 2354–2364. [Google Scholar] [CrossRef] [PubMed]
- Ji, C.; Li, S.; Geng, Y.; Miao, Y.; Ding, Y.; Liu, S.; Zou, J. Differential responses of soil N2O to biochar depend on the predominant microbial pathway. Appl. Soil Ecol. 2020, 145, 103348. [Google Scholar] [CrossRef]
- Li, Q.; Cui, K.; Lv, J.; Zhang, J.; Peng, C.; Li, Y.; Gu, Z.; Song, X. Biochar amendments increase soil organic carbon storage and decrease global warming potentials of soil CH4 and N2O under N addition in a subtropical Moso bamboo plantation. For. Ecosyst. 2022, 9, 100054. [Google Scholar] [CrossRef]
- Song, Y.; Li, Y.; Cai, Y.; Fu, S.; Luo, Y.; Wang, H.; Liang, C.; Lin, Z.; Hu, S.; Li, Y.; et al. Biochar decreases soil N2O emissions in Moso bamboo plantations through decreasing labile N concentrations, N-cycling enzyme activities and nitrification/denitrification rates. Geoderma 2019, 348, 135–145. [Google Scholar] [CrossRef]
- Zhong, L.; Li, G.; Qing, J.; Li, J.; Xue, J.; Yan, B.; Chen, G.; Kang, X.; Rui, Y. Biochar can reduce N2O production potential from rhizosphere of fertilized agricultural soils by suppressing bacterial denitrification. Eur. J. Soil Biol. 2022, 109, 103391. [Google Scholar] [CrossRef]
- Clough, T.J.; Bertram, J.E.; Ray, J.L.; Condron, L.M.; O’Callaghan, M.; Sherlock, R.R.; Wells, N.S. Unweathered Wood Biochar Impact on Nitrous Oxide Emissions from a Bovine-Urine-Amended Pasture Soil. Soil Sci. Soc. Am. J. 2010, 74, 852–860. [Google Scholar] [CrossRef]
- Verhoeven, E.; Six, J. Biochar does not mitigate field-scale N2O emissions in a Northern California vineyard: An assessment across two years. Agric. Ecosyst. Environ. 2014, 191, 27–38. [Google Scholar] [CrossRef]
- Chen, X.; Yu, W.; Cai, Y.; Zhang, S.; Muneer, M.A.; Zhu, Q.; Xu, D.; Ma, C.; Yan, X.; Li, Y.; et al. How to identify and adopt cleaner strategies to improve the continuous acidification in orchard soils? J. Clean. Prod. 2022, 330, 129826. [Google Scholar] [CrossRef]
- Zhang, S.; Yang, W.; Muneer, M.A.; Ji, Z.; Tong, L.; Zhang, X.; Li, X.; Wang, W.; Zhang, F.; Wu, L. Integrated use of lime with Mg fertilizer significantly improves the pomelo yield, quality, economic returns and soil physicochemical properties under acidic soil of southern China. Sci. Hortic. 2021, 290, 110502. [Google Scholar] [CrossRef]
- Zhang, Y.; Dai, S.; Huang, X.; Zhao, Y.; Zhao, J.; Cheng, Y.; Cai, Z.; Zhang, J. pH-induced changes in fungal abundance and composition affects soil heterotrophic nitrification after 30 days of artificial pH manipulation. Geoderma 2020, 366, 114255. [Google Scholar] [CrossRef]
- Hu, J.; Zhao, Y.; Yao, X.; Wang, J.; Zheng, P.; Xi, C.; Hu, B. Dominance of comammox Nitrospira in soil nitrification. Sci. Total Environ. 2021, 780, 146558. [Google Scholar] [CrossRef]
- Liu, S.; Wang, C.; Hou, J.; Wang, P.; Miao, L.; Fan, X.; You, G.; Xu, Y. Effects of Ag and Ag2S nanoparticles on denitrification in sediments. Water Res. 2018, 137, 28–36. [Google Scholar] [CrossRef]
- Xu, H.J.; Wang, X.H.; Li, H.; Yao, H.Y.; Su, J.Q.; Zhu, Y.G. Biochar impacts soil microbial community composition and nitrogen cycling in an acidic soil planted with rape. Environ. Sci. Technol. 2014, 48, 9391–9399. [Google Scholar] [CrossRef]
- Chèneby, D.; Hartmann, A.; Hénault, C.; Topp, E.; Germon, J.C. Diversity of denitrifying microflora and ability to reduce N2O in two soils. Biol. Fertil. Soils 1998, 28, 19–26. [Google Scholar] [CrossRef]
- Zhao, L.; Li, Q.; Qian, X.; Chen, H.; Wang, F.; Yi, Z. Effects of the combined application of biochar-based fertilizer and urea on N2O emissions, nitrifier, and denitrifier communities in the acidic soil of pomelo orchards. J. Soils Sediments 2022, 22, 3119–3136. [Google Scholar] [CrossRef]
- Cui, P.; Fan, F.; Yin, C.; Song, A.; Huang, P.; Tang, Y.; Zhu, P.; Peng, C.; Li, T.; Wakelin, S.A.; et al. Long-term organic and inorganic fertilization alters temperature sensitivity of potential N2O emissions and associated microbes. Soil Biol. Biochem. 2016, 93, 131–141. [Google Scholar] [CrossRef]
- Fan, X.; Yin, C.; Chen, H.; Ye, M.; Zhao, Y.; Li, T.; Wakelin, S.A.; Liang, Y. The efficacy of 3,4-dimethylpyrazole phosphate on N2O emissions is linked to niche differentiation of ammonia oxidizing archaea and bacteria across four arable soils. Soil Biol. Biochem. 2019, 130, 82–93. [Google Scholar] [CrossRef]
- Nguyen, D.H.; Scheer, C.; Rowlings, D.W.; Grace, P.R. Rice husk biochar and crop residue amendment in subtropical cropping soils: Effect on biomass production, nitrogen use efficiency and greenhouse gas emissions. Biol. Fertil. Soils 2016, 52, 261–270. [Google Scholar] [CrossRef]
- Zheng, N.; Yu, Y.; Shi, W.; Yao, H. Biochar suppresses N2O emissions and alters microbial communities in an acidic tea soil. Environ. Sci. Pollut. Res. 2019, 26, 35978–35987. [Google Scholar] [CrossRef] [PubMed]
- Yang, X.; Meng, J.; Lan, Y.; Chen, W.; Yang, T.; Yuan, J.; Liu, S.; Han, J. Effects of maize stover and its biochar on soil CO2 emissions and labile organic carbon fractions in Northeast China. Agric. Ecosyst. Environ. 2017, 240, 24–31. [Google Scholar] [CrossRef]
- Saari, P.; Saarnio, S.; Kukkonen, J.V.K.; Akkanen, J.; Heinonen, J.; Saari, V.; Alm, J. DOC and N2O dynamics in upland and peatland forest soils after clear-cutting and soil preparation. Biogeochemistry 2009, 94, 217–231. [Google Scholar] [CrossRef]
- Luo, Y.; Durenkamp, M.; De Nobili, M.; Lin, Q.; Brookes, P.C. Short term soil priming effects and the mineralisation of biochar following its incorporation to soils of different pH. Soil Biol. Biochem. 2011, 43, 2304–2314. [Google Scholar] [CrossRef]
- Qian, X.; Li, Q.; Chen, H.; Zhao, L.; Wang, F.; Zhang, Y.; Zhang, J.; Müller, C.; Yi, Z. Enhancing Soil Nitrogen Retention Capacity by Biochar Incorporation in the Acidic Soil of Pomelo Orchards: The Crucial Role of pH. Agronomy 2023, 13, 2110. [Google Scholar] [CrossRef]
- Bergaust, L.; Mao, Y.; Bakken, L.R.; Frostegard, A. Denitrification Response Patterns during the Transition to Anoxic Respiration and Posttranscriptional Effects of Suboptimal pH on Nitrous Oxide Reductase in Paracoccus denitrificans. Appl. Environ. Microbiol. 2010, 76, 8285. [Google Scholar] [CrossRef]
- Wang, Y.; Liu, Y.; Zhan, W.; Zheng, K.; Wang, J.; Zhang, C.; Chen, R. Stabilization of heavy metal-contaminated soils by biochar: Challenges and recommendations. Sci. Total Environ. 2020, 729, 139060. [Google Scholar] [CrossRef] [PubMed]
- Sun, R.; Myrold, D.D.; Wang, D.; Guo, X.; Chu, H. AOA and AOB communities respond differently to changes of soil pH under long-term fertilization. Soil Ecol. Lett. 2019, 1, 126–135. [Google Scholar] [CrossRef]
- Zhu, X.; Burger, M.; Doane, T.A.; Horwath, W.R. Ammonia oxidation pathways and nitrifier denitrification are significant sources of N2O and NO under low oxygen availability. Proc. Natl. Acad. Sci. USA 2013, 110, 6328–6333. [Google Scholar] [CrossRef] [PubMed]
- Li, C.; Wei, Z.; Yang, P.; Shan, J.; Yan, X. Conversion from rice fields to vegetable fields alters product stoichiometry of denitrification and increases N2O emission. Environ. Res. 2022, 215, 114279. [Google Scholar] [CrossRef]
- Braker, G.; Fesefeldt, A.; Witzel, K.P. Development of PCR primer systems for amplification of nitrite reductase genes (nirK and nirS) to detect denitrifying bacteria in environmental samples. Appl. Environ. Microbiol. 1998, 64, 3769–3775. [Google Scholar] [CrossRef] [PubMed]


| Target Gene | Primer | Sequence (5′-3′) | Annealing Temperature | References |
|---|---|---|---|---|
| (°C) | ||||
| AOA-amoA | CamoA-19f | ATGGTCTGGYTWAGACG | 50 | [28] |
| CamoA-616r | GCCATCCABCKRTANGTCCA | |||
| AOB-amoA | amoA-1F | GGGGTTTCTACTGGTGGT | 55 | [28] |
| amoA-2R | CCCCTCKGSAAAGCCTTCTTC | |||
| nirK | 876C | ATYGGCGGVCAYGGCGA | 65 | [29] |
| 1040 | GCCTCGATCAGRTTRTGGTT | |||
| nirS | cd3Af | GTSAACGTSAAGGARACSGG | 65 | [30] |
| R3cd | GASTTCGGRTGSGTCTTGA | |||
| nosZ | nosLb | CCCGCTGCACACCRCCTTCGA | 60 | [31] |
| nosRb | CGTCGCCSGAGATGTCGATCA |
| Number | Factor1 | Factor2 | pH | NH4+-N | NO3−-N | TN | SOC | C/N | DOC | DON |
|---|---|---|---|---|---|---|---|---|---|---|
| mg kg−1 | mg kg−1 | g kg−1 | g kg−1 | mg kg−1 | mg kg−1 | |||||
| 1 | CK | pH 4.0 | 3.96 i | 16.48 a | 59.96 cd | 1.44 e | 14.83 g | 10.33 bc | 66.60 c | 5.13 d |
| 2 | pH 5.1 | 5.06 g | 4.35 b | 68.05 ab | 1.67 c | 16.83 de | 10.06 cd | 50.82 ef | 18.19 c | |
| 3 | pH 5.8 | 5.63 f | 4.10 b | 63.95 bc | 1.58 cd | 15.83 f | 10.03 cd | 50.23 ef | 21.90 bc | |
| 4 | pH 6.6 | 6.47 d | 4.60 b | 66.25 b | 1.78 b | 17.79 bc | 9.95 cd | 63.84 cd | 40.11 a | |
| 5 | pH 7.2 | 7.03 b | 4.50 b | 55.3 d | 1.65 c | 16.02 f | 9.79 d | 77.74 b | 44.77 a | |
| 6 | BC | pH 4.0 | 4.72 h | 4.22 b | 72.57 a | 1.51 de | 16.33 ef | 10.77 ab | 48.79 f | 7.29 d |
| 7 | pH 5.1 | 5.65 f | 4.45 b | 63.05 bc | 1.66 c | 18.07 b | 10.88 a | 57.05 de | 23.55 bc | |
| 8 | pH 5.8 | 6.21 e | 4.15 b | 63.15 bc | 1.59 cd | 17.25 cd | 10.83 ab | 68.10 c | 28.14 b | |
| 9 | pH 6.6 | 6.90 c | 4.80 b | 64.55 bc | 1.87 a | 20.03 a | 10.66 ab | 90.01 a | 46.21 a | |
| 10 | pH 7.2 | 7.53 a | 4.80 b | 55.65 d | 1.59 cd | 16.77 de | 10.43 abc | 84.45 ab | 47.40 a |
| Factors | pH | NH4+-N | NO3−-N | TN | SOC | C/N | DOC | DON |
|---|---|---|---|---|---|---|---|---|
| Soil pH | 3134.42 *** | 285.62 *** | 12.35 *** | 42.22 *** | 68.06 *** | 2.45 | 49.44 *** | 45.46 *** |
| Biochar | 987.75 *** | 276.49 *** | 0.92 | 1.54 | 99.40 *** | 47.71 *** | 11.59 ** | 3.87 |
| Soil pH × Biochar | 9.04 *** | 316.62 *** | 7.04 *** | 2.43 | 4.32 * | 0.49 | 25.66 *** | 0.59 |
| Factors | AOA-amoA | AOB-amoA | nirk | nirS | nosZ |
|---|---|---|---|---|---|
| Soil pH | 496.96 *** | 810.68 *** | 113.13 *** | 299.172 *** | 91.285 *** |
| Biochar | 0.178 | 72.65 *** | 30.01 *** | 37.14 *** | 22.33 *** |
| Soil pH × Biochar | 0.849 | 7.79 *** | 10.01 *** | 6.32 ** | 6.76 *** |
Disclaimer/Publisher’s Note: The statements, opinions and data contained in all publications are solely those of the individual author(s) and contributor(s) and not of MDPI and/or the editor(s). MDPI and/or the editor(s) disclaim responsibility for any injury to people or property resulting from any ideas, methods, instructions or products referred to in the content. |
© 2024 by the authors. Licensee MDPI, Basel, Switzerland. This article is an open access article distributed under the terms and conditions of the Creative Commons Attribution (CC BY) license (https://creativecommons.org/licenses/by/4.0/).
Share and Cite
Qian, X.; Chen, H.; Li, Q.; Wang, F. Converse Responses of Biochar Application on N2O Emissions in Soils at Different pH Values in a Subtropical Citrus Orchard. Agronomy 2024, 14, 1831. https://doi.org/10.3390/agronomy14081831
Qian X, Chen H, Li Q, Wang F. Converse Responses of Biochar Application on N2O Emissions in Soils at Different pH Values in a Subtropical Citrus Orchard. Agronomy. 2024; 14(8):1831. https://doi.org/10.3390/agronomy14081831
Chicago/Turabian StyleQian, Xiaojie, Hongmei Chen, Qinghua Li, and Fei Wang. 2024. "Converse Responses of Biochar Application on N2O Emissions in Soils at Different pH Values in a Subtropical Citrus Orchard" Agronomy 14, no. 8: 1831. https://doi.org/10.3390/agronomy14081831
APA StyleQian, X., Chen, H., Li, Q., & Wang, F. (2024). Converse Responses of Biochar Application on N2O Emissions in Soils at Different pH Values in a Subtropical Citrus Orchard. Agronomy, 14(8), 1831. https://doi.org/10.3390/agronomy14081831