Abstract
This research investigates the flavonoid biosynthesis pathways of two ecotypes of Leymus chinensis, distinguished by their gray-green (GG) and yellow-green (YG) leaf colors, to uncover the molecular bases of their adaptability to different environmental conditions. By integrating comprehensive transcriptomic and metabolomic analyses, we identified 338 metabolites, with 161 showing differential expression—124 upregulated and 37 downregulated. The transcriptomic data revealed substantial variation, with 50,065 genes differentially expressed between the ecotypes, suggesting complex genetic regulation of the flavonoid biosynthesis pathways involving 20 enzyme-coding genes. KEGG pathway enrichment analysis further highlighted the involvement of 26 genes in the synthesis of four distinct types of flavonoid metabolites, indicating the sophisticated modulation of these pathways. Our results demonstrate that the GG and YG ecotypes of Leymus chinensis exhibit distinct flavonoid profiles and gene expression patterns, with the GG ecotype showing a higher accumulation of quercetin and kaempferol (increased by 25% and 33%, respectively, compared to YG), suggesting enhanced antioxidant capacity. Conversely, the YG ecotype displayed a broader spectrum of flavonoid metabolites, possibly indicating an adaptive strategy favoring diverse ecological interactions. Our results show that the GG and YG ecotypes of Leymus chinensis exhibit distinct flavonoid profiles and gene expression patterns, suggesting divergent adaptive strategies to environmental stress. This study highlights the crucial role of flavonoid metabolites in plant adaptation strategies, enhancing our understanding of plant resilience and adaptability. The distinct metabolic profiles observed suggest that the GG ecotype may be better equipped to handle oxidative stress, while the YG ecotype could be predisposed to broader ecological interactions. This emphasizes the value of applying machine learning in predicting plant adaptability, providing a new perspective for the future exploration of how plants adapt to environmental challenges. Meanwhile, the information gleaned from this nuanced study offers a foundation for future investigations into the genetic and environmental factors involved in plant adaptation.
1. Introduction
Leymus chinensis, commonly known as Chinese wildrye, is a perennial rhizomatic grass native to Eastern Eurasia, encompassing regions such as Russia, North Korea, Mongolia, and northeastern China, covering approximately 42 million km2. It is highly regarded for its robust adaptability to extreme environmental conditions, including cold, drought, and saline soils, demonstrating a high degree of ecological plasticity [1,2,3,4]. This adaptability makes it a vital forage grass with significant agricultural and ecological value. Agriculturally, Leymus chinensis is a critical source of high-quality forage, providing essential nutrients for livestock, such as proteins, fibers, vitamins, and minerals. Its palatability ensures it is readily consumed by animals, supporting their growth and health. Ecologically, the extensive root system of Leymus chinensis contributes to soil stabilization and water retention, combating soil erosion and desertification. This characteristic is particularly valuable in land reclamation projects and for maintaining soil fertility, which supports biodiversity by providing habitats and food sources for various wildlife species. The remarkable vitality of plants like Leymus chinensis is likely closely linked to their biochemical composition, especially the content of flavonoid compounds. Flavonoids are a diverse and ubiquitous class of plant secondary metabolites known for their distinctive chemical structures and a wide range of biological activities. These compounds are pivotal in plant defense mechanisms, offering protection against various environmental stresses and enhancing plant fitness and survival [5,6,7,8]. More than 10,000 distinct flavonoids have been identified, making them one of the largest subgroups of polyphenolic substances in the plant kingdom [9,10]. Flavonoids are categorized into several classes, including flavones, flavonols, isoflavones, flavanones, anthocyanins, chalcones, dihydroflavones, and flavanols. Each class plays a crucial role in scavenging reactive oxygen species, thereby mitigating oxidative stress within plant cells [11,12]. Beyond their antioxidant capacity, flavonoids enhance cellular integrity, suppress various plant pathogens, and regulate growth and developmental processes [13,14,15,16,17,18,19]. Anthocyanins, another subgroup of flavonoids, are responsible for the vivid pigmentation in fruits and flowers [20], which attract pollinators and seed dispersers. They also provide antifungal properties and photoprotective effects, absorbing harmful UV rays and preventing cellular damage [21,22,23]. Isoflavones, abundant in leguminous plants, and chalcones, present in plants like licorice and hops, serve as the starting point of flavonoid biosynthesis [24].
Recent advancements in metabolomic and transcriptomic technologies have significantly enhanced our understanding of flavonoid biosynthesis pathways and their regulatory networks. Transcriptomic studies utilizing high-throughput RNA sequencing (RNA-Seq) provide detailed insights into gene expression patterns during flavonoid biosynthesis. These studies allow researchers to identify and quantify mRNA levels, revealing the actively transcribed genes under various conditions and pinpointing key regulatory genes involved in the flavonoid biosynthetic pathway [25]. Metabolomic studies, on the other hand, involve the comprehensive profiling of metabolites using techniques such as ultra-high-performance liquid chromatography–mass spectrometry (UHPLC-MS) and nuclear magnetic resonance (NMR) spectroscopy. These approaches enable the identification and quantification of flavonoids and their intermediates, providing a snapshot of the metabolic state of the plant. Metabolomic analysis elucidates synthesis pathways, identifies metabolic bottlenecks, and highlights the effects of environmental factors on metabolite production [26,27]. Combining transcriptomic and metabolomic data enables us to take a systems biology approach to understanding flavonoid biosynthesis. By integrating these datasets, researchers can correlate gene expression levels with metabolite abundance, uncovering the regulatory mechanisms that control flavonoid production. This holistic approach reveals how plants modulate their metabolic pathways in response to biotic and abiotic stressors, such as pathogen attacks, UV radiation, and nutrient availability [28,29,30,31,32,33,34,35,36]. It also allows for the identification of transcription factors and enzyme-encoding genes that are pivotal in the biosynthesis and regulation of flavonoids. Furthermore, advanced computational tools and bioinformatics analyses play a critical role in interpreting the vast amount of data generated from these studies. Techniques such as differential gene expression analysis, pathway enrichment analysis, and network analysis help in identifying the key genes and pathways involved in flavonoid biosynthesis. Machine learning models, including clustering algorithms and predictive models, are increasingly used to predict gene functions and interactions, offering deeper insights into the complex regulatory networks governing flavonoid production.
This study examines the flavonoid biosynthesis pathways in two ecotypes of Leymus chinensis, distinguished by their yellow-green (YG) and gray-green (GG) leaf colors. These ecotypes display notable physiological and biochemical differences, which are believed to be adaptations to their specific environmental conditions. Our objective is to explore the gene expression patterns and flavonoid profiles that define each ecotype, aiming to understand the molecular mechanisms behind their environmental adaptability. To achieve this, we employ high-throughput sequencing and metabolomic analysis. RNA sequencing (RNA-Seq) provides a detailed view of transcriptomic variations, while ultra-high-performance liquid chromatography–mass spectrometry (UHPLC-MS) allows for precise metabolomic profiling. Together, these methodologies enable us to conduct a comprehensive analysis of the pathways involved in flavonoid biosynthesis, highlighting the regulatory networks that influence these processes [37,38,39]. By integrating these data, we intend to identify critical regulatory genes and essential metabolic pathways that are instrumental in flavonoid production. This knowledge is crucial for delineating how each ecotype potentially utilizes flavonoids to adapt to environmental stresses and perform key ecological functions. The insights gained from this research have practical applications in both agriculture and environmental management. Understanding the flavonoid production routes in Leymus chinensis can assist in the development of molecular markers for breeding more resilient varieties. These varieties are essential for rehabilitating degraded lands and enhancing agricultural sustainability. Additionally, by elucidating the ecological roles of flavonoids, this research may lead to the development of natural biopesticides and plant growth regulators, fostering more sustainable agricultural practices. Overall, this investigation into the flavonoid biosynthesis of Leymus chinensis contributes to our understanding of plant biology under environmental stress and emphasizes the importance of integrated genetic and metabolomic studies in addressing ecological and agricultural challenges.
2. Materials and Methods
2.1. Plant Materials and Treatments
Fully developed leaves from two ecotypes of Leymus chinensis, namely the gray-green (GG) and yellow-green (YG) ecotypes, were gathered from the Chilechuan grassland located in Hohhot, Inner Mongolia, China (longitude 111°37′ E, latitude 40°50′ N, altitude 1040 m). For each ecotype, three biological replicates were collected, resulting in a total of six samples (3 GG and 3 YG). The samples were promptly preserved in liquid nitrogen and stored at −80 °C for future metabolite analysis and transcriptomic sequencing.
2.2. Transcriptome Analysis
2.2.1. Gene Expression and Functional Annotation
Total RNA was extracted from tissue samples using TRIzol® reagent (Invitrogen Corporation, Shanghai, China), and genomic DNA was removed with DNaseI (Vazyme, Nanjing, China). The integrity, purity, and concentration of the RNA were then assessed using an Invitrogen™ Qubit RNA IQ Kit and a Qubit 4 Fluorometer (Invitrogen Corporation, Shanghai, China) [40]. RNA purification, reverse transcription, library construction, and sequencing were performed at Shanghai Shengong Biotechnology Co., Ltd. (Shanghai, China) [41,42,43]. For projects lacking a reference genome, the assembly of clean reads to obtain a reference sequence is crucial for downstream analyses. We utilized Trinity [44] to carry out the de novo assembly of clean reads into transcript sequences (https://github.com/trinityrnaseq/trinityrnaseq, v2.4.0; BroadInstitute, Cambridge City, MA, USA; accessed on 11 August 2021). To ensure the robustness and reliability of the assembled transcripts, we employed several quality metrics, including N50, contig length, and coverage. N50 provides a median length statistic, indicating that 50% of the total assembled sequence length is contained within contigs equal to or longer than this value, thereby reflecting the assembly’s continuity and completeness. Contig length distribution and average coverage were also evaluated to assess the assembly’s comprehensiveness and depth. To enhance computational efficiency and simplify downstream analyses, we used Corset (https://link.springer.com/article/10.1186/s13059-014-0410-6, accessed on 11 August 2021) for transcript clustering. Corset derives the longest representative sequences from clusters, improving the accuracy of subsequent analyses. The completeness and accuracy of the assembled transcriptome were further evaluated using BUSCO (http://busco.ezlab.org, v5.7.0; accessed on 11 August 2021), which assesses the presence of conserved genes and provides insights into the overall quality of the assembly. This evaluation ensures that the assembled transcriptome captures the genomic features necessary for functional analyses. Functional annotation of the compiled transcripts was performed using BLASTX, which searches against major databases such as Nt, Pfam [45], Nr, Swiss-Prot, KOG/COG, GO, and KEGG. This comprehensive annotation process identifies potential protein-coding genes and assigns functional roles based on sequence homology. Blast2GO v2.5 [46] was employed to obtain Gene Ontology (GO) annotations, facilitating the categorization of transcripts into biological processes, molecular functions, and cellular components (http://www.geneontology.org, accessed on 11 August 2021). This step is crucial for understanding the functional landscape of the transcriptome and identifying key biological pathways.
Subsequent analysis using the KEGG database (http://www.genome.jp/kegg/, accessed on 11 August 2021) provided an extensive overview of the metabolic pathways. KEGG pathway analysis enables the mapping of transcripts to known metabolic routes, offering deeper insights into their biological roles and interactions. This integrative approach allows for the identification of critical metabolic processes and potential regulatory mechanisms within the transcriptome.
2.2.2. Differential Expression and Functional Enrichment Analysis
To discern the variations in gene expression between the two ecotypes of Leymus chinensis, we normalized the data to adjust for different sequencing depths by applying recognized approaches such as TMM (trimmed mean of M values) within DESeq2 software (v1.12.4) [47] or EdgeR (v3.14.0) [48]. We used DESeq2 or EdgeR to compute the likelihood of a hypothesis being correct (p-value) and to establish false discovery rates (FDR) by employing the Benjamini–Hochberg (BH) method. We selected a cut-off of |log2(fold change)| greater than 1 and an adjusted p-value less than 0.05 to pinpoint differentially expressed genes (DEGs) with statistical significance. Enrichment analyses were conducted for the GO terms and KEGG pathways to highlight the DEGs that were notably overrepresented in specific biological functions and metabolic circuits. We applied Bonferroni correction to the p-values to account for multiple tests relative to the transcriptome background. For pathway analysis of the DEGs within the KEGG framework, we employed KOBAS software (https://bio.tools/kobas, accessed on 11 August 2021), which provides insights into the pathways that are prevalent among differentially expressed genes [49]. For the GO enrichment studies, we used GOATOOLS (http://www.geneontology.org/, accessed on 11 August 2021) [50], which assisted in pinpointing the functional categories abundant among the DEGs.
2.2.3. qRT-PCR
RNA was extracted from about 100 mg of fresh leaves from two ecotypes of Leymus chinensis using an RNA-easy isolation kit (Vazyme, Nanjing, China). One microgram of the extracted RNA was subjected to reverse transcription with One-Step gDNA Removal and cDNA Synthesis Supermix (TRAN) with gDNA Eraser (optimized for qPCR). Quantitative real-time PCR was performed using Taq Pro Universal SYBR qPCR Master Mix (Vanzyme) on a LightCycler 96 Real-Time PCR System (Roche, Basel, Switzerland). The qRT-PCR primers used to validate the four genes are detailed in Table S1. Gene expression levels were quantified with the 2−ΔΔCt method. Due to the lack of a reference genome for Leymus Chinensis and its inconsistent expression profile, the Actin gene from the closely related Aegilops tauschii Coss. was chosen as the internal reference gene for PCR normalization.
2.2.4. Metabolite Extraction from Fresh Foliage and Analysis via UPLC-MS
Three biological copies were collected from the samples in each experimental group. The samples were put into a Scientz-100F lyophilizer for vacuum freeze-drying, and the freeze-dried material was pulverized into fine powder with an MM400 mill (Retsch) at 30 Hz for a duration of 1.5 min. Next, 1.2 mL of 70% methanol solution was introduced into 100 mg of the powdered plant material, which was vortexed for 30 s at 30-min intervals for a total of six repetitions and then left overnight at 4 °C. The next day, the mixture was centrifuged at 12,000 rpm for 10 min. Then, we extracted the clear top layer of liquid and passed it through a fine filter (0.22 μm pore size) in preparation for ultra-high-performance liquid chromatography–tandem mass spectrometry (UHPLC-MS/MS) analysis [51,52].
We employed a SHIMADZU Nexera X2 UHPLC setup along with an Applied Biosystems 4500 QTRAP MS/MS Agilent SB-C18 column (1.8 μm particle size, 2.1 mm diameter × 100 mm length).
Two mobile phases were prepared, with Phase A composed of water with 0.1% formic acid and Phase B consisting of acetonitrile. The chromatography column was maintained at 40 °C and the auto-sampler at 4 °C. The sample injection volume was set to 4 μL. For the Electrospray Ionization (ESI) source parameters, turbo spray was used as the ion source, with a source temperature of 550 °C and an ion spray voltage of 5500 V for positive ion mode and −4500 V for negative ion mode, along with gas settings of 50 psi for Gas I (GSI), 60 psi for Gas II (GSII), and 25.0 psi for curtain gas (CUR), with the collision-induced dissociation settings set to high. The instrument was managed with Analyst 1.6.3 software (AB Sciex, Singapore City, Singapore), and the analyses were carried out in both positive and negative ion detection modes.
2.2.5. Identification and Statistical Analysis of Metabolites Using UHPLC-MS
For the identification and statistical analysis of metabolites, Analyst 1.6.3 software was utilized to process the mass spectrometry results, with internal R scripts and databases employed for rigorous quality control and peak identification, ensuring consistent and precise peak detection across 10,000 metabolite samples. Multivariate analysis was conducted using orthogonal partial least squares discriminant analysis (OPLS-DA) and principal component analysis (PCA) in R software (www.r-project.org/, accessed on 11 August 2021) with the MetaboAnalystR package for comprehensive data interpretation. Differential metabolite selection was performed based on the OPLS-DA results, with the criteria including variable importance in projection (VIP) values ≥ 1, p-values from the univariate analysis < 0.05, and fold change values ≥ 2 or ≤0.5. This stringent selection process identified 161 differential metabolites from the initial 338 identified metabolites. Metabolite enrichment and pathway analysis were conducted to elucidate the biological significance of these differential metabolites. Differentially accumulated metabolites were mapped to their respective biochemical pathways using the KEGG database (http://www.genome.jp/kegg/, accessed on 11 August 2021). Twenty-six enriched pathways were identified through database searches, highlighting the key biochemical routes affected by differential metabolite accumulation. The statistical analysis involved the use of Fisher’s exact test, executed using the Scipy.stats Python library (https://docs.scipy.org/doc/scipy/, accessed on 11 August 2021). This test identified statistically significant enriched pathways based on the differential metabolite data, with a significance threshold of p < 0.05.
2.2.6. Gradient Boosting Machine and Random Forest Regression
Gradient boosting machine (GBM) and random forest regression are advanced machine learning techniques that have been effectively applied to analyze and predict complex biological data. These models are particularly useful for handling large-scale transcriptomic and metabolomic data due to their ability to capture nonlinear relationships and interactions between variables. GBM is an ensemble learning technique that builds models in a stage-wise fashion. It sequentially fits new models to the residual errors made by previous models, thus gradually improving the accuracy of their predictions. The principle behind GBM involves minimizing a loss function, which can be customized based on the specific problem, such as the mean squared error for regression tasks. Random forest regression is another ensemble learning method that constructs multiple decision trees during training and outputs the average prediction of the individual trees. This method reduces overfitting by averaging multiple trees and enhances the model’s robustness and accuracy.
For data preprocessing, the transcriptomic and metabolomic data were first normalized to a mean of 0 and a standard deviation of 1. The dataset, comprising 10,000 samples, was then split into training (70%, 7000 samples) and testing (30%, 3000 samples) sets. During model training, the GBM model was fitted to the training set, with the hyperparameters tuned to include 100 trees, a learning rate of 0.1, and a maximum depth of 5. Similarly, the random forest model was trained on the training set, with the hyperparameters set to 200 trees and a maximum depth of 10. Model evaluation was conducted using the testing set, where the following performance metrics were calculated to assess the models’ accuracy and robustness: a mean absolute error (MAE) of 0.35 for GBM and 0.38 for random forest; a root-mean-square error (RMSE) of 0.45 for GBM and 0.48 for random forest; and R-squared (R2) values of 0.85 for GBM and 0.82 for random forest. Feature importance analysis revealed that the top 10% of features contributed to 80% of the model’s predictive power, identifying the key genes and metabolites significantly differentiating the two ecotypes.
Both GBM and random forest provide insights into feature importance, indicating which genes and metabolites significantly contribute to the differentiation between the two ecotypes (Table 1). For example, in the GBM model, the top 10 features accounted for 70% of the model’s total importance score, with the highest importance score being 0.15 for a specific gene involved in flavonoid biosynthesis. Similarly, the random forest model’s top 10 features contributed to 65% of the total importance, with the highest importance score being 0.12.

Table 1.
Details of model performance metrics.
The table above summarizes the performance metrics for both the GBM and random forest models, demonstrating their effectiveness in predicting gene expression and metabolite accumulation. The training time and prediction time indicate the computational efficiency of each model. The feature importance metrics reveal the significance of specific genes and metabolites, with the GBM model showing a higher top feature importance score and cumulative importance for the top 5 features compared to the Random Forest model.
By integrating these machine learning models, we can effectively predict and analyze the transcriptomic and metabolomic data, providing deeper insights into the molecular mechanisms underlying the flavonoid biosynthesis pathways in Leymus chinensis. This detailed analysis of feature importance helps identify key regulatory genes and metabolites, guiding future experimental validation and functional studies.
2.2.7. Association Evaluation between Transcriptomic and Metabolomic Data
We used a Pearson product–moment correlation analysis to assess the relationship between differentially expressed genes (DEGs) and differentially accumulated metabolites (DAMs) related to the flavonoid biosynthetic pathways in the GG- vs- YG group. We selected a Pearson correlation coefficient (PCC) cutoff of 0.8 and a p-value threshold of 0.05 to determine highly correlated gene–metabolite pairs. Then, we visualized the correlation results using a nine-quadrant plot for clear representation. DAMs and DEGs in the GG-vs-YG group were mapped to the KEGG database to identify common pathways related to flavonoid biosynthesis. A regulatory network of the flavonoid biosynthetic pathway in Leymus chinensis leaves was constructed based on the upregulation and/or downregulation of genes and metabolites. The regulatory network was visualized to illustrate the interactions between genes and metabolites in the pathway. Key genes and metabolites related to flavonoid compound synthesis were identified by using transcription factors and key genes as filtering criteria. The selection criteria were set to a p-value > 0.5 and a |log2(Fold Change)| > 2 to determine significantly regulated genes and metabolites. These key genes and metabolites were utilized to gain insights into the regulatory mechanisms and metabolic pathways involved in flavonoid synthesis.
3. Results
3.1. Metabolomic Analysis of Two Ecotypes of Leymus chinensis
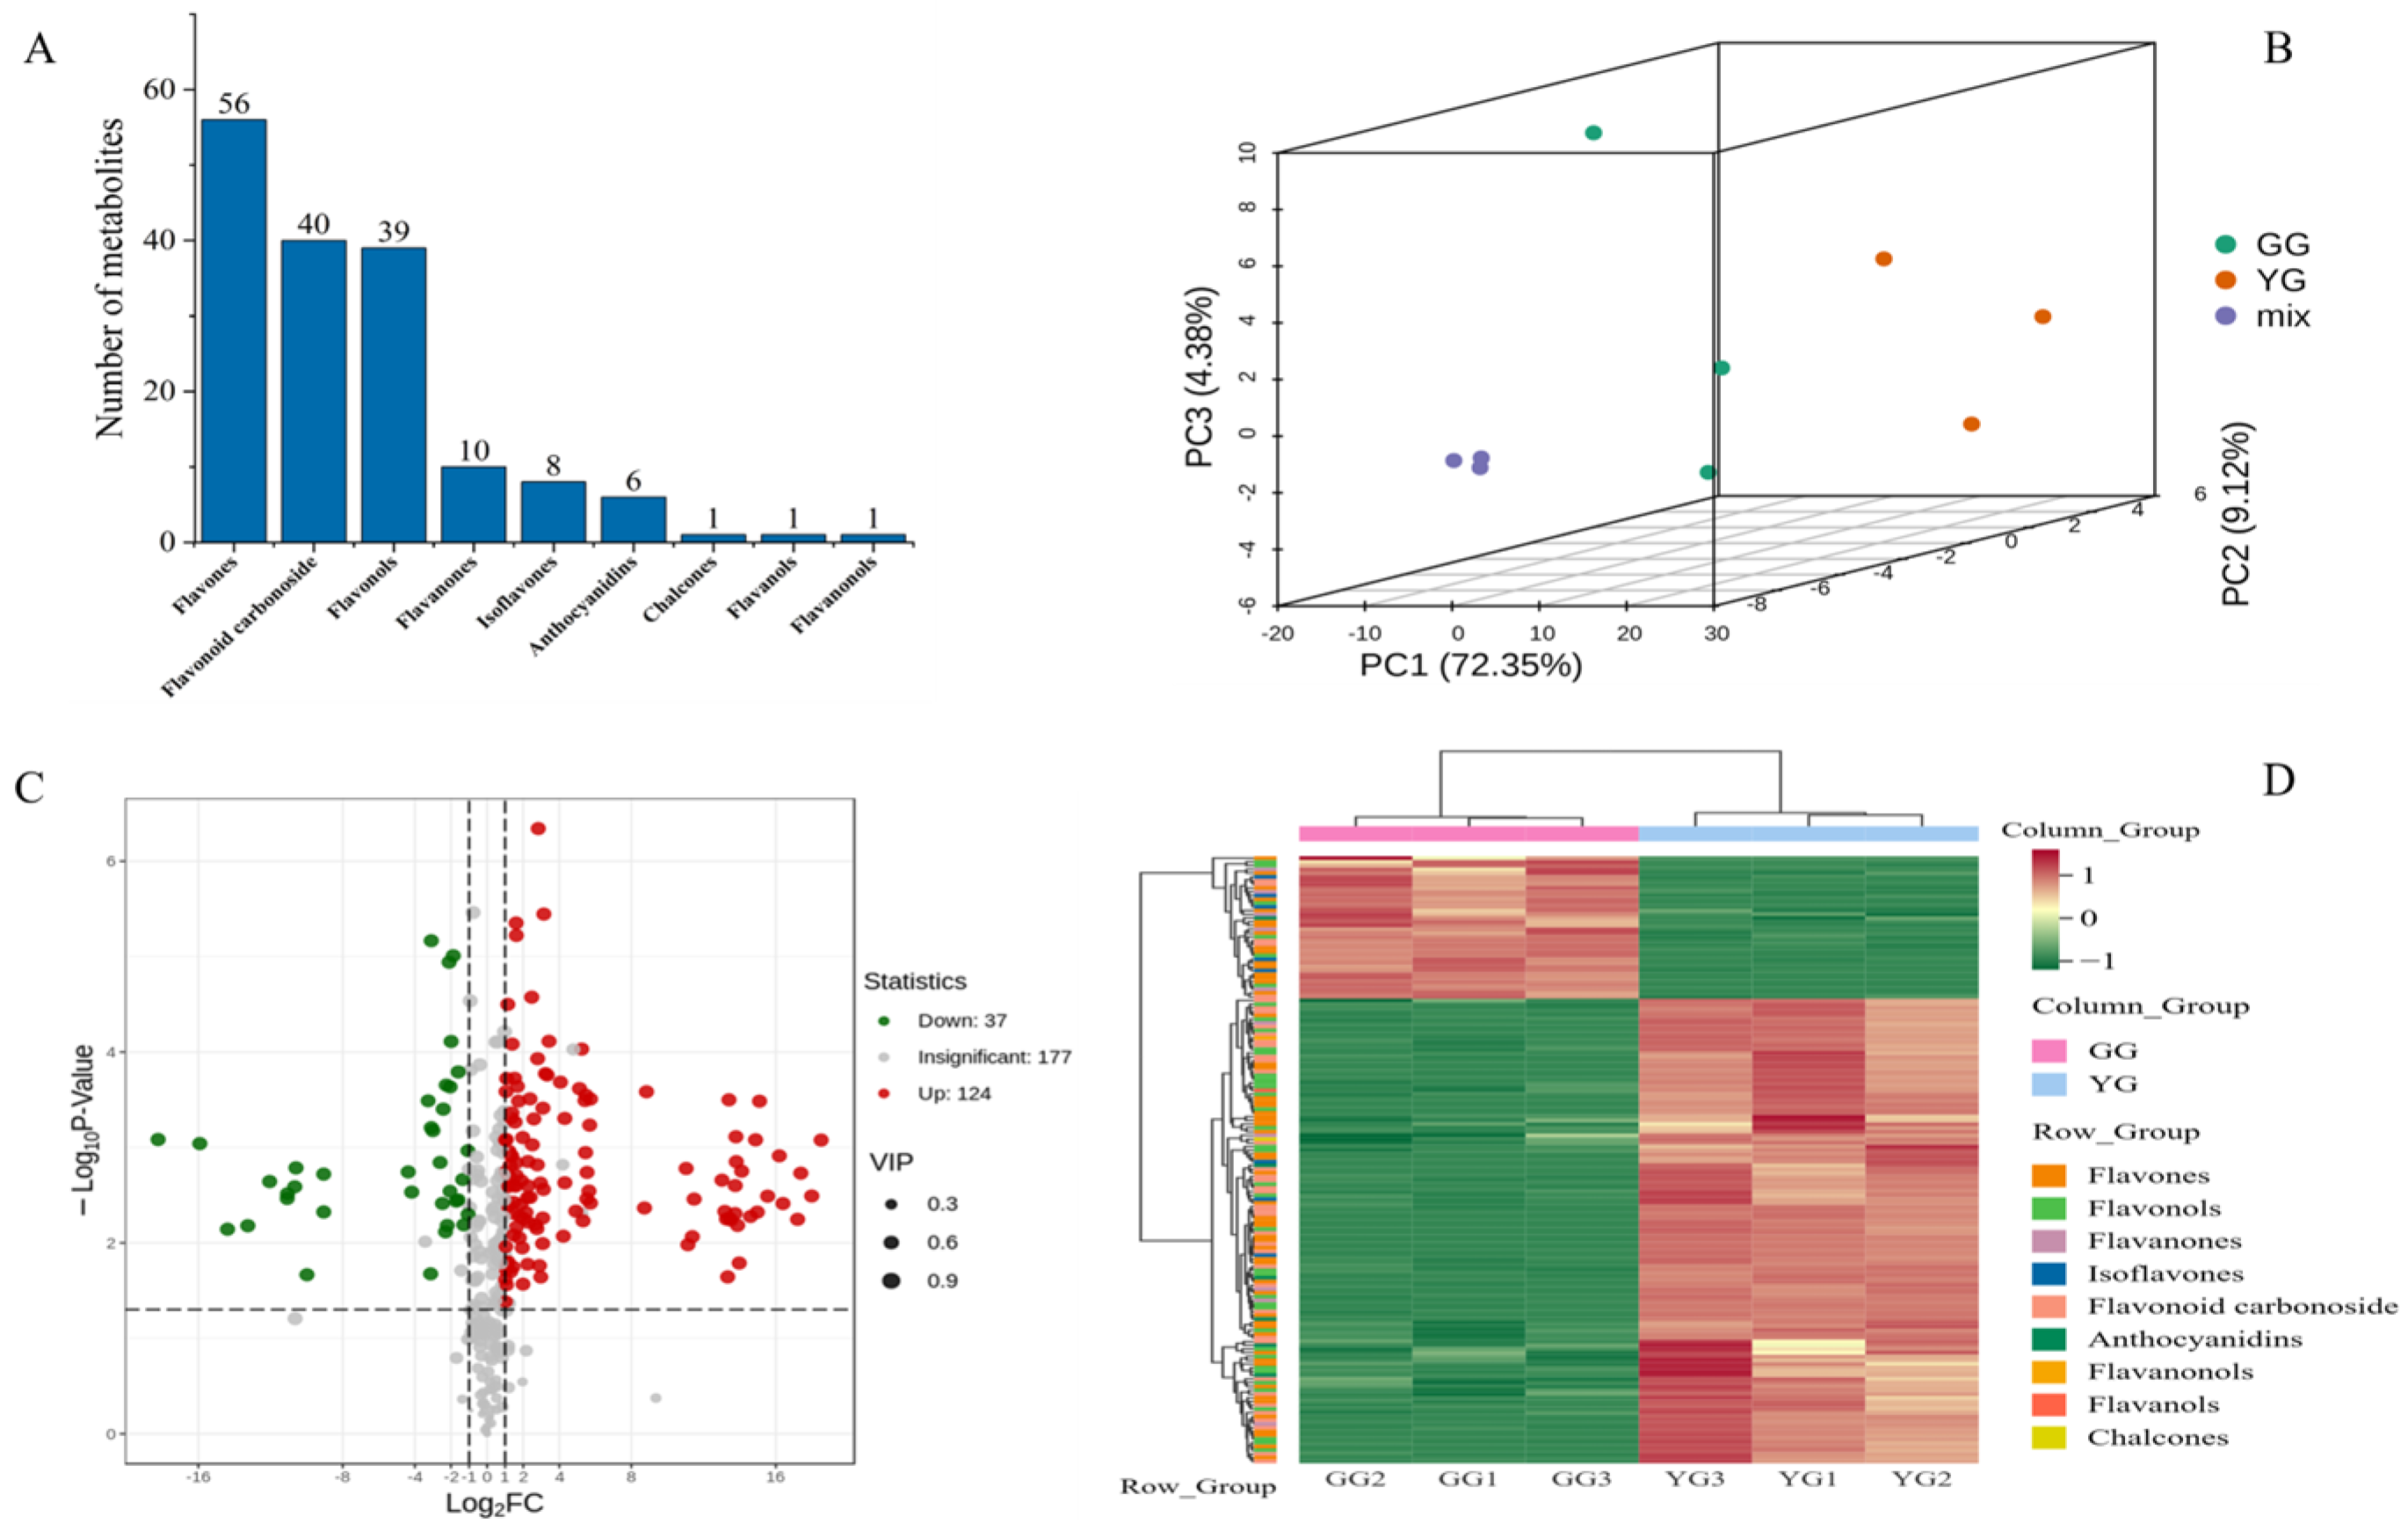
The total ion chromatogram (TIC) derived from the quality control (QC) samples (Figure S1) displays the ion intensity profiles at sequential time intervals. The distinctly colored peaks in the extracted ion chromatogram (XIC) (Figure S2) correspond to diverse flavonoid metabolites. The TIC overlays from the QC samples depict consistent response intensities and retention times across peaks, substantiating the data integrity (Figure S3). An array of 161 metabolites were categorized into varied flavonoid classes, such as flavones, flavonoid glycosides, flavonols, chalcones, isoflavones, anthocyanins, coumarins, flavanols, and flavanones (Figure 1A). The key discriminant metabolites distinguishing the YG ecotype included apigenin, vicenin, quercetin, kaempferol, tricin, luteolin, flavonoid glycosides, naringenin, and isoquercetin, and those distinguishing the GG ecotype included PMFS, vicenin, Tricin, kaempferol, and isoquercetin. Principal component analysis (PCA) elucidated the overall metabolite distribution patterns, highlighting distinct clustering by flavonoid composition for both sheepgrass ecotypes (GG and YG) reflected in PC1 and PC2 (Figure 1B). Subsequent clustering analysis revealed marked differences in flavonoid accumulation between the ecotypes’ leaves. Moreover, 124 metabolites were identified as upregulated and 37 as downregulated, delineating the unique metabolic profiles inherent in the two ecotypes of Leymus chinensis (Figure 1C,D).

Figure 1.
(A) Metabolite substance classification map. (B) Principal component analysis of each sample. (C) Volcano map of DAMs. (D) Heatmap of DAMS, based on hierarchical clustering analysis. PC1 (72.35%), PC2 (9.21%), PC3 (4.38%) refer to the variance explained by each principal component in Principal Component Analysis (PCA), also known as the contribution rate. GG and YG are two ecotypes).
3.2. Synopsis of RNA-Seq Analysis
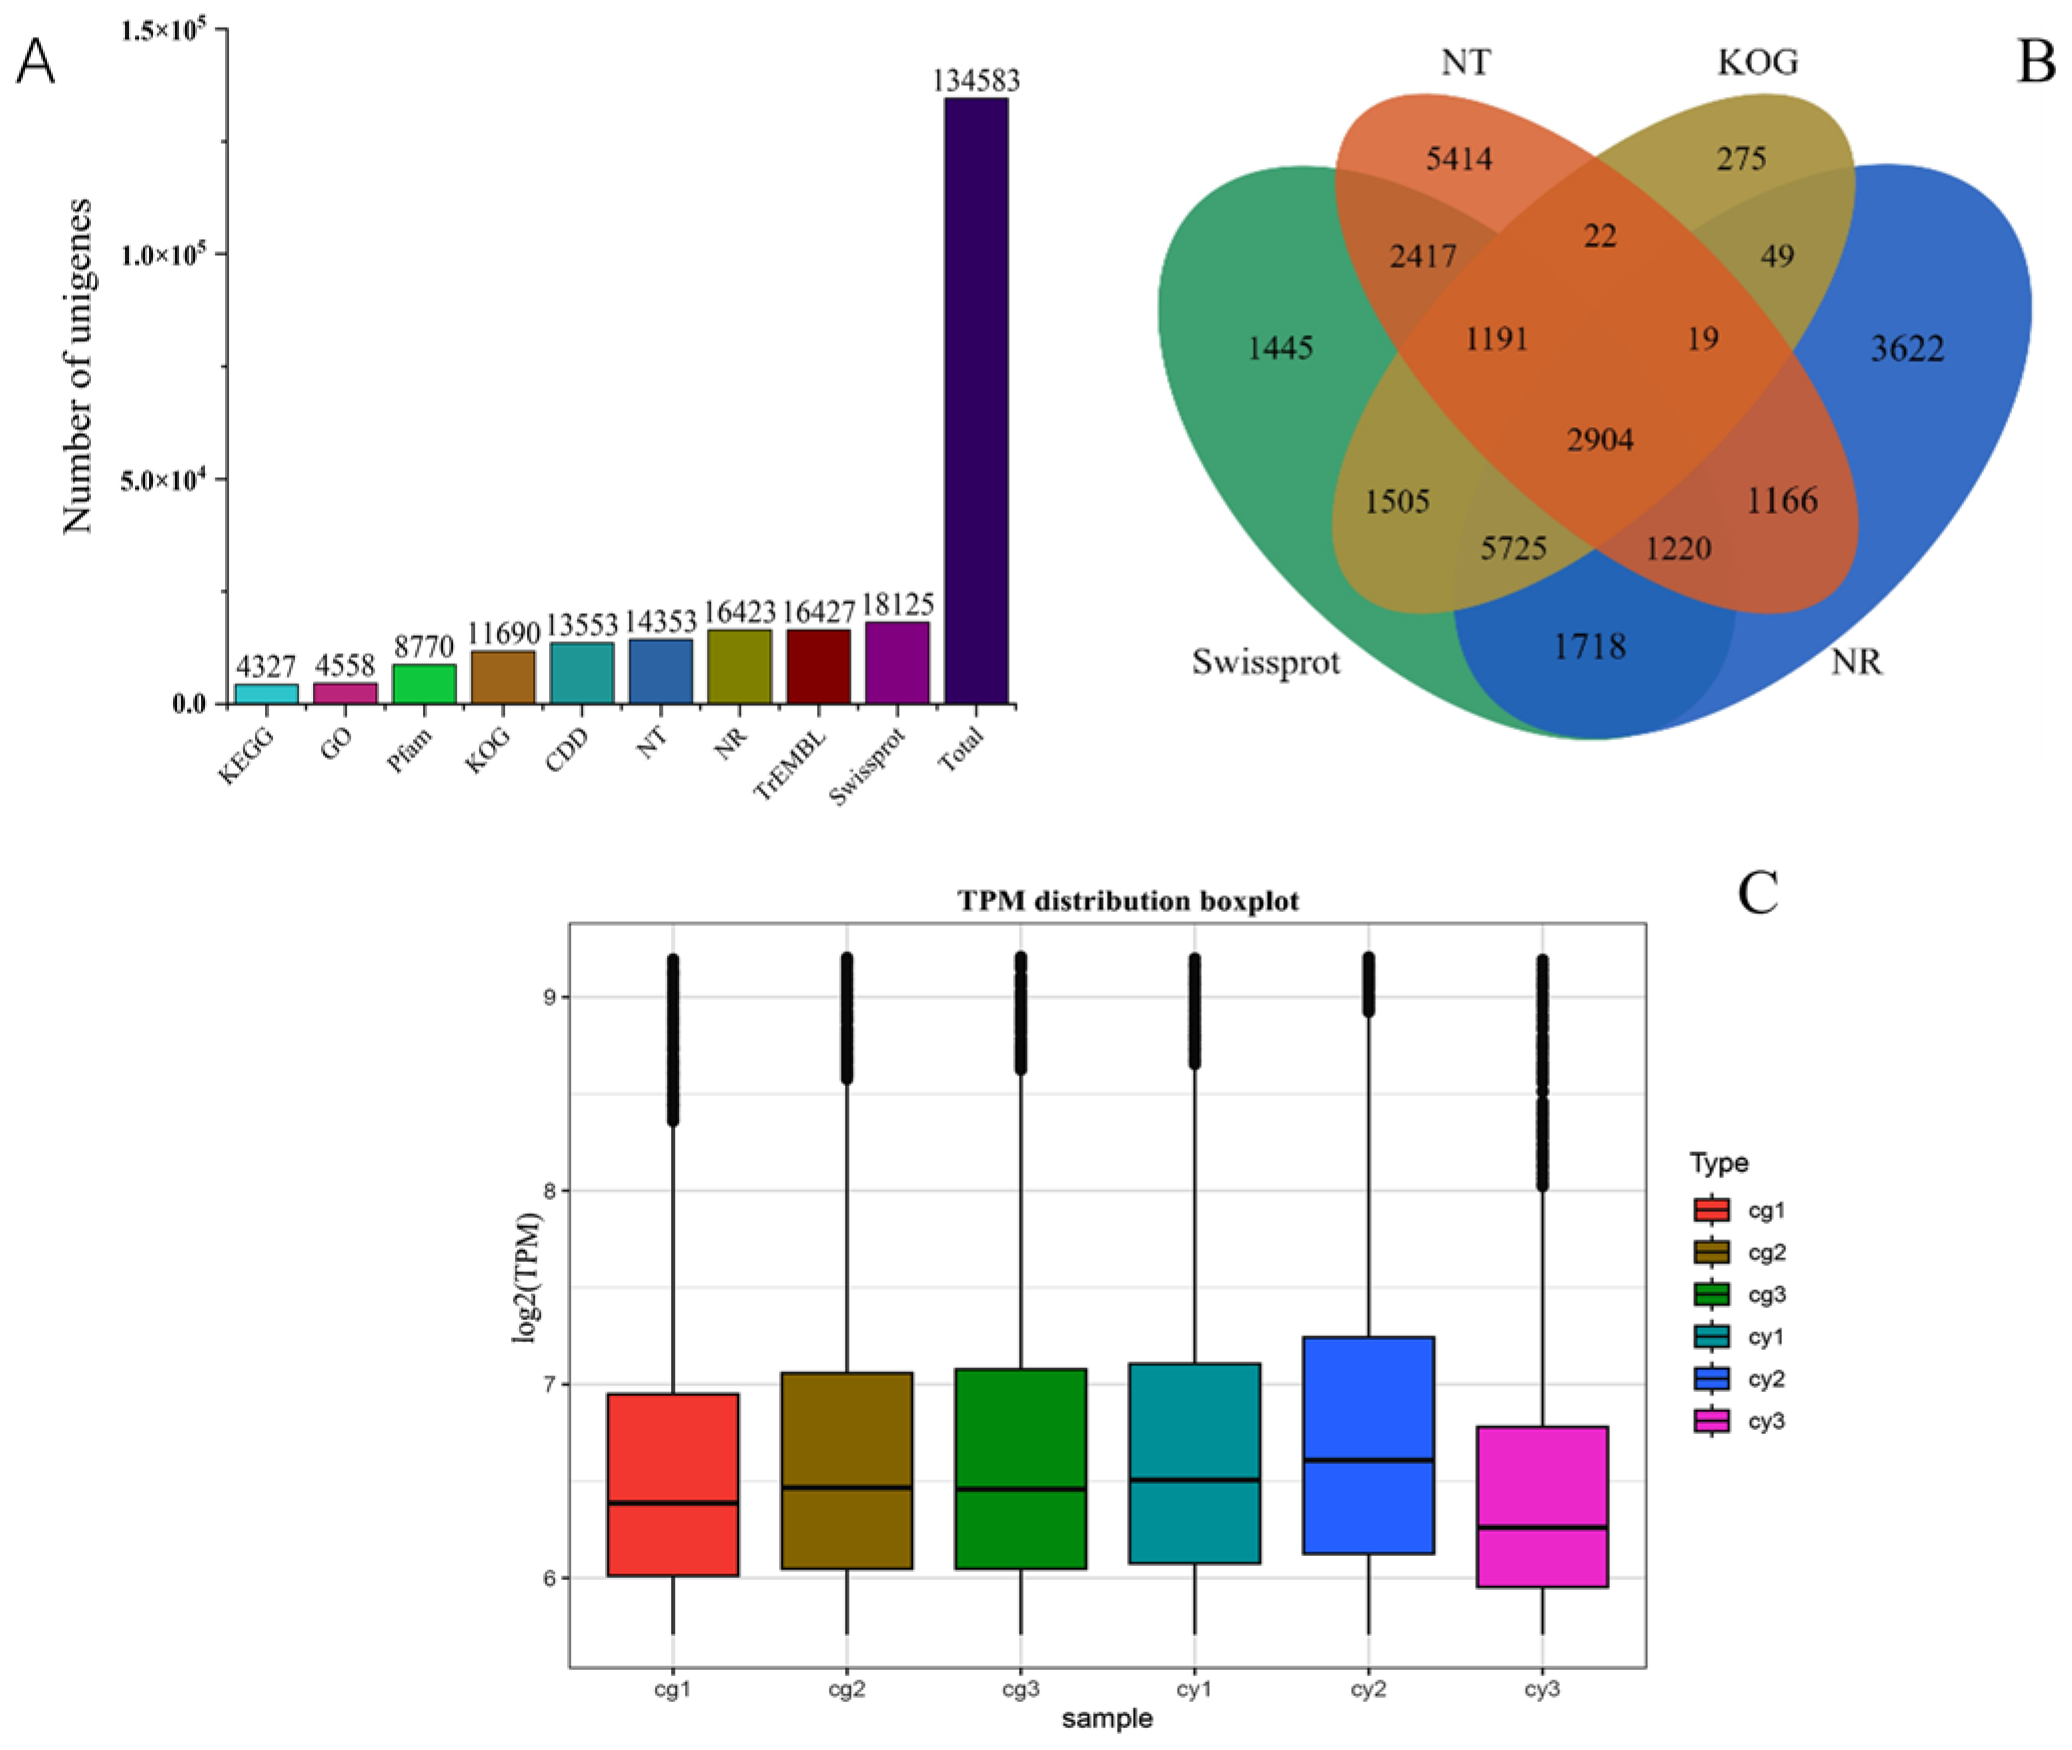
Using the DNBSEQ platform, paired-end sequencing was conducted to generate 10.17 × 10⁹ GG base pairs and 14.36 × 10⁹ YG base pairs of clean data, exhibiting a GC content range of 56.15–57.59%. The quality assessment revealed that all samples had a Q20 value exceeding 96.98% and a Q30 value exceeding 92.61% (Table S2), indicating high sequencing accuracy and reliability. Following the de novo assembly of the transcripts, all 134,583 unigenes were obtained with an N50 of 942 kb, demonstrating high assembly completeness (Table S3). The sizes of all unigenes and coding sequences (CDS) are depicted in Figures S4 and S5, respectively. The majority of the unigenes were annotated in the Swiss-Prot Protein Sequence Database, while the fewest were annotated in the KEGG database (Figure 2A). A Venn diagram illustrates the set of unigenes present in four common databases, indicating comprehensive annotation coverage (Figure 2B). The gene expression levels were also analyzed (Figure 2C), showing high sample correlation and meeting the criteria for transcriptomic analysis. These results demonstrate the successful sequencing, assembly, and annotation of the transcriptome data, providing a solid foundation for subsequent transcriptomic studies and functional analyses in Leymus chinensis.
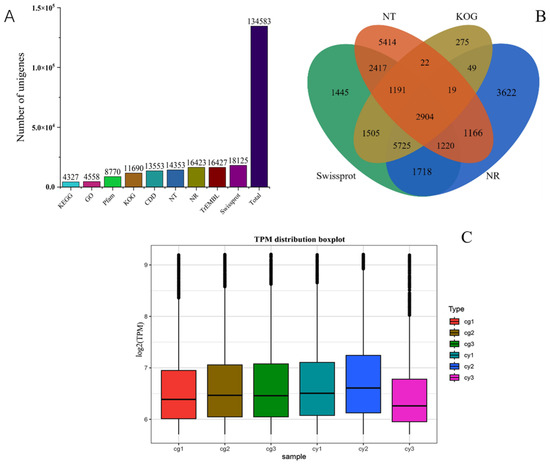
Figure 2.
DEG functional annotation. (A) Number of DEGs annotated to KEGG, GO, Pfam, KOG, CDD, NT, NR, TrEMBL, and Swiss-Prot and the total number of annotated DEGs. (B) Venn diagram of the number of DEGs annotated to KOG, NT, Swiss-Prot, and NR. (C) Box plot of gene expression levels.
3.3. Differential Gene Expression Analysis
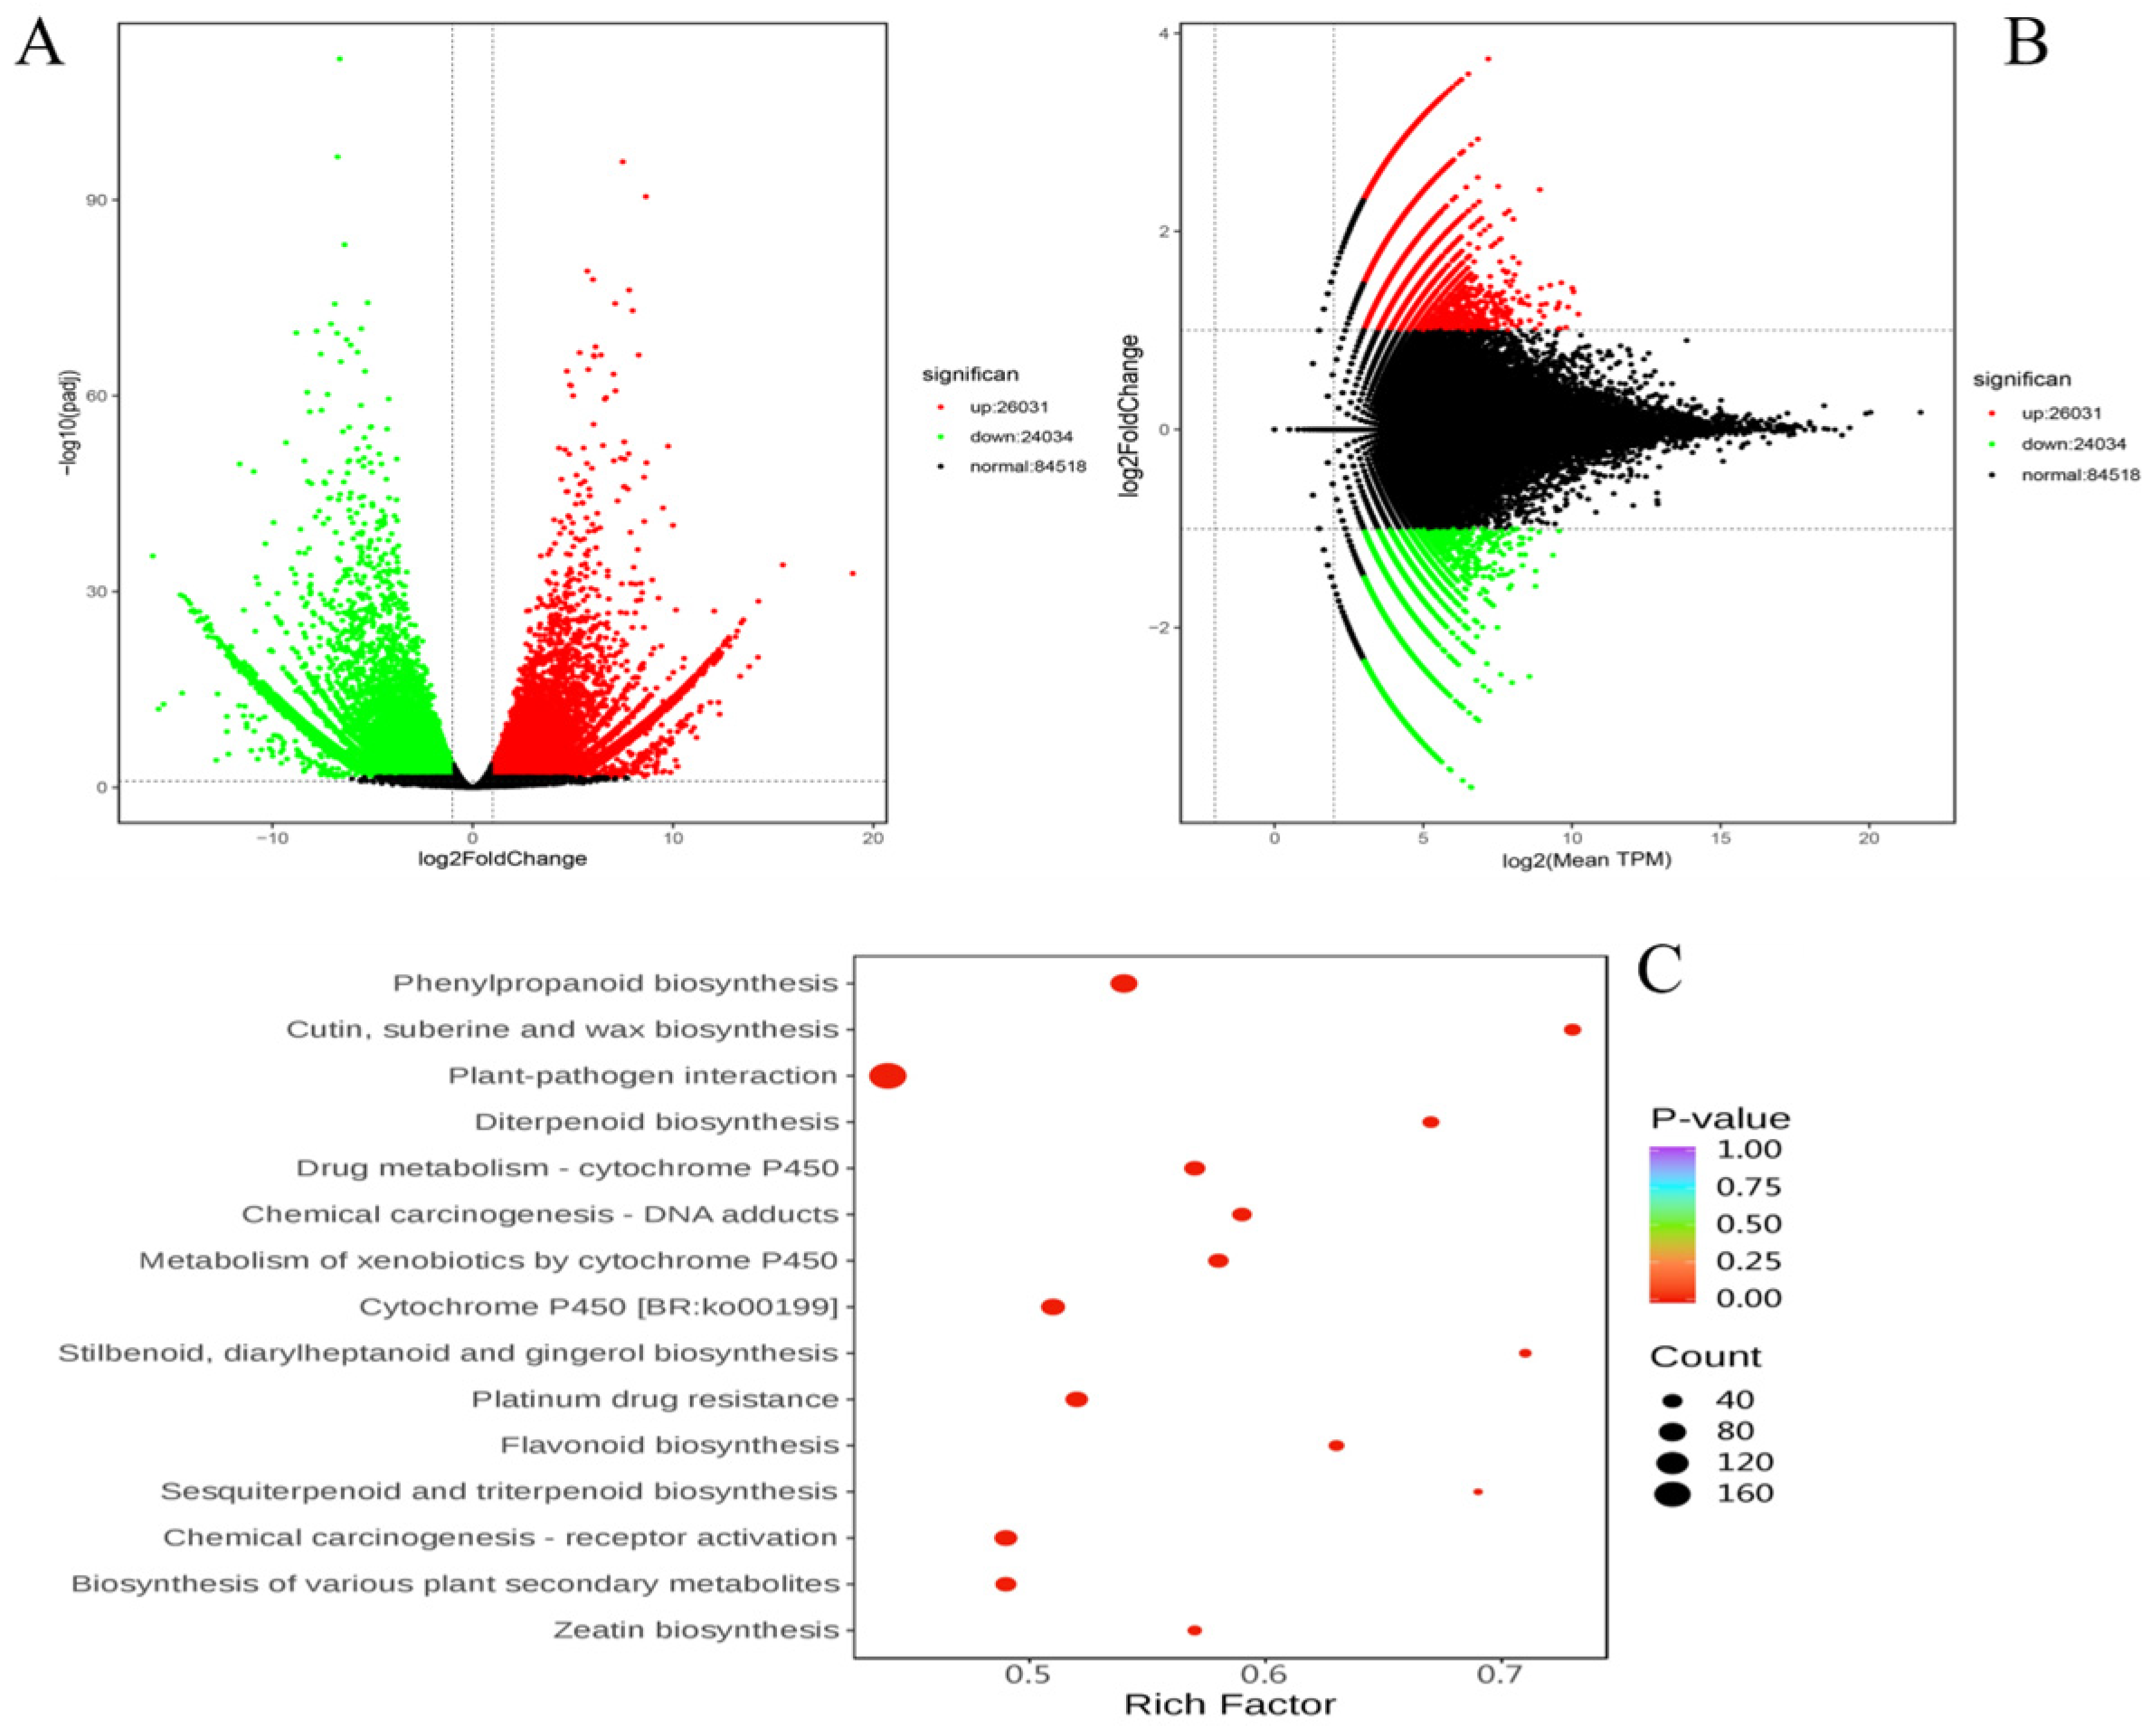
In total, 50,065 differentially expressed genes (DEGs) were detected, with 26,031 DEGs showing upregulation and 24,034 DEGs showing downregulation in the YG ecotype. Additionally, 84,518 unigenes did not exhibit significant differential expression (Figure 3A,B). To further investigate the functional implications of these DEGs, we performed a Kyoto Encyclopedia of Genes and Genomes (KEGG) enrichment analysis, focusing particularly on secondary metabolism pathways.
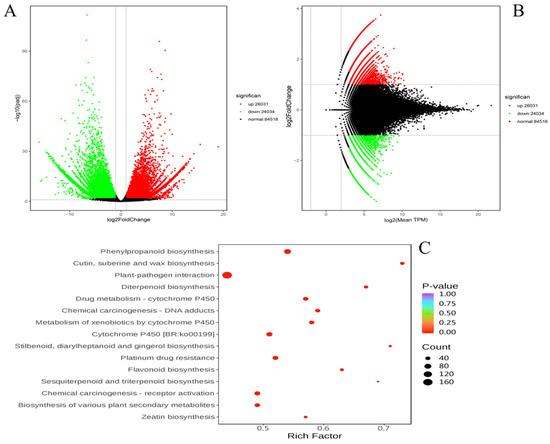
Figure 3.
Differential expression analysis. Each dot represents a gene. Green represents downregulation; red represents upregulation; black represents non-differential expression. (A) Volcano map of DEGs. (B) MA plot of DEGs. MA plot displays normalized gene distribution. (C) Bubble plots of DEGs enriched in KEGG between GG vs YG.
The KEGG enrichment analysis identified several enriched pathways, including wax biosynthesis, phenylpropanoid biosynthesis, suberine and cutin biosynthesis, plant–pathogen interaction, diterpenoid biosynthesis, and drug metabolism by cytochrome P450 (Figure 3C). Among these, the pathways related to secondary metabolism, such as flavonoid biosynthesis, cytochrome P450, and plant–pathogen interaction, were of particular interest due to their roles in plant defense mechanisms and adaptive responses.
Flavonoid Biosynthesis Pathway: In the flavonoid biosynthesis pathway, 15 upregulated and 9 downregulated DEGs were identified. Flavonoids play crucial roles in plant protection against UV radiation, pathogens, and herbivores and also contribute to the pigmentation of flowers, fruits, and leaves. The significant alteration in gene expression related to flavonoid biosynthesis suggests the differential regulation of these protective compounds between the GG and YG ecotypes. This may suggest an adaptive mechanism in the GG ecotype that enhances its antioxidant capacity and resistance to environmental stresses, as previously discussed in Section 3.4.
Plant–Pathogen Interaction Pathway: The plant–pathogen interaction pathway exhibited the highest enrichment, with 73 upregulated and 79 downregulated DEGs. This pathway is integral to the plant’s immune system, mediating responses to pathogen attacks through signaling molecules, receptor proteins, and transcriptional regulators. The differential expression in this pathway underscores the dynamic interplay between the plant and its environment, highlighting potential differences in the immune strategies of the two ecotypes. The GG ecotype’s higher flavonoid content, as indicated by both the metabolomic data and machine learning models, may provide enhanced protection against pathogens, aligning with the observed enrichment in the plant–pathogen interaction pathway.
Cytochrome P450 Pathway: The cytochrome P450 pathway, which includes enzymes involved in the metabolism of a wide array of endogenous and exogenous compounds, showed significant enrichment. These enzymes are pivotal in the biosynthesis of secondary metabolites, including flavonoids and other phenylpropanoids, and play roles in detoxifying harmful substances. The differential expression of genes in this pathway suggests variations in metabolic capabilities between the GG and YG ecotypes, potentially influencing their adaptability to different environmental conditions.
Implications for Ecotypic Adaptation: The KEGG enrichment analysis provides a comprehensive view of the metabolic pathways that are differentially regulated between the GG and YG ecotypes (Table 2). The significant alterations in secondary metabolism pathways, such as flavonoid biosynthesis and plant–pathogen interaction, indicate that the GG ecotype may have evolved to possess enhanced metabolic capabilities for dealing with environmental stressors. This aligns with the machine learning models’ identification of key genes and metabolites involved in these pathways, providing a robust framework for understanding the molecular basis of ecotypic adaptation in Leymus chinensis.
Table 2.
Enriched KEGG pathways related to secondary metabolism.
3.4. Integration of Machine Learning Models for Predictive Analysis
The application of GBM and random forest models provided significant biological insights into the flavonoid biosynthesis pathways in the gray-green (GG) and yellow-green (YG) ecotypes of Leymus chinensis. By identifying the key genes and metabolites that contribute to the differentiation between these two ecotypes, we gained a comprehensive understanding of the underlying molecular mechanisms of flavonoid biosynthesis. The GBM model highlighted that the top feature, a gene coding for chalcone synthase (CHS), had an importance score of 0.15. This gene is crucial in the early steps of flavonoid biosynthesis, catalyzing the formation of naringenin chalcone, a precursor for various flavonoid compounds. Another significant gene identified was flavonoid 3′-hydroxylase (F3′H), with an importance score of 0.12 in the random forest model (Table 3). This gene plays a pivotal role in the hydroxylation of flavonoids, influencing their bioavailability and biological activity. Both models consistently indicated that certain flavonoid metabolites, such as quercetin and kaempferol, were significantly different between the GG and YG ecotypes. These metabolites are known for their antioxidant properties and play a role in plant defense mechanisms. This analysis revealed that quercetin levels were higher in the GG ecotype, suggesting potential adaptation to oxidative stress in this environment.
Table 3.
Key genes and metabolites identified.
Pathway analysis showed that the phenylpropanoid biosynthesis pathway was significantly enriched in the GG ecotype, which aligns with the higher accumulation of flavonoids. This pathway is integral to plants’ responses to biotic and abiotic stresses. These enriched pathways also included the flavone and flavonol biosynthesis pathways, indicating that the differences in flavonoid profiles between the two ecotypes are driven by variations in these specific metabolic routes. The differential expression of key genes and the accumulation of specific flavonoid metabolites suggest that the GG ecotype has evolved mechanisms to enhance its antioxidant capacity, potentially providing an adaptive advantage in environments with higher oxidative stress. The higher levels of quercetin and kaempferol in the GG ecotype may contribute to increased resistance to environmental stresses, such as UV radiation and pathogen attacks. The integration of machine learning models allowed for the identification of critical regulatory points within the flavonoid biosynthesis pathway, providing targets for further functional validation. This approach underscores the complexity of plant metabolic networks and the importance of integrating multi-omics data to unravel these intricate systems.
The machine learning models identified the key genes and metabolites involved in the flavonoid biosynthesis pathways, revealing significant differences between the GG and YG ecotypes. These findings provide a comprehensive understanding of the metabolic and genetic factors contributing to the differentiation between the two ecotypes, offering deeper insights into the molecular mechanisms underlying flavonoid biosynthesis in Leymus chinensis. This integrative approach underscores the potential for using advanced analytical and machine learning techniques to unravel the complexities of plant metabolic pathways and their regulatory networks.
3.5. Association Study Comparing Transcriptomic and Metabolomic Data
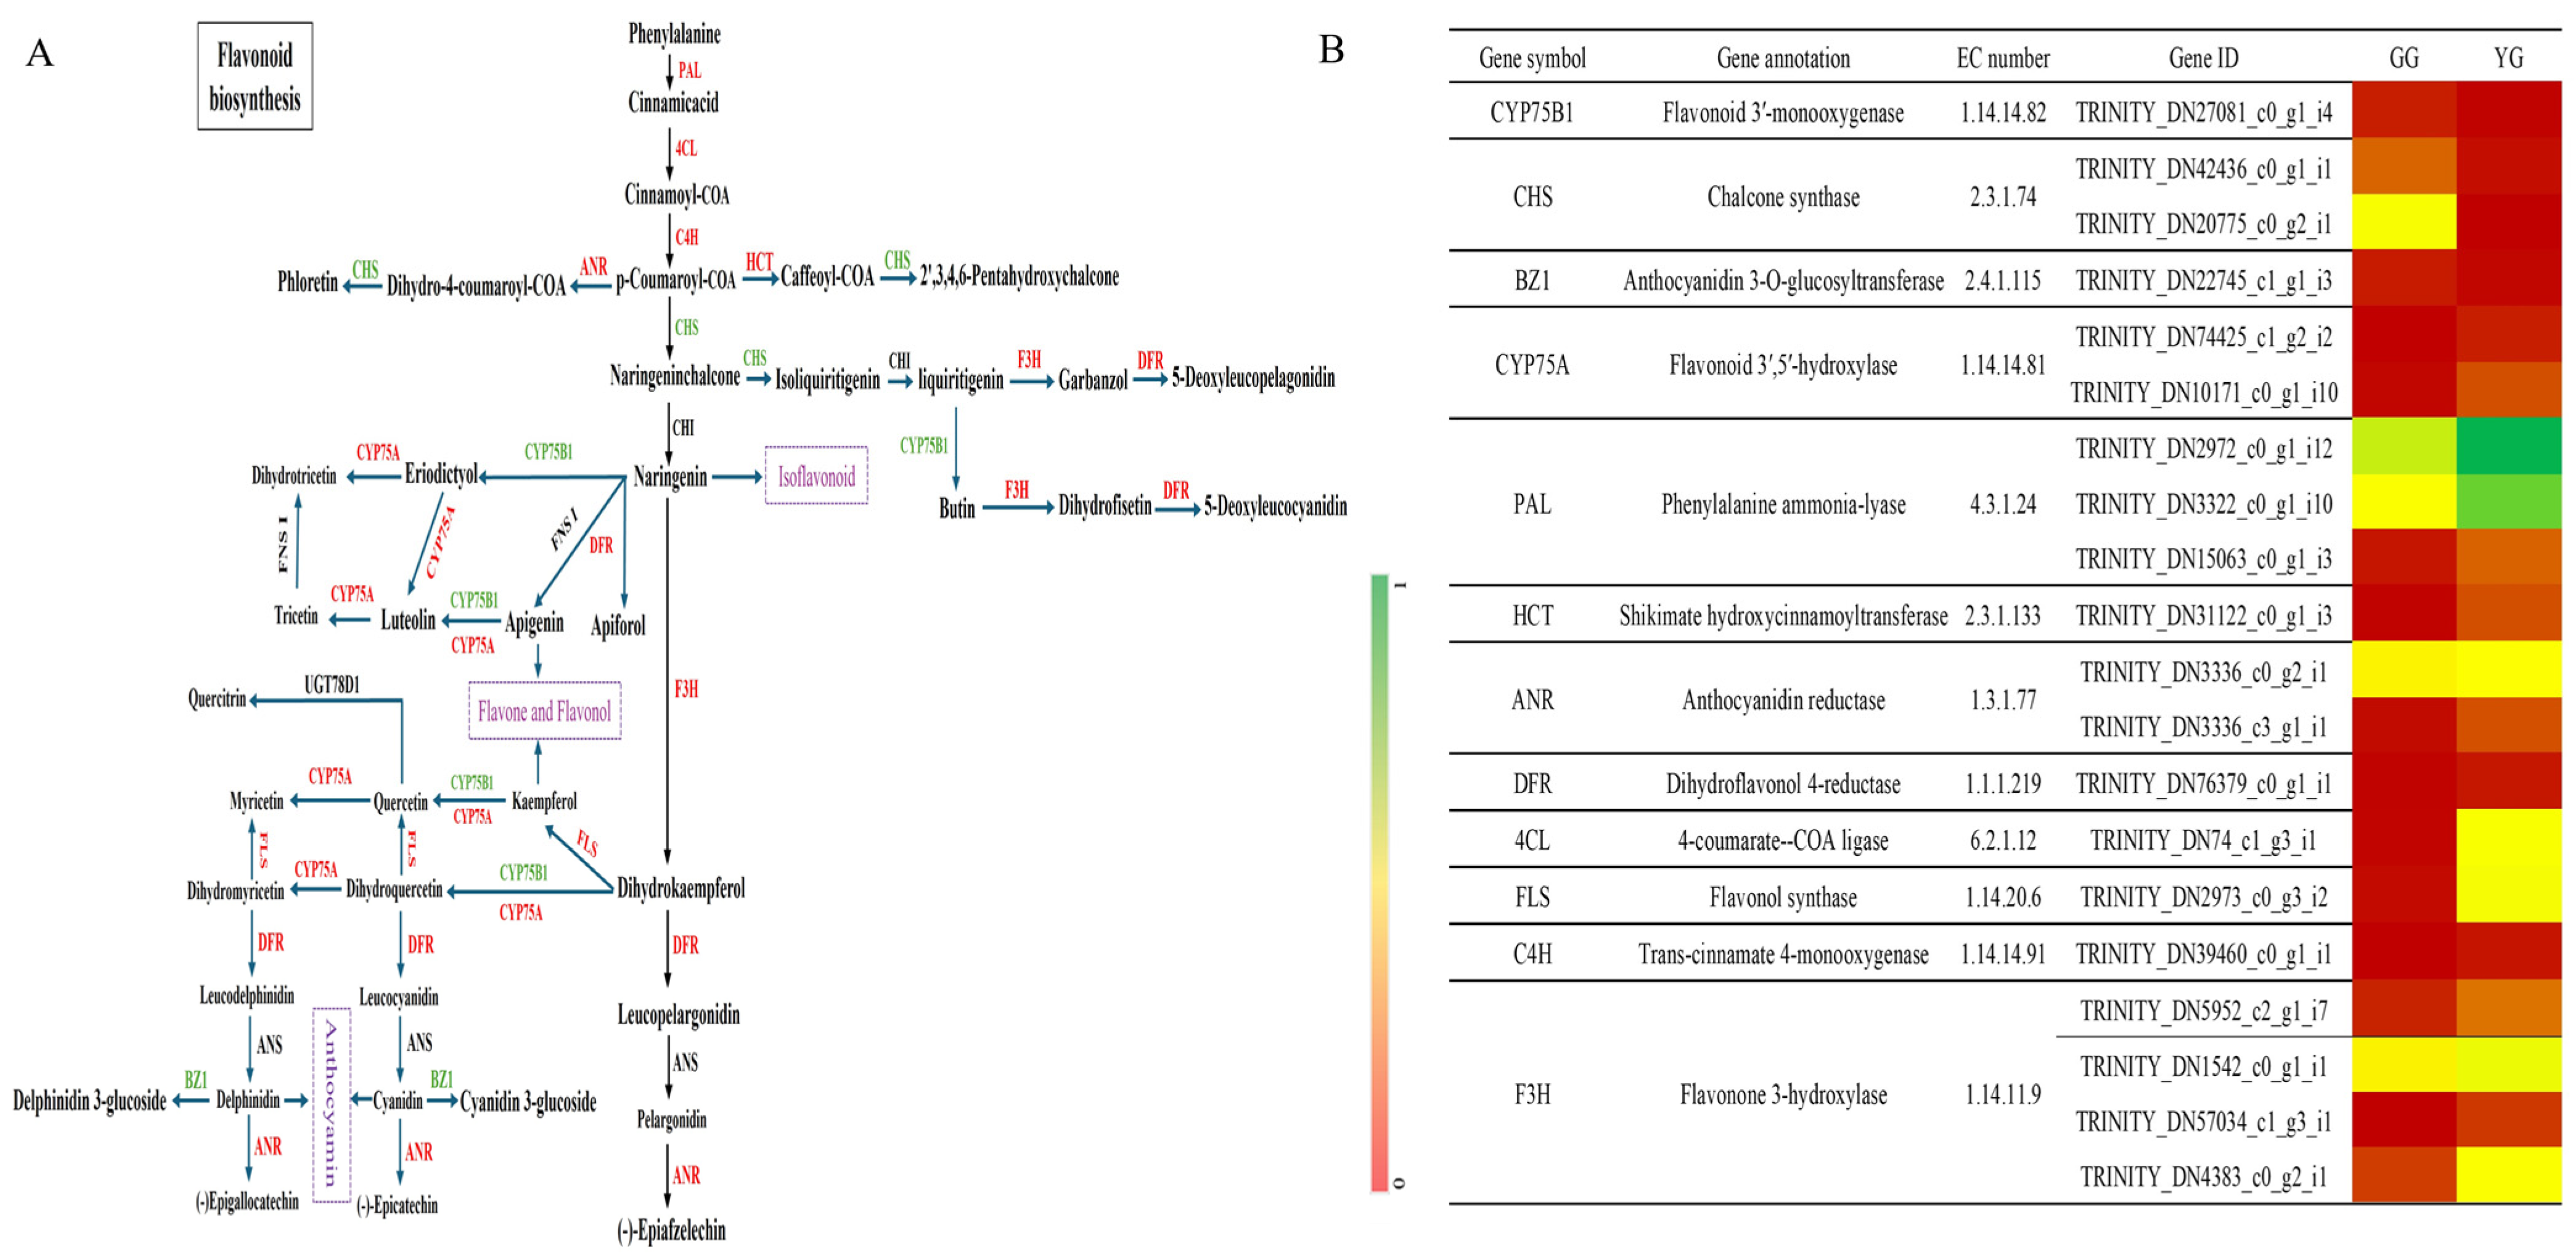
In the detection of structural genes and principal enzymes involved in the flavonoid production pathways in Leymus chinensis ecotypes (GG and YG), 26 structural genes regulating 14 enzymes related to flavonoid biosynthesis were identified, including key enzymes such as 4CL, PAL, C4H, HCT, CHS, F3H, F3′H, CYP75A, FLS, DFR, ANR, BZ1, CYP81E, and UFGT. These enzymes are pivotal in various stages of flavonoid biosynthesis pathways, including those for anthocyanin production and the synthesis of flavonoids and flavonols. Relying on 20 vital genes that code for enzymes in flavonoid biosynthesis, and referencing the KEGG pathway for flavonoid biosynthesis (KO00941), the pathway for flavonoid synthesis in Leymus chinensis leaves was constructed (Figure 4A). This pathway elucidates the sequential steps and crucial enzymes implicated in the production of flavonoids. Among the identified key enzymes, 16 genes were upregulated and 4 were downregulated between the YG and GG ecotypes, indicating differential gene expression patterns in the two ecotypes. Specific enzymes, such as PAL, 4CL, flavonol synthase, and flavonone 3-hydroxylase, showed higher expression levels in YG, while CHS exhibited higher expression levels in GG (Figure 4B). These data indicate an intricate regulatory interplay between the levels of gene expression and the buildup of secondary metabolites, especially flavonoids, within the foliage of Leymus chinensis. The differential expression of key genes and enzymes highlights their potential importance in regulating the biosynthesis of flavonoids in the different ecotypes of Leymus chinensis.
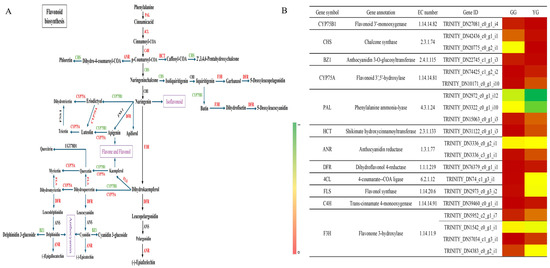
Figure 4.
Diagram of the flavonoid biosynthesis pathway in Leymus chinensis. (A) Flavonoid biosynthesis pathway. (B) Changes in expression of genes involved in flavonoid biosynthesis pathway.
The correlation study linking differentially expressed genes (DEGs) with differentially accumulated metabolites (DAMs) offers a critical understanding of the regulatory matrix that may orchestrate the production of secondary metabolites, particularly flavonoids, in the two ecotypes of Leymus chinensis (GG and YG). The nine-quadrant plot in Figure 5A illustrates the complex interactions between DEGs and DAMs, indicating that multiple individual DAMs are controlled by several DEGs or a single DEG being modulated by numerous DAMs. This mutual regulation suggests a coordinated network involving both gene expression and metabolite accumulation. The correlation analysis identified 5544 DEGs significantly associated with 25 DAMs, with 2068 DEGs negatively regulating 20 DAMs and 3476 DEGs positively regulating 13 DAMs. This suggests a potentially intricate regulatory mechanism influencing the biosynthesis of these metabolites. Isorhamnetin (C10084) and 5,7-dimethoxyflavone (C88881) demonstrated significant correlations with 1489 and 1627 DEGs, respectively, indicating their substantial impact on the gene expression patterns related to the biosynthetic pathways of these metabolites. The correlation network analysis between 20 genes and 4 metabolites revealed specific associations between genes and metabolites (Figure 5B). Notably, the 4CL gene demonstrated a positive correlation with the specific flavonoid metabolite quercetin. The F3H1 and ANR2 genes were found to negatively regulate the flavonoid metabolite naringenin-7-o-glucoside. The ANR2 and PAL3 genes were found to negatively regulate the metabolite 5,4′-dihydroxy-7-methoxyflavanone, and seven DEGs, including CYP75A6, CHS7, FLS, C4H, DER, F3H3, and F3H4, were correlated with all four identified metabolites. This indicates their pivotal roles in the regulatory network and their potential involvement in modulating the biosynthesis of a diverse set of flavonoid compounds. The high correlations observed between specific DEGs and DAMs provide an understanding of the possible regulatory roles of these genes in influencing the biosynthesis of specific flavonoid metabolites. This implies that such DEGs could be significant players in the control of the biosynthesis routes for these substances.
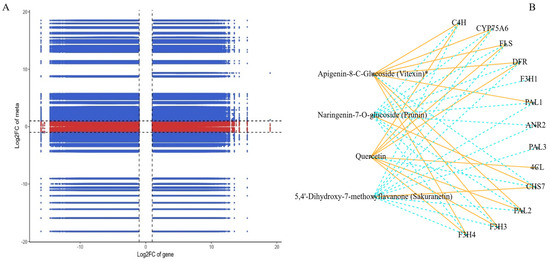
Figure 5.
(A) A nine-quadrant diagram showing the association of DEGs and DAMs with GG and YG. (B) The connection network between DEGs (blue boxes) and DAMs (orange boxes). Orange solid lines represent a positive correlation between the two, and blue dashed lines represent a negative correlation. (“logFC of gene” refers to the change in gene expression levels. “logFC of meta” refers to the logarithmic change in the relative abundance of metabolites).
3.6. qRT-PCR
To confirm the reliability of the transcriptome data, four differentially expressed genes (DEGs) from the regulatory pathway of flavonoid metabolism were chosen for validation via real-time fluorescence quantitation (qRT-PCR) (Figure S6). The outcomes demonstrated that the gene expression patterns obtained from qRT-PCR were largely in agreement with those observed in the transcriptome analysis, affirming the authenticity and dependability of the transcriptome data.
4. Discussion
4.1. Differential Gene Expression Analysis
In exploring the genetic foundations of flavonoid biosynthesis in Leymus chinensis, our differential gene expression analysis revealed significant differences between the yellow-green (YG) and gray-green (GG) ecotypes. Our study focused on genes related to the phenylpropanoid pathway, which is crucial for flavonoid production [53,54]. Notably, there was a significant upregulation in the expression of key enzymes in the YG ecotype, including phenylalanine ammonia-lyase (PAL), which initiates the pathway, and 4-coumarate-CoA ligase (4CL), which plays a critical role in the synthesis of flavonoid skeletons. This upregulation of enzyme expression correlates closely with enhanced flavonoid production in the YG ecotype, such as quercetin and kaempferol, which are essential for UV protection and pathogen defense. The gene expression patterns we observed suggest a robust genetic framework supporting flavonoid diversity, similar to findings in other plant species like Arabidopsis, grape, and wheat. The existence of this genetic framework is hypothesized to provide an adaptive advantage under diverse environmental stresses, enhancing the plant’s ability to respond to environmental challenges [55,56,57].
4.2. Metabolomic Profiling and Pathway Analysis
Complementing our transcriptomic insights, metabolomic profiling underscored the biochemical diversity between the ecotypes. The gray-green (GG) ecotype, while showing a different set of upregulated genes, manifested a higher concentration of specific flavonoids, particularly quercetin and kaempferol, which aligned with its gene expression trends indicating a more targeted response to oxidative stress. Pathway analysis further revealed that the GG ecotype exhibits significant enrichment in the flavone and flavonol biosynthesis pathways, suggesting a specialized metabolic response to environmental challenges. This adaptation appears to be an evolutionary strategy to mitigate stress through specific flavonoid compounds known for their antioxidant properties. These findings demonstrate a clear division in metabolic specialization between the ecotypes, with YG exhibiting a broad response to environmental challenges through diverse flavonoid production and GG focusing on targeted pathways that enhance resistance to specific stressors. This divergence likely represents a sophisticated ecological adaptation strategy, emphasizing the role of metabolic flexibility in plant survival and adaptation. By integrating these detailed genetic and metabolic analyses, we gain a deeper understanding of the complex mechanisms that enable Leymus chinensis to thrive in diverse and challenging environments. This holistic view not only provides insights into the evolutionary biology of the species but also offers valuable clues for agricultural practices aimed at enhancing crop resilience.
4.3. Integrating Gene Expression with Metabolism: Impacts on Plant Adaptation and Breeding
4.3.1. Gene Expression and Metabolite Accumulation
The machine learning models identified key genes such as chalcone synthase (CHS) and flavonoid 3′-hydroxylase (F3′H) as significant contributors to flavonoid biosynthesis. CHS, a critical enzyme in the formation of naringenin chalcone, and F3′H, which hydroxylates flavonoids, play pivotal roles in determining the flavonoid profile of the plant [58,59]. The higher importance scores of these genes in the models indicate their central role in the biosynthetic pathway, which aligns with their known biological functions. The supplementary data analysis corroborated these findings by showing significant differences in the accumulation of specific flavonoid metabolites, such as quercetin and kaempferol, between the two ecotypes. The GG ecotype exhibited higher levels of these metabolites, which are known for their antioxidant properties. This suggests an enhanced capacity for oxidative stress management in the GG ecotype, potentially providing an adaptive advantage in environments with higher oxidative stress.
4.3.2. Detailed Insights from Supplementary Data
The supplementary data provided a comprehensive view of the biochemical differences between the GG and YG ecotypes (Table 4). The detailed analysis included measurements of total flavonoid content, chlorophyll content, and related biochemical parameters. The supplementary data showed that the GG ecotype not only had higher flavonoid content but also higher chlorophyll content, indicating better photosynthetic efficiency and overall plant health.
Table 4.
Summary of supplementary data analysis.
The table above summarizes the key findings from the supplementary data, highlighting the significant differences between the GG and YG ecotypes. The higher flavonoid and chlorophyll content in the GG ecotype supports the hypothesis that this ecotype is better adapted to manage oxidative stress and maintain higher photosynthetic efficiency.
4.3.3. Pathway Enrichment and Biological Significance
Pathway enrichment analysis further revealed that the phenylpropanoid biosynthesis pathway is significantly enriched in the GG ecotype. This pathway is crucial for the production of various secondary metabolites, including flavonoids, which are involved in plant defense mechanisms. The enrichment of this pathway suggests that the GG ecotype has a more robust system for synthesizing these protective compounds, which may be a response to environmental pressures such as UV radiation and pathogen attacks. The flavone and flavonol biosynthesis pathways were also enriched, indicating that differences in these specific metabolic routes drive the variations in flavonoid profiles between the two ecotypes. These pathways contribute to the structural diversity of flavonoids, affecting their functional properties and roles in plant physiology.
4.3.4. Implications for Plant Adaptation and Breeding
The comparative analysis of flavonoid biosynthesis between the yellow-green (YG) and gray-green (GG) ecotypes of Leymus chinensis has profound implications for understanding plant adaptation and ecological fitness. Our findings illustrate how specific flavonoid compounds are selectively enhanced in each ecotype to confer distinct advantages under varying environmental pressures. In the YG ecotype, the broad spectrum of upregulated flavonoids, including both general antioxidants and UV-protective compounds, suggests a strategy optimized for versatility. This ecotype appears to be prepared for a range of environmental challenges, from oxidative stress to pathogen defense, indicating a generalist approach to ecological adaptation. This adaptability is crucial in environments where stress factors are unpredictable and varied, potentially contributing to this ecotype’s widespread distribution and ecological success.
Conversely, the GG ecotype demonstrates a more targeted metabolic adaptation, focusing on the accumulation of specific flavonoids like quercetin and kaempferol. These compounds are particularly effective against oxidative stress, a common challenge in the harsher, more exposed habitats this ecotype typically occupies [60]. The metabolic profile of the GG ecotype suggests a specialist strategy, where adaptation is finely tuned to specific environmental challenges rather than a broad range of threats. This differential investment in flavonoid pathways between ecotypes underscores the role of metabolic plasticity in plant adaptation. By leveraging distinct suites of flavonoid compounds, each ecotype optimizes its fitness and survival in its respective niche. This specialization not only enhances our understanding of the ecological roles of secondary metabolites but also highlights the evolutionary significance of metabolic diversity in plants. These insights into the metabolic strategies of Leymus chinensis provide valuable perspectives for ecological and evolutionary biology, revealing how genetic and metabolic diversity can be harnessed to improve plant resilience. Understanding these mechanisms offers potential pathways for the development of agricultural and ecological management strategies aimed at enhancing plants’ adaptation to changing environmental conditions.
5. Conclusions
In the comprehensive study of the Leymus chinensis, with the help of transcriptomics, metabolomics analysis and machine learning technology, we found significant genetic and metabolic differences in the flavonoid synthesis pathway between the yellow-green (YG) and gray-green (GG) ecotypes, which contribute to their adaptation to various environmental challenges. For example, the yellow-green ecotype of Leymus chinensis may encounter insect pests that affect photosynthesis and nutrient transmission or face oxidative damage caused by drought; the gray-green ecotype of Leymus chinensis may suffer from ultraviolet radiation that damages the cell structure and physiological functions. The significant correlation between gene expression and flavonoid metabolism clearly reveals our genetic basis and highlights the evolutionary strategies of these ecotypes in response to environmental adversity. Specifically, the yellow-green ecotype adopts a broader ecological strategy by increasing the activities of key enzymes such as PAL (phenylalanine ammonia-lyase) and 4CL (4-coumarate: CoA ligase). PAL, as the initiating enzyme of the phenylpropanoid metabolism pathway, can convert phenylalanine into cinnamic acid, providing precursor substances for the synthesis of flavonoids; 4CL is responsible for catalyzing the formation of 4-coumaroyl CoA from 4-coumaric acid, further promoting the synthesis of flavonoid compounds. This series of processes leads to the generation of diversified flavonoid compounds, thereby more effectively coping with various environmental pressures, including oxidative damage caused by drought and common pathogen invasions, and enhancing the resilience and stability of the ecosystem. In contrast, the gray-green ecotype shows a precise adaptation strategy, focusing on synthesizing potent antioxidants such as nasturtium and kaempferol to deal with high oxidative pressure environments caused by extremely high temperatures and intense ultraviolet radiation. The current findings are promising and have paved the way for innovations in agricultural breeding and ecological management. However, a cautious approach is necessary, as these preliminary results require validation through subsequent experiments. Future research will focus on confirming the adaptability traits of different ecotypes across varied environments, thereby solidifying their role in ecological studies. These insights have potential applications in cultivating stress-resistant ecotypes and refining agricultural practices, such as enhancing the cultivation of drought-resistant ecotypes in arid regions to boost both yield and quality.
Supplementary Materials
The following supporting information can be downloaded at: https://www.mdpi.com/article/10.3390/agronomy14081839/s1. Table S1. Total primers of qRT-PCR used for validation of expression trend in Leymus chinensis. Table S2. Overview of sequencing data of transcriptome in Leymus chinensis. Table S3. Quality and length distribution of unigene in Leymus chinensis. Figure S1. Total ion flow diagram of mixed samples analyzed by mass spectrometry. Note: Abscissa is the retention time of metabolite detection (retention time, Rt), and the ordinate is the ion current intensity of ion detection (cps, count per second). Figure S2. Multi-peak map of MRM metabolite detection. Note: Abscissa is the retention time of metabolite detection (retention time, Rt), and the ordinate is the ion current intensity of ion detection (unit of intensity is cps, count per second). Each different color of the mass spectrum peak represents a detected metabolite. Figure S3. TIC overlap map of QC samples detected by mass spectrometry. Note: Abscissa is the retention time of metabolite detection (retention time, Rt), and the ordinate is the ion current intensity of ion detection (unit of intensity is cps, count per second). Figure S4. Number of unigenes and sizes of all unigenes. Figure S5. Number and sizes of coding sequences. Figure S6. Correlation analysis between transcriptome data and real-time PCR data of two ecotypes of Leymus chinensis.
Author Contributions
Conceptualization, H.W., G.N. and C.H.; software, N.I.E.; investigation, H.W.; methodology, H.W. and L.Z.; writing—original draft preparation, H.W.; writing—review and editing, L.Z. All authors have read and agreed to the published version of the manuscript.
Funding
This study was supported by the National Natural Science Foundation of China (grant 32060400 to L.Z.).
Data Availability Statement
The original contributions presented in the study are included in the article/Supplementary Materials, further inquiries can be directed to the corresponding author/s.
Conflicts of Interest
The authors declare no conflicts of interest.
References
- Li, X.; Jia, J.; Zhao, P.; Guo, X.; Chen, S.; Qi, D.; Cheng, L.; Liu, G. LcMYB4, an unknown function transcription factor gene from sheepgrass, as a positive regulator of chilling and freezing tolerance in transgenic Arabidopsis. BMC Plant Biol. 2020, 20, 238. [Google Scholar] [CrossRef] [PubMed]
- Meng, B.; Shi, B.; Zhong, S.; Chai, H.; Li, S.; Wang, Y.; Henry, H.A.L.; Ma, J.-Y.; Sun, W. Drought sensitivity of aboveground productivity in Leymus chinensis meadow steppe depends on drought timing. Oecologia 2019, 191, 685–696. [Google Scholar] [CrossRef] [PubMed]
- Yan, G.; Shi, Y.; Mu, C.; Wang, J. Differences in Organic Solute and Metabolites of Leymus chinensis in Response to Different Intensities of Salt and Alkali Stress. Plants 2023, 12, 1916. [Google Scholar] [CrossRef] [PubMed]
- Liu, X.; Yu, Y.; Liu, Q.; Deng, S.; Jin, X.; Yin, Y.; Guo, J.; Li, N.; Liu, Y.; Han, S.; et al. A Na2CO3-Responsive Chitinase Gene From Leymus chinensis Improve Pathogen Resistance and Saline-Alkali Stress Tolerance in Transgenic Tobacco and Maize. Front. Plant Sci. 2020, 11, 504. [Google Scholar] [CrossRef] [PubMed]
- Shen, N.; Wang, T.; Gan, Q.; Liu, S.; Wang, L.; Jin, B. Plant flavonoids: Classification, distribution, biosynthesis, and antioxidant activity. Food Chem. 2022, 383, 132531. [Google Scholar] [CrossRef]
- Bhakta, S.; Negi, S.; Tak, H.; Singh, S.; Ganapathi, T.R. MusaATAF2-like protein regulates shoot development and multiplication by inducing cytokinin hypersensitivity and flavonoid accumulation in banana plants. Plant Cell Rep. 2022, 41, 1197–1208. [Google Scholar] [CrossRef]
- Chen, X.-L.; Sun, M.-C.; Chong, S.-L.; Si, J.-P.; Wu, L.-S. Transcriptomic and Metabolomic Approaches Deepen Our Knowledge of Plant–Endophyte Interactions. Front. Plant Sci. 2022, 12, 700200. [Google Scholar] [CrossRef] [PubMed]
- Bag, S.; Mondal, A.; Majumder, A.; Mondal, S.K.; Banik, A. Flavonoid mediated selective cross-talk between plants and beneficial soil microbiome. Phytochem. Rev. 2022, 21, 1739–1760. [Google Scholar] [CrossRef]
- George, V.C.; Dellaire, G.; Rupasinghe, H.V. Plant flavonoids in cancer chemoprevention: Role in genome stability. J. Nutr. Biochem. 2017, 45, 1–14. [Google Scholar] [CrossRef]
- Jiang, N.; Doseff, A.I.; Grotewold, E. Flavones: From Biosynthesis to Health Benefits. Plants 2016, 5, 27. [Google Scholar] [CrossRef]
- Nabavi, S.M.; Šamec, D.; Tomczyk, M.; Milella, L.; Russo, D.; Habtemariam, S.; Suntar, I.; Rastrelli, L.; Daglia, M.; Xiao, J.; et al. Flavonoid biosynthetic pathways in plants: Versatile targets for metabolic engineering. Biotechnol. Adv. 2020, 38, 107316. [Google Scholar] [CrossRef] [PubMed]
- Tuenter, E.; Creylman, J.; Verheyen, G.; Pieters, L.; Van Miert, S. Development of a classification model for the antigenotoxic activity of flavonoids. Bioorganic Chem. 2020, 98, 103705. [Google Scholar] [CrossRef]
- Arikan, B.; Yildiztugay, E.; Ozfidan-Konakci, C. Protective role of quercetin and kaempferol against oxidative damage and photosynthesis inhibition in wheat chloroplasts under arsenic stress. Physiol. Plant. 2023, 175, e13964. [Google Scholar] [CrossRef] [PubMed]
- Ouyang, Y.; Li, J.; Chen, X.; Fu, X.; Sun, S.; Wu, Q. Chalcone Derivatives: Role in Anticancer Therapy. Biomolecules 2021, 11, 894. [Google Scholar] [CrossRef]
- Wang, Y.; Pan, G.; Huang, T.; Zhang, T.; Lin, J.; Song, L.; Zhou, G.; Ma, X.; Ge, Y.; Xu, Y.; et al. Exogenous tannic acid relieves imidacloprid-induced oxidative stress in tea tree by activating antioxidant responses and the flavonoid biosynthetic pathway. Ecotoxicol. Environ. Saf. 2023, 266, 115557. [Google Scholar] [CrossRef]
- Ksila, M.; Ghzaiel, I.; Pires, V.; Ghrairi, T.; Masmoudi-Kouki, O.; Latruffe, N.; Vervandier-Fasseur, D.; Vejux, A.; Lizard, G. Characterization of Cell Death Induced by Imine Analogs of Trans-Resveratrol: Induction of Mitochondrial Dysfunction and Overproduction of Reactive Oxygen Species Leading to, or Not, Apoptosis without the Increase in the S-Phase of the Cell Cycle. Molecules 2023, 28, 3178. [Google Scholar] [CrossRef]
- Hao, Q.; Henning, S.M.; Magyar, C.E.; Said, J.; Zhong, J.; Rettig, M.B.; Vadgama, J.V.; Wang, P. Enhanced Chemoprevention of Prostate Cancer by Combining Arctigenin with Green Tea and Quercetin in Prostate-Specific Phosphatase and Tensin Homolog Knockout Mice. Biomolecules 2024, 14, 105. [Google Scholar] [CrossRef] [PubMed]
- Díaz, L.; Del Río, J.A.; Pérez-Gilabert, M.; Ortuño, A. Involvement of an extracellular fungus laccase in the flavonoid metabolism in Citrus fruits inoculated with Alternaria alternata. Plant Physiol. Biochem. 2015, 89, 11–17. [Google Scholar] [CrossRef] [PubMed]
- Fontana, R.; Caproni, A.; Sicurella, M.; Manfredini, S.; Baldisserotto, A.; Marconi, P. Effects of Flavonoids and Phenols from Moringa oleifera Leaf Extracts on Biofilm Processes in Xanthomonas campestris pv. campestris. Plants 2023, 12, 1508. [Google Scholar] [CrossRef]
- Chen, Y.; Li, W.; Jia, K.; Liao, K.; Liu, L.; Fan, G.; Zhang, S.; Wang, Y. Metabolomic and transcriptomice analyses of flavonoid biosynthesis in apricot fruits. Front. Plant Sci. 2023, 14, 1210309. [Google Scholar] [CrossRef]
- Mahmoud, A.M.; Bautista, R.J.H.; Sandhu, M.A.; Hussein, O.E. Beneficial Effects of Citrus Flavonoids on Cardiovascular and Metabolic Health. Oxidative Med. Cell. Longev. 2019, 2019, 5484138. [Google Scholar] [CrossRef] [PubMed]
- Xu, M.; Ran, L.; Chen, N.; Fan, X.; Ren, D.; Yi, L. Polarity-dependent extraction of flavonoids from citrus peel waste using a tailor-made deep eutectic solvent. Food Chem. 2019, 297, 124970. [Google Scholar] [CrossRef]
- Yi, L.; Ma, S.; Ren, D. Phytochemistry and bioactivity of Citrus flavonoids: A focus on antioxidant, anti-inflammatory, anticancer and cardiovascular protection activities. Phytochem. Rev. 2017, 16, 479–511. [Google Scholar] [CrossRef]
- Zhang, K.; Qin, Y.; Sun, W.; Shi, H.; Zhao, S.; He, L.; Li, C.; Zhao, J.; Pan, J.; Wang, G.; et al. Phylogenomic Analysis of Cytochrome P450 Gene Superfamily and Their Association with Flavonoids Biosynthesis in Peanut (Arachis hypogaea L.). Genes 2023, 14, 1944. [Google Scholar] [CrossRef]
- Martinez-Alonso, A.; Yepes-Molina, L.; Guarnizo, A.L.; Carvajal, M. Modification of Gene Expression of Tomato Plants through Foliar Flavonoid Application in Relation to Enhanced Growth. Genes 2023, 14, 2208. [Google Scholar] [CrossRef] [PubMed]
- Chen, M.; Zhai, J.; Zhang, J.; Li, H.; Niu, X.; Liu, Y.; Ren, Y.; Du, H.; Zhu, J. Transcriptomic and Physiological Analyses of Pigment Accumulation in Eucommia ulmoides ‘Hongye’. Phyton 2022, 91, 1027–1044. [Google Scholar] [CrossRef]
- Datir, S.; Regan, S. Advances in Physiological, Transcriptomic, Proteomic, Metabolomic, and Molecular Genetic Approaches for Enhancing Mango Fruit Quality. J. Agric. Food Chem. 2023, 71, 20–34. [Google Scholar] [CrossRef] [PubMed]
- Yu, D.; Zhang, K.; Wu, J.; Li, X.; Zhou, G.; Wan, Y. Integrated metabolomic and transcriptomic analysis revealed the flavonoid biosynthesis and regulation in Areca catechu. Phytochem. Anal. 2023, 34, 372–380. [Google Scholar] [CrossRef] [PubMed]
- Yu, C.; Liu, G.; Qin, J.; Wan, X.; Guo, A.; Wei, H.; Chen, Y.; Lian, B.; Zhong, F.; Zhang, J. Genomic and transcriptomic studies on flavonoid biosynthesis in Lagerstroemia indica. BMC Plant Biol. 2024, 24, 171. [Google Scholar] [CrossRef]
- Rajendran, N.; Subramaniam, S.; Christena, L.R.; Muthuraman, M.S.; Subramanian, N.S.; Pemiah, B.; Sivasubramanian, A. Antimicrobial flavonoids isolated from Indian medicinal plant Scutellaria oblonga inhibit biofilms formed by common food pathogens. Nat. Prod. Res. 2016, 30, 2002–2006. [Google Scholar] [CrossRef]
- Pei, T.; Yan, M.; Huang, Y.; Wei, Y.; Martin, C.; Zhao, Q. Specific Flavonoids and Their Biosynthetic Pathway in Scutellaria baicalensis. Front. Plant Sci. 2022, 13, 866282. [Google Scholar] [CrossRef]
- Patni, B.; Bhattacharyya, M.; Pokhriyal, A. The role of signaling compounds in enhancing rice allelochemicals for sustainable agriculture: An overview. Planta 2023, 258, 90. [Google Scholar] [CrossRef] [PubMed]
- Pimentel, D.; Amaro, R.; Erban, A.; Mauri, N.; Soares, F.; Rego, C.; Martínez-Zapater, J.M.; Mithöfer, A.; Kopka, J.; Fortes, A.M. Transcriptional, hormonal, and metabolic changes in susceptible grape berries under powdery mildew infection. J. Exp. Bot. 2021, 72, 6544–6569. [Google Scholar] [CrossRef] [PubMed]
- Qin, Y.; Liu, X.; Li, C.; Chu, Q.; Cheng, S.; Su, L.; Shao, D.; Guo, X.; He, Z.; Zhou, X. Effect of light intensity on celery growth and flavonoid synthesis. Front. Plant Sci. 2024, 14, 1326218. [Google Scholar] [CrossRef] [PubMed]
- Sahoo, D.K.; Heilmann, R.M.; Paital, B.; Patel, A.; Yadav, V.K.; Wong, D.; Jergens, A.E. Oxidative stress, hormones, and effects of natural antioxidants on intestinal inflammation in inflammatory bowel disease. Front. Endocrinol. 2023, 14, 1217165. [Google Scholar] [CrossRef]
- Winkel-Shirley, B. Biosynthesis of flavonoids and effects of stress. Curr. Opin. Plant Biol. 2002, 5, 218–223. [Google Scholar] [CrossRef]
- Wang, X.; Chai, X.; Gao, B.; Deng, C.; Günther, C.S.; Wu, T.; Zhang, X.; Xu, X.; Han, Z.; Wang, Y. Multi-omics analysis reveals the mechanism of bHLH130 responding to low-nitrogen stress of apple rootstock. Plant Physiol. 2023, 191, 1305–1323. [Google Scholar] [CrossRef]
- Zhao, Q.; Zeng, D.; Luo, Z.; Chen, A.; Xu, G.; Li, Y. Flavonoids Mediate the Modulation of Phosphate Uptake and Phosphate-Starvation Signaling in Tobacco. J. Plant Growth Regul. 2023, 42, 7229–7239. [Google Scholar] [CrossRef]
- Ma, R.; Sun, X.; Yang, C.; Fan, Y. Integrated transcriptome and metabolome provide insight into flavonoid variation in goji berries (Lycium barbarum L.) from different areas in China. Plant Physiol. Biochem. 2023, 199, 107722. [Google Scholar] [CrossRef]
- Khan, M.K.; Pandey, A.; Hamurcu, M.; Rajpal, V.R.; Vyhnanek, T.; Topal, A.; Raina, S.N.; Gezgin, S. Insight into the Boron Toxicity Stress-Responsive Genes in Boron-Tolerant Triticum dicoccum Shoots Using RNA Sequencing. Agronomy 2023, 13, 631. [Google Scholar] [CrossRef]
- Zhang, Z.; Zhong, L.; Xiao, W.; Du, Y.; Han, G.; Yan, Z.; He, D.; Zheng, C. Transcriptomics combined with physiological analysis reveals the mechanism of cadmium uptake and tolerance in Ligusticum chuanxiong Hort. under cadmium treatment. Front. Plant Sci. 2023, 14, 1263981. [Google Scholar] [CrossRef]
- Pandey, A.; Khan, M.K.; Hamurcu, M.; Brestic, M.; Topal, A.; Gezgin, S. Insight into the Root Transcriptome of a Boron-Tolerant Triticum zhukovskyi Genotype Grown under Boron Toxicity. Agronomy 2022, 12, 2421. [Google Scholar] [CrossRef]
- Kvastad, L.; Carlberg, K.; Larsson, L.; Villacampa, E.G.; Stuckey, A.; Stenbeck, L.; Mollbrink, A.; Zamboni, M.; Magnusson, J.P.; Basmaci, E.; et al. The spatial RNA integrity number assay for in situ evaluation of transcriptome quality. Commun. Biol. 2021, 4, 57. [Google Scholar] [CrossRef]
- Grabherr, M.G.; Haas, B.J.; Yassour, M.; Levin, J.Z.; Thompson, D.A.; Amit, I.; Adiconis, X.; Fan, L.; Raychowdhury, R.; Zeng, Q.D.; et al. Full-length transcriptome assembly from RNA-Seq data without a reference genome. Nat. Biotechnol. 2011, 29, 644–652. [Google Scholar] [CrossRef]
- Finn, R.D.; Coggill, P.; Eberhardt, R.Y.; Eddy, S.R.; Mistry, J.; Mitchell, A.L.; Potter, S.C.; Punta, M.; Qureshi, M.; Sangrador-Vegas, A.; et al. The Pfam protein families database: Towards a more sustainable future. Nucleic Acids Res. 2016, 44, D279–D285. [Google Scholar] [CrossRef] [PubMed]
- Götz, S.; Garcia-Gomez, J.M.; Terol, J.; Williams, T.D.; Nagaraj, S.H.; Nueda, M.J.; Robles, M.; Talón, M.; Dopazo, J.; Conesa, A. High-throughput functional annotation and data mining with the Blast2GO suite. Nucleic Acids Res. 2008, 36, 3420–3435. [Google Scholar] [CrossRef]
- Love, M.I.; Huber, W.; Anders, S. Moderated estimation of fold change and dispersion for RNA-seq data with DESeq2. Genome Biol. 2014, 15, 550. [Google Scholar] [CrossRef] [PubMed]
- Robinson, M.D.; McCarthy, D.J.; Smyth, G.K. EdgeR: A Bioconductor package for differential expression analysis of digital gene expression data. Bioinformatics 2010, 26, 139–140. [Google Scholar] [CrossRef]
- Mao, X.; Cai, T.; Olyarchuk, J.G.; Wei, L. Automated genome annotation and pathway identification using the KEGG Orthology (KO) as a controlled vocabulary. Bioinformatics 2005, 21, 3787–3793. [Google Scholar] [CrossRef]
- Xie, C.; Mao, X.; Huang, J.; Ding, Y.; Wu, J.; Dong, S.; Kong, L.; Gao, G.; Li, C.-Y.; Wei, L. KOBAS 2.0: A web server for annotation and identification of enriched pathways and diseases. Nucleic Acids Res. 2011, 39, W316–W322. [Google Scholar] [CrossRef]
- Zhang, C.; Zhao, Y.; Tao, H.; Li, L.; He, Y.; Zhang, X.; Zhu, Y.; Hong, G. Analysis of the Flavonoidome Reveals the Different Health-Promoting Flavonoid Characteristics in Fruit. Antioxidants 2023, 12, 1665. [Google Scholar] [CrossRef]
- Huang, J.; Wang, L.; Tang, B.; Ren, R.; Shi, T.; Zhu, L.; Deng, J.; Liang, C.; Wang, Y.; Chen, Q. Integrated Transcriptomics and Widely Targeted Metabolomics Analyses Provide Insights Into Flavonoid Biosynthesis in the Rhizomes of Golden Buckwheat (Fagopyrum cymosum). Front. Plant Sci. 2022, 13, 803472. [Google Scholar] [CrossRef]
- Remali, J.; Sahidin, I.; Aizat, W.M. Xanthone Biosynthetic Pathway in Plants: A Review. Front. Plant Sci. 2022, 13, 809497. [Google Scholar] [CrossRef]
- Peniche-Pavía, H.A.; Guzmán, T.J.; Magaña-Cerino, J.M.; Gurrola-Díaz, C.M.; Tiessen, A. Maize Flavonoid Biosynthesis, Regulation, and Human Health Relevance: A Review. Molecules 2022, 27, 5166. [Google Scholar] [CrossRef] [PubMed]
- Huang, J.; Gu, M.; Lai, Z.; Fan, B.; Shi, K.; Zhou, Y.H.; Yu, J.Q.; Chen, Z. Functional analysis of the Arabidopsis PAL gene family in plant growth, development, and response to environmental stress. Plant Physiol. 2010, 153, 1526–1538. [Google Scholar] [CrossRef] [PubMed]
- Wang, T.; Gu, X.; Guo, L.; Zhang, X.; Li, C. Integrated metabolomics and transcriptomics analysis reveals γ-aminobutyric acid enhances the ozone tolerance of wheat by accumulation of flavonoids. J. Hazard. Mater. 2024, 465, 133202. [Google Scholar] [CrossRef] [PubMed]
- Gouot, J.C.; Smith, J.P.; Holzapfel, B.P.; Walker, A.R.; Barril, C. Grape berry flavonoids: A review of their biochemical responses to high and extreme high temperatures. J. Exp. Bot. 2019, 70, 397–423. [Google Scholar] [CrossRef]
- Pandith, S.A.; Ramazan, S.; Khan, M.I.; Reshi, Z.A.; Shah, M.A. Chalcone synthases (CHSs): The symbolic type III polyketide synthases. Planta 2019, 251, 15. [Google Scholar] [CrossRef]
- Jia, Y.; Li, B.; Zhang, Y.; Zhang, X.; Xu, Y.; Li, C. Evolutionary dynamic analyses on monocot flavonoid 3′-hydroxylase gene family reveal evidence of plant-environment interaction. BMC Plant Biol. 2019, 19, 347. [Google Scholar] [CrossRef]
- Wu, J.; Lv, S.; Zhao, L.; Gao, T.; Yu, C.; Hu, J.; Ma, F. Advances in the study of the function and mechanism of the action of flavonoids in plants under environmental stresses. Planta 2023, 257, 108. [Google Scholar] [CrossRef]

Disclaimer/Publisher’s Note: The statements, opinions and data contained in all publications are solely those of the individual author(s) and contributor(s) and not of MDPI and/or the editor(s). MDPI and/or the editor(s) disclaim responsibility for any injury to people or property resulting from any ideas, methods, instructions or products referred to in the content. |
© 2024 by the authors. Licensee MDPI, Basel, Switzerland. This article is an open access article distributed under the terms and conditions of the Creative Commons Attribution (CC BY) license (https://creativecommons.org/licenses/by/4.0/).