Article

Genome-Wide Association Study of Yield-Related Traits in a Nested Association Mapping Population Grown in Kazakhstan

1
Institute of Plant Biology and Biotechnology, Almaty 050040, Kazakhstan
2
John Innes Centre, Norwich NR4 7UH, UK
3
Faculty of Biology and Biotechnology, Al-Farabi Kazakh National University, Almaty 050040, Kazakhstan
*
Author to whom correspondence should be addressed.
Agronomy 2024, 14(8), 1848; https://doi.org/10.3390/agronomy14081848 (registering DOI)
Submission received: 17 July 2024 / Revised: 11 August 2024 / Accepted: 19 August 2024 / Published: 21 August 2024
(This article belongs to the Special Issue Marker Assisted Selection and Molecular Breeding in Major Crops)

Abstract

:
This study evaluated 290 recombinant inbred lines (RILs) from the Nested Association Mapping (NAM) population in the UK, consisting of 24 hybrid families. All genotypes were grown in Southeastern Kazakhstan (Kazakh Research Institute of Agriculture and Plant Growing, Almaty region, 2021–2022) and Northern Kazakhstan (Alexandr Barayev Scientific-Production Center for Grain Farming, Akmola region, 2020). The studied traits included six yield-related characteristics: spike length (SL, cm), number of productive spikes per plant (NPS, pcs), number of kernels per spike (NKS, pcs), weight of kernels per spike (WKS, g), thousand kernel weight (TKW, g), and yield per square meter (YM2, g/m2). The significant phenotypic variability among genotypes was observed, which was suitable for the genome-wide association study of yield-related traits. Pearson’s index showed positive correlations among most yield-related traits, although a negative correlation was found between NKS and TKW in southeastern regions, and no correlation was recorded for northern regions. Top-performing RILs, surpassing local checks, were identified for NKS, TKW, and YM2, suggesting their potential for breeding programs. The application of GWAS allowed the identification of 72 quantitative trait loci (QTLs), including 36 QTLs in the southeastern region, 16 QTLs in the northern region, and 19 in both locations. Eleven QTLs matched those reported in previous QTL mapping studies and GWAS for studied traits. The results can be used for further studies related to the adaptation and productivity of wheat in breeding projects for higher grain productivity.

1. Introduction

Common wheat is the world’s third-most-important cereal after maize and rice. For the 2023/2024 growing season, the global production volume of wheat amounted to almost 785 million tons [1]. As the global population continues to rise, reaching an estimated 9.7 billion by 2050, the demand for cereals such as wheat is set to increase significantly [2]. Wheat is vital in providing essential nutrients and calories to billions of people worldwide [3]. However, to ensure food security and meet this burgeoning demand, wheat yields must be increased by 60% over current levels [4].
Wheat production in Kazakhstan fundamentally contributes to food security in Central Asia and beyond. In Kazakhstan, about 80% of the area under crops is occupied by wheat [5]. The country’s research institutes are breeding new varieties with high yields, resistance to diseases and pests, and good baking qualities [6]. The main export destinations are the countries of Central Asia, the Middle East, and the Caucasus. The key importing countries are Uzbekistan, Afghanistan, Azerbaijan, Tajikistan, Turkmenistan, Georgia, Iran, Turkey, and China [7]. In three growing regions of Kazakhstan (Akmola, Kostanay, and North Kazakhstan), almost 70–80% of all grain in the country is produced [8,9]. In the north of the country, spring wheat crops predominate, while in the south, winter wheat is more common [10,11]. These regions are dominated by chernozem and chestnut soils, which are optimal for growing bread wheat [12,13].
The grain yield of a crop is influenced by various yield components that develop during different growth stages. These components are directly affected by the environmental conditions experienced by the plant at each phase [14]. The overall yield of a particular cultivar depends on how its genotype interacts with and responds to these environmental factors [15]. Therefore, when selecting a genotype for a specific environment, it is crucial to evaluate how the yield component formation can be under different environmental conditions [16]. This ensures the chosen genotype can maximize its yield potential in varying environmental contexts [17]. Wheat yield components are the individual factors that contribute to the overall kernel yield of the crop. Breeding programs target these to improve yield using investigative yield-related traits. One critical yield component is the number of productive spikes per plant, which depends on tillering capacity and growing conditions [18]. Other key traits include the number of spikelets and kernels per spike (NKS), which are affected by pollination efficiency and floret fertility [19,20]. Kernel weight, measured as thousand-kernel weight (TKW), varies due to genetic and environmental factors and is crucial for yield [21,22,23]. Kernel filling duration and rate, influenced by photosynthetic activity, nutrients, and water availability, also significantly determine final kernel weight [15,24]. Different types of DNA markers are used extensively in mapping and breeding programs to identify and associate specific genomic regions to agronomic traits. Previously, several simple sequence repeat (SSR) markers were found to be associated with key agronomic traits, including Xgwm312 and Xgwm372, associated with QTLs affecting grain yield and traits, like spike length and the number of grains per spike [25,26]. The other examples are Xgwm124 and wmc388, which were found to be linked to QTLs for kernel weight and yield [27,28]. However, a complex interplay of genetic factors (e.g., multiple genes and gene interactions) and environmental factors (e.g., climate and soil conditions) [29,30] makes predicting and enhancing traits challenging, requiring a detailed understanding of both the genetic architecture and the environmental context [31]. To address these challenges, genome-wide association studies (GWAS) have revolutionized the field of plant genetics by enabling the identification of genetic variants associated with complex traits across diverse populations in various environments [32].
Although GWAS effectively identifies marker-trait associations (MTA), studies from different global regions show that growth environments strongly influence yield QTL identification, with significant genotype x environment interaction (GEI). For instance, GWAS studies in Europe [33], India [34], and Mexico [35] revealed varied yield QTL in different genome parts. This trend also appeared when testing the same germplasm in various Asian regions [36], consistent with findings by Quarrie et al. (2005) using bi-parental mapping populations [37]. These outcomes highlight the importance of environmental factors during crucial growth phases affecting kernel number per spike. Consequently, regional project success may depend on localized GWAS using regionally adapted germplasm [38].
Unlike traditional quantitative trait locus (QTL) mapping approaches, which rely on linkage analysis in bi-parental populations, GWAS leverages natural genetic diversity present in large, diverse populations to identify associations between genetic markers and phenotypic traits [35]. This approach offers higher mapping resolution and the ability to detect common and rare alleles contributing to trait variation [39].
Nested Association Mapping (NAM) populations are one of the promising genetic resources for dissecting plant complex traits. Originating from a diverse set of founder lines crossed with a common parental line, NAM populations generate a panel of recombinant inbred lines (RILs) that capture a broad spectrum of genetic diversity [40,41]. This design allows for the precise localization of genetic loci associated with traits of interest, combining the advantages of linkage mapping and association mapping [40,42]. The structured diversity inherent in NAM populations enhances statistical power and facilitates the identification of genetic variants underlying complex traits like yield [43,44,45,46]. The identified QTLs can be used in breeding programs to accelerate the development of high-yielding cultivars adapted to different environmental conditions. This study aims to identify QTLs associated with main yield components using the NAM population grown in two key wheat-growing regions of Kazakhstan.

2. Materials and Methods

2.1. Plant Materials and Experimental Design

The materials of the study were 290 spring wheat recombinant inbred lines (RILs) of the nested association mapping (NAM) population, consisting of 24 hybrid families (Table S1) provided by the John Innes Centre (Norwich, UK). The spring wheat NAM panel comprises 24 accessions selected as second parental lines, which include: (1) 19 landraces sourced from the A.E. Watkins collection, (2) two lines from CIMCOG, and (3) two cultivars: Baj and Wylakatchem (Table S1) [47,48]. The 290 RILs were planted in two regions of Kazakhstan: the Almaty region, Southeast Kazakhstan (Kazakh Research Institute of Agriculture and Plant Growing, KRIAPG; 43°21′ N/76°53′ W) during the 2021–2022 years, and the Akmola region, Northern Kazakhstan (Scientific-Production Center for Grain Farming named after Alexandr Barayev, SPCGF, Shortandy, 51°40′ N/71°00′ W) in 2020. The genotypes were planted in both locations with two replications in a randomized one-meter plot. The distances between rows were 15 cm, and between plants within a row were 5 cm [49]. The climate conditions recorded during the trials are shown in Table 1.
All genotypes and two local standards (check cultivars) “Kazakhstanskaya 4” in KRIAPG and “Astana” in SPCGF were evaluated for the following six traits: spike length (SL, cm), number of productive spikes per plant (NPS, pcs), number kernel per spike (NKS, pcs), weight of kernels per spike (WKS, g), TKW (g), and yield per m2 (YM2, g/m2). After harvesting, SL, NPS, NKS, WKS, TKW, and YM2 were measured for each accession. Each one-meter plot consisted of seven rows, and three randomly selected plants per row were analyzed. In total, we studied 21 plants per each of 290 genotypes per replication. A similar approach was taken for the second replication. The mean for two replications was calculated using averages in each replication. SL was determined by measuring the spikes from the base of the first spikelet to the tip of the most terminal spikelet, excluding the awns. NPS, NKS, and WKS were measured by counting the number of productive spikes, number of kernels per main spike, and weight of kernel per spike, respectively. TKW was determined by weighing 1000 seeds for each accession.
All phenotypic data analyses of 290 RILs were conducted using the R platform version 4.3.0. The analysis of variance (ANOVA) and Pearson’s correlation analysis were performed using the Rstudio package version 2023.03.1 (POSIT, Boston, MA, USA) [50] and conducted prior to GWAS. The broad-sense heritability (H2) was calculated according to Covarrubias–Pazaran, 2019 [51]. The GGE biplot analysis was analyzed using GenStat software version 19.1 (VSN International Limited, Hemel Hempstead, UK) [52]. Correlation analyses were carried out to understand the relationships between yield components, using mean values for each genotype. By combining ANOVA and GGE analysis, we effectively quantified and visualized the contributions of genotypes (G), environments (E), and G × E interactions.

2.2. Genome-Wide Association Studies and Data Analysis

The 290 RILs of the NAM population were genotyped using the Axiom Wheat Breeder’s Genotyping Array with 35K single-nucleotide polymorphism (SNPs) [53]. The analysis excluded monomorphic markers with a minor allele frequency (MAF) of <5% and >15% missing data. In total, 10,448 polymorphic SNP markers were used in the GWAS analysis. The population structure of the NAM population was analyzed using a model-based clustering method in STRUCTURE v.2.3.4 software [54]. The number of clusters (K) ranged from 2 to 10, with 100,000 burn-in lengths and 100,000 Markov chain Monte Carlo (MCMC) iterations performed for each K value. The optimal K value was determined based on ΔK using a STRUCTURE Harvester, and the results were converted into a covariance matrix (Q) [55]. The GWAS was analyzed using a mixed linear multiple loci model (MLMM) [56] in the R package Genome Association and Prediction Integrated Tool (GAPIT) [57]. The MLMM incorporating the Kinship matrix and Q matrices was applied to identify QTLs associated with the traits studied in the two regions. GWAS was performed separately for each region and replications, including their mean values. A significance threshold of p < 1 × 10⁻³ was applied to identify significant QTLs. Corrections due to the Kinship matrix and Q matrices were confirmed by scrutinizing the distribution lines in quantile–quantile (QQ) plots. The SNP with the lowest p-value was selected when multiple significant SNPs were closely positioned. Manhattan plots and SNP density plots were generated using the rMVP package (https://cran.r-project.org/web/packages/rMVP/index.html, accessed on 30 May 2024) [58]. MapChart version 2.32 software was used to draw the genetic map [59]. For the search for protein-coding genes that overlap with identified significant SNPs, each marker’s sequence was inserted into the BLAST tool (https://plants.ensembl.org/Triticum_aestivum/Tools/Blast, accessed on 18 April 2024) of Ensembl Plants [60]. The 20 simple sequence repeat (SSR) markers associated with agronomic traits were also positioned on the map [25,26,27,28,61,62,63,64]. The genome localization of markers was established by aligning primer sequences using Ensembl Plants’ BLAST tool (https://plants.ensembl.org/Triticum_aestivum/Tools/Blast, accessed on 25 June 2024).

3. Results

3.1. Phenotypic Variation of NAM Population for Yield-Related Traits

Six yield-related traits of 290 RILs were characterized across two regions and three environments: two in the southeastern region (KRIAPG) and one in the northern region of Kazakhstan (SPCGF) (Table S1). Field data for several traits showed that in the two regions, the average values for the NAM population exceeded those of the local standard (check cultivars) “Kazakhstanskaya 4” and “Astana” (Figure 1). Comparatively, the average NKS exceeded those of the check cultivars by 3.8 pcs in the northern region and 3.92 pcs in the southeastern region. Similarly, the average SL was longer in the southeast (0.5 cm) and north (0.63 cm) than in the check cultivars (Figure 1). The assessment of the mean TKW revealed that the yield at RPCGF was 5.58 g higher than at KRIAPG. The evaluation of the mean YM2 indicated that the yield in the northern region was 160.51 g/m2 greater than in the southeastern region. At KRIAPG, 12 accessions had higher values than the local standard “Kazakhstanskaya 4”; at SPCGF, 147 accessions exceeded the local standard “Astana” (Table S1).
The correlation analysis showed that yield-related traits are generally positively correlated in both regions, although the strength of these correlations varied (Figure 2). WKS was positively correlated with NKS, TKW, and YM2 in both regions. Additionally, NKS was positively correlated with WKS and YM2. However, a negative correlation between NKS and TKW was noted under conditions at KRIAPG and no correlation at SPCGF (Figure 2A). Furthermore, a negative correlation between SL and YM2 and between NPS and TKW was observed in KRIAPG. At the same time, a negative correlation was observed between SL and NPS under conditions at SPCGF (Figure 2B).
Variance analysis was conducted on yield-related traits in the two regions, suggesting a highly significant (p < 0.001) difference between G and E and the interaction of G × E on yield components (Table 2). Broad-sense heritability (hb2) was calculated for all studied traits, indicating that the highest heritability was detected for TKW (37.8%), while the lowest was for NKS (11.8%) (Table 2).

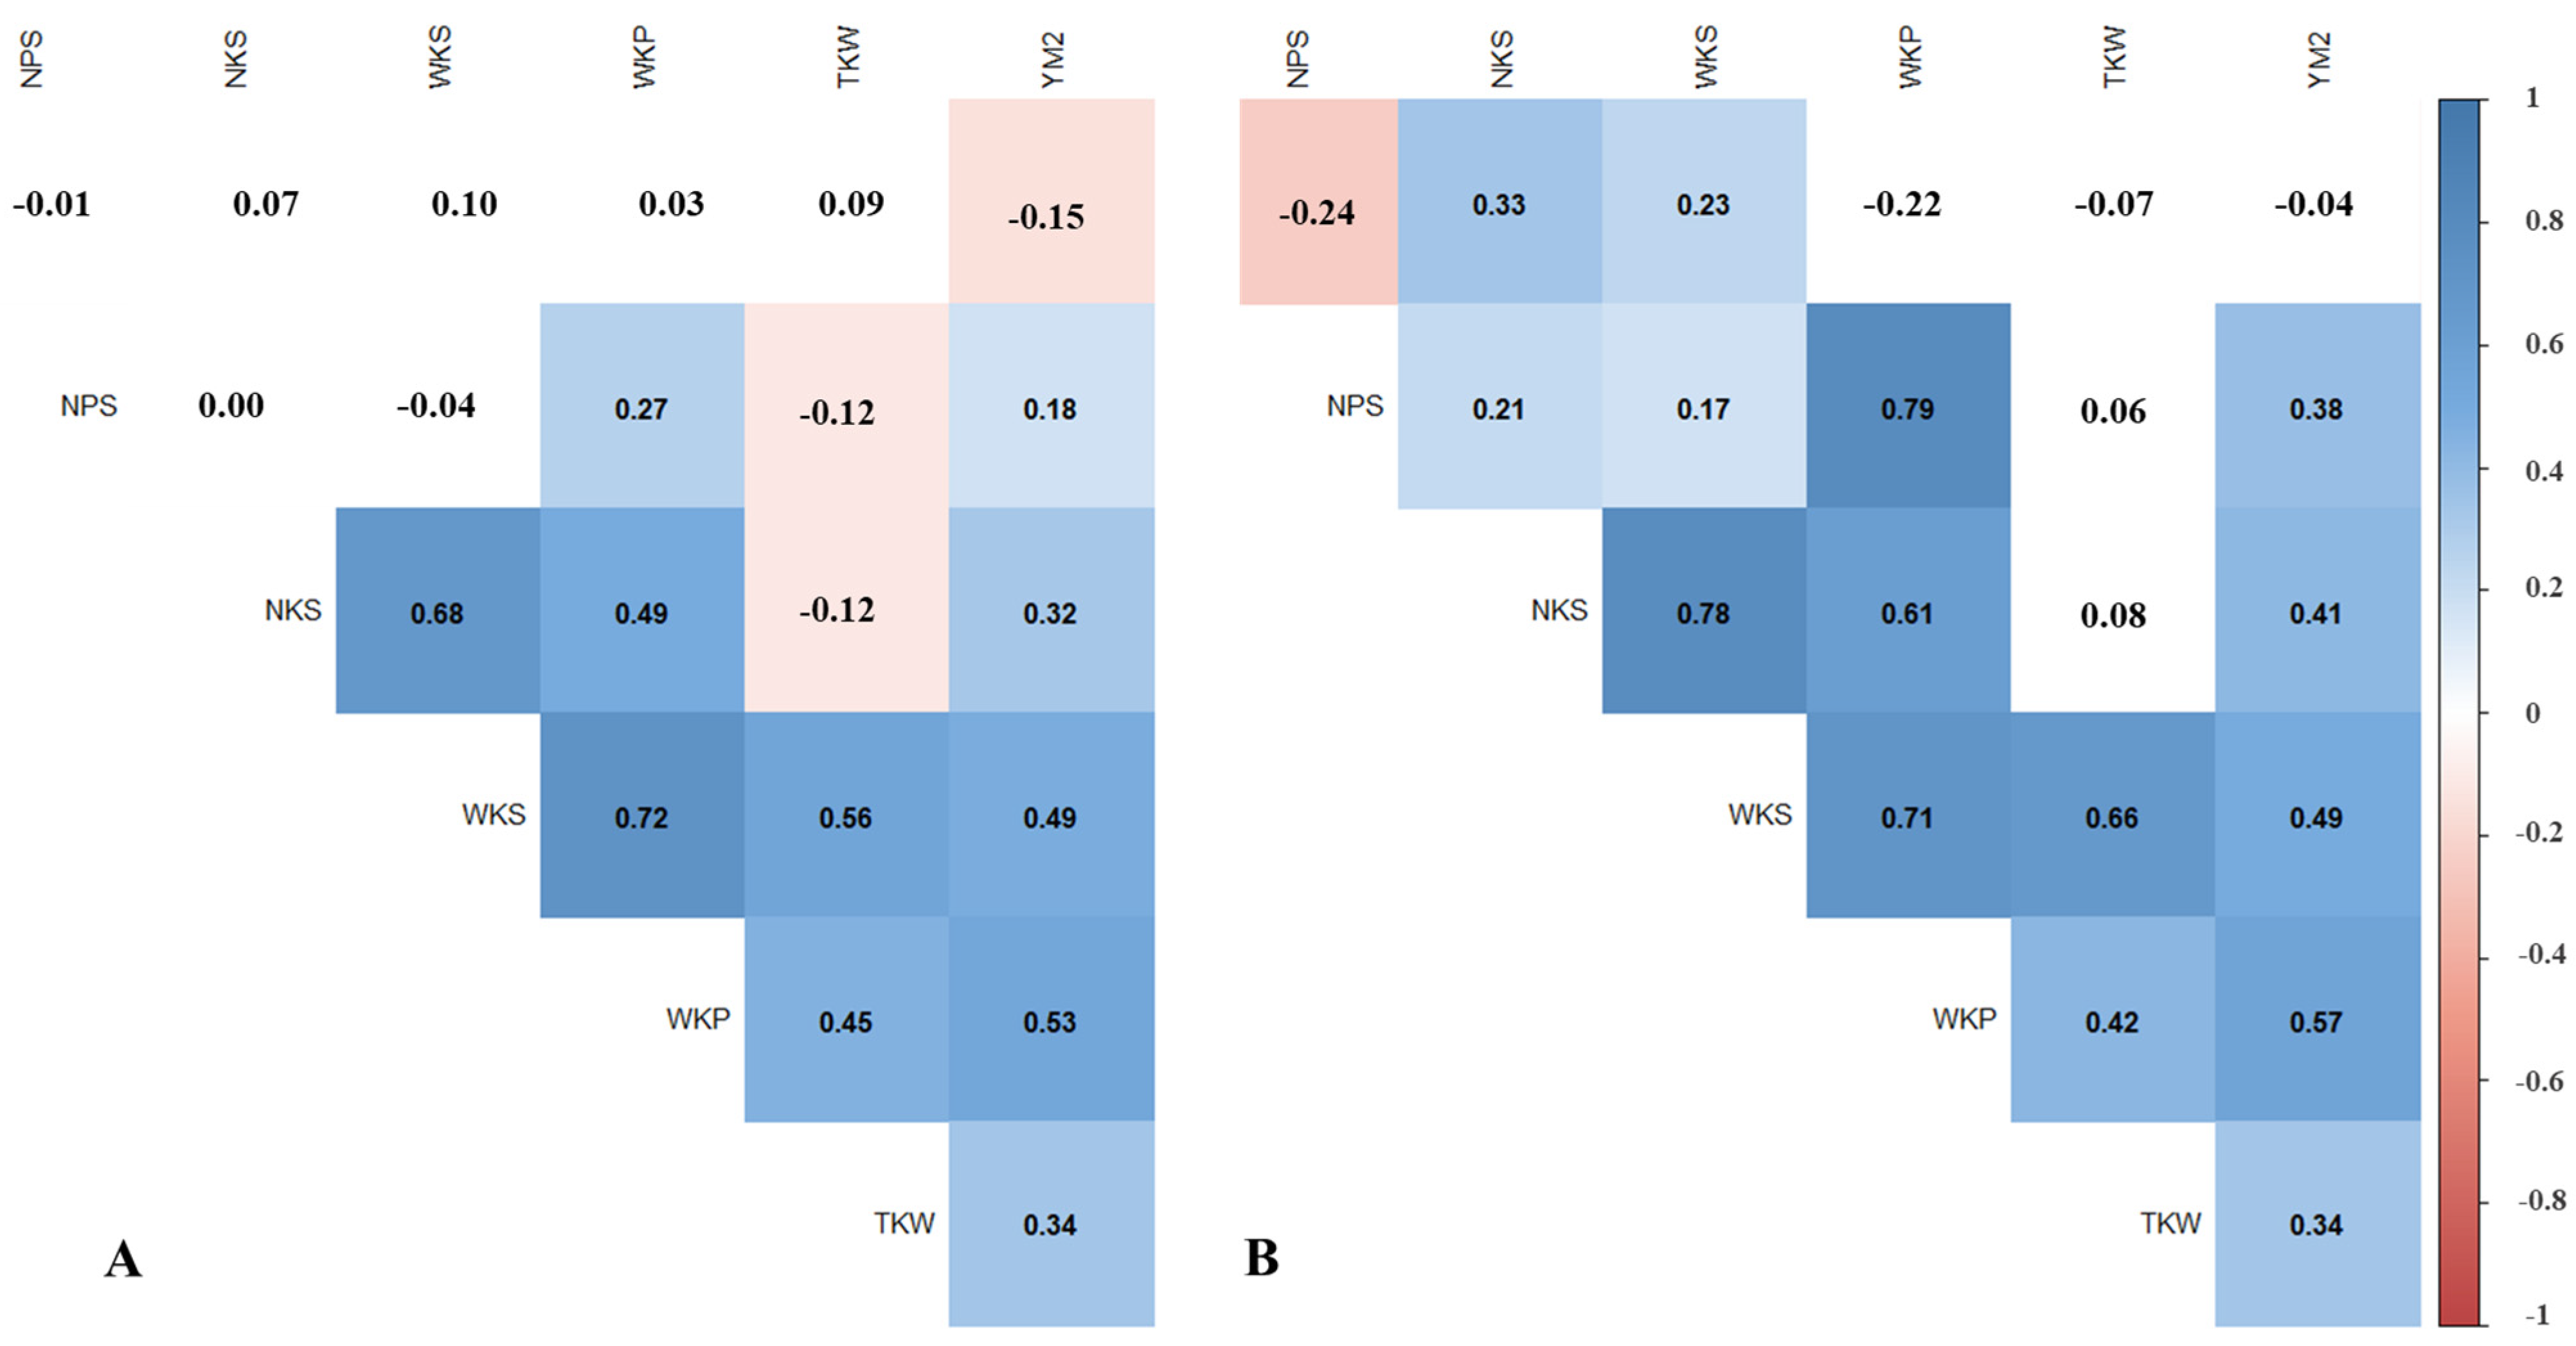
3.2. Assessment of GGE the NAM Population in the Two Studied Regions

The analysis of 290 RILs in the NAM population using GGE biplots provides key insights into genotype-environment interactions for yield-related traits. The GGE biplot for NKS, explaining 78.25% of the variation through PC1 (47.85%) and PC2 (30.40%), identifies several genotypes, such as NAM-011, NAM-065, and NAM-115, with environment-specific solid interactions under conditions at RPCGF in 2020 (Figure 3A). The three studied environments in the GGE biplot were divided into two mega-environments. The GGE biplot for TKW, explaining 82.50% of the variation through PC1 (64.02%) and PC2 (18.48%), highlights several genotypes, such as NAM-002, NAM-164, NAM-220, and NAM-308, which showed environment-specific solid interactions and yield performance under conditions at KRIAPG in 2021 and 2022 (Figure 3B). The GGE biplot for YM2, explaining 78.38% of the variation through PC1 (45.44%) and PC2 (32.93%), highlights strong genotype-environment interactions, with genotypes NAM-272 and NAM-302 showing better yield performance in the two environments (Figure 3C).
Both biplots emphasize the importance of identifying genotypes that are either broadly adapted or suited explicitly to environments, aiding in breeding high-yielding, stable varieties.

3.3. NKS, TKW, and YM2 Assessment of Individual RILs in the Two Locations

The assessment of yield-related traits suggested that the NAM population performed well under the studied environmental conditions. The 12 and 147 RILs demonstrated higher YM2 in comparison to the appropriate check cultivars in KRIAPG and SPCGF, respectively (Table S1). The analysis of the average value of TKW revealed 59 and 93 RILs that exceeded the TKW of the check cultivars in SPCGF and KRIAPG, respectively (Table S1). The YM2 data in Table 3 showed that lines NAM-275 and NAM-282 could be selected for extended field trials. At the KRIAPG site, NAM-081, NAM-273, and NAM-299 showed the highest average values for NKS and YM2. At the SPCGF site, the line NAM-333 outperformed the check cultivar “Astana” in studies for NKS and YM2 (Table 3). Additionally, four RILs (NAM-197, NAM-198, NAM-205, and NAM-207) showed high values and exceeded the check cultivars for TKW in both regions.
Dedicated RILs excel in different regions, providing valuable insights for breeding programs to improve yield stability and performance in diverse environments.

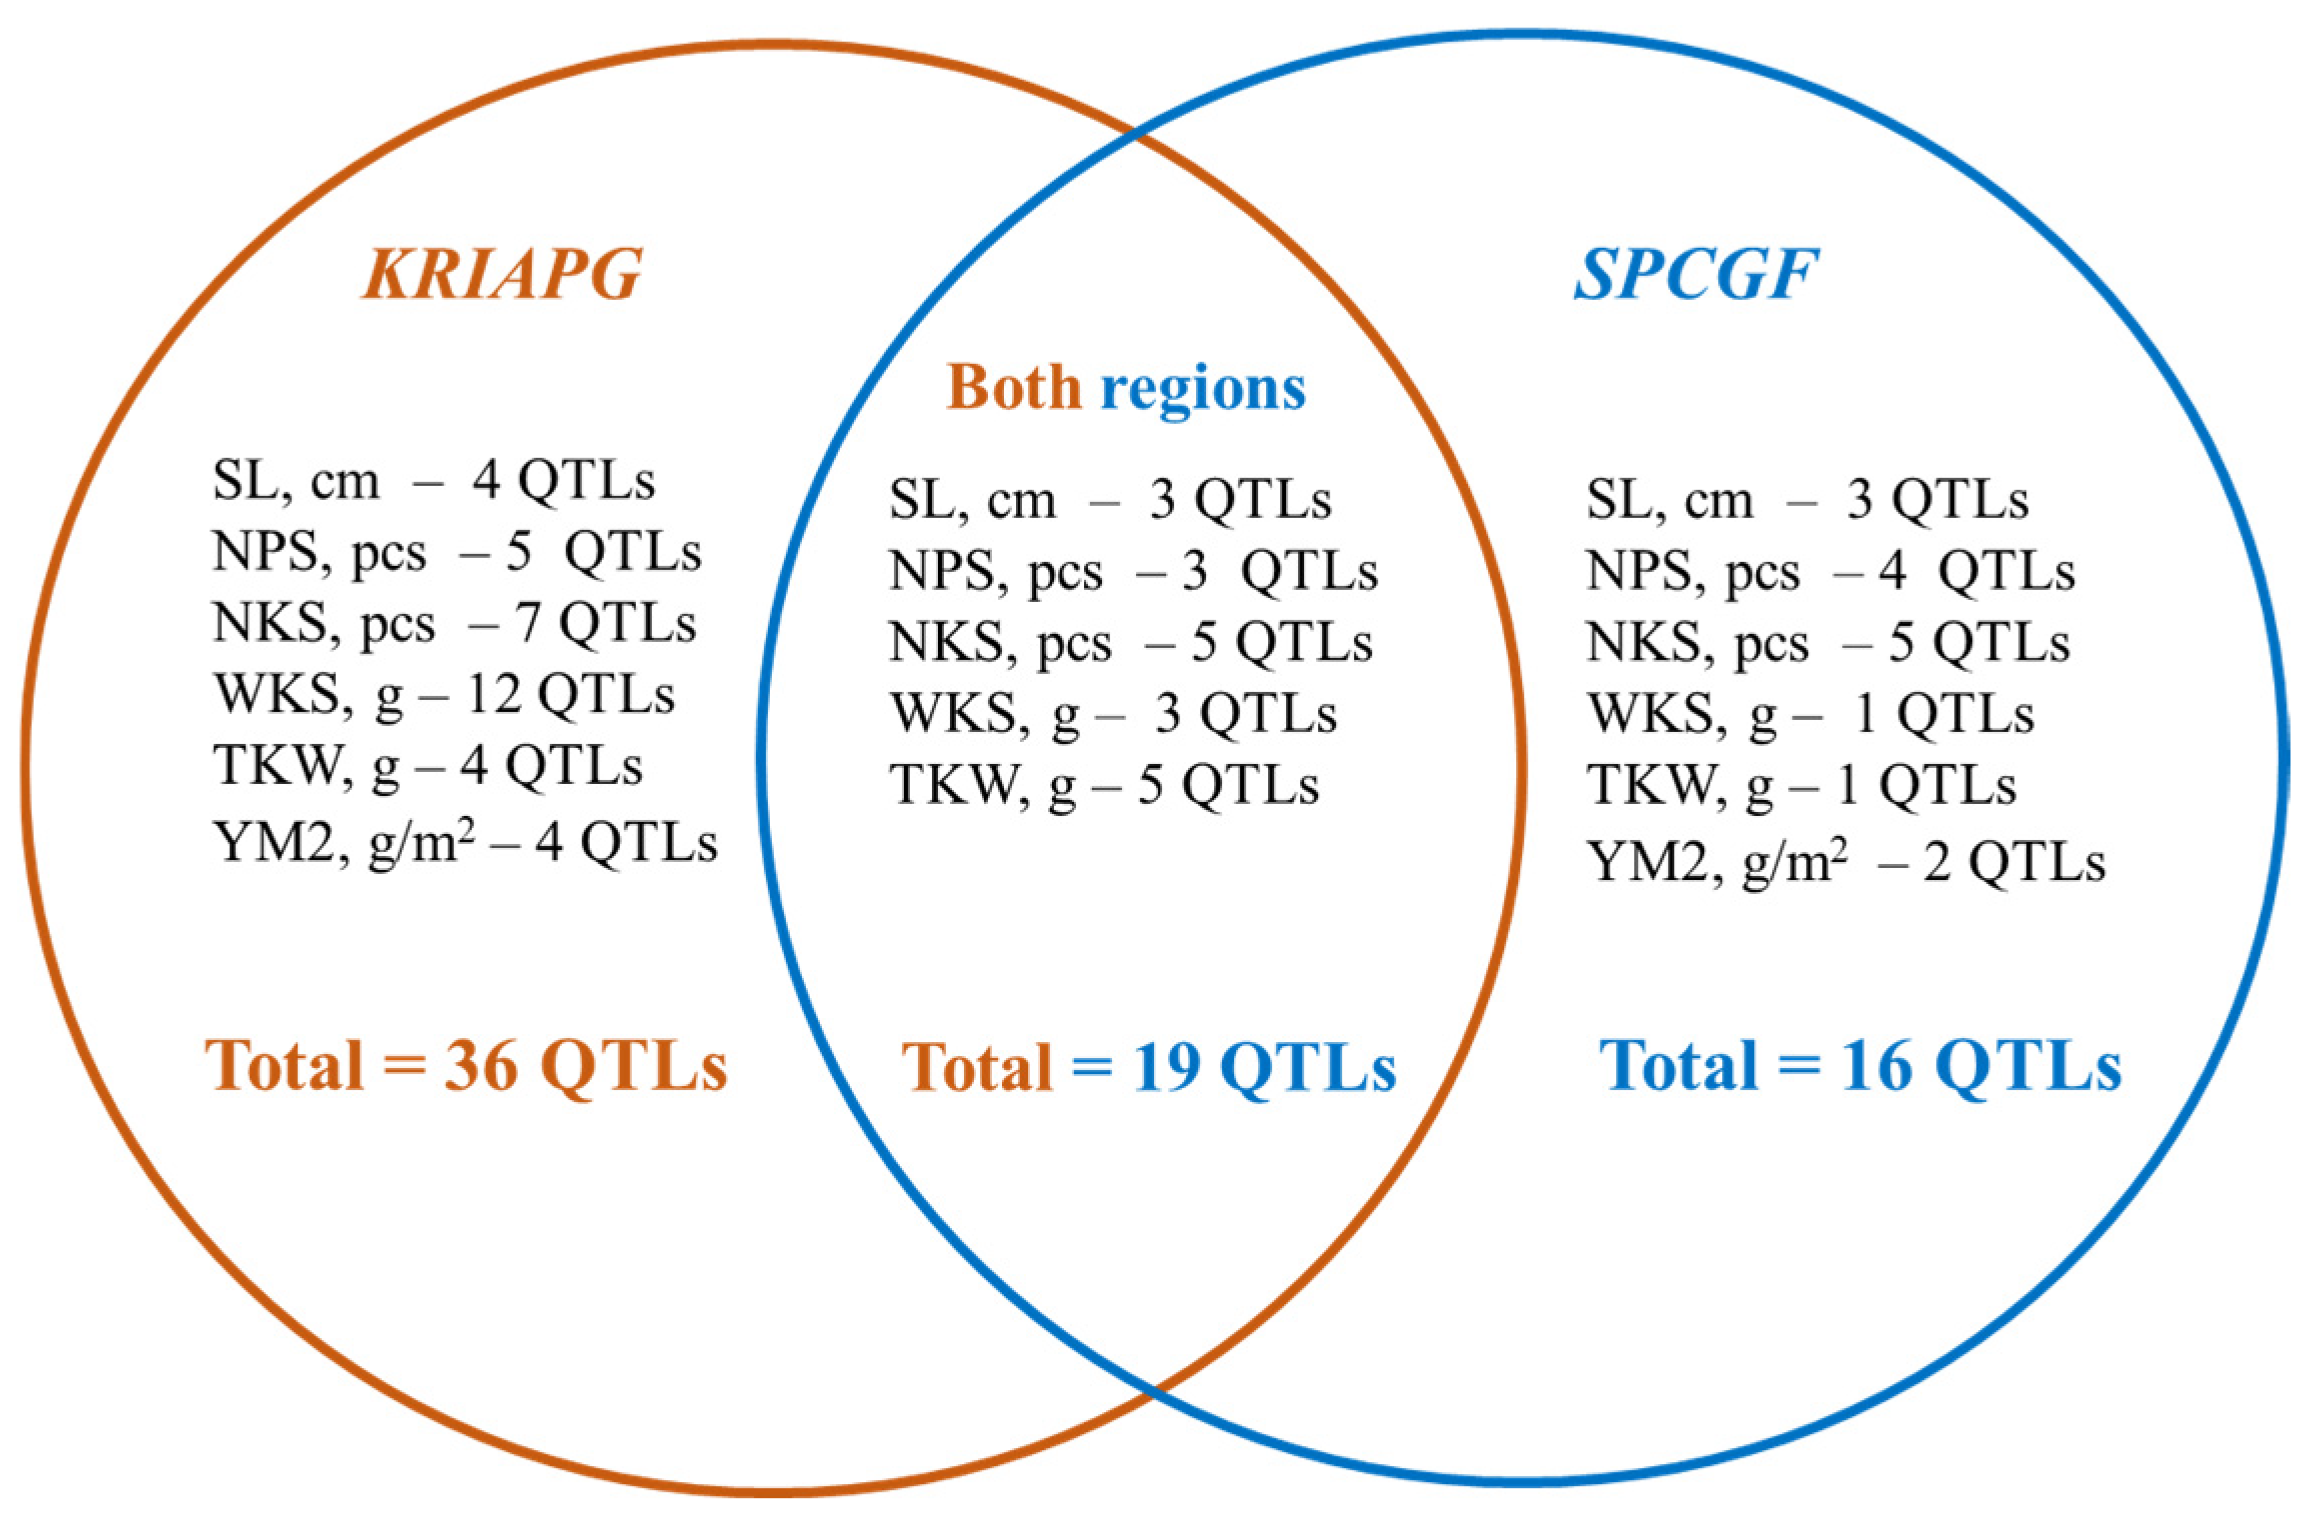
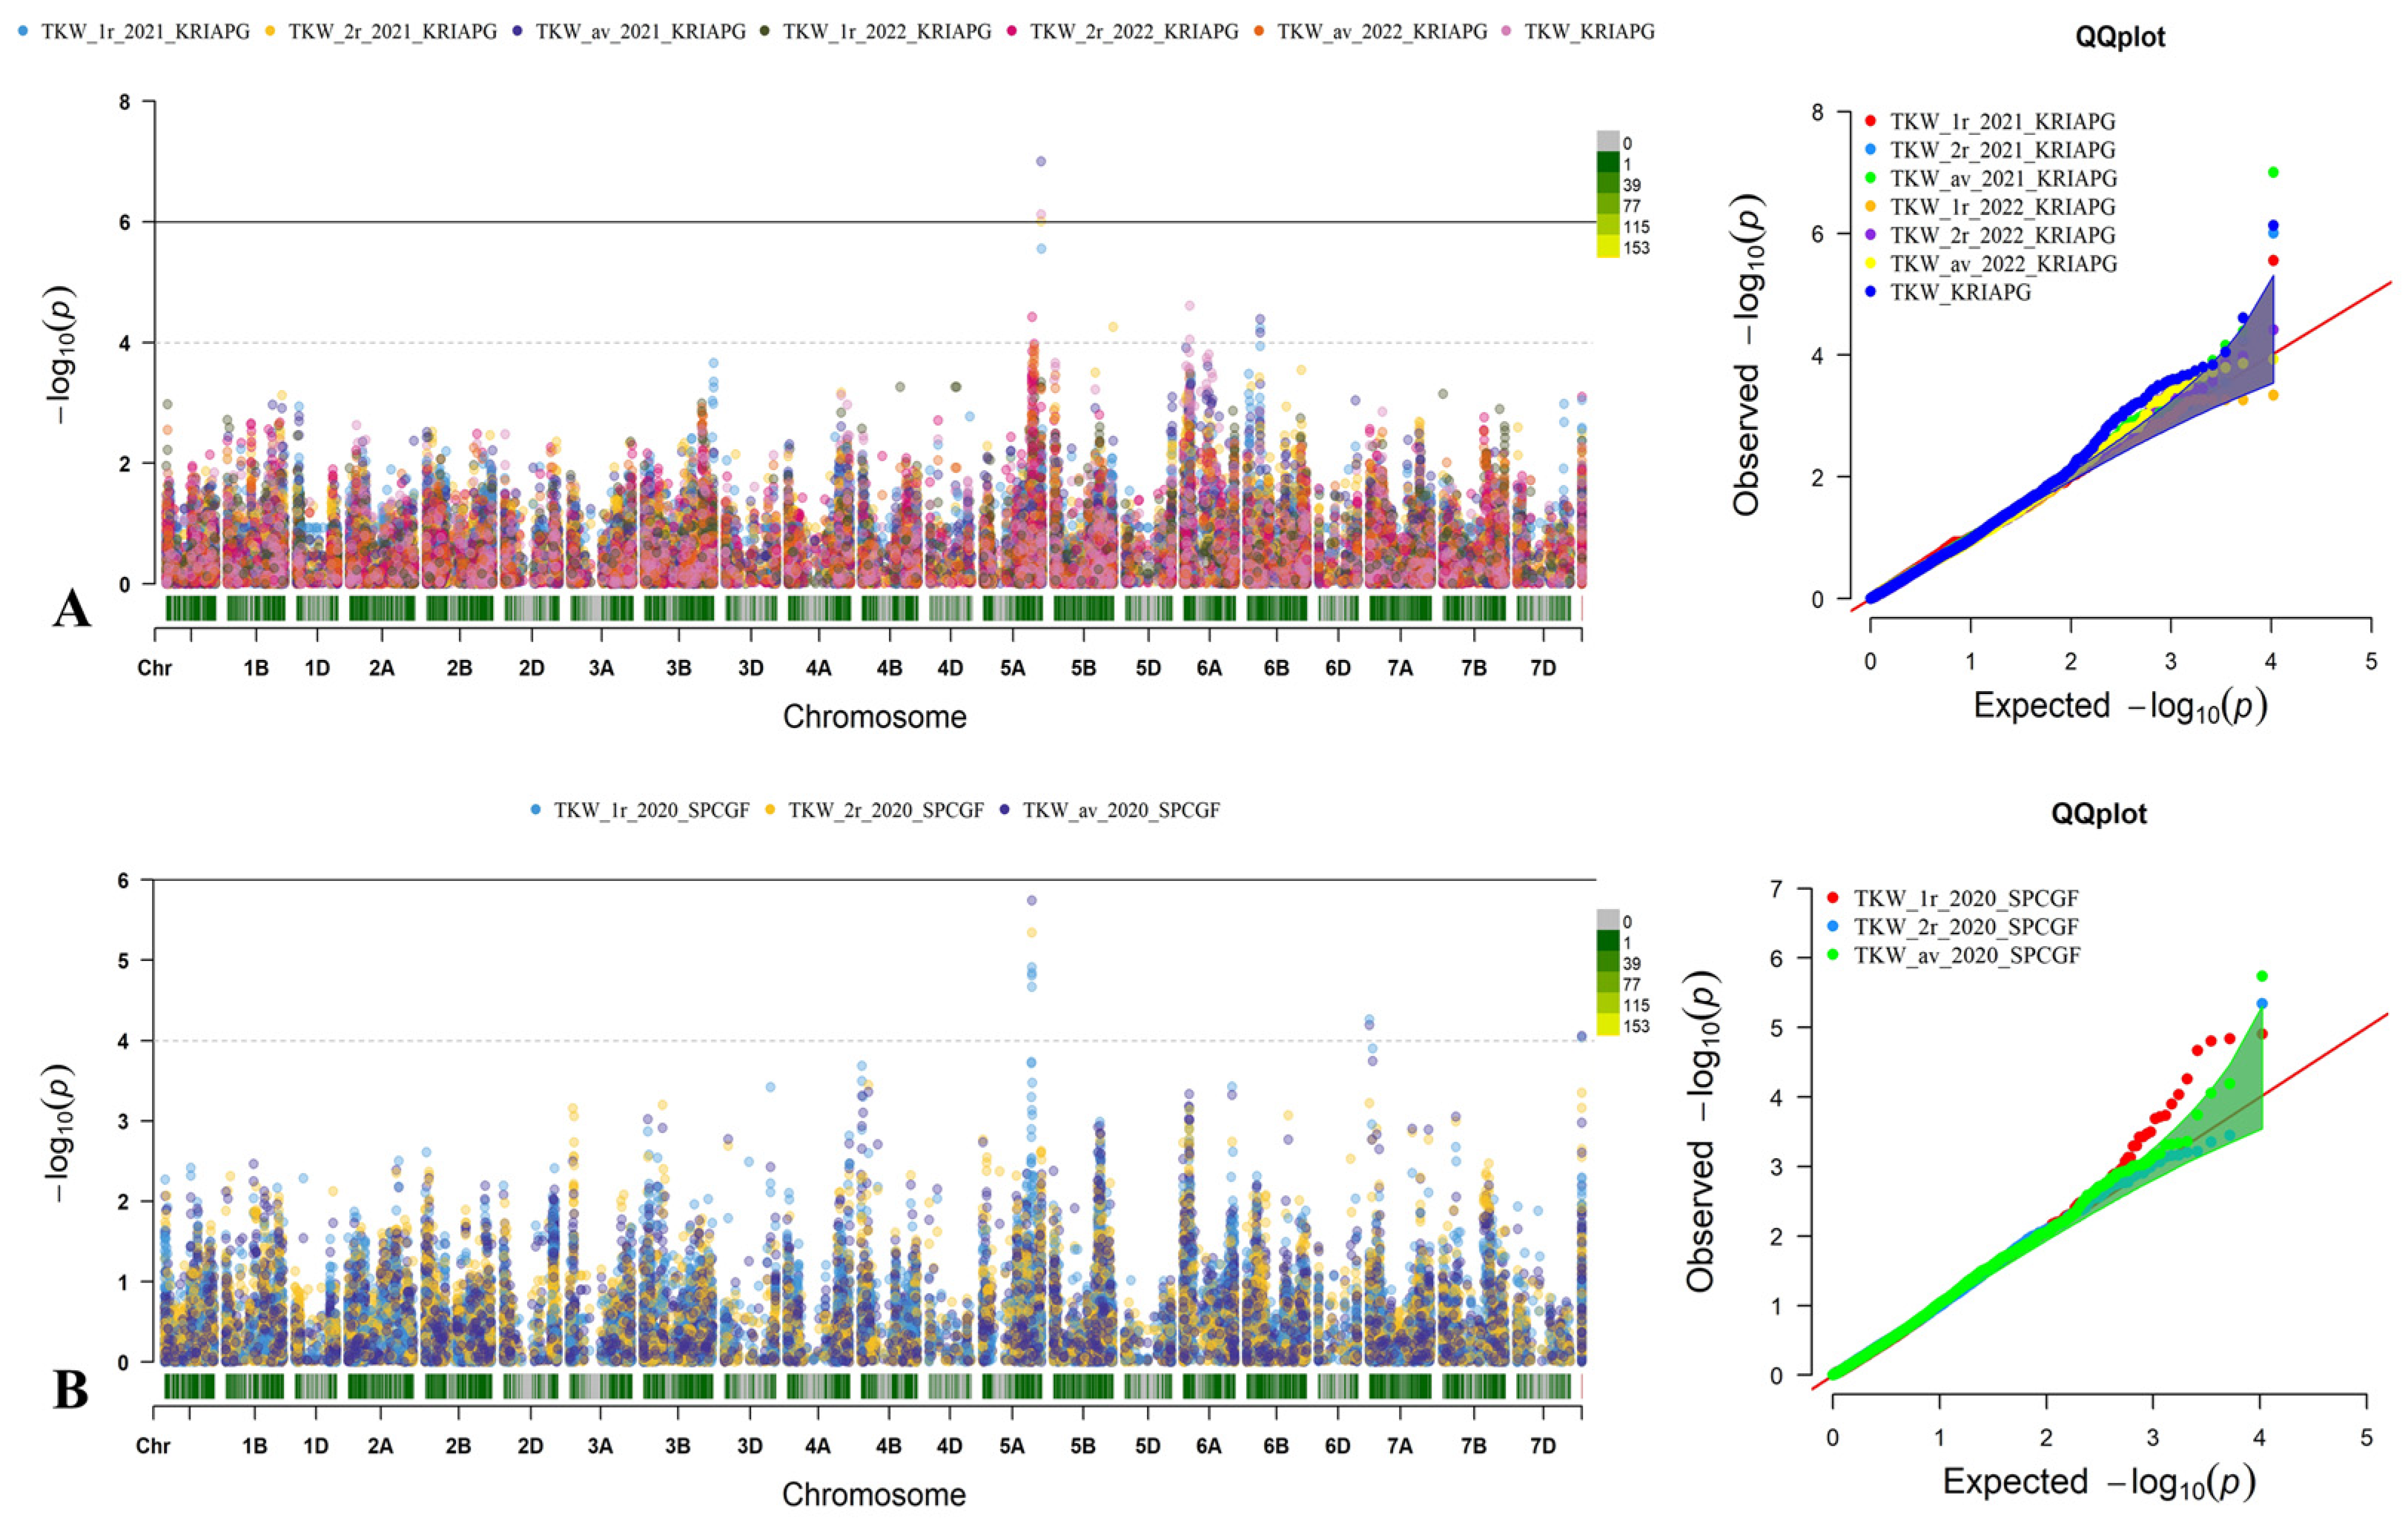
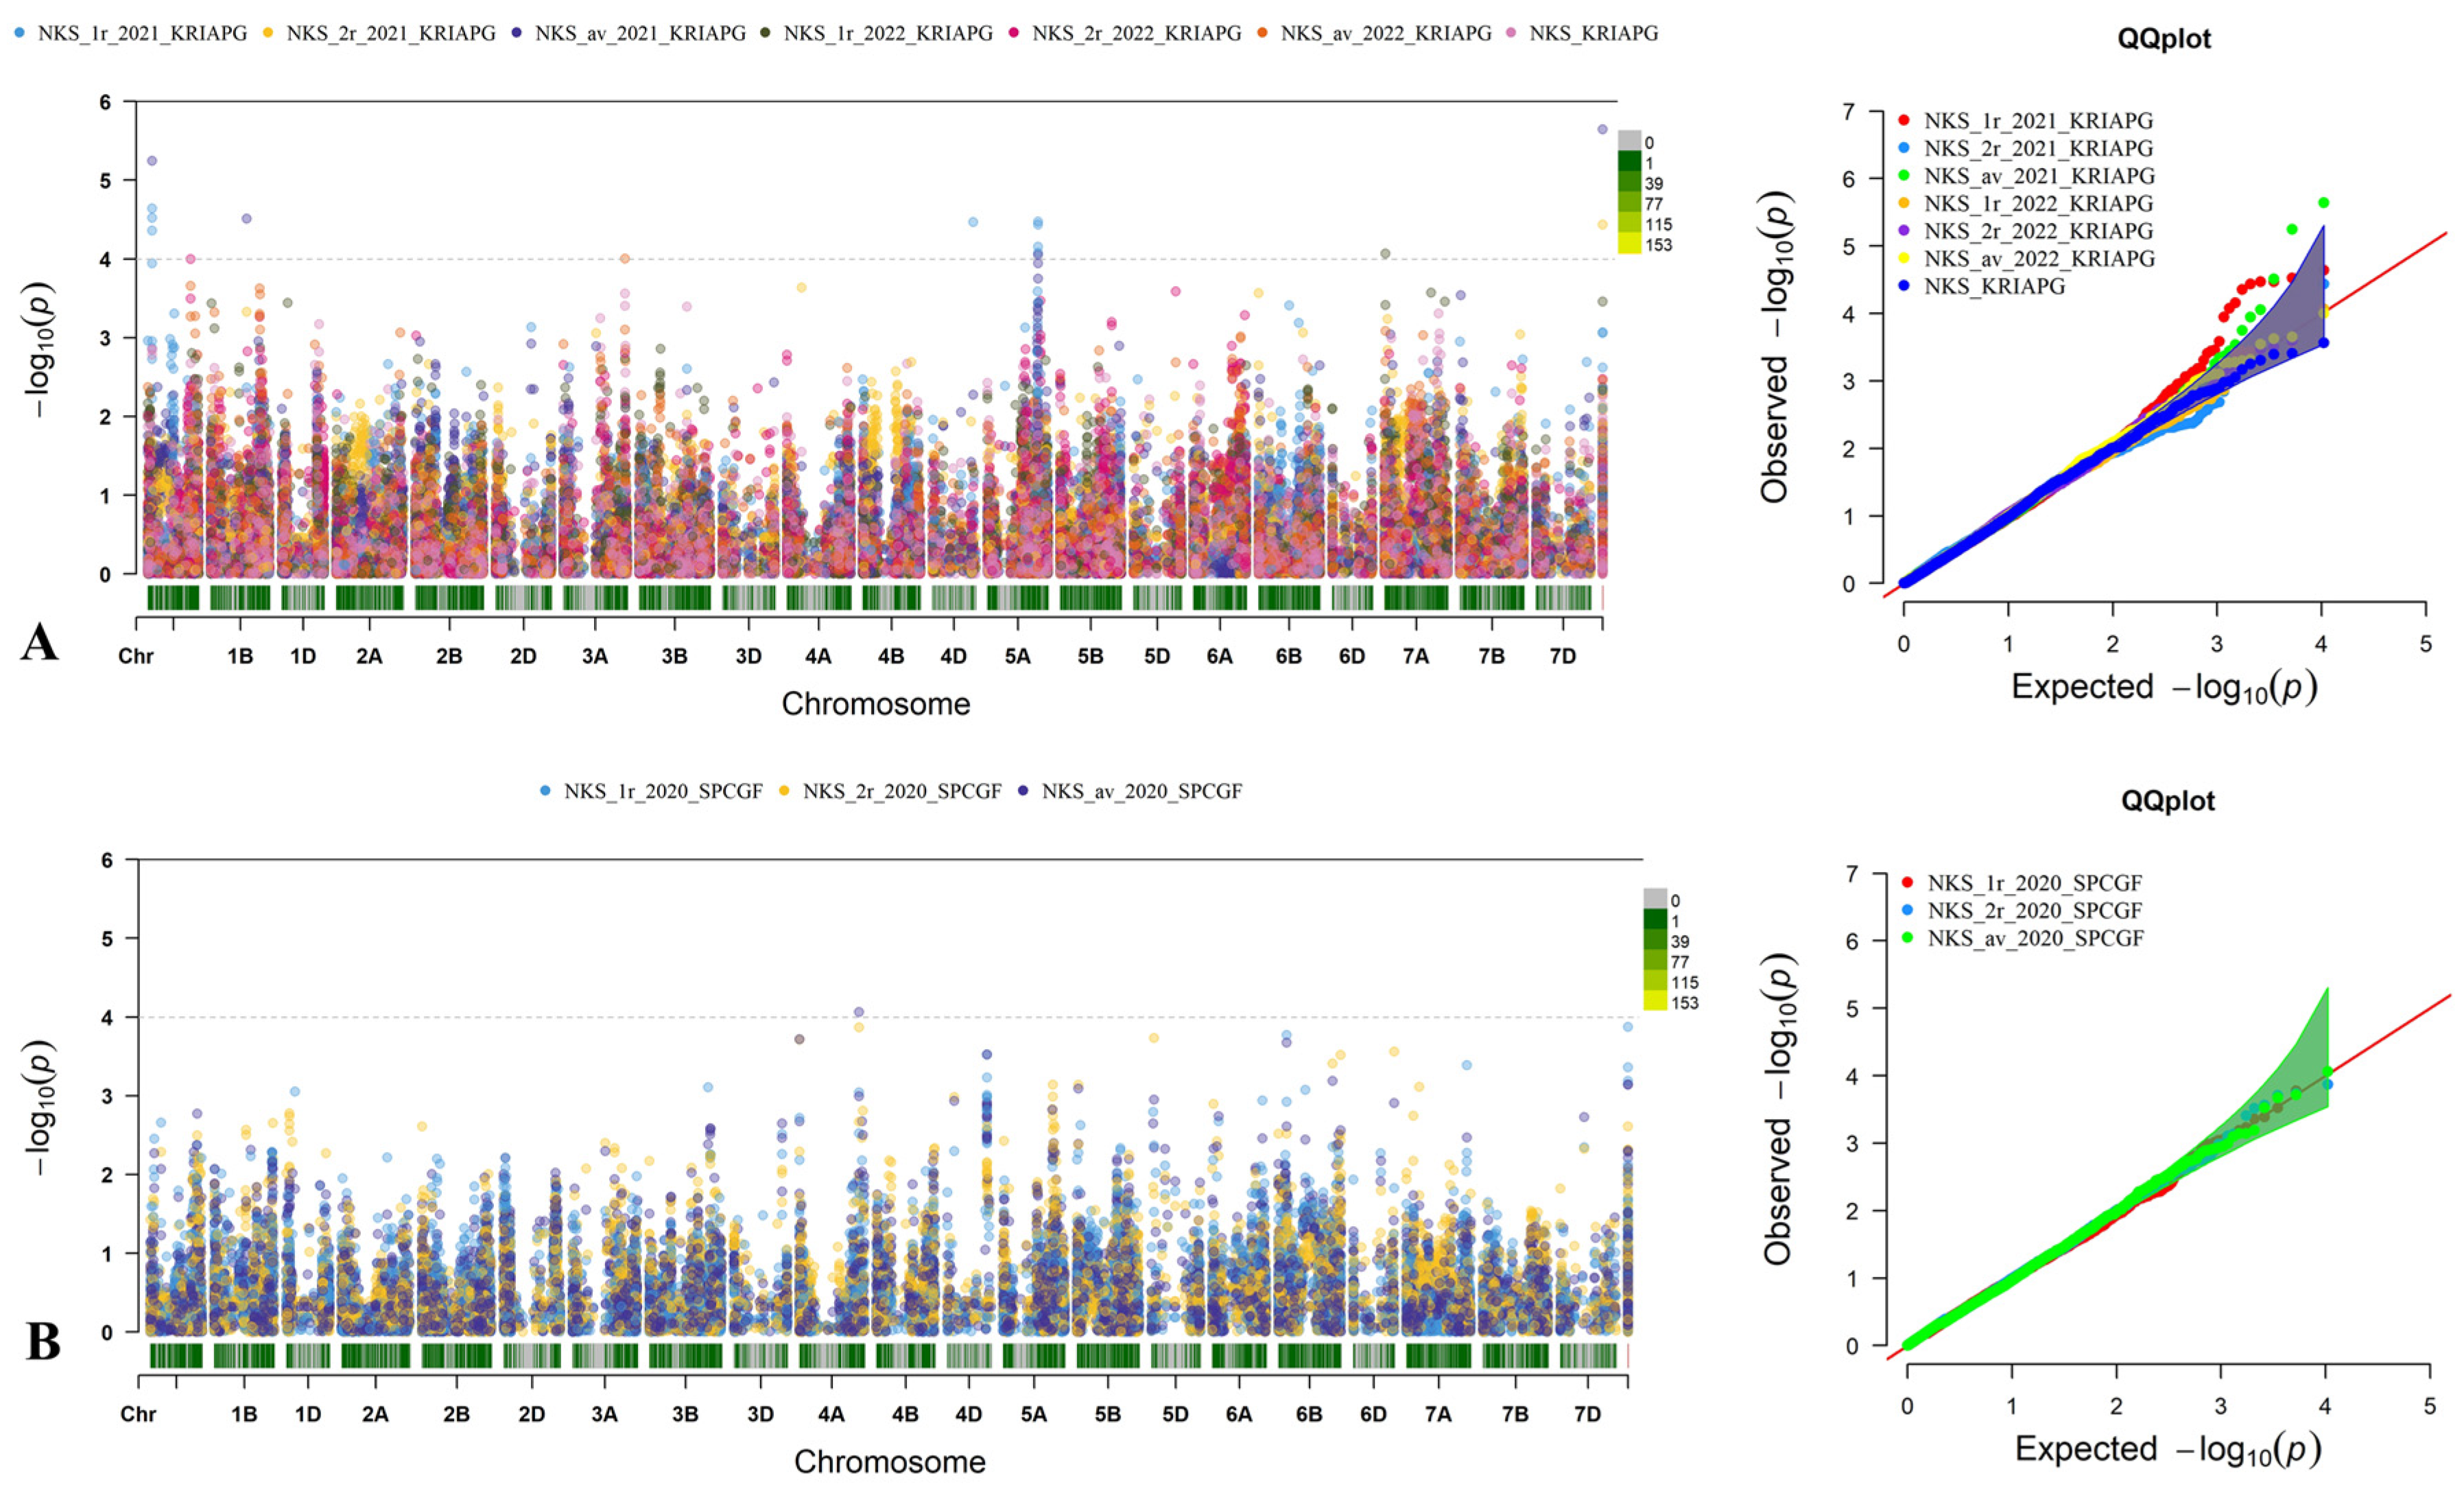
3.4. Identification of Quantitative Trait Loci for Studied Traits Associated with Yield Components

The GWAS analyses identified 72 QTLs in two or more environments for various traits in the NAM spring wheat population based on field performance for six traits at two locations (Table S2). The majority of QTLs were localized on chromosomes of Genomes A (31), followed by Genomes B (29) and D (8). Among the six traits, the number of identified QTLs ranged from 6 for YM2 to 17 for NKS (Table S2). Of the total QTL, 36 were identified specifically at KRIAPG, 16 at SPCGF, and 19 were common across both regions (Figure 4).
Identified QTLs are presented on a Manhattan plot along with QQ plots (see examples for TKW and NKS in Figure 5 and Figure 6). QQ plots verified that the observed p-values from GWAS follow the expected distribution under the null hypothesis, indicating that population structure has been properly accounted for and confirming the robustness of the GWAS results. During the GWAS analysis of yield components, the least number of QTLs identified was 6 QTLs for YM2. These included single QTLs on Chromosomes 1B, 3B, 5A, 5B, and 2B(2), all of which showed significance at KRIAPG (4 QTLs) and SPCGF (2 QTLs). The effect’s highest value was observed for QYM2.ta.NAM.ipbb-2B.2 (240.92 g), which had a p-value of 5.16 × 10⁻⁵ detected at SPCGF (Table S2). The following lowest number of QTLs were identified for SL 10 QTLs. The QTLs for SL were detected on Chromosomes 1A, 2B, 4B (two QTLs), 5A (two QTLs), 6B, and 7A. Three QTLs (QSL.ta.NAM.ipbb-4B.2, QSL.ta.NAM.ipbb-5A.2, QSL.ta.NAM.ipbb-6B) were detected in both regions (Table S2). Another small number of QTLs was noted for TKW; 10 QTLs were identified, with detection at KRIAPG (4 QTLs), SPCGF (1 QTLs), and 5 QTLs in both regions. The most significant were noted two QTLs with p-values (9.93 × 10⁻⁸ and 1.82 × 10⁻⁶) were observed for chromosome 5A in both regions (Figure 5).
The largest number of QTLs was detected for NKS, with 17 QTLs identified and mapped on Chromosomes 1A (two QTLs), 1B (three QTLs), 3A, 4A (two QTLs), 4D, 5A, 5B (two QTLs), 5D, 6A, 6B (three QTLs), and 7A. Five QTLs located on Chromosome 5B and two on Chromosomes 4A and 6B were detected in Northern Kazakhstan. Six QTLs located on Chromosomes 1A (two QTLs), 1B (three QTLs), and 3A were identified only at KRIAPG. The effect of each QTL varied significantly, with the highest value observed for QNKS.ta.NAM.ipbb-4D (36.2 pcs) detected on Chromosome 4D and identified in both regions (Table S2 and Figure 6).
Following NKS, the next three traits with the most identified QTLs were WKS (16 QTLs) and NPS (13 QTLs). Thirteen QTLs were associated with NPS and were located on nine chromosomes. Five identified QTLs were detected at KRIAPG, four at SPCGF, and four in both regions. Notably, the most significant p-value of 4.89 × 10⁻⁷ was observed for a QTL on Chromosome 2B, detected at KRIAPG (Table S2). The SNP (AX-95237325) was identified in both regions with a p-value of 6.93 × 10⁻⁷, with a phenotypic variation of 86.13%. Sixteen QTLs were associated with WKS, with one QTL detected at SPCGF, 12 at KRIAPG, and 3 in both regions. The effect of each QTL varied significantly, with the highest value observed for QWKS.ta.NAM.ipbb-1B.1 (5.52 g), which explained 40.06% of the phenotypic variation (PVE) and had a p-value of 4.21 × 10⁻⁸ detected at KRIAPG (Table S2).

3.5. Putative Candidate Genes and SSR Markers Associated with QTLs

The significant SNPs associated with six studied traits were used to identify putative candidate genes using the annotated wheat reference sequence (Wheat Chinese Spring IWGSC RefSeq v2.1 genome assembly (2021)) and are presented in Table S2. The results showed that out of the 72 identified QTLs, 45 were located in genic positions (Table S3). For example, AX-94774196, associated with TKW, was found to encode an F-box-like domain superfamily (TraesCS6A02G104200). Other QTLs associated with TKW included genes encoding Protein kinase domain-containing protein (TraesCS5A02G393000); Proteasome subunit alpha type (TraesCS6A02G097800); Auxin response factor (TraesCS6A02G113000); and SPRY domain-containing protein (TraesCS6A02G196200).
Another set of QTLs associated with NKS identified 10 putative candidate genes, including those encoding Protein kinase domain-containing protein (TraesCS1A02G304200); Glutathione dehydrogenase (TraesCS1B02G059100); Tyrosine-specific protein phosphatases domain-containing protein (TraesCS1B02G232400); CAF1-binding domain-containing protein (TraesCS1D02G106800); Xyloglucan galactosyltransferase MUR3 (TraesCS4D02G307300); Ribosomal protein L13a (TraesCS5A02G392900); Calcium-dependent protein kinase (TraesCS6B02G111800); and Transcription initiation factor TFIID subunit 1 (TraesCS7A02G514800). The remaining candidate genes are presented in Table S2.
As a result of mapping SSR markers associated with agronomic traits, four SSR markers were localized near QTLs associated with yield components. Two QTLs associated with YM2 and NPS were located on the 1B chromosome near the xgwm124 markers. Another SSR marker, xgwm639, mapped on the 5A chromosome and was located near QTLs associated with SL. Also, the SSR marker, xgwm169, was mapped on the 6A chromosome and located near QTLs related to NKS. Additionally, two SSR markers, xgwm459 and xgwm219, were located near QTLs associated with WKS (Figure S1).

3.6. The Effect of QTLs Associated with NKS and TKW Identified Two Regions

The impact of identified QTLs for NKS and TKW on the performance of averaged NKS, TKW, and YM2 were assessed separately for KRIAPG and SPCGF (Table 4 and Table 5). The analysis of the identified set of QTLs for NKS suggested that 15 of 17 QTLs showed the same positive (6) or negative (9) directions in NKS values in two comparative regions. Eleven of these 15 QTLs showed different effects when NKS was compared to TKW in KRIAPG and 12 QTLs in SPCGF (Table 4). The effect of three QTLs (QNKS.ta.NAM.ipbb-1B.2, QNKS.ta.NAM.ipbb-4D, and QNKS.ta.NAM.ipbb-UNK) showed a negative impact both on NKS and TKW in KRIAPG, while QNKS.ta.NAM.ipbb-6B.1 showed a similar effect in SPCGF (Table 4). QTLs with positive effects on NKS, the QNKS.ta.NAM.ipbb-5A showed the largest impact on YM2 value in KRIAPG and QNKS.ta.NAM.ipbb-4D on YM2 value in SPCGF. Generally, the above-listed QTLs can be successfully used for their positive and negative alleles selection (Table 4) in breeding schemes for yield improvement.
A similar analysis evaluated QTLs for TKW concerning their influences on averaged NKS, TKW, and YM2 values (Table 5). The assessment of the identified set of QTLs for TKW suggested that all 10 QTLs showed the same positive (4) or negative (6) directions in TKW values in two comparative regions (KRIAPG and SPCGF). Nine of these ten QTLs showed different effects when the TKW was compared to the NKS in KRIAPG and eight in SPCGF (Table 5). QTKW.ta.NAM.ipbb-6B.1 demonstrated a positive effect on YM2 in KRIAPG but a negative impact on YM2 in SPCGF, underlying the strong influence of the environmental conditions on the yield outcome. Among QTLs with adverse effects for TKW, QTKW.ta.NAM.ipbb-UNK showed a tremendous YM2 negative impact in SPCGF but positively affected yield in KRIAPG, where NKS appeared to have a positive value (2.88 pcs) (Table 5).

4. Discussion

In this study, the 290 RILs of the NAM population were assessed using six yield components in conditions of southeastern (KRIAPG) and northern (RPCGF) regions of Kazakhstan. The climate condition, including annual rainfall and temperature, reveals notable discrepancies between the two study regions (Table 1). The soil types differ considerably, with KRIAPG having light chestnut soil and SPCGF having southern carbonate chernozem, affecting water and nutrient availability (Table 1). The results revealed substantial phenotypic variability among genotypes, with significant differences observed in the NAM population and local standard cultivars “Astana” and “Kazakhstanskaya 4” (Figure 1). Pearson’s correlation indicated that most traits showed positive correlations among yield-related traits in both regions (Figure 2 and Figure 3). Expectedly, there were no positive correlations between NKS and TKW in the two studied regions, as these results were congruent with reports from the other areas [65,66]. The top-performing RILs were identified in each region based on the evaluation of NKS, TKW, and YM2 (Table 3). The identified RILs consistently outperformed local check cultivars, suggesting their potential for further assessment in extended field trials and eventual incorporation into breeding programs to improve yield stability and performance.
The GWAS of studied 290 RILs identified a total of 72 QTLs associated with yield-related traits (Figure 4). The identified QTLs were distributed across all three subgenomes (A, B, and D), with 36 QTLs detected in the southeastern region (KRIAPG), 16 QTLs in the northern region (RPCGF), and 19 in both locations (Figure 4). Identifying region-specific QTLs underscores the importance of considering local adaptation and genetic diversity in breeding efforts to enhance trait expression and stability across diverse environments (Figure 4).
The literature survey suggested that at least 11 out of 72 QTLs in this study had been previously reported in other GWAS and QTL mapping publications (Table S3) [67,68,69,70,71,72,73,74]. The largest number of QTLs found in the same genetic locations was loci for TKW and WKS (three QTLs per trait), followed by NKS and SL (two QTLs per trait) and NPS. Three out of 72 QTLs were detected in the same genetic positions as the results from studies of the double haploid mapping population Avalon × Cadenza, where two QTLs for SL, three for NPS, and TKW were identified in three regions of Kazakhstan [69]. Three QTLs associated with WKS were located in close genetic positions to QTLs identified in analyses of four yield component traits using F8:9 RIL populations, comprising 485 and 229 lines evaluated in four different environments in China [72]. A QTL associated with NKS was identified in a similar genetic position in studies that mapped QTLs using 168 DH populations derived from the cross Huapei 3 × Yumai 57 [71]. Another QTL related to NKS was found in a similar location in GWAS studies of agronomic traits in winter wheat from Kazakhstan’s southern and southeastern regions [65].
Several QTLs detected in this work were identified near known wheat genes like Ppd-B1, Vrn-A1, and Lr34. For example, QTLs associated with YM2 (QYM2.ta.NAM.ipbb-2B.2, 67 Mb) were located close to the Photoperiod-1 (Ppd-B1, 60 Mb) loci, essential regulators of heading time. Another gene controlling vernalization requirement, Vrn-A1 (587 Mb), was located near QTLs associated with NKS (QNKS.ta.NAM.ipbb-5A, 588 Mb), TKW (QTKW.ta.NAM.ipbb-5A.1, 588 Mb). A QTL associated with leaf rust resistance (Lr34, 131 Mb) was also detected near the QTL (NPS.ta.NAM.ipbb-7B 134 Mb) (Figure S1). The significant SNPs in the detected QTLs were analyzed to identify putative candidate genes using the database’s annotated reference genome [57]. The results showed that out of the 72 identified QTLs, 45 were located in genic positions (Table S2). An analysis of these 45 genes showed that most were associated with controlling plant growth, development, and abiotic/biotic stress tolerance (Table S2). For example, QTLs associated with TKW (QTKW.ta.NAM.ipbb-6A.2) had significant SNPs aligned with an F-box domain-containing protein regulating plant development and controlling flowering time [75,76]. QNPS.ta.NAM.ipbb-2D.1, associated with NPS, encodes Domain of Unknown Function (DUF) domain-containing proteins, which play a role in plant development [77]. One of the most significant QTLs (QNPS.ta.NAM.ipbb-2B), detected on Chromosome 2B at KRIAPG, encoded a hydrophobic seed protein domain-containing protein (TraesCS2B02G430300). Hydrophobic seed protein domain-containing proteins are studied in wheat and other cereal crops for their nutritional value and potential roles in seed storage and germination [78]. The list of genes and proteins related to plant growth, development, and abiotic/biotic stress tolerance also includes protein kinase domain-containing proteins (TraesCS1A02G304200, TraesCS5A02G393000) [79] and Auxin response factor (TraesCS6A02G113000) and calcium-dependent protein kinase (TraesCS6B02G111800) (Table S3). In addition, several SSR markers showed a tight linkage with identified QTLs for yield components (Figure S1). For instance, on Chromosome 1B, the xgwm124 was found to be located near QTLs for YM2 and NPS. Previously, it was reported that xgwm124 was associated with NKS and weight kernel per plant [27]. The xgwm639 on the chromosome 5A marker was associated with QTL for SL, while xgwm169 on Chromosome 6A was linked to QTL for NKS. Additionally, xgwm459 and xgwm219 on Chromosomes 6A and 6B, respectively, were located in the vicinity of QTL for WKS. These findings may facilitate marker-assisted selection, enabling breeders to efficiently select for high-yield traits, ultimately accelerating the development of superior wheat varieties.
In addition, as NKS and TKW are two of the most important contributors to yield and traits that are often negatively correlated, we specifically focused on identifying and assessing these two yield components. In theory, a QTL that increases NKS might reduce TKW, and vice versa, due to limited available resources [65,66]. Therefore, identifying QTLs that positively or negatively influence both traits and at least do not adversely affect one while improving the other can be important tools in marker-assisted selection programs [80]. At the KRIAPG site, QNKS.ta.NAM.ipbb-3A and QNKS.ta.NAM.ipbb-5A positively affected NKS, TKW, and YM2 (Table 4). At the SPCGF site, QNKS.ta.NAM.ipbb-6A, QNKS.ta.NAM.ipbb-6B.2, and QNKS.ta.NAM.ipbb-6B.3 showed promising results, positively impacting all three yield-related components. In addition, QNKS.ta.NAM.ipbb-1B.2 and QNKS.ta.NAM.ipbb-4D showed remarkable negative effects on YM2 in KRIAPG, suggesting the necessity to search for their alternative allele statuses in wheat breeding projects in this location. Still, QNKS.ta.NAM.ipbb-4D showed a highly positive effect for YM2 in SPCGF (Table 4), confirming the importance of considering environmental conditions.
The assessment of QTLs for TKW suggested that nearly all identified QTLs showed the opposite effects on the performance of TKW and NKS, confirming difficulties for the search of QTL with similar effects on these two critical quantitative traits for the grain yield. Nevertheless, the QTKW.ta.NAM.ipbb-7A.1 (Table 5) can be an advantageous example of QTL selection for breeding schemes in Northern Kazakhstan.
Identifying key QTLs associated with NPS, SL, NKS, TKW, and YM2 in wheat, comprehensive ANOVA, and GGE analysis for study traits underscores the essential role of both the genotype and environment in influencing yield components. This insight is pivotal for developing wheat varieties with optimized yield-related characteristics, which could significantly enhance yield and resilience. Moreover, exploring the association of QTLs with corresponding proteins in wheat provides new possibilities for controlling plant growth and stress responses, offering potential strategies to improve crop performance under diverse environmental conditions. These preliminary results lay a robust foundation for future research, aiming to integrate genetic insights into breeding programs to promote sustainable agricultural practices and ensure food security in the face of climate change and a growing global population. Thus, the results suggest that an evaluation of the NAM population is important for mining QTLs to improve the yield in bread wheat and enhance local breeding activities to develop new competitive cultivars.

5. Conclusions

The analysis of 290 RILs from 24 crosses within the NAM population provided valuable insights into wheat adaptability across two contrasting regions in Kazakhstan: the southeast and the north. This extensive study demonstrated that several accessions outperformed local standard cultivars in yield across these diverse environments. We conducted a comprehensive GWAS that identified significant QTLs associated with six yield-related traits by integrating phenotypic data from these regions with genotypic data encompassing 10,448 polymorphic SNP markers.
In total, 72 QTLs were identified, with 36 detected in the southeastern region, 16 in the northern region, and 19 in both locations. This distribution underscores the regional specificity of QTLs and highlights the importance of evaluating multiple environments to capture the full spectrum of genetic variation. Identifying these QTLs enhances our understanding of yield-related traits and emphasizes the adaptability of the NAM population for identifying key genetic factors under diverse conditions. Notably, the literature survey revealed that at least 11 of the 72 identified QTLs had been previously documented in other GWAS and QTL mapping studies, validating the robustness and reliability of our findings. This cross-validation strengthens the credibility of our results and supports the use of these QTLs in future breeding programs.
Regarding specific traits, we identified 17 QTLs related to NKS and 10 QTLs related to TKW. These traits are crucial as they generally correlate positively with yield, though they often negatively correlate with each other. Interestingly, our study found that two QTLs for NKS and three QTLs for TKW positively influenced NKS, TKW, and yield. This positive effect suggests that these QTLs could be valuable in breeding programs to improve these traits simultaneously. Overall, this study demonstrates that the NAM population is a powerful resource for identifying significant QTLs associated with yield-related traits. The insights gained from this research are instrumental for enhancing local wheat breeding efforts and developing competitive new cultivars tailored to specific regional conditions.

Supplementary Materials

The following supporting information can be downloaded at: https://www.mdpi.com/article/10.3390/agronomy14081848/s1, Table S1: The raw field data at the Kazakh Research Institute of Agriculture and Plant Growing (KRIAPG, Almaty region, Southeast Kazakhstan) and Alexandr Barayev Scientific-Production Center for Grain Farming (SPCGF, Shortandy, Akmola region, Northern Kazakhstan); Table S2: The list of QTLs and genes for six studied traits identified using 290 RILs of the NAM population in conditions at Kazakh Research Institute of Agriculture and Plant Growing (KRIAPG, Almaty region, Southeast Kazakhstan, 2021–2022) and Alexandr Barayev Scientific-Production Center for Grain Farming (SPCGF, Shortandy, Akmola region, Northern Kazakhstan, 2020); Table S3: List of identified QTLs based on GWAS analysis of wheat collection compared to the associations revealed in previously published reports. Figure S1: The genetic map of QTLs is associated with yield components that identify the NAM population.

Author Contributions

Conceptualization, Y.T.; Formal analysis, A.A.; Funding acquisition, Y.T.; Investigation, A.A., S.G., S.A., and Y.T.; Methodology, S.G., Y.T., and S.A.; Project administration, S.A.; Resources, S.G.; Supervision, Y.T.; Visualization, A.A.; Writing—original draft, A.A., S.G., S.A. and Y.T.; Writing—review & editing, A.A., S.G., S.A., and Y.T. All authors have read and agreed to the published version of the manuscript.

Funding

This research was funded by the Science Committee of the Ministry of Science and Higher Education (former Ministry of Education and Science) of the Republic of Kazakhstan (Grant No. BR18574099).

Data Availability Statement

The original contributions presented in the study are included in the article and Supplementary Materials, further inquiries can be directed to the corresponding author.

Acknowledgments

The authors sincerely thank Adylkhan Babkenov and Charlie Philp for their significant contributions to data collection and analysis of the NAM population and their invaluable support during this work.

Conflicts of Interest

The authors declare no conflict of interest.

References

  1. Food and Agriculture Organization of the United Nations. Available online: https://www.fao.org/faostat/en/#home (accessed on 25 April 2024).
  2. United Nations World Population Prospects 2019: Highlights. Available online: https://population.un.org/wpp/Publications/Files/WPP2019_Highlights.pdf (accessed on 15 April 2024).
  3. Curtis, B.C.; Rajaram, S.; Gómez Macpherson, H. (Eds.) . Bread Wheat: Improvement and Production; Food and Agriculture Organization of the United Nations: Rome, Italy, 2002; 554p. [Google Scholar]
  4. Shiferaw, B.; Smale, M.; Braun, H.J.; Duveiller, E.; Reynolds, M.; Muricho, G. Crops that feed the world 10. Past successes and future challenges to the role played by wheat in global food security. Food Secur. 2013, 5, 291–317. [Google Scholar] [CrossRef]
  5. USDA. Commodity Intelligence Report. Kazakhstan: Better MY 2022/2023 Wheat Prospects Than Last Year. Available online: https://ipad.fas.usda.gov/highlights/2022/08/Kazakhstan/index.pdf (accessed on 20 April 2024).
  6. Abugalieva, A.; Peña-Bautista, R.J. Grain quality of spring and winter wheat of Kazakhstan. Asian Australas. J. Plant Sci. Biotech. 2010, 4, 87–90. [Google Scholar]
  7. Abugaliyeva, A.I.; Morgounov, A.I. Genetic Potential of Winter Wheat Grain Quality in Central Asia. Int. J. Environ. Sci. Educ. 2016, 11, 4869–4884. [Google Scholar]
  8. Amalova, A.; Yermekbayev, K.; Griffiths, S.; Abugalieva, S.; Babkenov, A.; Fedorenko, E.; Abugalieva, A.; Turuspekov, Y. Identification of quantitative trait loci of agronomic traits in bread wheat using a Pamyati Azieva× Paragon mapping population harvested in three regions of Kazakhstan. PeerJ 2022, 10, e14324. [Google Scholar] [PubMed]
  9. Amalova, A.; Abugalieva, S.; Babkenov, A.; Babkenova, S.; Turuspekov, Y. Genome-wide association study of yield components in spring wheat collection harvested under two water regimes in Northern Kazakhstan. PeerJ 2021, 9, e11857. [Google Scholar] [PubMed]
  10. Morgounov, A.; Sonder, K.; Abugalieva, A.; Bhadauria, V.; Cuthbert, R.D.; Shamanin, V.; Zelenskiy, Y.; DePauw, R.M. Effect of climate change on spring wheat yields in North America and Eurasia in 1981–2015 and implications for breeding. PLoS ONE 2018, 13, e0204932. [Google Scholar]
  11. Aidarkhanov, B.; Atabaeva, S.; Tursunov, O. Influence of climate conditions on the productivity of spring wheat in Northern Kazakhstan. J. Agric. Sci. 2020, 25, 789–798. [Google Scholar]
  12. Nurbekov, A.; Atabayeva, S.; Koishybayev, M. Advances in wheat production and breeding in Kazakhstan. J. Agric. Sci. Technol. 2015, 17, 345–356. [Google Scholar]
  13. Karatayev, M.; Clarke, M.; Salnikov, V.; Bekseitova, R.; Nizamova, M. Monitoring climate change, drought conditions and wheat production in Eurasia: The case study of Kazakhstan. Heliyon 2022, 8, e08660. [Google Scholar] [CrossRef]
  14. Sadras, V.O.; Calderini, D.F. (Eds.) Crop Physiology: Applications for Genetic Improvement and Agronomy; Academic Press: Cambridge, MA, USA, 2009; pp. 571–580. [Google Scholar]
  15. Slafer, G.A.; Savin, R.; Sadras, V.O. Coarse and fine regulation of wheat yield components in response to genotype and environment. Field Crops Res. 2014, 157, 71–83. [Google Scholar]
  16. Lobell, D.B.; Gourdji, S.M. The influence of climate change on global crop productivity. Plant Physiol. 2012, 160, 1686–1697. [Google Scholar]
  17. Nicotra, A.B.; Atkin, O.K.; Bonser, S.P.; Davidson, A.M.; Finnegan, E.J.; Mathesius, U.; Poot, P.; Purugganan, M.D.; Richards, C.L.; Valladares, F.; et al. Plant phenotypic plasticity in a changing climate. Trends Plant Sci. 2010, 15, 684–692. [Google Scholar] [CrossRef]
  18. Reynolds, M.P.; Bonnett, D.; Chapman, S.C.; Furbank, R.T.; Manès, Y.; Mather, D.E.; Parry, M.A.J. Raising yield potential in wheat. J. Exp. Bot. 2009, 62, 439–448. [Google Scholar]
  19. Li, L.; Bian, Y.; Dong, Y.; Song, J.; Liu, D.; Zeng, J.; Wang, F.; Zhang, Y.; He, Z.; Xia, X.; et al. Identification and validation of stable quantitative trait loci for yield component traits in wheat. Crop J. 2023, 11, 558–563. [Google Scholar] [CrossRef]
  20. Yi, X.; Ye, Y.; Wang, J.; Li, Z.; Li, J.; Chen, Y.; Ma, J.; Pu, Z.; Peng, Y.; Qi, P.; et al. Identification and validation of two major QTLs for spikelet number per spike in wheat (Triticum aestivum L.). Front. Plant Sci. 2023, 14, 1144486. [Google Scholar] [CrossRef]
  21. Simmonds, J.; Scott, P.; Brinton, J.; Mestre, T.C.; Bush, M.; Del Blanco, A.; Dubcovsky, J.; Uauy, C. A splice acceptor site mutation in TaGW2-A1 increases thousand grain weight in tetraploid and hexaploid wheat through wider and longer grains. Theor. Appl. Genet. 2016, 129, 1305–1316. [Google Scholar] [CrossRef]
  22. Chidzanga, C.; Mullan, D.; Roy, S.; Baumann, U.; Garcia, M. Nested association mapping-based GWAS for grain yield and related traits in wheat grown under diverse Australian environments. Theor. Appl. Genet. 2022, 135, 4437–4456. [Google Scholar] [CrossRef] [PubMed]
  23. Jabbour, Y.; Hakim, M.S.; Al-Yossef, A.; Saleh, M.M.; Shaaban, A.S.A.D.; Kabbaj, H.; Zaim, M.; Kleinerman, C.; Bassi, F.M. Genomic regions involved in the control of 1,000-kernel weight in wild relative-derived populations of durum wheat. Front. Plant Sci. 2023, 14, 1297131. [Google Scholar] [CrossRef]
  24. Aisawi, K.A.B.; Reynolds, M.P.; Singh, R.P.; Foulkes, M.J. The physiological basis of the genetic progress in yield potential of CIMMYT spring wheat cultivars from 1966 to 2009. Crop Sci. 2015, 55, 1749–1764. [Google Scholar]
  25. Thanh, P.T.; Vladutu, C.I.; Kianian, S.F.; Thanh, P.T.; Ishii, T.; Nitta, M.; Nasuda, S.; Mori, N. Molecular genetic analysis of domestication traits in emmer wheat. I: Map construction and QTL analysis using an F2 population. Biotechnol. Biotechnol. Equip. 2013, 27, 3627–3637. [Google Scholar] [CrossRef]
  26. Groos, C.; Robert, N.; Bervas, E.; Charmet, G. Genetic analysis of grain protein-content, grain yield and thousand-kernel weight in bread wheat. Theor. Appl. Genet. 2003, 106, 1032–1040. [Google Scholar] [CrossRef] [PubMed]
  27. Zhao, C.; Cui, F.; Fan, Z.; Li, J.; Ding, A.; Wang, H. Genetic analysis of important loci in the winter wheat backbone parent Aimengniu. Aust. J. Crop Sci. 2013, 7, 182. [Google Scholar]
  28. Li, B.; Li, Q.; Mao, X.; Li, A.; Wang, J.; Chang, X.; Hao, C.; Zhang, X.; Jing, R. Two novel AP2/EREBP transcription factor genes TaPARG have pleiotropic functions on plant architecture and yield-related traits in common wheat. Front. Plant Sci. 2016, 7, 11–91. [Google Scholar] [CrossRef]
  29. Varshney, R.K.; Roorkiwal, M.; Sorrells, M.E. Genomics-guided breeding for crop improvement. Annu. Rev. Plant Biol. 2014, 65, 583–606. [Google Scholar]
  30. Tshikunde, N.M.; Mashilo, J.; Shimelis, H.; Odindo, A. Agronomic and physiological traits, and associated quantitative trait loci (QTL) affecting yield response in wheat (Triticum aestivum L.): A review. Front. Plant Sci. 2019, 10, 1428. [Google Scholar]
  31. Tester, M.; Langridge, P. Breeding technologies to increase crop production in a changing world. Science 2010, 327, 818–822. [Google Scholar] [PubMed]
  32. Zanke, C.D.; Ling, J.; Plieske, J.; Kollers, S.; Ebmeyer, E.; Korzun, V.; Röder, M.S. Analysis of main effect QTL for thousand-grain weight in European winter wheat (Triticum aestivum L.) by means of a high-density SNP map. Theor. Appl. Genet. 2015, 128, 1785–1800. [Google Scholar]
  33. Guo, Z.; Chen, D.; Alqudah, A.M.; Röder, M.S.; Ganal, M.W.; Schnurbusch, T. Genome-wide association analyses of 54 traits identified multiple loci for the determination of floret fertility in wheat. New Phytol. 2017, 214, 257–270. [Google Scholar]
  34. Jaiswal, V.; Gahlaut, V.; Meher, P.K.; Mir, R.R.; Jaiswal, J.P.; Rao, A.R.; Balyan, H.S.; Gupta, P.K. Genome Wide Single Locus Single Trait, Multi-Locus and Multi-Trait Association Mapping for Some Important Agronomic Traits in Common Wheat (T. aestivum L.). PLoS ONE 2016, 11, e0159343. [Google Scholar] [CrossRef]
  35. Sukumaran, S.; Lopes, M.; Dreisigacker, S.; Reynolds, M.P. Genetic analysis of multi-environmental spring wheat trials identifies genomic regions for locus-specific trade-offs for grain weight and grain number. Theor. Appl. Genet. 2015, 128, 1747–1760. [Google Scholar]
  36. Oyiga, B.C.; Sharma, R.C.; Baum, M.; Ogbonnaya, F.C.; Léon, J.; Ballvora, A. Allelic variations and differential expressions detected at quantitative trait loci for salt stress tolerance in wheat. Plant Cell Environ. 2017, 41, 919–935. [Google Scholar] [CrossRef] [PubMed]
  37. Quarrie, S.A.; Steed, A.; Calestani, C.; Semikhodskii, A.; Lebreton, C.; Chinoy, C.; Steele, N.; Pljevljakusic, D.; Waterman, E.; Weyen, J.; et al. A high-density genetic map of hexaploid wheat (Triticum aestivum L.) from the cross Chinese spring × SQ1 and its use to compare QTLs for grain yield across a range of environments. Theor Appl Genet. 2005, 110, 865–880. [Google Scholar] [PubMed]
  38. Turuspekov, Y.; Baibulatova, A.; Yermekbayev, K.; Tokhetova, L.; Chudinov, V.; Sereda, G.; Ganal, M.; Griffiths, S.; Abugalieva, S. GWAS for plant growth stages and yield components in spring wheat (Triticum aestivum L.) harvested in three regions of Kazakhstan. BMC Plant Biol. 2017, 17, 190. [Google Scholar]
  39. Huang, X.; Han, B. Natural variations and genome-wide association studies in crop plants. Annu. Rev. Plant Biol. 2014, 65, 531–551. [Google Scholar] [CrossRef]
  40. Yu, J.; Holland, J.B.; McMullen, M.D.; Buckler, E.S. Genetic design and statistical power of nested association mapping in maize. Genetics 2008, 178, 539–551. [Google Scholar]
  41. Gireesh, C.; Sundaram, R.M.; Anantha, S.M.; Pandey, M.K.; Madhav, M.S.; Rathod, S.; Yathish, K.R.; Senguttuvel, P.; Kayani, B.M.; Ranjith, E.; et al. Nested association mapping (NAM) populations: Present status and future prospects in the genomics era. Crit. Rev. Plant Sci. 2021, 40, 49–67. [Google Scholar] [CrossRef]
  42. Khan, H.; Krishnappa, G.; Kumar, S.; Mishra, C.N.; Krishna, H.; Devate, N.B.; Rathan, N.; Parkash, O.; Singh, G.P. Genome-wide association study for grain yield and component traits in bread wheat (Triticum aestivum L.). Front. Genet. 2022, 13, 982589. [Google Scholar] [CrossRef]
  43. Ren, D.; Fang, X.; Jiang, P.; Zhang, G.; Hu, J.; Wang, X.; Meng, Q.; Cui, W.; Lan, S.; Ma, X.; et al. Genetic architecture of nitrogen-deficiency tolerance in wheat seedlings based on a nested association mapping (NAM) population. Front. Plant Sci. 2018, 9, 845. [Google Scholar]
  44. Sallam, A.H.; Manan, F.; Bajgain, P.; Martin, M.; Szinyei, T.; Conley, E.; Brown-Guedira, G.; Muehlbauer, G.J.; Anderson, J.A.; Steffenson, B.J. Genetic architecture of agronomic and quality traits in a nested association mapping population of spring wheat. Plant Genome 2020, 13, e20051. [Google Scholar] [CrossRef]
  45. Basavaraddi, P.A.; Savin, R.; Sukumaran, S.; Reynolds, M.P.; Griffiths, S.; Slafer, G.A. Genotypic differences in wheat yield determinants within a NAM population based on elite parents. Eur. J. Agron. 2021, 123, 126223. [Google Scholar] [CrossRef]
  46. Donaire, G.; Vanzetti, L.S.; Conde, M.B.; Bainotti, C.; Mir, L.; Borrás, L.; Chicaiza, O.; Helguera, M. Dissecting genetic loci of yield, yield components, and protein content in bread wheat nested association mapping population. Euphytica 2023, 219, 65. [Google Scholar] [CrossRef]
  47. Wingen, L.U.; West, C.; Leverington-Waite, M.; Collier, S.; Orford, S.; Goram, R.; Yang, C.; King, J.; Allen, A.; Burridge, A.; et al. Wheat landrace genome diversity. Genetics 2017, 205, 1657–1676. [Google Scholar]
  48. Wingen, L.U.; Orford, S.; Goram, R.; Leverington-Waite, M.; Bilham, L.; Patsiou, T.S.; Ambrose, M.; Dicks, J.; Griffiths, S. Establishing the AE Watkins landrace cultivar collection as a resource for systematic gene discovery in bread wheat. Theor. Appl. Genet. 2014, 127, 1831–1842. [Google Scholar]
  49. Dospekhov, B. Methods of Field Experience; Kolos: Moscow, Russia, 1985. [Google Scholar]
  50. RStudio Team. RStudio: Integrated Development for R; RStudio. Inc.: Boston, FL, USA, 2015; Available online: http://www.maizegenetics.net/GAPIT (accessed on 20 January 2024).
  51. Covarrubias-Pazaran, G.; Martini, J.W.; Quinn, M.; Atlin, G. Strengthening public breeding pipelines by emphasizing quantitative genetics principles and open source data management. Front. Plant Sci. 2021, 12, 681624. [Google Scholar] [CrossRef]
  52. VSN International. The Guide to the Genstat Command Language (Release 20), Part 2 Statistics; VSN International: Hemel Hempstead, UK, 2019. [Google Scholar]
  53. Allen, A.M.; Barker, G.L.; Berry, S.T.; Coghill, J.A.; Gwilliam, R.; Kirby, S.; Robinson, P.; Brenchley, R.C.; D’Amore, R.; McKenzie, N.; et al. Transcript-specific. single-nucleotide polymorphism discovery and linkage analysis in hexaploid bread wheat (Triticum aestivum L.). Plant Biotechnol. J. 2011, 9, 1086–1099. [Google Scholar]
  54. Pritchard, J.K.; Stephens, M.; Donnelly., P. Inference of population structure using multilocus genotype data. Genetics 2000, 155, 945–959. [Google Scholar]
  55. Evanno, G.; Regnaut, S.; Goudet, J. Detecting the number of clusters of individuals using the software STRUCTURE: A simulation study. Mol. Ecol. 2005, 14, 2611–2620. [Google Scholar] [PubMed]
  56. Segura, V.; Vilhjálmsson, B.J.; Platt, A.; Korte, A.; Seren, Ü.; Long, Q.; Nordborg, M. An efficient multi-locus mixed-model approach for genome-wide association studies in structured populations. Nat. Genet. 2012, 44, 825–830. [Google Scholar] [PubMed]
  57. Lipka, A.E.; Tian, F.; Wang, Q.; Peiffer, J.; Li, M.; Bradbury, P.J.; Core, M.; Buckler, E.; Zhang, Z. GAPIT: Genome association and prediction integrated tool. Bioinformatics 2012, 28, 2397–2399. [Google Scholar] [PubMed]
  58. Yin, L.; Zhang, H.; Tang., Z.; Xu., J.; Yin., D.; Zhang., Z.; Yuan., X.; Zhu., M.; Zhao., S.; Li., X.; et al. rMVP: A memory-efficient, visualization-enhanced, and parallel-accelerated tool for genome-wide association study. Genom. Proteom. Bioinform. 2021, 19, 619–628. [Google Scholar]
  59. Voorrips, R.E. MapChart: Software for the graphical presentation of linkage maps and QTLs. J. Hered. 2002, 93, 77–78. [Google Scholar]
  60. Ensembl Plants. Available online: https://plants.ensembl.org/Triticum_aestivum/Info/Index (accessed on 15 February 2024).
  61. Zhang, J.; Hao, C.; Ren, Q.; Chang, X.; Liu, G.; Jing, R. Association mapping of dynamic developmental plant height in common wheat. Planta 2011, 234, 891–902. [Google Scholar] [CrossRef] [PubMed]
  62. Peng, Z.S.; Li, X.; Yang, Z.J.; Liao, M.L. A new reduced height gene found in the tetraploid semi-dwarf wheat landrace Aiganfanmai. Genet. Mol. Res. 2011, 10, 2349–2357. [Google Scholar] [CrossRef]
  63. Zhang, B.; Shi, W.; Li, W.; Chang, X.; Jing, R. Efficacy of pyramiding elite alleles for dynamic development of plant height in common wheat. Mol. Breed. 2013, 32, 327–338. [Google Scholar] [CrossRef]
  64. Shariatipour, N.; Heidari, B.; Tabmasebi, A.; Richards, C. Comparative genomic analysis of quantitative trait loci associated with micronutrient contents, grain quality, and agronomic traits in wheat (Triticum aestivum L.). Front. Plant Sci. 2021, 12, 709–817. [Google Scholar] [CrossRef]
  65. Amalova, A.; Yessimbekova, M.; Ortaev, A.; Rsaliyev, S.; Griffiths, S.; Burakhoja, A.; Turuspekov, Y.; Abugalieva, S. Association Mapping of quantitative trait loci for agronomic traits in a winter wheat collection grown in Kazakhstan. Agronomy 2023, 13, 2054. [Google Scholar] [CrossRef]
  66. Würschum, T.; Leiser, W.L.; Langer, S.M.; Tucker, M.R.; Longin, C.F.H. Phenotypic and genetic analysis of spike and kernel characteristics in wheat reveals long-term genetic trends of grain yield components. Theor. Appl. Genet. 2018, 131, 2071–2084. [Google Scholar] [CrossRef]
  67. Li, Y.; Tang, J.; Liu, W.; Yan, W.; Sun, Y.; Che, J.; Tian, C.; Zhang, H.; Yu, L. The genetic architecture of grain yield in spring wheat based on genome-wide association study. Front. Genet. 2021, 12, 728472. [Google Scholar] [CrossRef]
  68. Wang, J.S.; Liu, W.H.; Wang, H.; Li, L.H.; Wu, J.; Yang, X.M.; Li, X.; Gao, A. QTL mapping of yield-related traits in the wheat germplasm. Euphytica 2011, 177, 277–292. [Google Scholar] [CrossRef]
  69. Amalova, A.; Abugalieva, S.; Chudinov, V.; Sereda, G.; Tokhetova, L.; Abdikhalyk, A.; Turuspekov, Y. QTL mapping of agronomic traits in wheat using the UK Avalon× Cadenza reference mapping population grown in Kazakhstan. PeerJ 2021, 9, e10733. [Google Scholar] [CrossRef] [PubMed]
  70. Abugalieva, S. QTL analysis of productivity and its components in common wheat in the conditions of south-east Kazakhstan. Newsl. Kazakh Agrar. (Res. Results) 2007, 2, 35–40. (In Russian) [Google Scholar]
  71. Yuan, Q.; Deng, Z.; Peng, T.; Tian, J. QTL-based analysis of heterosis for number of grains per spike in wheat using DH and immortalized F 2 populations. Euphytica 2012, 188, 387–395. [Google Scholar] [CrossRef]
  72. Cui, F.; Zhao, C.; Li, J.; Ding, A.; Li, X.; Bao, Y.; Li, J.; Ji, J.; Wang, H. Kernel weight per spike: What contributes to it at the individual QTL level? Mol. Breed. 2013, 31, 265–278. [Google Scholar] [CrossRef]
  73. Cuthbert, J.L.; Somers, D.J.; Brûlé-Babel, A.L.; Brown, P.D.; Crow, G.H. Molecular mapping of quantitative trait loci for yield and yield components in spring wheat (Triticum aestivum L.). Theor. Appl. Genet. 2008, 117, 595–608. [Google Scholar] [CrossRef] [PubMed]
  74. Li, C.; Bai, G.; Carver, B.F.; Chao, S.; Wang, Z. Single nucleotide polymorphism markers linked to QTL for wheat yield traits. Euphytica 2015, 206, 89–101. [Google Scholar] [CrossRef]
  75. Jain, M.; Nijhawan, A.; Arora, R.; Agarwal, P.; Ray, S.; Sharma, P.; Kapoor, S.; Tyagi, A.K.; Khurana, J.P. F-box proteins in rice. Genome-wide analysis, classification, temporal and spatial gene expression during panicle and seed development, and regulation by light and abiotic stress. Plant Physiol. 2007, 143, 1467–1483. [Google Scholar] [CrossRef]
  76. Hong, M.J.; Kim, D.Y.; Kang, S.Y.; Kim, D.S.; Kim, J.B.; Seo, Y.W. Wheat F-box protein recruits proteins and regulates their abundance during wheat spike development. Mol. Biol. Rep. 2012, 39, 9681–9696. [Google Scholar] [CrossRef]
  77. Wang, L.; Shen, R.; Chen, L.T.; Liu, Y.G. Characterization of a novel DUF1618 gene family in rice. J. Integr. Plant Biol. 2014, 56, 151–158. [Google Scholar] [CrossRef]
  78. Shewry, P.R.; Halford, N.G. Cereal seed storage proteins: Structures, properties and role in grain utilization. J. Exp. Bot. 2002, 53, 947–958. [Google Scholar] [CrossRef]
  79. Wei, K.; Li, Y. Functional genomics of the protein kinase superfamily from wheat. Mol. Breed. 2019, 39, 1–23. [Google Scholar] [CrossRef]
  80. Collard, B.C.Y.; Mackill, D.J. Marker-assisted selection: An approach for precision plant breeding in the twenty-first century. Philos. Trans. R. Soc. B Biol. Sci. 2008, 363, 557–572. [Google Scholar] [CrossRef]
Figure 1. Distributions of average data for 290 RILs in the two regions: spike length (A), number of productive spikes (B), number of kernels per spike (C), weight kernel per spike (D), thousand kernels weight (E), and yield per m2 (F).
Agronomy 14 01848 g001
Figure 2. Pearson’s correlation index among average data of six studied traits associated with yield components in spring wheat nested association mapping population grown in the southeast (2021–2022) (A) and north (2020) (B) of Kazakhstan. Note: SL—spikes length (cm), NPS—number of productive spikes (pcs), NKS—number of kernels per spike (pcs), WKS—weight kernel per spike (g), TKW—thousand kernels weight (g), YM2—yield per m2 (g/m2). Correlations with p < 0.05 are highlighted in color. The color indicates a positive (blue) or negative (red) correlation.
Agronomy 14 01848 g002
Figure 3. GGE biplot for NKS (A), TKW (B), and YM2 (C) in the NAM population grown in the two studied regions. Note: RILs (genotype) are green in color, and directions of the region (environments) are blue.
Agronomy 14 01848 g003
Figure 4. Summary of identified marker-trait associations for six studied traits in the NAM population spring wheat based on field performance in the two regions: SPCGF (Scientific-Production Center for Grain Farming), Shortandy, in blue; KRIAPG (Kazakh Research Institute of Agriculture and Plant Growing), Almaty, in orange circles.
Agronomy 14 01848 g004
Figure 5. Manhattan and quantile–quantile plots (QQ) for the TKW in the genome-wide association studies panel phenotyped at Almaty region (A) and Akmola region (B). Note: 1 r—fist replication, 2 r—two replication, and av—average data two replications.
Agronomy 14 01848 g005
Figure 6. Manhattan and quantile–quantile plots (QQ) for the NKS in the genome-wide association studies panel phenotyped at Almaty region (A) and Akmola region (B). Note: 1 r—fist replication, 2 r—two replication, and av—average data two replications.
Agronomy 14 01848 g006
Table 1. Location, environment, and weather data for the two study regions in Kazakhstan.
Site/RegionKRIAPG (Almaty Region, Southeastern Kazakhstan)SPCGF (Akmola Region, Northern Kazakhstan)
Latitude/longitude43°21′/76°53′51°40′/71°00′
Soil typeLight chestnut (humus 2.0–2.5%)Southern carbonate chernozem (humus 3.6%)
ConditionsRainfedRainfed
Year202120222020
Annual rainfall, mm183250426
Mean temperature, °C21.822.219.2
Max temperature, °C27.426.520.7
Min temperature, °C12.416.717.6
Note: KRIAPG—Kazakh Research Institute of Agriculture and Plant Growing; SPCGF—Alexandr Barayev Scientific-Production Center for Grain Farming.
Table 2. Analysis of variance (ANOVA) results for studied traits associated with yield components of nested association mapping population grown in Kazakhstan.
TraitsFactorDfSum SqMean SqF-Valuehb2
SL, cmGenotype (G)2711209.84.55.52526.8%
Environment (E)22023.01011.51251.946
G:E540627.71.21.439
Residuals813656.90.8
NPS, pcsGenotype (G)27170.860.260.73421.4%
Environment (E)278.8439.42110.719
G:E 540161.490.300.84
Residuals813289.460.36
NKS, pcsGenotype (G)27134,8451292.80811.8%
Environment (E)252,23426,117570.299
G:E 54038,454711.555
Residuals81337,23146
WKS, gGenotype (G)27147.650.1762.88523.1%
Environment (E)258.4029.198479.062
G:E54050.630.0941.538
Residuals81349.550.061
TKW, gGenotype (G)27122,0128110.00337.8%
Environment (E)217,07085351051.107
G:E 54012,535232.859
Residuals81366028
YM2, g/m2Genotype (G)2718,347,00630,8015.7615.0%
Environment (E)228,891,64114,445,8212701.583
G:E 54013,998,64725,9234.848
Residuals8134,347,2485347
Note: SL, cm—spikes length, NPS, pcs—number of productive spikes, NKS, pcs—number of kernels per spike, WKS, g—weight kernel per spike, TKW, g—thousand kernels weight, YM2, g/m2—yield per m2.
Table 3. The list of RILs of the spring wheat NAM population showed the best average values for three yield components, NKS, TKW, and YM2, in the two regions.
Kazakh Research Institute of Agriculture and Plant Growing (Almaty region)
RILsNKS, pcsRILsTKW, gRILsYM2, g
NAM-04949.33NAM-00235.38NAM-032388.23
NAM-08150.25NAM-04535NAM-081374.96
NAM-09449.33NAM-06936.13NAM-141348.84
NAM-26149.17NAM-16438.43NAM-163374.72
NAM-26649.92NAM-17533.5NAM-198384.97
NAM-26849.92NAM-19733.5NAM-272337.09
NAM-27350.17NAM-19836.6NAM-273357.77
NAM-28449.67NAM-20534.85NAM-274389.95
NAM-29549.42NAM-20734.78NAM-276342.94
NAM-29952.00NAM-20833.45NAM-290334.07
NAM-30750.92NAM-22036.4NAM-299400.58
NAM-32651.42NAM-30835.05NAM-300381.67
Kaz 435.33Kaz 429.80Kaz 4333.66
Min *22.46Min *18.30Min *47.08
Max *52.00Max *38.43Max *400.58
Mean ± SE *39.25 ± 0.34Mean ± SE *27.33 ± 0.21Mean ± SE *226.82 ± 3.81
Alexandr Barayev Scientific-Production Center for Grain Farming (Shortandy region)
RILsNKS, pcsRILsTKW, gRILsYM2, g
NAM-01148.2NAM-04743.5NAM-168755.4
NAM-06546.1NAM-16443.3NAM-193758.6
NAM-19344.5NAM-19745.5NAM-272745.5
NAM-25543.2NAM-19842NAM-2751069.3
NAM-26244.4NAM-20550NAM-282834
NAM-26646.4NAM-20641.9NAM-297770.4
NAM-29448.3NAM-20741.8NAM-318739.2
NAM-29744.6NAM-22342.4NAM-321756
NAM-33344NAM-28644.7NAM-328794.2
NAM-33446NAM-30342.7NAM-333762
Astana27.6Astana37.32Astana382.13
Min *15.70Min *11.97Min *32.73
Max *48.25Max *50.03Max *1069.32
Mean ± SE *31.40 ± 0.35Mean ± SE *32.91 ± 0.33Mean ± SE *387.33 ± 9.91
Note: * average data on NAM population.
Table 4. Effects of QTL for NKS on yield-related traits at the KRIAPG and SPCGF sites.
QTLChrAlleleKRIAPGSPCGF
NKS, pcsTKW, gYM2, g/m2NKS, pcsTKW, gYM2, g/m2
QNKS.ta.NAM.ipbb-1A.11AG−1.360.03−12.38−0.230.3216.91
QNKS.ta.NAM.ipbb-1A.21AG0.63−0.02−2.010.52−0.30−2.15
QNKS.ta.NAM.ipbb-1B.11BA1.43−0.33−3.040.29−0.07−4.27
QNKS.ta.NAM.ipbb-1B.21BG−11.07−2.88−122.07−1.925.0951.48
QNKS.ta.NAM.ipbb-1B.31BC−0.970.355.18−0.130.01−10.38
QNKS.ta.NAM.ipbb-3A3AA1.260.055.430.09−0.115.05
QNKS.ta.NAM.ipbb-4A.14AC−0.320.0419.55−1.040.10−12.74
QNKS.ta.NAM.ipbb-4A.24AG−0.810.413.77−1.330.57−1.56
QNKS.ta.NAM.ipbb-4D4DG−2.69−0.38−131.003.88−0.9691.71
QNKS.ta.NAM.ipbb-5A5AA0.260.5515.58−0.680.48−3.43
QNKS.ta.NAM.ipbb-5B5BT−0.010.154.94−0.810.24−6.99
QNKS.ta.NAM.ipbb-6A6AA0.420.08−9.160.490.431.60
QNKS.ta.NAM.ipbb-6B.16BT−0.040.01−1.69−0.87−0.07−4.40
QNKS.ta.NAM.ipbb-6B.26BT0.63−0.39−9.550.530.223.08
QNKS.ta.NAM.ipbb-6B.36BG0.50−0.09−0.381.390.111.74
QNKS.ta.NAM.ipbb-7A7AC−0.590.01−6.40−0.270.10−4.73
QNKS.ta.NAM.ipbb-UNKUNKC−0.79−0.15−1.86−0.240.06−5.42
Note: Chr—chromosome; UNK—unknown chromosome; KRIAPG—Kazakh Research Institute of Agriculture and Plant Growing; SPCGF—Alexandr Barayev Scientific-Production Center for Grain Farming.
Table 5. Effects of QTL for TKW on yield-related traits at the KRIAPG and SPCGF sites.
QTLChrAlleleKRIAPGSPCGF
NKS, pcsTKW, gYM2 g/m2NKS, pcsTKW, gYM2 g/m2
QTKW.ta.NAM.ipbb-4A4AG0.05−1.10−4.860.32−1.33−21.06
QTKW.ta.NAM.ipbb-5A.15AG−0.29−0.54−13.840.64−0.501.53
QTKW.ta.NAM.ipbb-5A.25AC0.82−0.182.930.73−0.68−3.01
QTKW.ta.NAM.ipbb-6A.16AA0.63−0.794.430.27−0.93−5.20
QTKW.ta.NAM.ipbb-6A.26AG−1.320.96−13.49−0.371.190.61
QTKW.ta.NAM.ipbb-6A.36AA0.67−0.754.150.23−0.625.49
QTKW.ta.NAM.ipbb-6A.46AC−0.821.07−17.28−0.490.61−10.99
QTKW.ta.NAM.ipbb-6B.16BA−0.600.9221.02−0.380.34−7.11
QTKW.ta.NAM.ipbb-7A.17AC−0.820.0611.160.010.6614.24
QTKW.ta.NAM.ipbb-UNKUNKG2.88−2.4924.27−5.43−9.77−148.38
Note: Chr—chromosome; UNK—unknown chromosome; KRIAPG—Kazakh Research Institute of Agriculture and Plant Growing; SPCGF—Alexandr Barayev Scientific-Production Center for Grain Farming.
Disclaimer/Publisher’s Note: The statements, opinions and data contained in all publications are solely those of the individual author(s) and contributor(s) and not of MDPI and/or the editor(s). MDPI and/or the editor(s) disclaim responsibility for any injury to people or property resulting from any ideas, methods, instructions or products referred to in the content.

