Abstract
Blueberries are one of the more economically rewarding fruits for fruit growers. Identifying blueberry fruit at different stages of maturity is economically important and can aid fruit growers in planning pesticide applications, estimating yields, and efficiently conducting harvesting operations, among other benefits. Visual methods for identifying the different ripening stages of fruits are increasingly receiving widespread attention. However, due to the complex natural environment and the serious shading caused by the growth characteristics of blueberries, the accuracy and efficiency of blueberry detection are reduced to varying degrees. To address the above problems, in the study presented herein, we constructed an improved YOLOv9c detection model to accurately detect and identify blueberry fruits at different ripening stages. The size of the network was reduced by introducing the SCConv convolution module, and the detection accuracy of the network in complex and occluded environments was improved by introducing the SE attention module and the MDPIoU loss function. Compared to the original model, the mAP0.5 and mAP0.5:0.95 of the improved YOLOv9c network improved by 0.7% and 0.8%, respectively. The model size was reduced by 3.42 MB, the number of model parameters was reduced by 1.847 M, and the detection time of a single image was reduced by 4.5 ms. The overall performance of the detection model was effectively improved to provide a valuable reference for accurate detection and localization techniques for agricultural picking robots.
1. Introduction
Blueberries are the world’s second most economically significant soft fruit, and global blueberry production has expanded in recent years [1]. Blueberries have been grown in China on a large scale since the beginning of the 21st century, and the country is a major blueberry grower in the Asia–Pacific region [2]. At present, the total area of blueberry cultivation in China stands at 55,900 m2, with output as high as 190,000 t. However, due to the inconsistent ripening period of blueberry fruits, blueberry picking operations are expensive [3]. With the development of artificial intelligence technology, the application of intelligent detection technology will promote the improvement of detection efficiency and savings in terms of labor costs to a certain extent. However, the complex growth environment around blueberry fruits and the dense occlusion between fruits affect the collection of blueberry feature information in the detection image to varying degrees. This issue results in a reduction in detection accuracy and efficiency and also creates a hurdle to the automatic harvesting of blueberries. Therefore, it is of great significance to improve the harvesting quality and efficiency of blueberry fruits by reducing the interference to blueberry identification caused by complex backgrounds and dense occlusion environments in order to quickly and accurately identify blueberry fruits and provide information on the distribution of blueberry ripeness [4].
Progress has been made by researchers related to the damage, disease, ripening, and quantification of blueberries. Craig B. MacEachern et al. developed six deep learning artificial neural network models for the detection of ripening stages in wild blueberries using YOLOv3, YOLOv3-SPP, YOLOv3-Tiny, YOLOv4, YOLOv4-Small, and YOLOv4-Tiny, in addition to developing yield estimation models. Among the models, YOLOv4 performs the best with an average accuracy rate of 88.12%. YOLOv4-Tiny has the smallest load, with an average inference time of 7.8 ms for a single 1280 × 736-pixel image and an average memory usage of 1.63 GB. YOLOv4-Small has the smallest variance in accuracy among the nonlinear regression yield prediction models, with an average absolute error of 24.1% [5]. Gabriel A. Leiva-Valenzuela et al. proposed a pattern recognition method for automatically distinguishing between blueberry stems and calyx ends for the detection of damaged berries. The average detection performance of the classifier exceeded 97%, 93.3%, and 86% in evaluating fungal rot and dried and mechanically damaged blueberries, respectively. All experiments relied on characterization images for evaluation with a confidence level of 95% [6]. Kezhu Tan et al. developed step-by-step algorithms to identify blueberry ripeness. First, a linear SVM classifier was trained using HOG feature vectors to rapidly detect fruit sample regions, and LAB color space filtering features were used to discard non-fruit regions. Lastly, a TMWE classifier was used to ascertain the ripeness of fruits, with it able to provide relatively high accuracy with low computational cost. The results show that this research method is effective in identifying blueberry fruits of different ripeness levels using color images in outdoor settings [7]. Hao Ma et al. used hyperspectral imaging to identify the different growth stages of blueberries in the field. On an experimental basis, the detection accuracy was 82.1% using a SAM classifier for all spectral bands, 88.5% using an MLR classifier for selected bands, and 89.8% using a decision tree with a spectral index. The results show that the normalized spectral index reduces both the computational complexity and the effect of the in-field noise background [8]. Cristhian A. Aguilera et al. conducted a comprehensive analysis of errors in blueberry detection and ripeness classification models to identify limitations of agricultural detection and suggest future improvements. In their study, they evaluated deep learning models, such as YOLOv7, RT-DETR, and Mask-RCNN, for the detection and classification of blueberries. Type-Influence Detector Error (TIDE) analysis was utilized in the study. The authors found that partial occlusion usually leads to errors, and optimizing these models with embedded devices can improve speed without degrading accuracy. The results presented in this particular study deepen our understanding of object detection models for blueberry detection and ripeness estimation [9]. Feng Xiao and colleagues introduced a streamlined approach leveraging an enhanced YOLOv5 algorithm to ensure precise, swift, and reliable identification of blueberry ripeness stages. Their solution incorporates a lightweight deep convolutional neural network fortified with the ShuffleNet module, together with a Convolutional Block Attention Module (CBAM) to bolster feature integration capabilities. To validate its efficacy, they employed a blueberry fruit dataset, yielding promising outcomes. The system demonstrated robust detection of blueberries in orchards, accurately distinguishing their ripeness levels, with an average recall rate of 92.0%. Moreover, the system achieved a mean average precision (mAP) of 91.5% at an IoU threshold of 0.5, executing detections at an impressive average speed of 67.1 frames per second (fps) [10]. Wenji Yang and colleagues aimed to enhance localization precision by developing a blueberry recognition model leveraging an enhanced YOLOv5 framework. They initiated their model by compiling a comprehensive blueberry dataset. Subsequently, they incorporated an NCBAM, their refined attention module, into the backbone network to bolster its capacity for extracting salient blueberry features. Additionally, they appended a small target detection layer to fortify the model’s multi-scale recognition abilities for blueberries. Lastly, they introduced the C3Ghost module into the backbone, achieving a reduction in model parameters while maintaining robust multi-scale recognition capabilities. To validate the model’s efficacy, experiments were performed on an in-house blueberry dataset, yielding an impressive mAP of 83.2%, surpassing the original network’s performance by 2.4 percentage points under published conditions. The above findings underscore the advantageous nature of the proposed approach in enhancing the recognition accuracy of the blueberry model [11]. To enhance the efficiency of blueberry harvesting, Yang and colleagues introduced an advanced, detail-centric blueberry ripeness detection model. They crafted an Enhanced Detail Feature Module (EDFM) to bolster the model’s capacity for extracting intricate features. By integrating a Receptive Field Block (RFB) module, they addressed the model’s limitations in sensory perception and reduced its computational demands. Furthermore, the MaxPool (MP) module underwent a redesign to empower the network to efficiently acquire richer feature information. Lastly, an efficient upsampling technique was employed, enabling the network to consolidate contextual data from an expanded receptive field and learn additional features, thereby enhancing the model’s detection performance. Experimental outcomes showed that the proposed network attained a mean average precision (mAP) of 80.7%, surpassing that of the original network by 3.2% and demonstrating superior performance in comparison with other widely used target detection network models [12]. Aiming to streamline blueberry harvesting processes, Sebastian Gonzalez and colleagues introduced an object recognition and instance segmentation framework, leveraging Mask R-CNN architecture and investigating various backbone networks. Notably, the ResNet50 backbone emerged as the most effective, yielding optimal performance as evidenced by an mIoU score of 0.726 and mAP scores of 0.909 and 0.774 for IoU thresholds of 0.5 and 0.7, respectively. This approach signifies a significant advancement in accurately quantifying the number of blueberries per image, thereby facilitating automated harvesting processes [13]. In order to determine the best timing to carry out harvesting, Dokil Pyoun et al. designed a target detection-based ripeness measurement system for blueberry fruits. They measured, analyzed, and predicted these data using artificial intelligence to monitor the growth status of the fruit trees and proposed an algorithm to predict the right time to harvest the fruit trees. In addition, a web application can be used to monitor the entire process of the growth measurement environment and indicate the best harvest prediction time [14]. To achieve automatic detection of decayed blueberries, Shicheng Qiao et al. proposed an improved deep residual three-dimensional convolutional neural network (3D-CNN) framework for hyperspectral image classification for rapid training, classification, and parameter optimization. Experimental results on a standard hyperspectral blueberry dataset show that the proposed framework improves classification accuracy compared to AlexNet and GoogleNet. In addition, their proposed network reduces the number of parameters by half and the training time by roughly 10% [15]. To identify early-stage diseases in blueberries, Yuping Huang and colleagues devised a Partial Least-Squares Discriminant Analysis (PLSDA) model, leveraging two spectral domains: the comprehensive wavelength spectrum spanning 400 to 1000 nm and the narrower electronic spectrum of 685 to 1000 nm. Their findings revealed that refining the spectral scope by dismissing irrelevant variables yields superior classification outcomes. Furthermore, by integrating the electronic spectral range with an automated scaling preprocessing approach, the study authors achieved peak classification precision, with a perfect 100% accuracy for healthy blueberries and an impressive 99% for those in the early stages of disease. The findings of this study underscore the practicality of utilizing hyperspectral imaging to detect early disease manifestations in blueberries [16]. To achieve blueberry bruise detection, Yu Jiang et al. developed an algorithm to automatically calculate the bruise ratio index (the ratio of bruises to the entire fruit area), which has been used for bruise quantification. A support vector machine (SVM) was used to classify the spectra of the region of interest (ROI). The accuracy of the algorithm on the training set, independent test set, and combined set exceeded 94%, 92%, and 96%, respectively. Statistical results showed that the ratio index is comparable to the measured ruggedness; however, in terms of the effect on the quantification of bruising, the bruising ratio index has a strong correlation with the human assessment results (R2 = 0.5%). The proposed method and the bruise ratio index can be effective for the non-destructive detection and quantification of blueberry bruises [17].
Although deep learning technology has been applied and developed in the field of blueberry object detection, problems persist, such as insufficient detection accuracy and slow detection speed, and the performance of various related detection models still has great room for improvement. In view of the above challenges and inspirations, we used the YOLOv9 target detection network to identify and detect wild blueberries of contrasting ripeness in a complex and strongly occluded environment. YOLOv9 is a new version of the YOLO series of object detection networks, with powerful object detection performance. In the publicly available version, YOLOv9c is widely used, with good recognition accuracy and better detection performance; thus, YOLOv9c was used as the baseline network in the present study. In order to improve the detection performance of the model in complex backgrounds, we analyzed and tested different attention mechanisms and ultimately selected the SE attention module to have the best recognition effect in improving the network. Simultaneously, after introducing the SCConv module into the RepNCSPELAN4 module in the YOLOv9c backbone network, the number of network parameters was effectively reduced while ensuring the accuracy of model detection, and the operation efficiency of the detection model improved. In addition, in order to solve the problem of mutual occlusion of blueberries, we introduced the MDPIoU loss function to promote the effectiveness of the network detection of overlapping fruits and improve the distortion of the network detection frame. On the premise of ensuring recognition accuracy, we optimized and improved the detection network according to the characteristics of wild blueberry targets and improved the detection performance of the network model. The results presented herein can simultaneously provide a technical reference for the development of blueberry industrialization and promote the future economic development of the blueberry industry.
The main contributions of the present paper are:
- A blueberry image dataset containing three maturity levels and targets of different sizes with complex backgrounds and occlusion environments is constructed, and the original data are additionally extended using data enhancement techniques in order to improve the richness of the data and the robustness of the network.
- By analyzing the structural characteristics of the YOLOv9c backbone network, the RepNCSPELAN4 module is redesigned to obtain a new module, RepNCSPELAN4-S. The spatial and channel redundancy between features in the network is eliminated, and the CNN is compressed so as to improve network performance.
- By introducing the attention mechanism, the feature extraction ability of the network is strengthened, and the network is highly condensed to the features of blueberries in the dimension of the channel, which improves the recognition ability of the network for blueberry detection without significantly increasing the size of the network.
- By improving the loss function of the network, it promotes the effective degree of the network on overlapping fruit detection, improves the distortion phenomenon of the network detection frame, and reduces the occurrence of the problem of blueberry leakage detection.
- By fusing RepNCSPELAN4-S, the SE attention mechanism, and MDPIOU, a blueberry ripeness detection model based on YOLOv9c is proposed, which provides a valuable reference for the blueberry industry to implement automatic picking technology in the future.
2. Data Collection and Processing
2.1. Data Collection
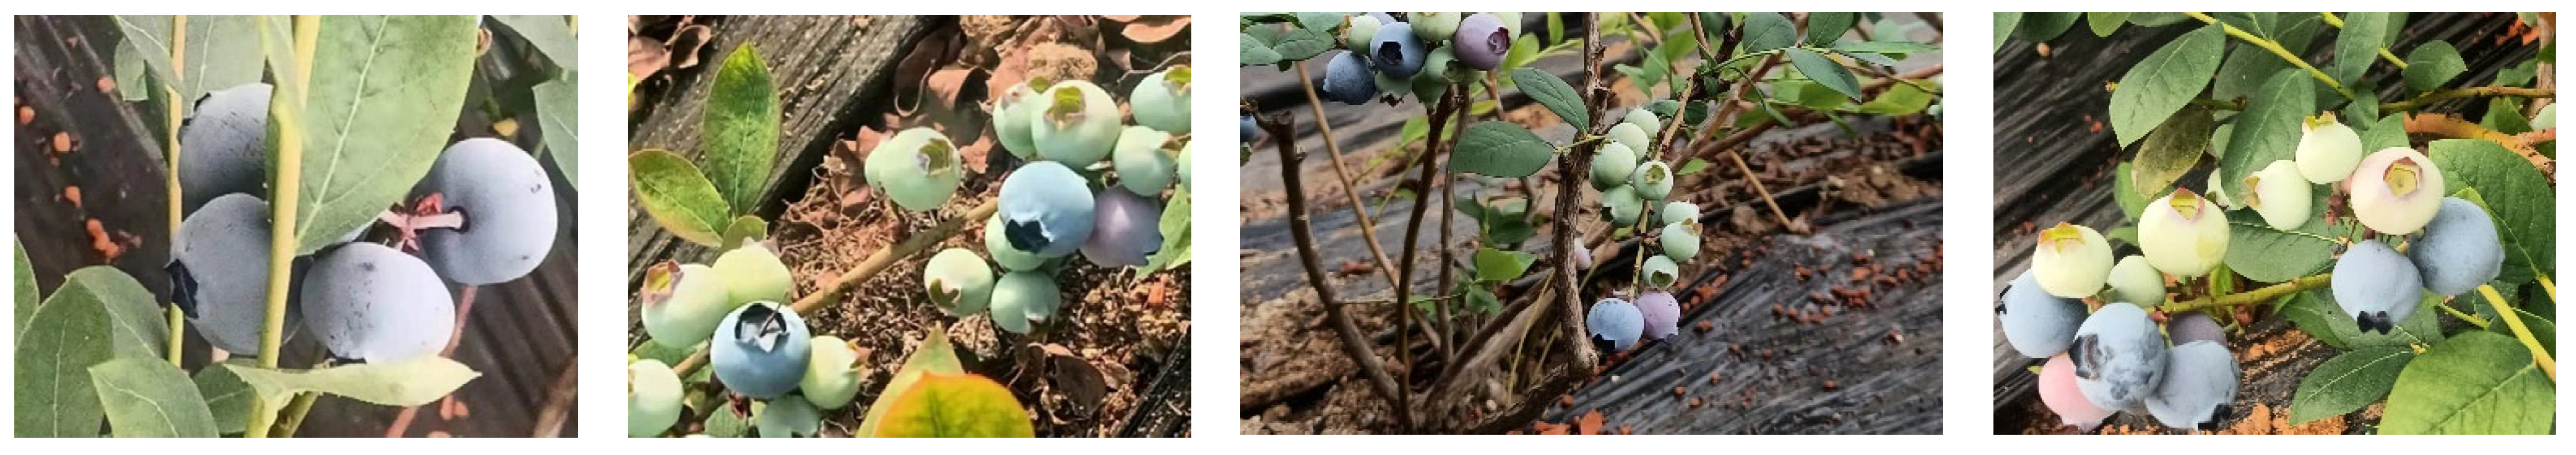
The blueberry images used in the present study were collected in a blueberry picking garden in Dandong City, Liaoning Province, China, under relatively good conditions, with sufficient light, and the temperature at the time of the study was around 22 °C. A mobile phone (Made in Shenzhen, China) was used to take images of blueberry fruit clusters at distances ranging from 20 cm to 50 cm, and a total of 349 pieces of raw image data were collected with a resolution of 1280 × 1562 pixels, with the images saved in .jpg format. The constructed blueberry dataset contains images of blueberries with branch and leaf occlusion, inter-fruit occlusion, complex backgrounds, and different maturity levels at different shooting distances. Most of the blueberries in all images were small- and medium-sized targets, and some smaller targets with strong occlusion were also included. Blueberries ripened in batches, usually with one to three maturity levels of blueberries in each cluster, i.e., ripe fruits, semi-mature fruits, and immature fruits. The number of mature, semi-mature, and immature blueberry fruits was counted in the dataset in a ratio of approximately 4:4:2. Of the fruits, immature fruits were close to the branch and leaf color, and mature fruits were close to the soil color, as shown in Figure 1.
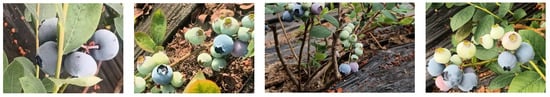
Figure 1.
Images of blueberries in their natural environment.
2.2. Data Preprocessing
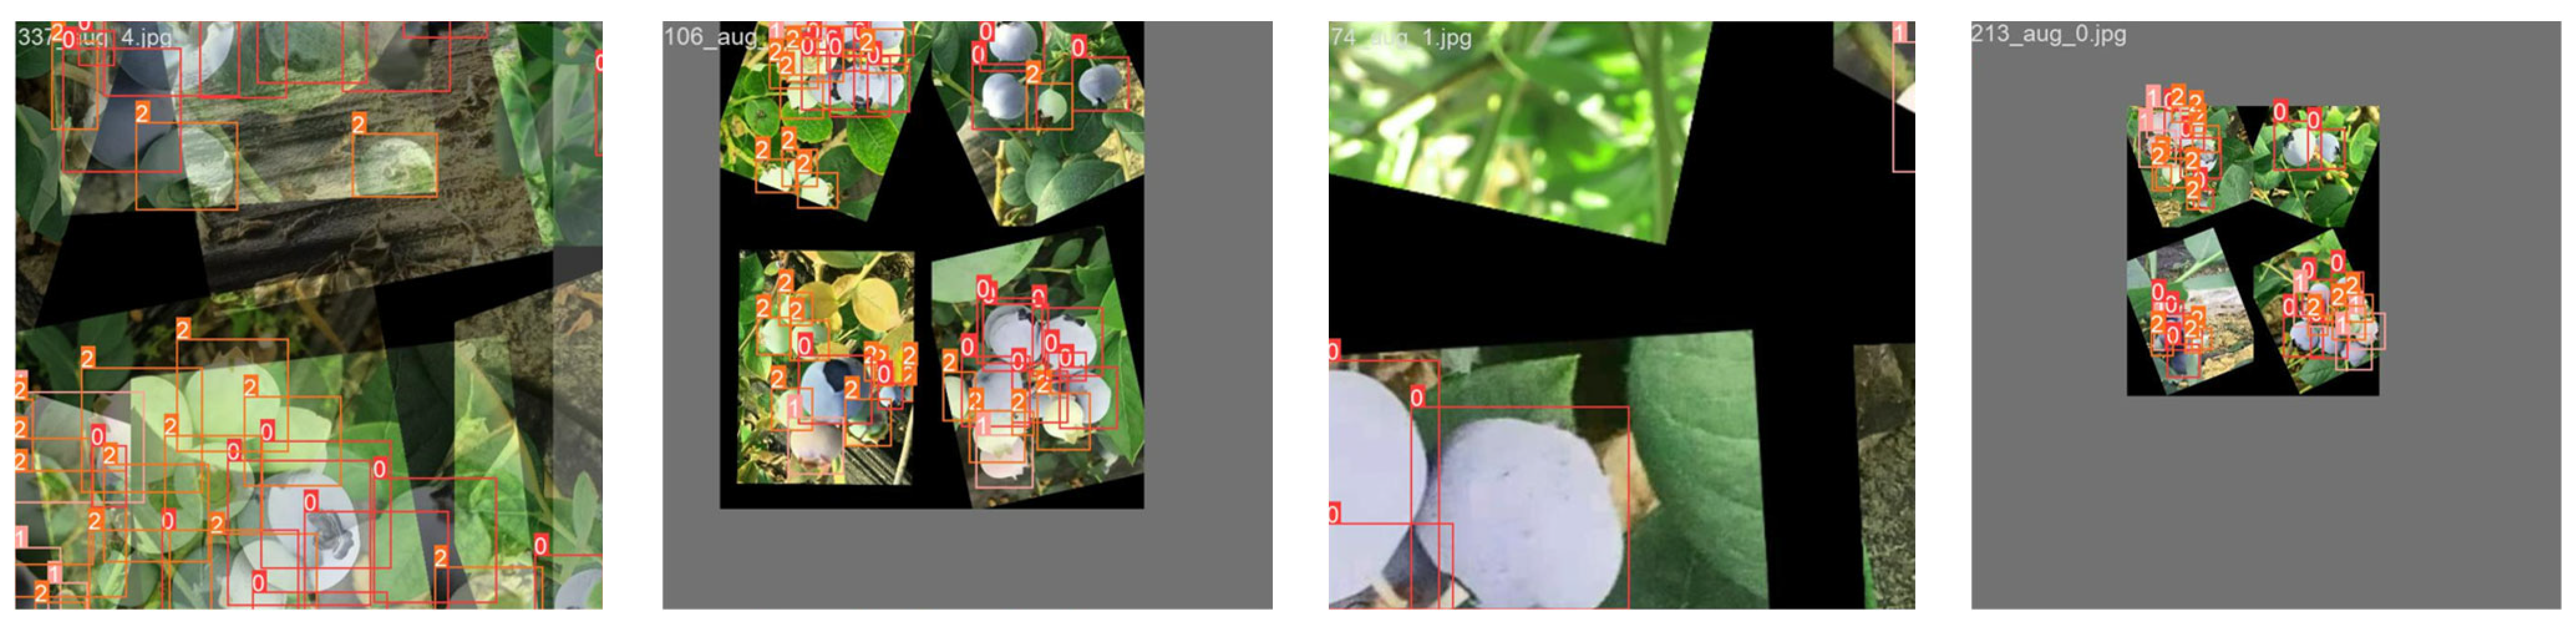
In the study presented herein, the annotation tool labelImg was used to annotate the images based on the annotation format of the PascalVOC dataset, generating an annotation file of type .txt. Training a deep neural network requires a large amount of data, and a dataset that is too small cannot adequately train the network; thus, data enhancement of the acquired data is required [18]. In the present study, data enhancement was performed on the captured blueberry images using flipping, scaling, panning, rotating, and blending methods, as detailed in Figure 2.
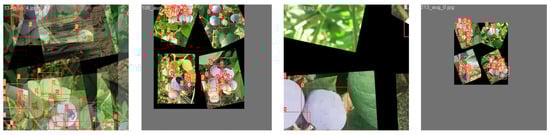
Figure 2.
Data-enhanced blueberry image.
In addition, we performed simultaneous transformations of the corresponding annotation files for each image, augmented the sample set of images to 1744, and randomly divided them into the training set (1221), validation set (349), and test set (174) according to the ratio of 7:2:1. The distribution of the dataset is shown in Table 1.

Table 1.
Division of the blueberry dataset.
3. Network Modeling Structure and Improvements
3.1. YOLOv9c Detection Network
There are two main classes of deep learning-based target detection methods: the first is a two-stage target detection algorithm based on region suggestions, such as R-CNN [19], Fast R-CNN [20], and Faster R-CNN [21]; the second category is regression-based one-stage target detection algorithms such as YOLO [22,23,24], RetinaNet [25], and EfficientDet [26]. The first regression-based target detection algorithm, YOLOv1, has received considerable attention from researchers since it was proposed by Redmon [23] in 2016. As of 2024, the YOLO family of networks has been updated to the ninth generation, and YOLOv9 [27] has good detection performance following validation on standard datasets. However, in the growing environment of wild blueberries, interference caused by complex background information is more serious, and simultaneously, there is the issue of the mutual occlusion of fruits; therefore, the accuracy and real-time requirements of the network model for detecting blueberries are high.
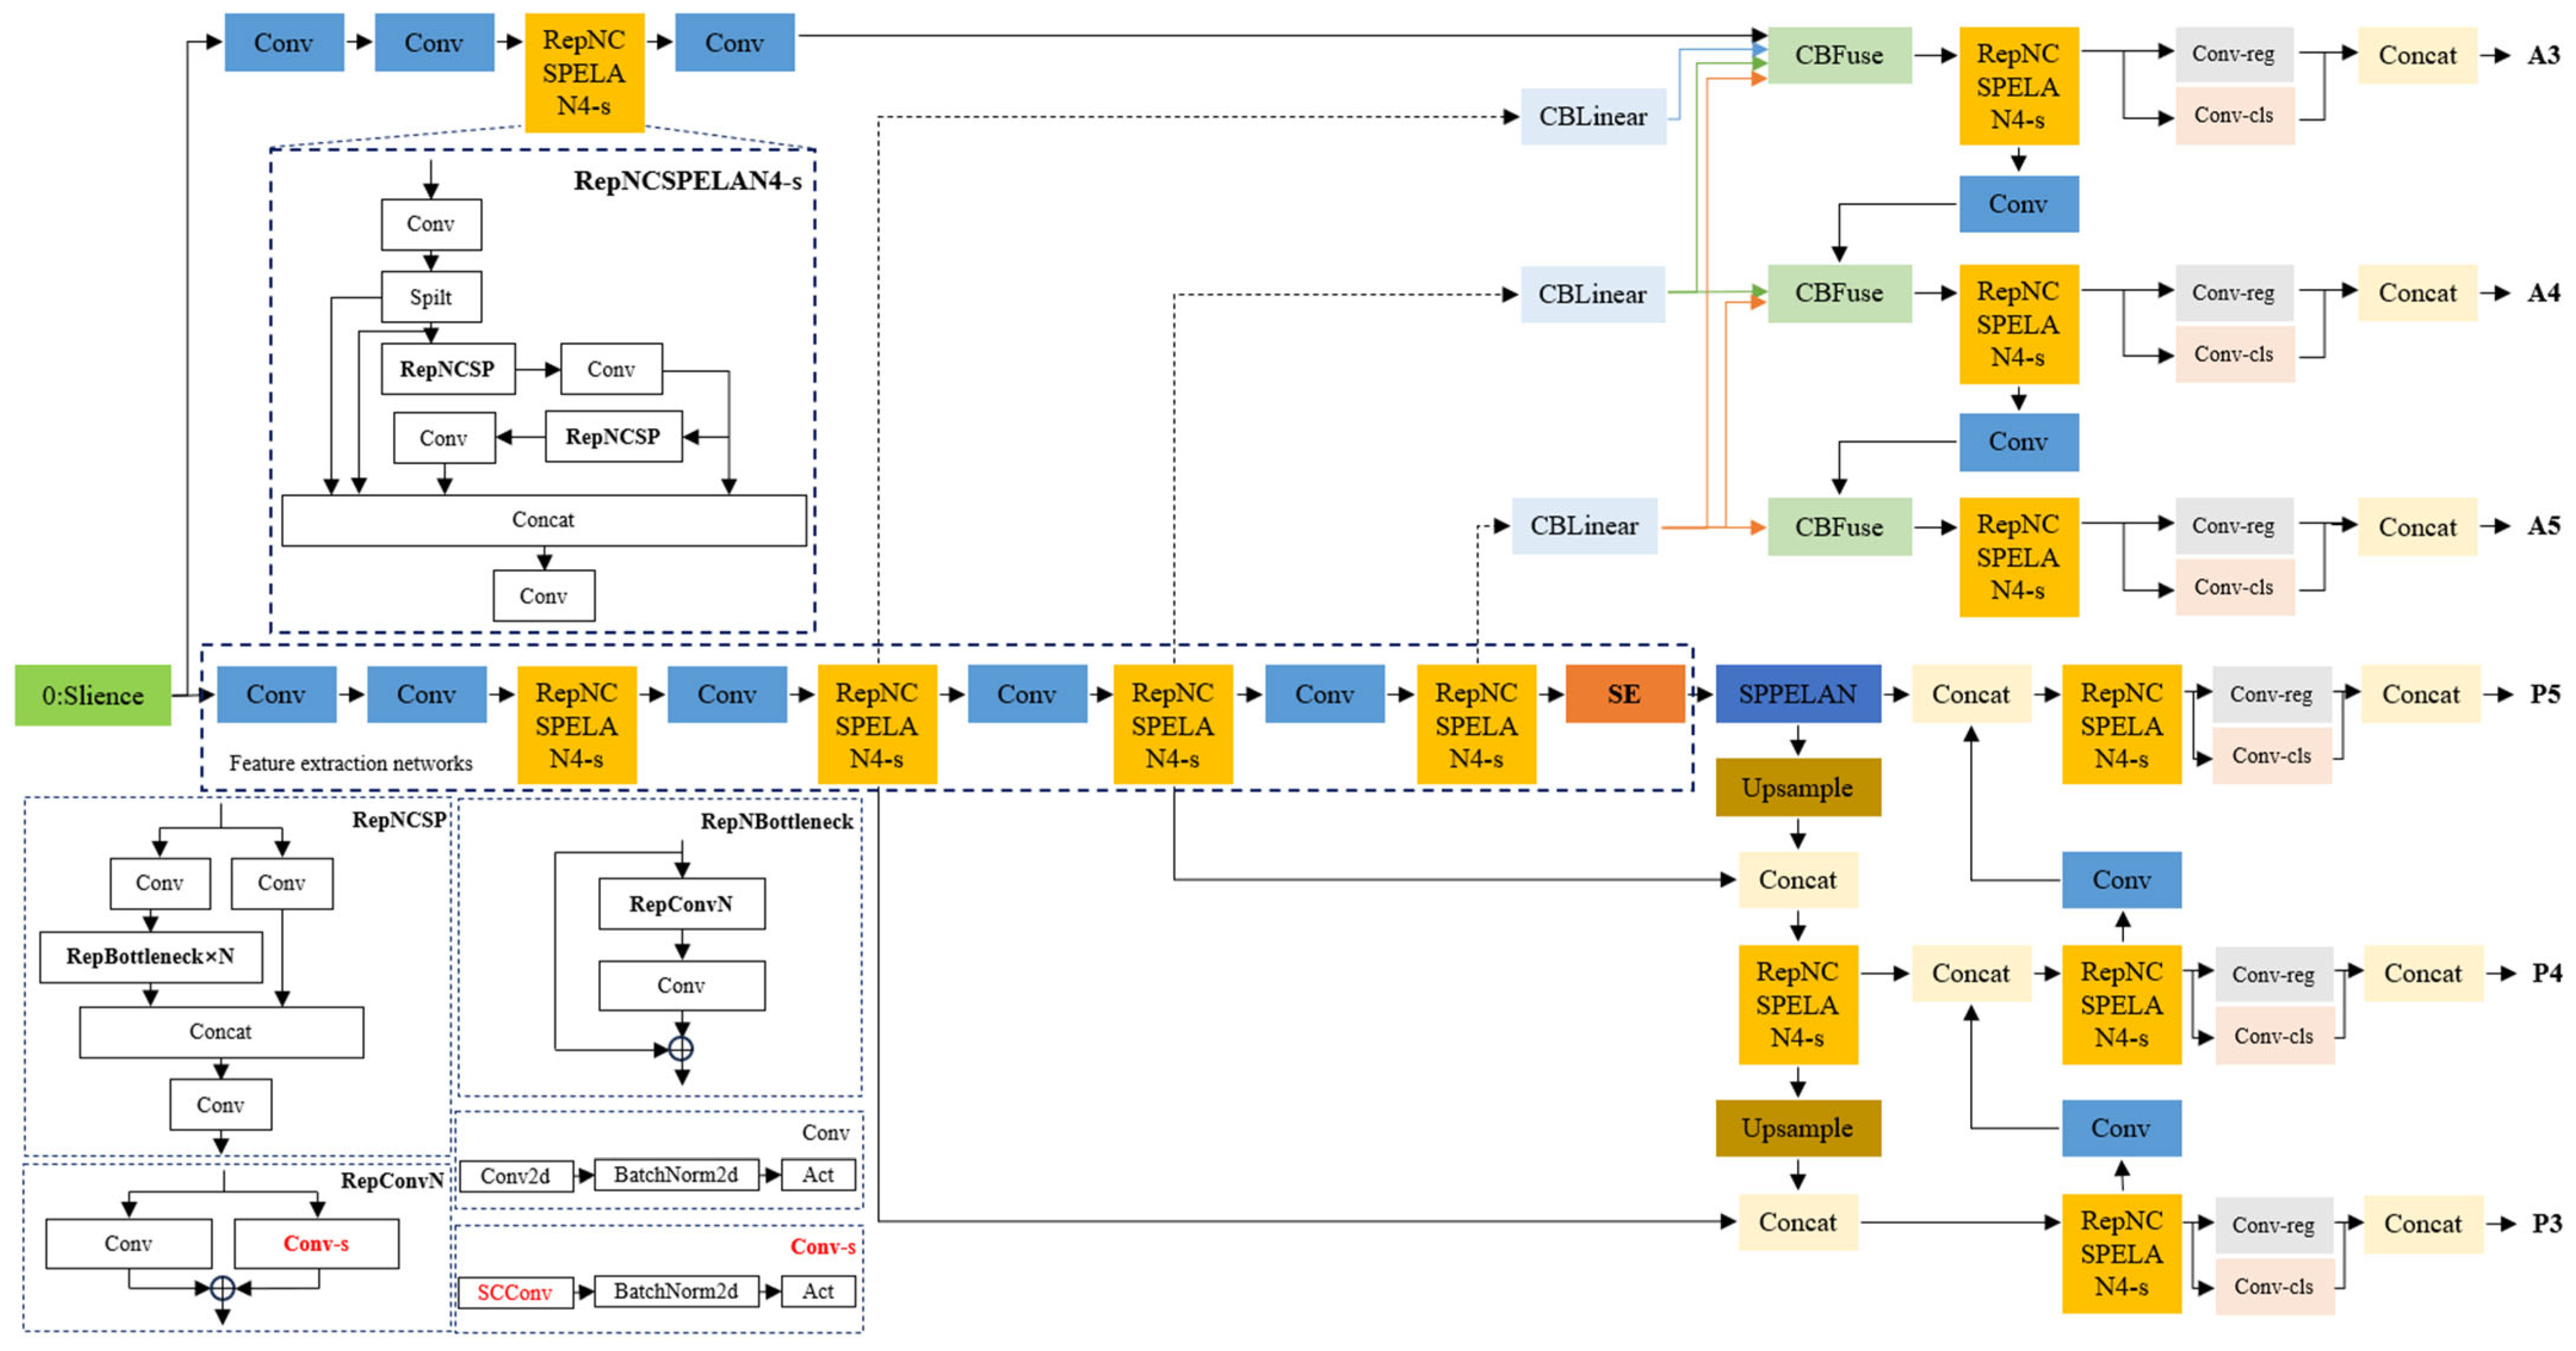
YOLOv9 is a new version of the YOLO series of target detection networks with powerful object detection performance. The publicly available version of YOLOv9c has better recognition accuracy and better detection performance; thus, YOLOv9c was used as the baseline network in the present study. In addition, under the premise of guaranteeing recognition accuracy, the network structure was improved for the wild blueberry target detection characteristics in order to improve the performance of the model in recognizing and detecting blueberries in complex and heavily occluded environments. The results are mainly reflected in the following three aspects: Firstly, in order to reduce the number of model parameters and accelerate network inference, we improved the structure of RepNCSPELAN4 in the backbone network; the Conv block in the RepConvN module under the RepNCSPELAN4 module is replaced by the Conv-s block, which consists of the SCConv convolution module, the BatchNorm2d module, and the activation function [28]. SCConv reduces redundant features in the network and reduces the computational complexity of the network compared to regular Conv. The improved RepNCSPELAN4 module is named RepNCSPELAN4-S. Secondly, in order to enhance the network’s anti-interference ability against complex background information, the SE attention module, a channel attention mechanism, is introduced in the feature extraction component of the network [28]. In addition, by introducing the MDPIoU loss function [29], the inference speed of the network in addition to the performance of bounding box regression is further improved, and the network’s anti-interference ability against occlusions is strengthened. The improved network structure is shown in Figure 3.
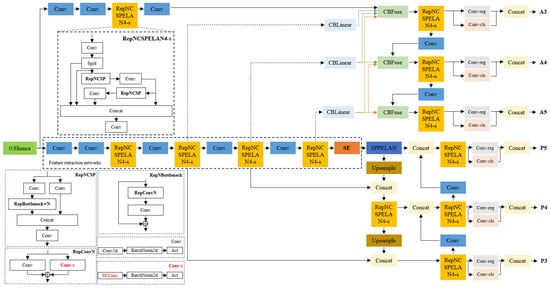
Figure 3.
Improved YOLOv9c network structure diagram.
3.2. SCConv Convolution Module
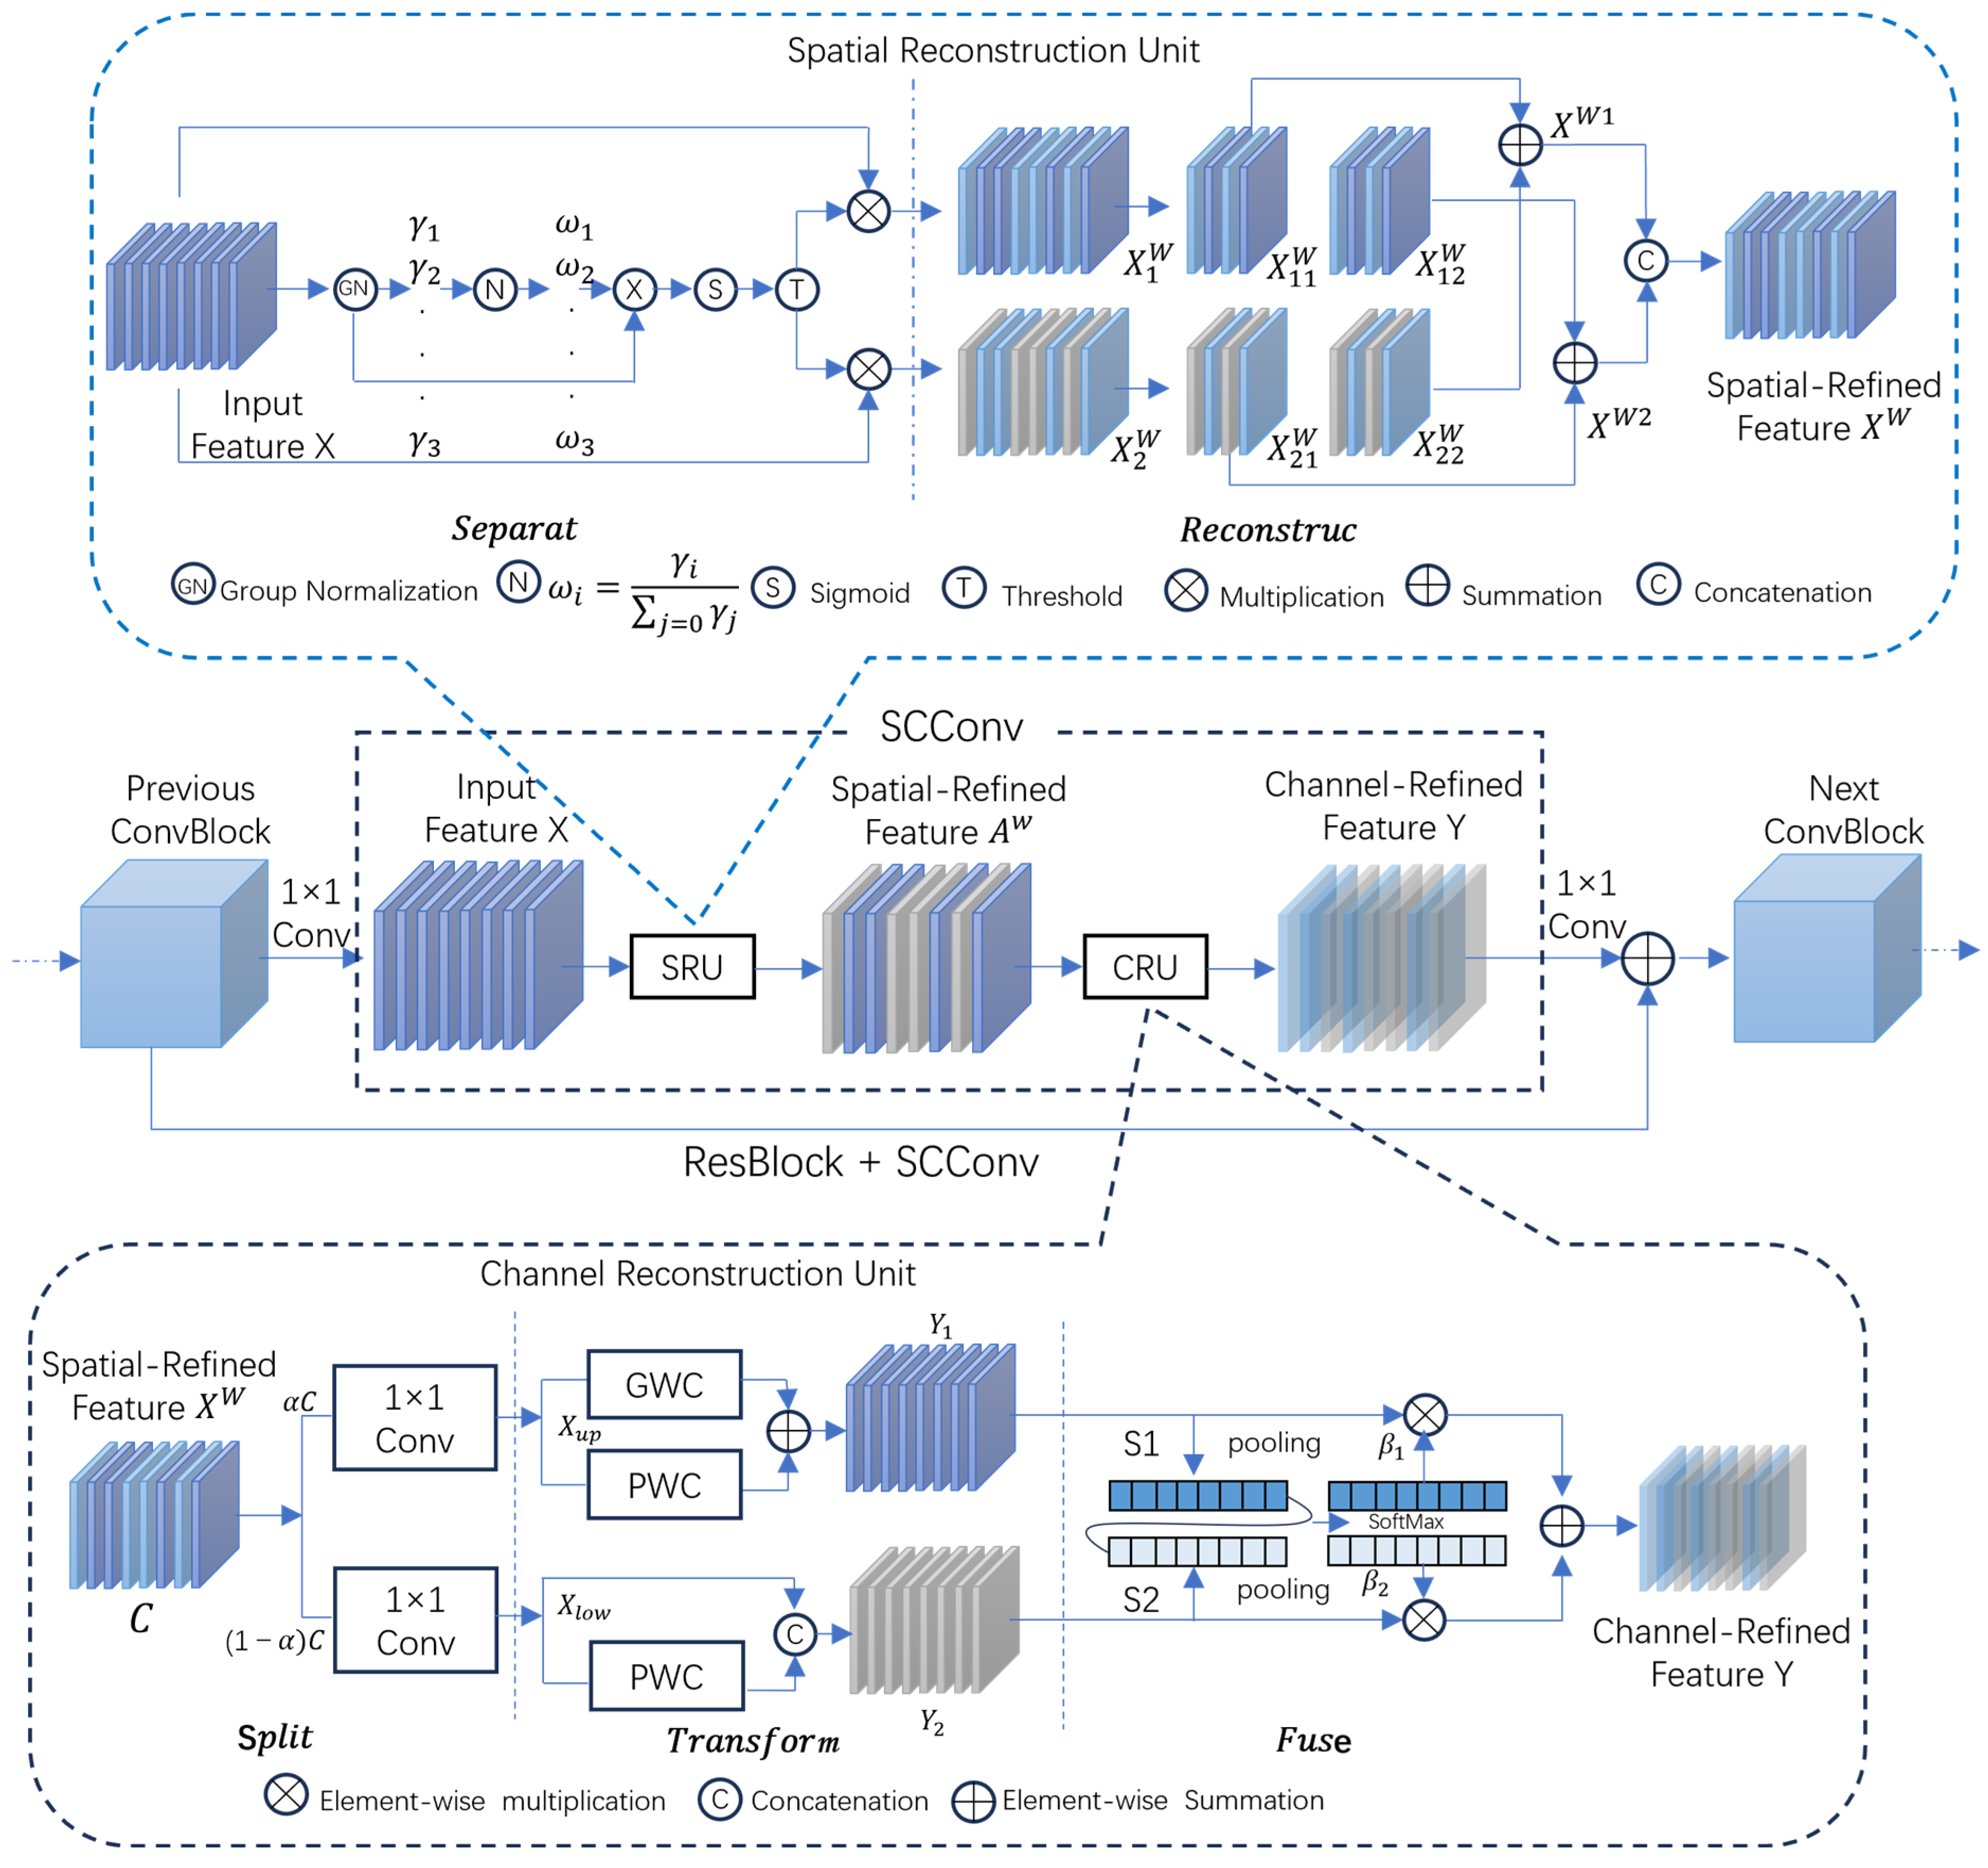
In order to reduce the spatial and channel redundancy between features in a convolutional neural network, thus compressing the CNN model and improving its performance, herein, we introduce the convolution module of SCConv (Spatial and Channel reconstruction Convolution) [28]. The SCConv convolution consists of a spatial reconstruction unit and a channel reconstruction unit (CRU). Firstly, the input feature X is fed into the SRU unit, and the spatial information content is evaluated via the group normalized scaling factor to separate the spatial information-rich features from the information-poor features. Thereafter, using cross reconstruction, the weighted combination of two features with contrasting information richness is used to obtain the spatially reconstructed feature map Xw, which is then fed into the CRU to remove the channel redundant information using group convolution and point-by-point convolution through the segmentation-transformation-merging strategy and simultaneously reduce the computational cost to form the final channel reconstruction feature map. The structure of the SCConv convolution is shown in Figure 4 (Modifications are highlighted in red).
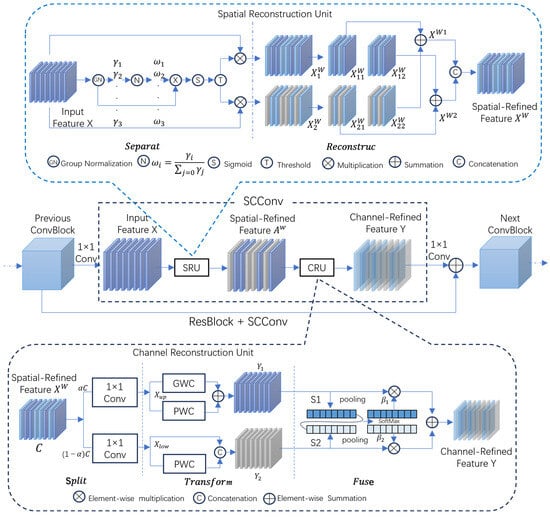
Figure 4.
SCConv convolution structure.
3.3. SE Attention Module
To enhance the detection capabilities of the network model and heighten its focus on the blueberry subjects within images, in the present study, we incorporated the SE attention module into the network architecture. Distinguishing itself from alternative attention mechanisms, the SE attention module dynamically recalibrates feature weights, emphasizing informative channel information. Furthermore, its operational agility and structural simplicity facilitate substantial network performance boosts with minimal parameter augmentation [30].
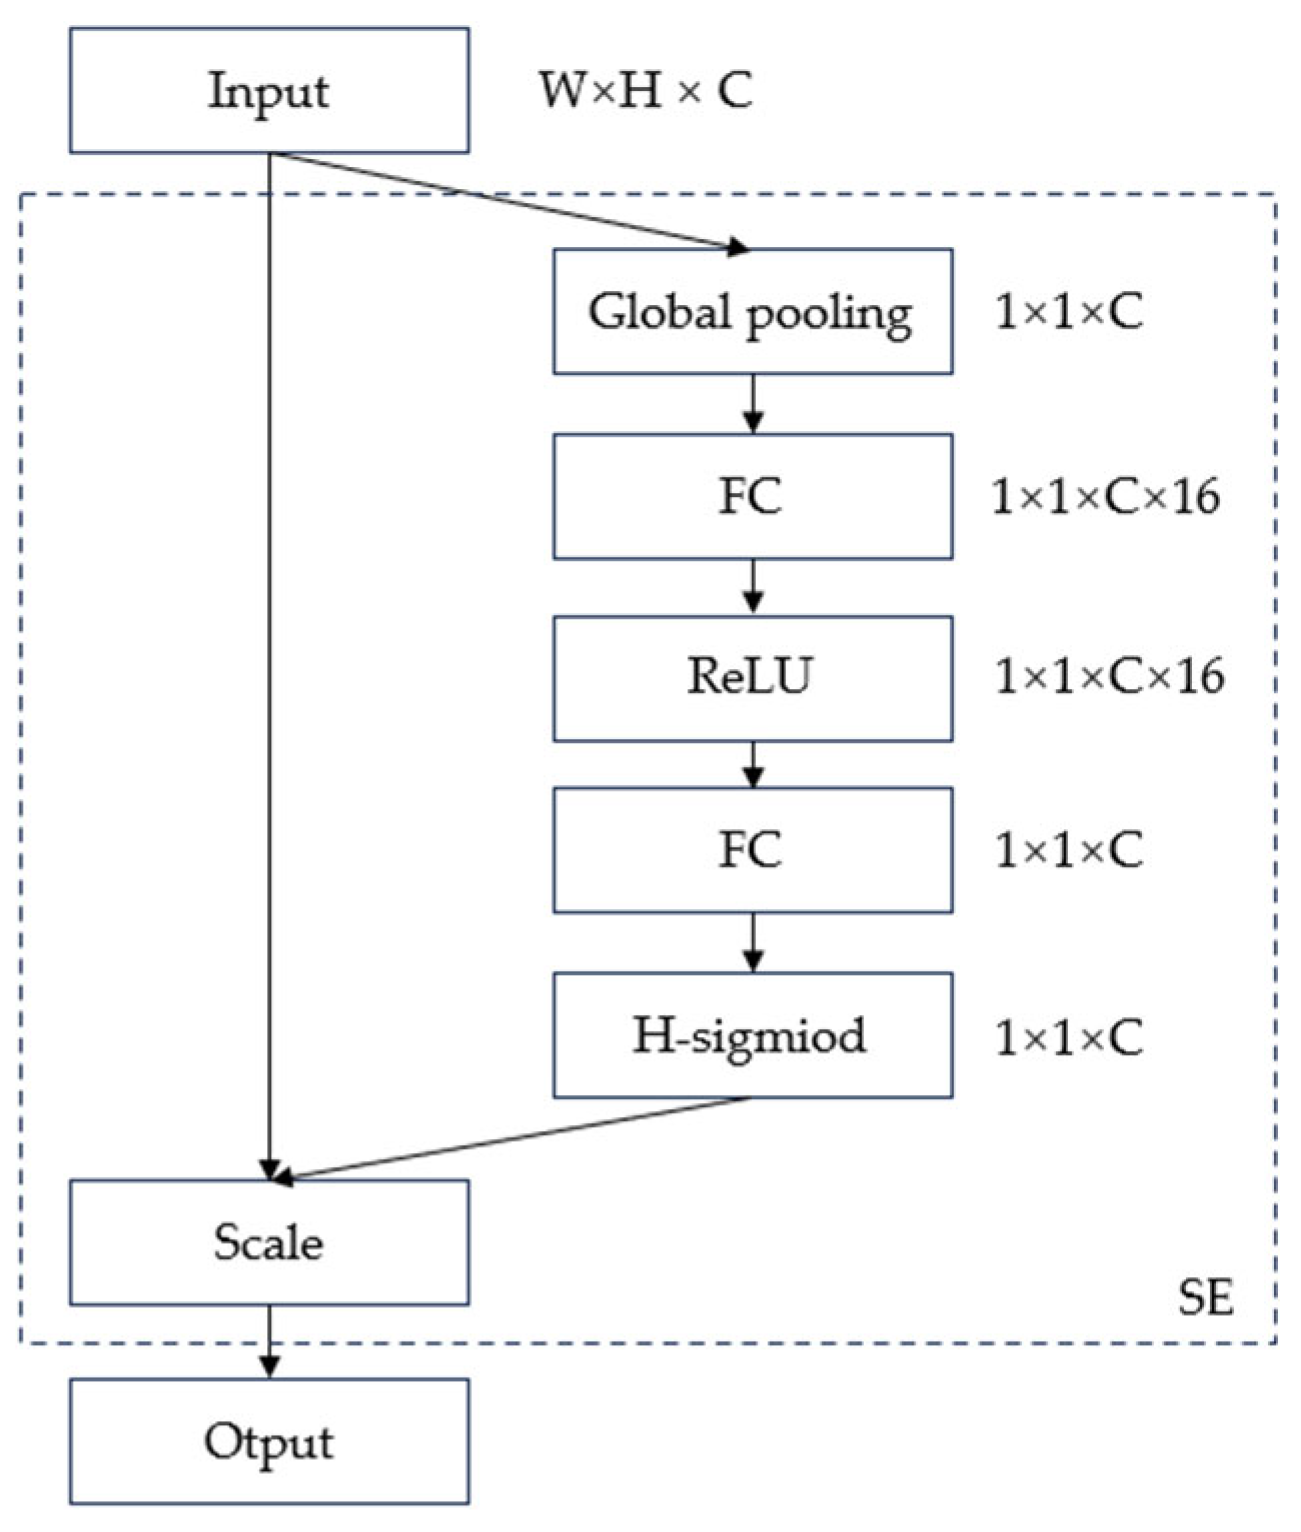
The SE module mainly consists of two components, Squeeze and Excitation. Firstly, the input feature maps are pooled using global averaging in order to perform a squeeze operation to compress the global spatial information into channel descriptors. Thereafter, to determine the importance between individual channels, the importance of each channel in the aggregated information is measured in Excitation using the full join operation. Lastly, the channel weights output from Excitation are multiplied channel-by-channel and weighted to the previous features, which completes the relabeling of the original features in the channel dimension. The detailed structure of the SE module is shown in Figure 5. Adjusting the compression multiplier can improve the network size [31]; in the study presented herein, the feature compression multiplier was adjusted to 16.
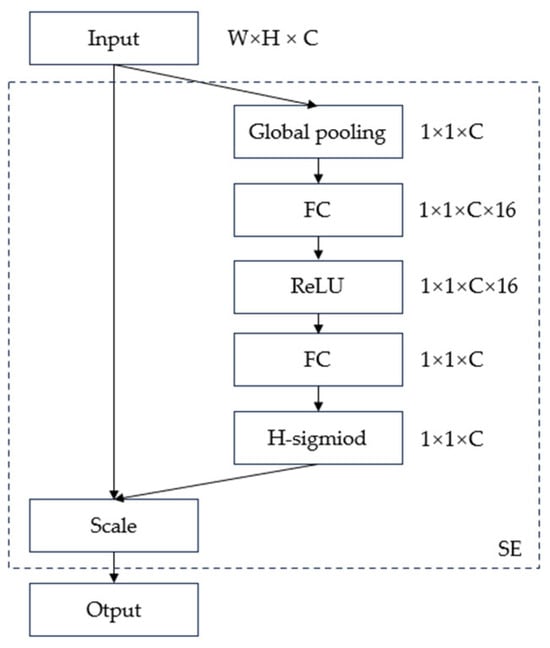
Figure 5.
SE attention mechanism network structure.
3.4. MDPIoU
The original YOLOv9 model uses CIoU Loss [32] (loss function). CIoU Loss only reflects the difference in the target box aspect ratio, not the real difference between the aspect and its confidence, thus preventing the model from optimizing the similarity. In addition, most of the existing loss functions (e.g., GIoU [33], DIoU [34], EIoU [29], etc.) have the same value under different prediction results, which reduces the convergence speed and accuracy of bounding box regression.
Inspired by the geometric features of a horizontal rectangle, Ma et al. [35] designed a novel loss function based on the minimum point distance. MPDIoU can directly predict the distance between the upper-left and lower-right points between the bounding box and the actual labeled box. MPDIOU simplifies the similarity comparison between two bounding boxes and can help the algorithm select the most suitable bounding box to accurately locate the target. Therefore, in order to effectively solve the phenomenon of detection box distortion caused by fruit overlap and effectively reduce the occurrence of missed blueberry detection, in the present study, we used the MPDIoU loss function to replace CIoU.
The specific calculation formula is as follows:
where and denote two arbitrary convex shapes. and represent the width and height of the input image. and denote the upper-left and lower-right coordinates of A, respectively. denote the upper-left and lower-right coordinates of A, respectively. denote the square of the Euclidean distance between the upper left corner and the lower right corner of A and B, respectively.
4. Results
4.1. Test Environment
The experiment’s network model training relies on the PyTorch deep learning framework. The hardware environment comprises an Intel(R) Core(TM) i7-12700F CPU clocked at 2.10 GHz, complemented by 32 GB of RAM and an NVIDIA GeForce RTX 4070 GPU equipped with 12 GB of VRAM. Operating on Windows 10 with Python 3.10, the experiment meticulously balances and fine-tunes the network’s hyperparameters. Specifically, it engages in 200 training epochs, with each epoch processing four batches. The initial learning rate of 0.01, together with a decay rate of 0.1, optimizes the model’s training process by modulating the update speed of network weights.
4.2. Evaluation Indicators
In the field of target detection, the IoU value (the area where the predicted frame intersects the real frame divided by the concatenated area between the predicted frame and the real frame) is usually used to measure the proximity between the predicted frame and the real detected frame. The IoU is calculated using the following formula:
where Bi is the area of the prediction box and BGTi is the area of the labeled real box selection. If the IoU value is greater than the set threshold, this indicates that the target is effectively detected.
By determining the detection results of all target samples, the accuracy P (precision) and recall R (recall) can be calculated. By plotting the P-R curve and calculating the area under the curve, the average precision AP (accuracy precision) can be calculated. The mAP (mean average precision) can be calculated by counting all categories of AP and determining the mean. The average precision at a specific threshold is noted as APIoU_threshold. The mAP was used as the main evaluation index in this experiment, with reference to both mAP0.5 and mAP0.5:0.95.
The equations for P, R, AP, and mAP are shown in Equations (13), (14), (15) and (16), respectively.
where TP is the number of positive samples correctly predicted by the model; FP is the number of positive samples incorrectly predicted by the model; FN is the number of positive samples missed by the model; AP is used as a measure of the model’s accuracy in the detection of a single category of targets; M is the total number of categories; and AP (k) is the AP value for the kth category.
The F1 score is a measure of the precision of a binary classification model. The F1 score can be seen as a weighted average of model precision and recall, with a maximum value of 1 and a minimum value of 0, as shown in Equation (14).
4.3. Analysis and Evaluation of Results
4.3.1. Comparison of the Training Results of Different Models
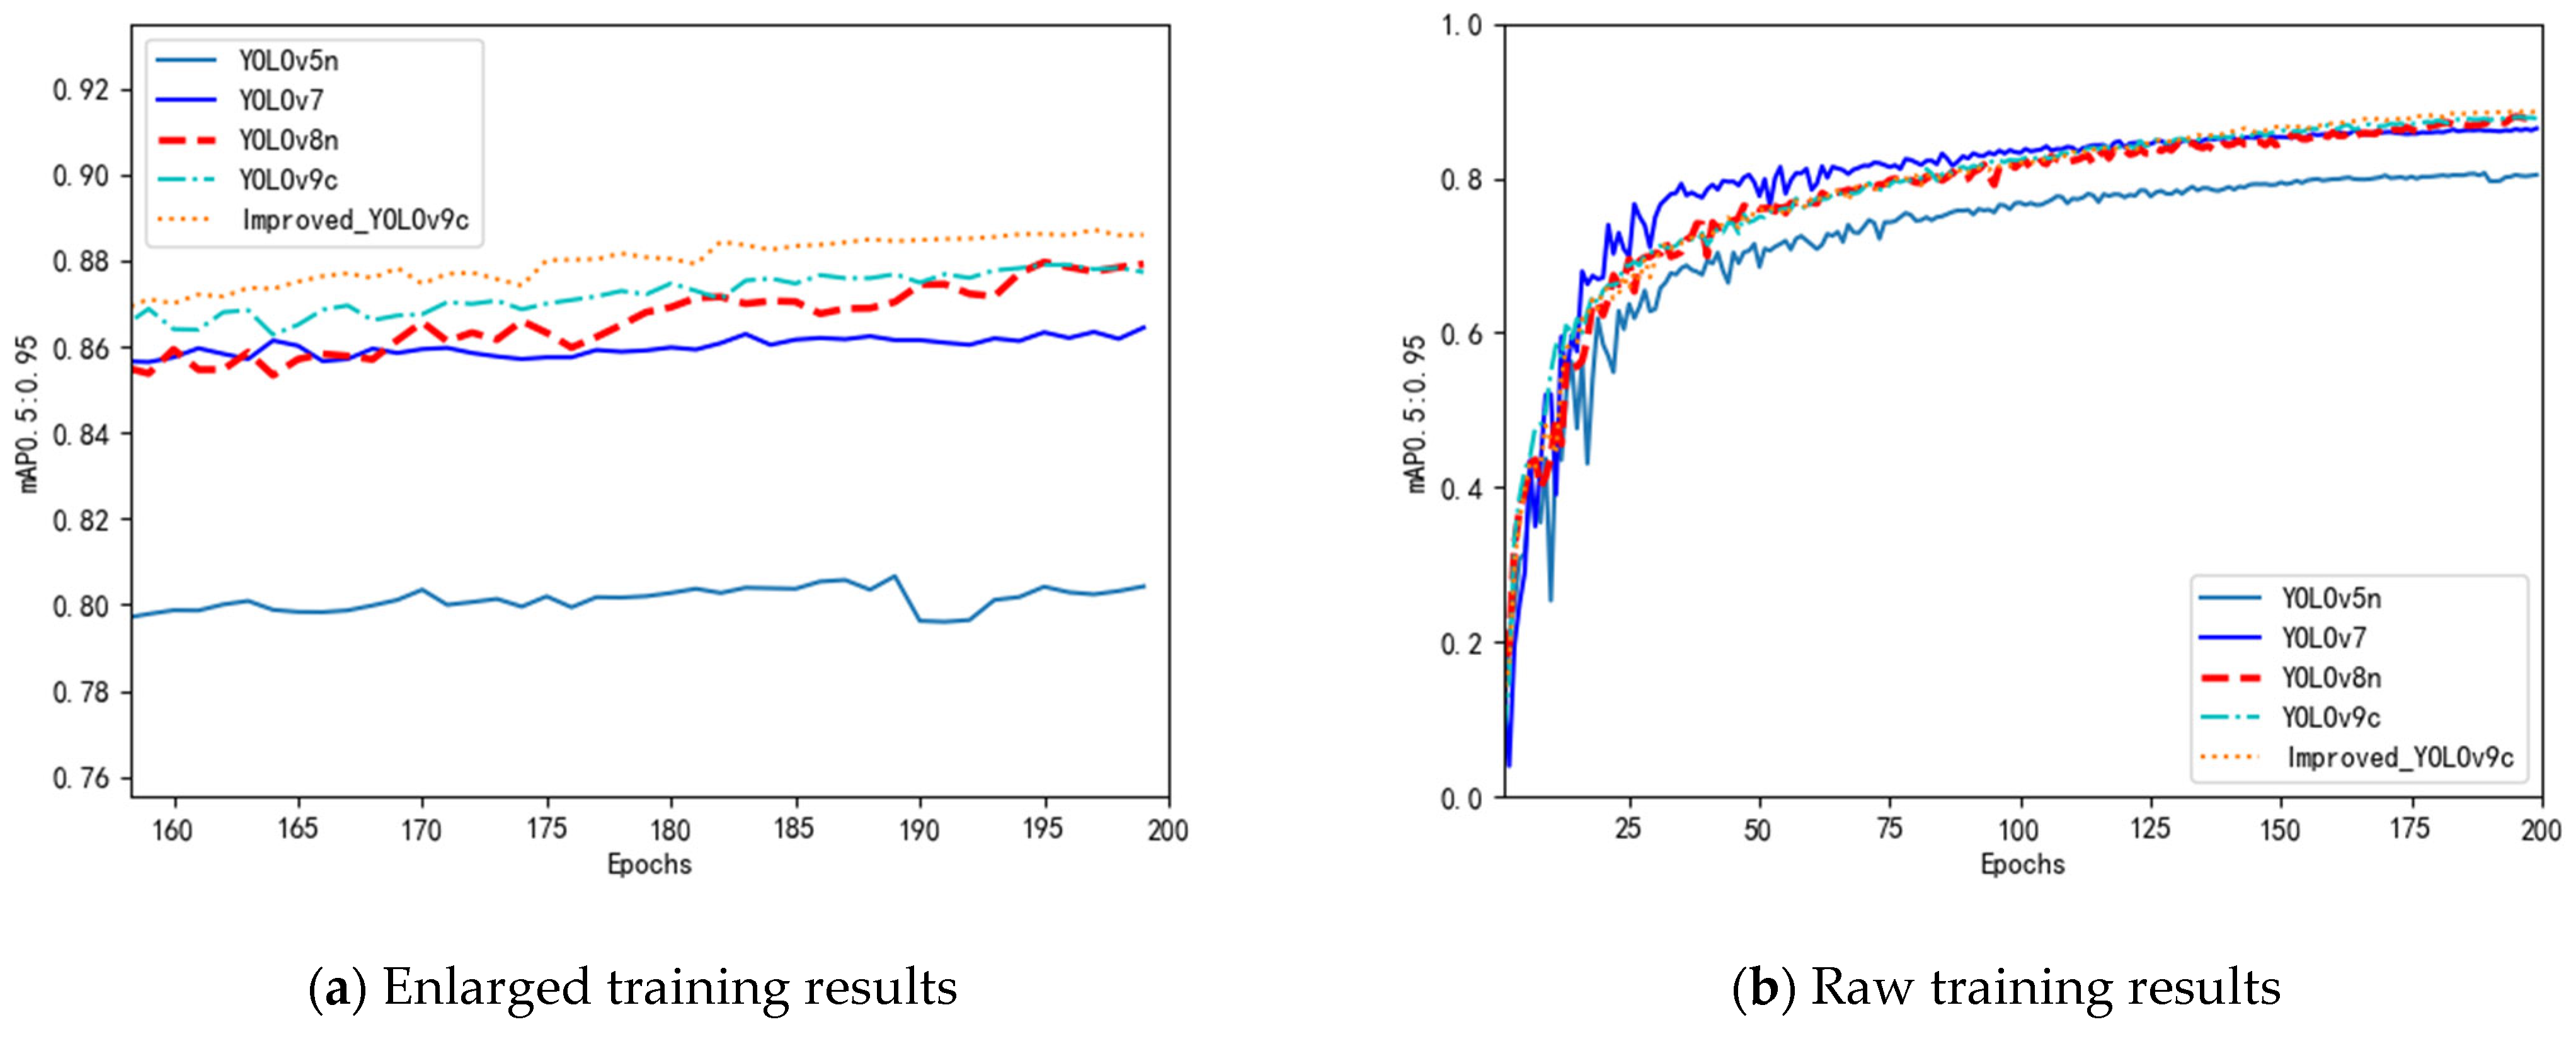
In the study, presented herein, we also compared the proposed model with other mainstream target detection algorithms such as YOLOv5n, YOLOv7, and YOLOv8n. From the experimental results displayed in Table 2, it can be seen that the model proposed herein has the highest mAP0.5 and mAP0.5:0.95 of 98.1% and 88.7%, representing an improvement of 0.7% and 0.8% compared to the original YOLOv9c network. The results show that the improved method proposed herein is effective.
Table 2.
Comparison of the training results of different models.
Figure 6 shows the comparison of the results of different network models during the training process, and it can be seen that the curve of the model proposed herein is smooth, with the highest mAP0.5:0.95, which indicates that the method proposed in the presented study is effective in improving the detection performance of the model.

Figure 6.
Comparison of results from the different network models.
4.3.2. Ablation Test
In order to verify the effectiveness of each improved module on blueberry detection, YOLOv9c was used as the base network, and ablation tests were performed on each improved module, primarily employing mAP0.5:0.95% and model size as the reference index. The results are shown in Table 3. Among the results, the results of experiment No. 1 are the training results of the original network.
Table 3.
Experimental results of the improved YOLOv9c model.
As can be seen from the results displayed in the table above, following the introduction of SCConv into the network, the detection performance of the improved network shows a slight improvement, in which the mAP0.5 improves by 0.51% and the mAP0.5:0.95 improves by 0.08%, and concurrently, the model size decreases by 3.42 MB. When the attention mechanism is introduced into the network, the performance of the network also shows a different degree of improvement. Among the improvements, the recognition performance of the network was the best when the SE attention module was introduced. The mAP0.5 of the network was improved by 0.2%, the mAP0.5:0.95 was improved by 0.17%, and the parameters of the network did not significantly increase because the compression multiplier of the SE module was adjusted. When the loss function of the original YOLOv9c was improved to MDPIoU, the mAP0.5 of the network was improved by 0.22% and the mAP0.5:0.95 was improved by 0.6%. Lastly, the detection performance of the network was optimally improved when the SCConv module, the SE module, and the modification of the MDPIoU loss function were introduced into the network simultaneously. Detection performance was improved by 0.63% for mAP0.5 and 0.81% for mAP0.5:0.95, and the model size was reduced by 3.42 MB.
4.3.3. Comparison of Detection Performance before and after Improvement
From the experimental results presented in Table 4, it can be seen that the model proposed herein is enhanced by 0.7% and 0.8% compared to the mAP0.5 and mAP0.5:0.95 of the original YOLOv9c network, respectively. The size of the model is reduced by 3.42 MB, the params are reduced by 1.847 M, and the detection time of a single image is reduced by 4.5 ms. The results show that the overall detection performance of the model is improved.
Table 4.
Comparison of detection performance before and after improvement.
4.3.4. Visual Results Analysis
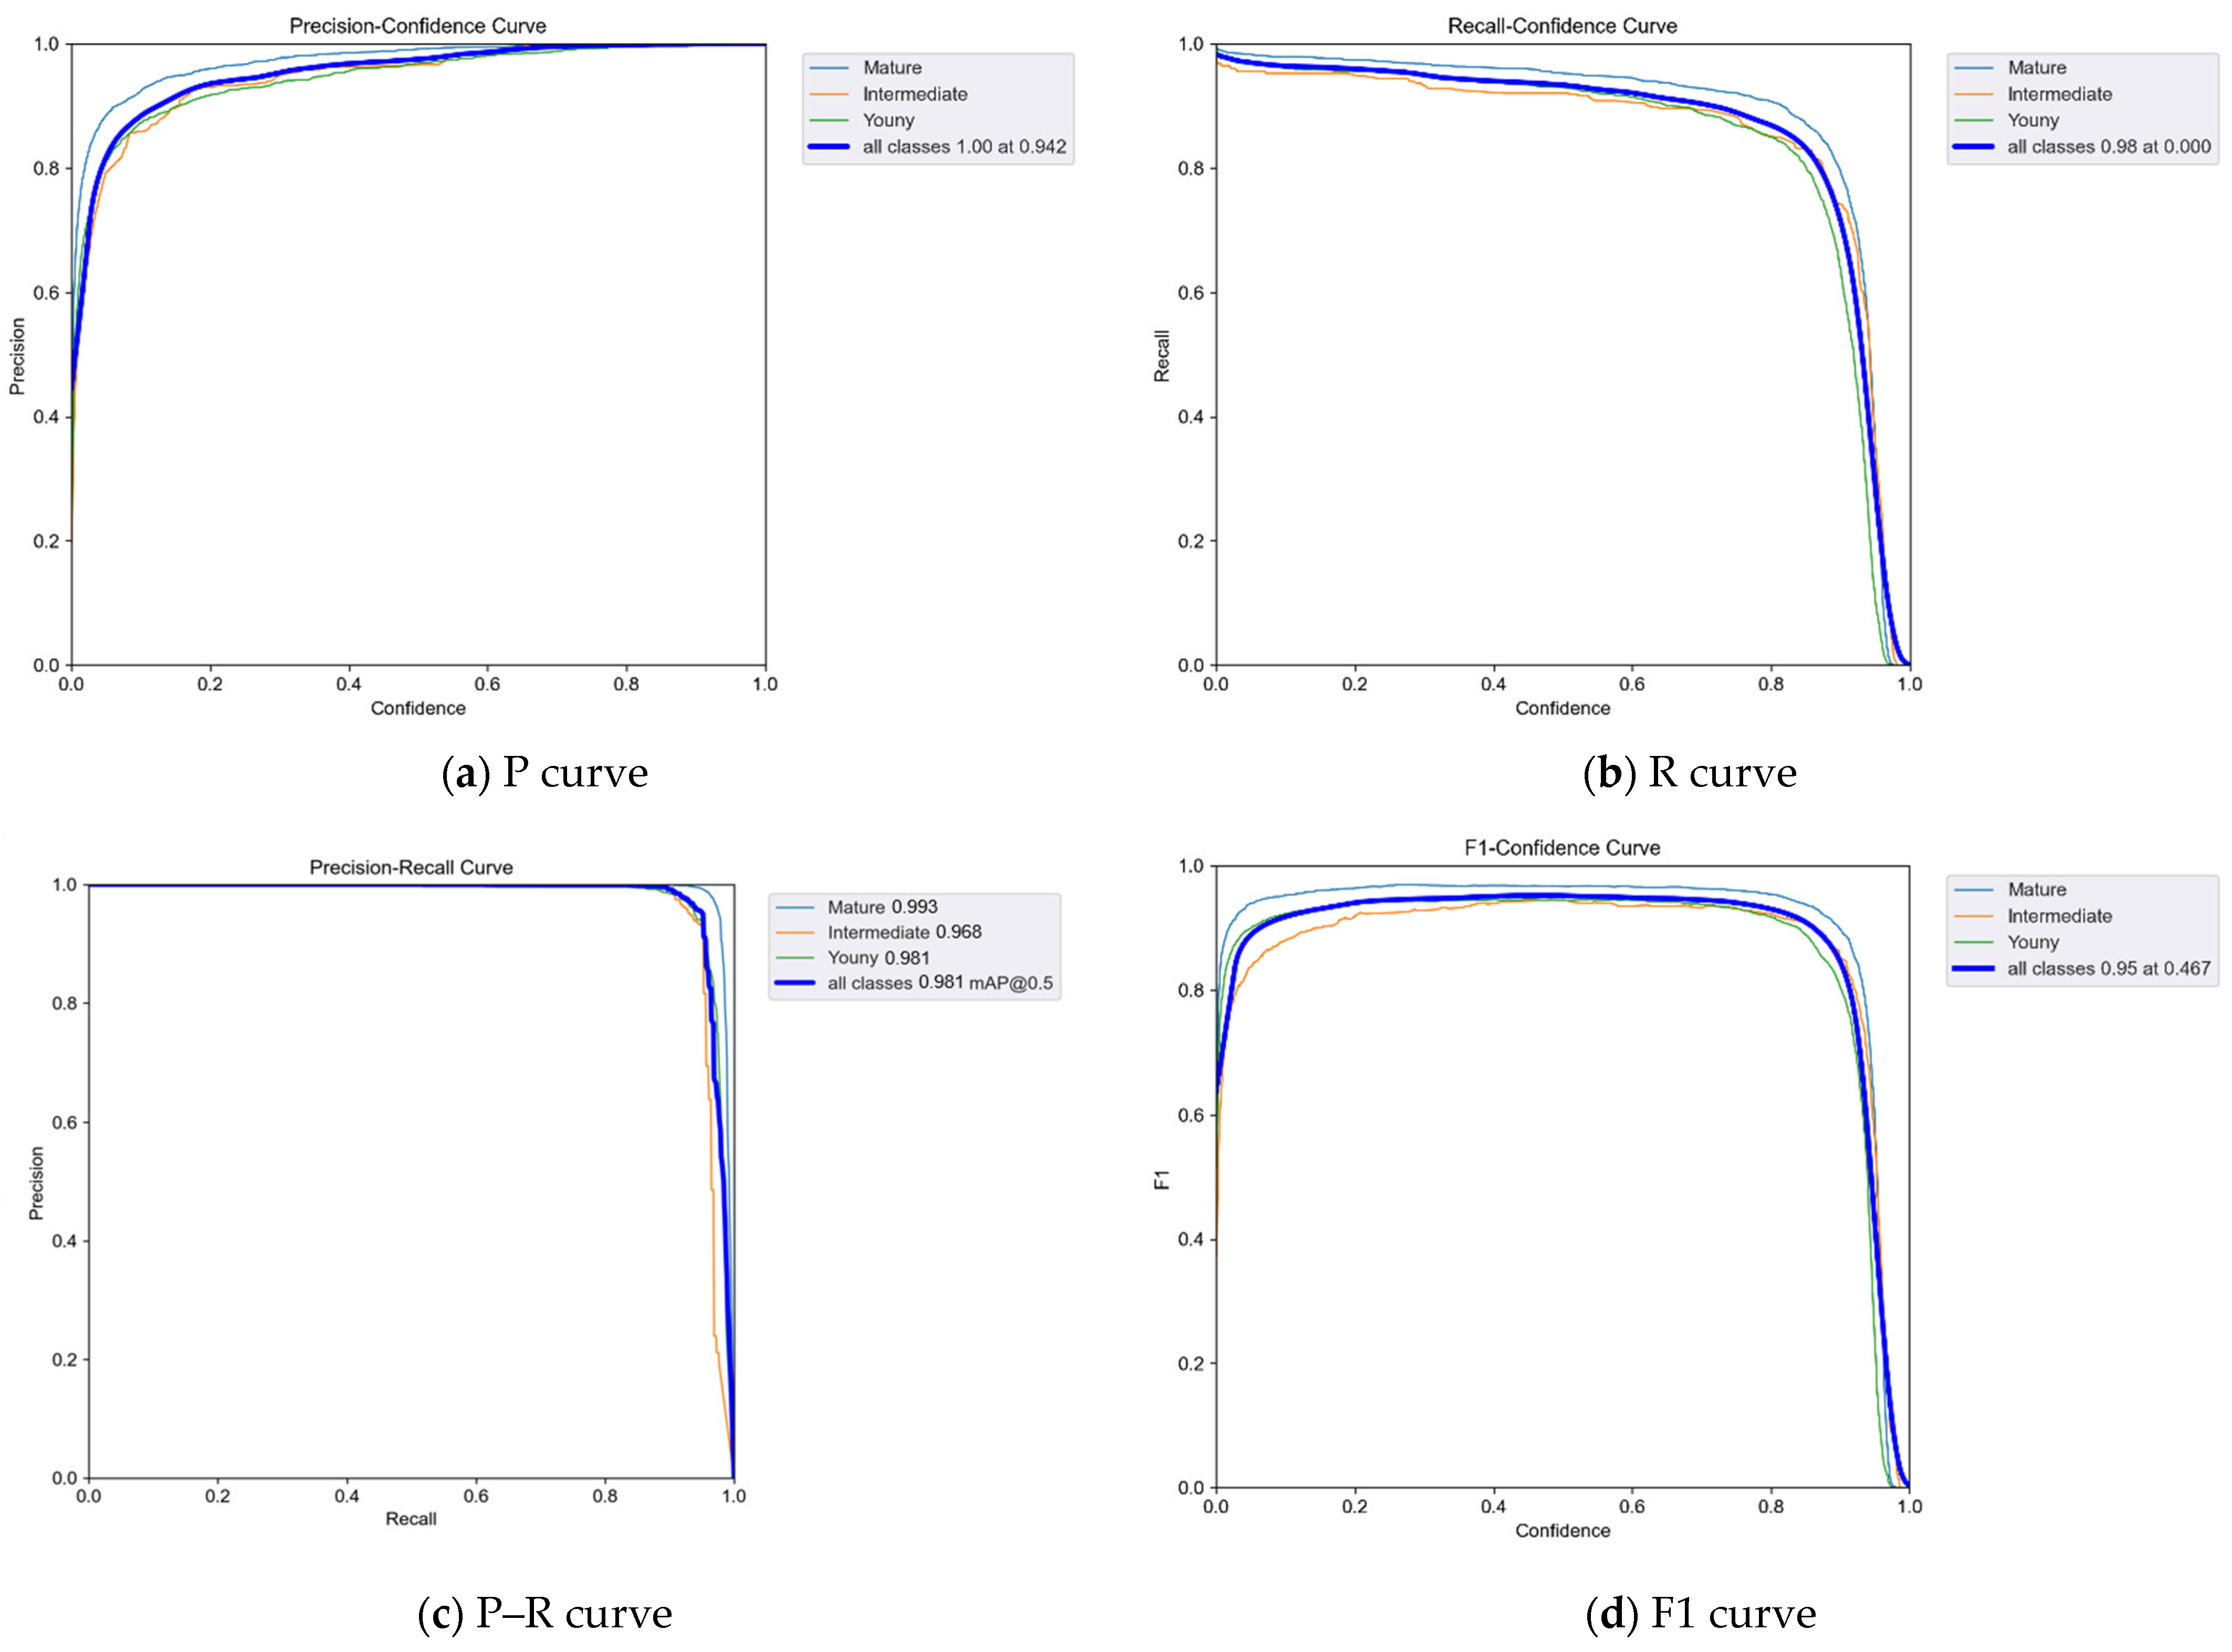
In the study presented herein, the improved model was tested for detecting the ripeness of blueberry fruits. The P curve, R curve, P–R curve, and F1 curve of the improved YOLOv9c algorithm are shown in Figure 7. For the sample-rich ripe blueberry fruit category, mAP0.5 is the highest, with a value of 0.983, and there are few false and missed detections. The second highest mAP0.5 was for the immature blueberry fruit category with an mAP0.5 of 0.981. The lowest mAP0.5 was identified for the semi-ripe blueberry fruit category.
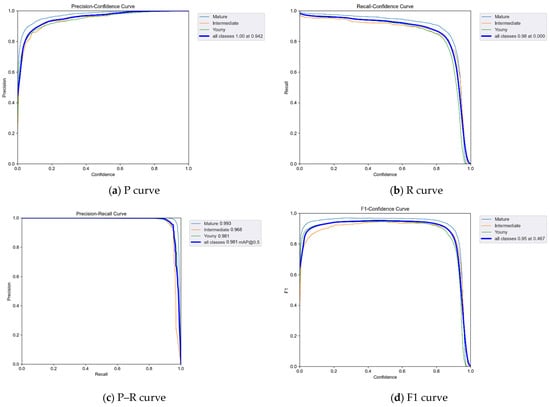
Figure 7.
Improved training result curve for YOLOv9c.
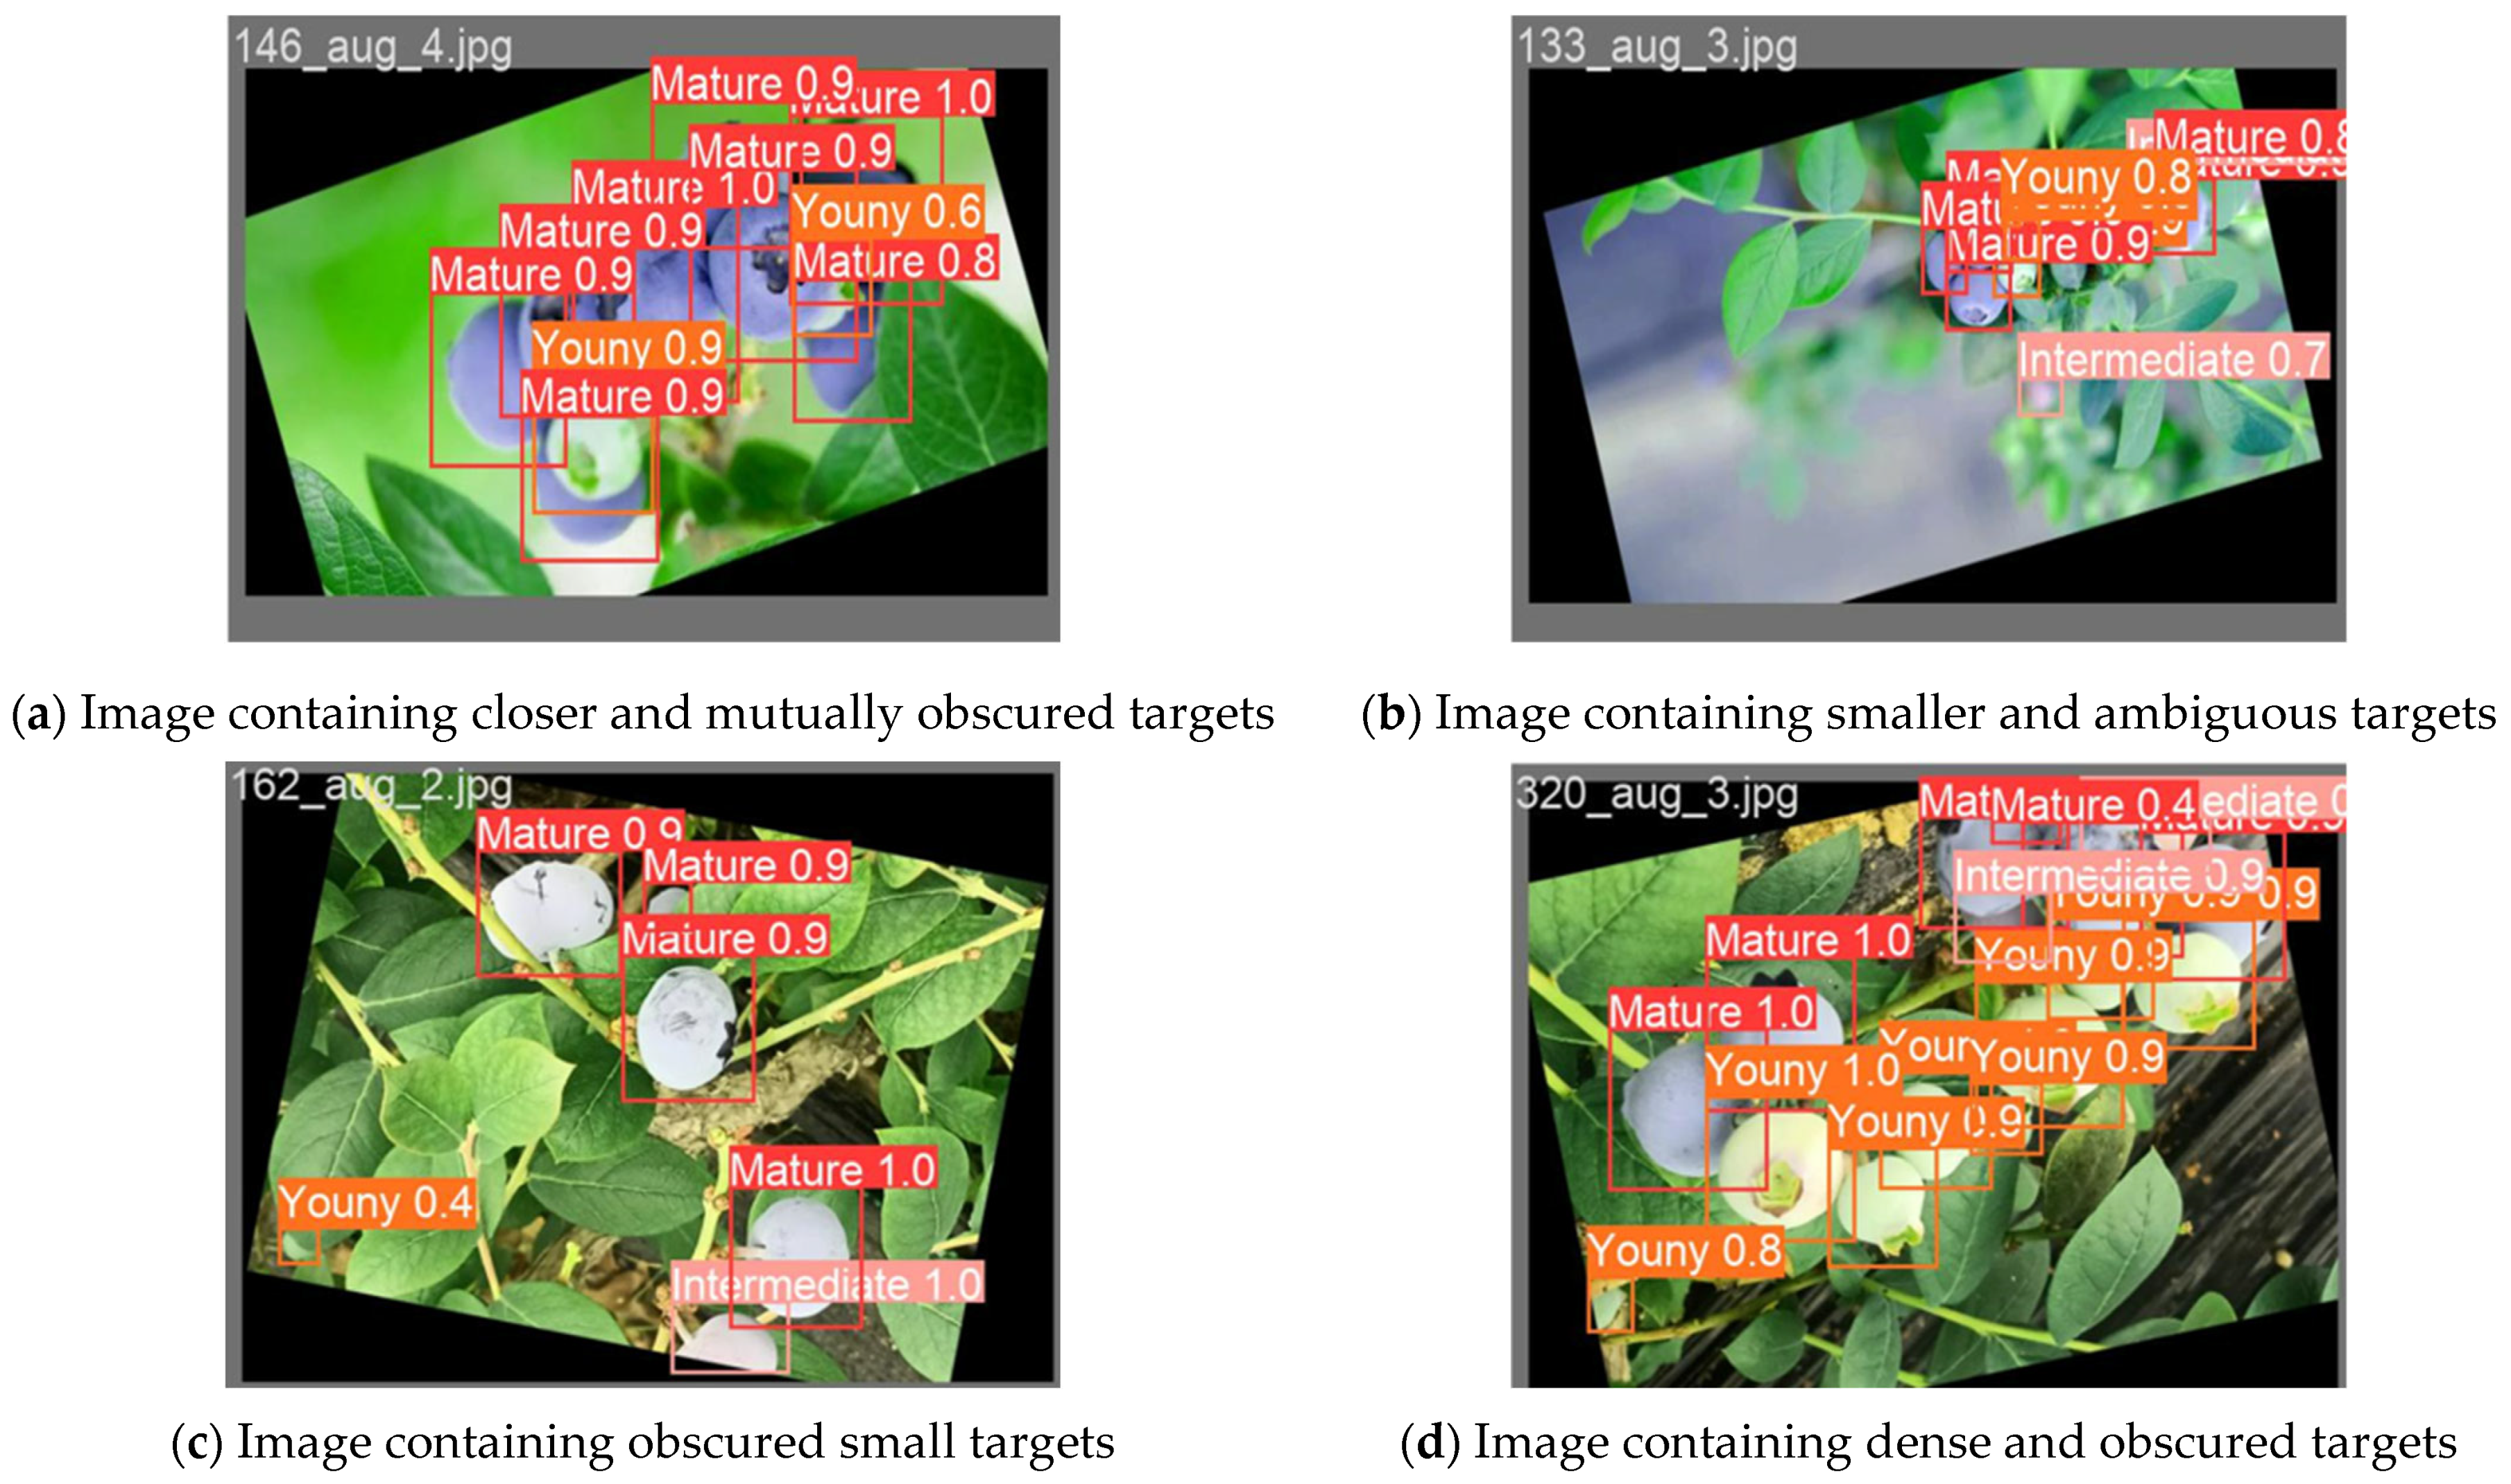
An example of the detection effect of the improved YOLOv9c algorithm is shown in Figure 8. The improved YOLOv9c algorithm shows excellent detection results for blueberry fruits in both near- and medium-distance images. As shown in Figure 8b, the algorithm still shows good detection results for small targets of semi-ripe blueberry fruits with long distances and blurred backgrounds. As shown in Figure 8c,d, the improved YOLOv9c algorithm is also able to detect blueberry fruits effectively, even when there is severe occlusion and interference from backgrounds of similar colors. However, as shown in Figure 8c,d, the low confidence in detecting individual blueberries means that the improved YOLOv9c algorithm may also face challenges in detecting occluded blueberry fruits. This finding is due to the fact that the model cannot acquire enough feature information for classification in the case of more severe occlusion of surrounding objects.

Figure 8.
Improved YOLOv9c detection effect.
5. Conclusions
In the present study, an improved YOLOv9c network model is proposed for the identification and detection of blueberry fruits with different ripeness levels. Based on the YOLOv9c target detection network, the SE module and MDPIOU loss function are introduced to improve the detection accuracy of the network, and the size of the network is reduced by the introduction of the SCConv convolution module, which facilitates the deployment of agricultural embedded mobile devices. The model proposed herein improves by 0.7% and 0.8% in terms of mAP0.5 and mAP0.5:0.95, respectively, compared to the original YOLOv9c network. The model size is reduced by 3.42 MB, the params are reduced by 1.847 M, and the detection time of a single image is reduced by 4.5 ms. The results show that the overall detection performance of the improved model is effectively improved. Compared with other versions of the YOLO series, the improved model is more effective in detecting small targets and blueberries in dense occlusion environments. Our results can provide a valuable reference for the development of accurate detection and localization techniques for agricultural picking robots.
Although the size of the network has been reduced through improvement, there is still room for further improvement. Therefore, in future work, we will continue to focus on improving the recognition accuracy of the model while simultaneously minimizing the size of the network. Such improvements will provide effective support for the application and deployment of the model in the field. In addition, we will conduct extended research on blueberry disease and damage detection to enhance the general performance of the detection model under multi-tasking.
Author Contributions
Conceptualization, W.F., J.W., M.L., Y.S. and S.W.; data curation, W.F., J.W., M.L., Y.S. and S.W.; formal analysis, W.F., J.W., M.L., Y.S. and S.W.; investigation, W.F., J.W., M.L., Y.S. and S.W.; methodology, W.F., J.W., M.L., Y.S. and S.W.; resources, W.F., J.W., M.L., Y.S. and S.W.; software, W.F.; supervision, J.W.; validation, W.F. and M.L.; visualization, W.F. and M.L.; writing—original draft, W.F.; writing—review and editing, W.F. and J.W. All authors have read and agreed to the published version of the manuscript.
Funding
This research received no external funding.
Data Availability Statement
The data presented in this study can be requested from the corresponding author. The data are not currently available for public access because they are part of an ongoing research project.
Acknowledgments
The authors would like to thank the anonymous reviewers for their critical comments and suggestions for improving the manuscript.
Conflicts of Interest
The authors declare no conflicts of interest.
References
- Lara, G.; Paula, P.; Paolo, L.; Fabrizio, C. Texture profiling of blueberries (Vaccinium spp.) during fruit development, ripening and storage. Postharvest Biol. Technol. 2013, 76, 34–39. [Google Scholar]
- Li, Y.D.; Pei, J.B.; Sun, H.Y. Global blueberry industry development status and outlook. J. Jilin Agric. Univ. 2018, 40, 421–432. (In Chinese) [Google Scholar]
- Cheng, J.; He, L.; Sun, H.; Pan, Y.; Ma, J. Inhibition of cell wall pectin metabolism by plasma activated water (PAW) to maintain firmness and quality of postharvest blueberry. Plant Physiol. Biochem. 2023, 201, 107803. [Google Scholar] [CrossRef] [PubMed]
- Ren, D.; Yang, S.X. Intelligent automation with applications to agriculture. Intell. Autom. Soft Comput. 2016, 22, 227–228. [Google Scholar] [CrossRef]
- Craig, B.M.; Travis, J.E.; Arnold, W.S.; Patrick, J.H.; Qamar, U.Z. Detection of fruit maturity stage and yield estimation in wild blueberry using deep learning convolutional neural networks. Smart Agric. Technol. 2023, 3, 100099. [Google Scholar]
- Gabriel, A.L.; José, M.A. Automatic detection of orientation and diseases in blueberries using image analysis to improve their postharvest storage quality. Food Control 2013, 33, 166–173. [Google Scholar]
- Tan, K.; Lee, W.; Gan, H.; Wang, S. Recognising blueberry fruit of different maturity using histogram oriented gradients and colour features in outdoor scenes. Biosyst. Eng. 2018, 176, 59–72. [Google Scholar] [CrossRef]
- Ma, H.; Zhao, K.; Jin, X.; Ji, J.; Qiu, Z.; Gao, S. Spectral difference analysis and identification of different maturity blueberry fruit based on hyperspectral imaging using spectral index. Int. J. Agric. Biol. Eng. 2019, 12, 134–140. [Google Scholar] [CrossRef]
- Aguilera, C.A.; Figueroa-Flores, C.; Aguilera, C.; Navarrete, C. Comprehensive Analysis of Model Errors in Blueberry Detection and Maturity Classification: Identifying Limitations and Proposing Future Improvements in Agricultural Monitoring. Agriculture 2024, 14, 18. [Google Scholar] [CrossRef]
- Xiao, F.; Wang, H.; Xu, Y.; Shi, Z. A Lightweight Detection Method for Blueberry Fruit Maturity Based on an Improved YOLOv5 Algorithm. Agriculture 2024, 14, 36. [Google Scholar] [CrossRef]
- Yang, W.; Ma, X.; Hu, W.; Tang, P. Lightweight Blueberry Fruit Recognition Based on Multi-Scale and Attention Fusion NCBAM. Agronomy 2022, 12, 2354. [Google Scholar] [CrossRef]
- Yang, W.; Ma, X.; An, H. Blueberry Ripeness Detection Model Based on Enhanced Detail Feature and Content-Aware Reassembly. Agronomy 2023, 13, 1613. [Google Scholar] [CrossRef]
- Gonzalez, S.; Arellano, C.; Tapia, J. Deepblueberry: Quantification of Blueberries in the Wild Using Instance Segmentation. IEEE Access 2019, 7, 105776–105788. [Google Scholar] [CrossRef]
- Dokil, P.; Jongwoo, B.; Jieun, L.; Hoekung, J. Blueberry Fruit Maturity Rate Measurement System Using Object Detection. J. Knowl. Inf. Technol. Syst. 2022, 17, 465–474. [Google Scholar]
- Qiao, S.; Wang, Q.; Zhang, J.; Pei, Z. Detection and Classification of Early Decay on Blueberry Based on Improved Deep Residual 3D Convolutional Neural Network in Hyperspectral Images. Sci. Program. 2020, 4, 8895875. [Google Scholar] [CrossRef]
- Huang, Y.; Wang, D.; Liu, Y.; Zhou, H.; Sun, Y. Measurement of Early Disease Blueberries Based on Vis/NIR Hyperspectral Imaging System. Sensors 2020, 20, 5783. [Google Scholar] [CrossRef]
- Jiang, Y.; Li, C.; Takeda, F. Nondestructive Detection and Quantification of Blueberry Bruising using Near-infrared (NIR) Hyperspectral Reflectance Imaging. Sci. Rep. 2016, 6, 35679. [Google Scholar] [CrossRef]
- Jia, S.; Wang, P.; Jia, P.; Hu, S. Research on data augmentation for image classification based on convolution neural networks. In Proceedings of the 2017 Chinese Automation Congress (CAC), Jinan, China, 20–22 October 2017. [Google Scholar]
- He, K.; Gkioxari, G.; Dollar, P.; Girshick, R. Mask R-CNN. In Proceedings of the IEEE International Conference on Computer Vision, Venice, Italy, 22–29 October 2017; pp. 2980–2988. [Google Scholar]
- Girshick, R. Fast r-cnn. In Proceedings of the IEEE International Conference on Computer Vision, Santiago, Chile, 7–13 December 2015; pp. 1440–1448. [Google Scholar]
- Ren, S.; He, K.; Girshick, R.; Sun, J. Faster R-CNN: Towards Real-Time Object Detection with Region Proposal Networks. IEEE Trans. Pattern Anal. Mach. Intell. 2017, 39, 1137–1149. [Google Scholar] [CrossRef]
- Joseph, R.; Santosh, K.D.; Girshick, R.B.; Farhadi, A. You Only Look Once: Unified, Real-Time Object Detection. In Proceedings of the 2016 IEEE Conference on Computer Vision and Pattern Recognition (CVPR), Las Vegas, NV, USA, 27–30 June 2016; pp. 779–788. [Google Scholar]
- Redmon, J.; Farhadi, A. YOLO9000: Better, faster, stronger. In Proceedings of the IEEE Conference on Computer Vision and Pattern Recognition, Honolulu, HI, USA, 21–26 July 2017; pp. 7263–7271. [Google Scholar]
- Redmon, J.; Farhadi, A. YOLOv3: An Incremental Improvement. arXiv 2018, arXiv:1804.02767. [Google Scholar]
- Lin, T.; Goyal, P.; Girshick, R. Focal loss for dense object detection. In Proceedings of the IEEE International Conference on Computer Vision (ICCV), Venice, Italy, 22–29 October 2017. [Google Scholar]
- Tan, M.; Pang, R.; Le, Q. EfficientDet: Scalable and Efficient Object Detection. In Proceedings of the 2020 IEEE/CVF Conference on Computer Vision and Pattern Recognition (CVPR), Seattle, WA, USA, 13–19 June 2020; pp. 10778–10787. [Google Scholar]
- Wang, C.; Yeh, I.; Liao, H. YOLOv9: Learning What You Want to Learn Using Programmable Gradient Information. arXiv 2024, arXiv:2402.13616. [Google Scholar]
- Li, J.; Wen, Y.; He, L. SCConv: Spatial and Channel Reconstruction Convolution for Feature Redundancy. In Proceedings of the 2023 IEEE/CVF Conference on Computer Vision and Pattern Recognition (CVPR), Vancouver, BC, Canada, 17–24 June 2023; pp. 6153–6162. [Google Scholar] [CrossRef]
- Zhang, Y.; Ren, W.; Zhang, Z.; Jia, Z.; Wang, L.; Tan, T. Focal and Efficient IOU Loss for Accurate Bounding Box Regression. arXiv 2021, arXiv:2101.08158. [Google Scholar] [CrossRef]
- Hu, J.; Shen, L.; Sun, G. Squeeze-and-Excitation Networks. In Proceedings of the 2018 IEEE/CVF Conference on Computer Vision and Pattern Recognition, Salt Lake City, UT, USA, 18–23 June 2018; pp. 7132–7141. [Google Scholar]
- Zhu, F.; Sun, Y.; Zhang, Y.; Zhang, W.; Qi, J. An Improved MobileNetV3 Mushroom Quality Classification Model Using Images with Complex Backgrounds. Agronomy 2023, 13, 2924. [Google Scholar] [CrossRef]
- Zheng, Z.; Wang, P.; Ren, D.; Liu, W.; Ye, R.; Hu, Q.; Zuo, W. Enhancing Geometric Factors in Model Learning and Inference for Object Detection and Instance Segmentation. arXiv 2021, arXiv:2005.03572. [Google Scholar] [CrossRef]
- Hamid, R.; Nathan, T.; Gwak, J.; Amir, S.; Ian, R.; Silvio, S. Generalized Intersection over Union: A Metric and a Loss for Bounding Box Regression. arXiv 2019, arXiv:1902.09630. [Google Scholar]
- Zheng, Z.; Wang, P.; Liu, W.; Li, J.; Ye, R.; Ren, D. Distance-IoU Loss: Faster and Better Learning for Bounding Box Regression. arXiv 2019, arXiv:1911.08287. [Google Scholar] [CrossRef]
- Ma, S.; Xu, Y. MPDIoU: A Loss for Efficient and Accurate Bounding Box Regression. arXiv 2023, arXiv:2307.07662. [Google Scholar]
Disclaimer/Publisher’s Note: The statements, opinions and data contained in all publications are solely those of the individual author(s) and contributor(s) and not of MDPI and/or the editor(s). MDPI and/or the editor(s) disclaim responsibility for any injury to people or property resulting from any ideas, methods, instructions or products referred to in the content. |
© 2024 by the authors. Licensee MDPI, Basel, Switzerland. This article is an open access article distributed under the terms and conditions of the Creative Commons Attribution (CC BY) license (https://creativecommons.org/licenses/by/4.0/).