Article

Assessing Salinity Tolerance in Pinto Bean Varieties: Implications for Sustainable Agriculture

1
Department of Soil and Crop Sciences, Colorado State University, Fort Collins, CO 80523-1170, USA
2
Department of Horticulture and Landscape Architecture, Colorado State University, Fort Collins, CO 80523-1173, USA
*
Author to whom correspondence should be addressed.
Agronomy 2024, 14(9), 1877; https://doi.org/10.3390/agronomy14091877 (registering DOI)
Submission received: 30 July 2024 / Revised: 15 August 2024 / Accepted: 22 August 2024 / Published: 23 August 2024
(This article belongs to the Section Soil and Plant Nutrition)

Abstract

:
Salinity is an abiotic stress restricting agricultural crop production globally, in which salts inhibit plants’ ability to absorb water and nutrients. Pinto beans (Phaseolus vulgaris L.) are very important in human nutrition and are sensitive to salinity. The objective of this study was to assess the salinity tolerance of six pinto bean varieties by evaluating the effect of different salt types on germination and growth. In the germination experiment, varieties were arranged in a randomized complete block design with five replications and three saline solutions (NaCl, CaCl2, MgSO4·7H2O) at 0, 0.05 M, 0.1 M, and 0.15 M concentrations each. For the greenhouse experiment, saline solutions with the same EC (5 dS m−1), control (distilled water), and six pinto bean varieties were organized in a Complete Random Design with 10 replicates. The results demonstrated that germination percentage, speed of germination, and hypocotyl length decreased as salt concentrations increased. Othello’s vegetative and reproductive parameters were significantly higher compared to the other varieties under saline conditions; its early maturity may have enabled it to perform better under salt stress. In addition to soil and water management, selecting salt-tolerant crops and varieties is essential to maintaining agricultural sustainability in regions undergoing salinization.

1. Introduction

Pulse crops, also known as grain legumes, belong to the Leguminosae family and are harvested for their dried seeds. Some of the most cultivated pulses include chickpeas (Cicer arietinum L.), dry peas (Pisum sativum L.), lentils (Lens culinaris Medikus), cowpeas (Vigna unguiculata L.) such as black-eyed peas, and common beans (Phaseolus vulgaris L.) such as black, kidney, and pinto beans. These crops are widely recognized as nutrient-dense foods and play a tremendous role in human nutrition around the world. They are one of the richest sources of dietary fiber and plant protein and, combined with their affordable price point and contributions to sustainable food systems, they improve food security and can be considered a prime example of a superfood [1,2]. It has been shown that pulses are vital for sustainable farming systems and environmental regeneration [3]. Introducing grain legumes, especially dry beans, into cropping systems reduces the need for synthetic N fertilizer while promoting soil health and fertility [3].
Common bean is the most important grain legume in human nutrition, compared to lentils and chickpeas, for more than 300 million of the world’s population [4]. It represents a crucial cash crop in dryland and irrigated rotation systems of the USA Central High Plains region (Colorado, Nebraska, and Wyoming) [5]. The three main types of common beans grown in Colorado are pinto bean, mayocoba, and light red kidney beans [6]. Pinto represents approximately 75% of production in comparison to mayocoba and light red kidney, which are about 10%, respectively [7]. However, dry edible pinto beans are susceptible to a phenomenon called postharvest darkening, which affects the color of the seeds after harvest.
Postharvest darkening of the seed coat is a concern for dry bean producers around the world. Many types of beans lose their visual quality as they become older, leading to a reduction in consumer preference [8]. Studies have shown that the postharvest darkening phenomenon is caused by some environmental factors such as humidity, elevated temperature, exposure to light [8,9], as well as crop genetics. To address this issue and increase the market value of pinto beans, several varieties of slow-darkening pinto beans have been developed. These new varieties darken more slowly after harvest than the regular-darkening pinto beans [10].
Dry edible pinto beans are very sensitive to salinity. The level of salts in the soil is measured as electrical conductivity (EC) of saturated soil extract (ECe). Generally, yields of salt-sensitive crops are significantly affected when salt levels are 2 to 4 dS m−1, and pinto beans are even more sensitive, experiencing yield losses in soils with ECe greater than 1 dS m−1 [11]. Moderately salt-tolerant crops are affected by levels of 4 to 5 dS m−1, and above 8 dS m−1, all crops except only the very tolerant crops are negatively impacted [12]. Saline soils are characterized by the accumulation of soluble salts in the root zone, which negatively affects a plant’s ability to take up water and nutrients [12]. Salinization of soils occurs through natural processes including evaporation of saline ground water, sea water infiltration of coastal ground waters, low precipitation rate, sea water salts in wind and rain, as well as human-induced processes, such as irrigation with marginal water and poor agricultural management techniques [13,14]. Salinity has a serious impact on seed germination, germination rate, plant growth, and yield components [15]. Soil salinity is a worldwide abiotic stress affecting crop production and yield efficiency, especially in arid and semiarid climates [4,15,16,17]. More than 30% of the world’s food production and nearly one-third of irrigated land are critically affected by salinity [16], presenting a significant challenge to agricultural sustainability in semi-arid regions.
Most of the salt stresses in nature are due to NaCl accumulation, especially when there is an excessive concentration of Na+1 ion in the soil solution [18]. Many experiments have been conducted on salinity tolerance of pulse crops to NaCl [4,16,18,19,20]. However, in semi-arid regions such as Colorado, other salt compounds such as CaCl2, MgSO4, CaSO4, and CaCO3 can be found in the soil [12]. An estimated 396,592 hectares of irrigable land are salt-affected in Colorado [12]. Thus, the main objective of this study was to analyze the salinity tolerance of six pinto bean varieties within different salt types. The specific objectives were to (i) assess the effect of different salt types and salt concentrations on seed germination of pinto beans and (ii) evaluate the effect of different salts on the growth and reproductive stages of pinto beans.

2. Materials and Methods

Six varieties of pinto beans were evaluated in germination and greenhouse experiments described below: three slow-darkening pinto beans (var. Gleam, Mystic, Lumen) and three regular pinto beans (var. Othello, Cowboy, SV6139). In addition, three salt compounds [sodium chloride (NaCl), calcium chloride (CaCl2), and magnesium sulfate (MgSO4·7H2O)] were used to prepare salt treatments in both experiments.

2.1. Germination Experiment

The germination experiment was conducted at Colorado State University (CSU). Three concentrations (0.05 M, 0.1 M, and 0.15 M) of each salt compound were prepared, and distilled water (DI) was used as the control. EC measurements were taken after solution preparation before adding to experimental units.
Seeds were washed with DI for five minutes before solution application. Five representative seeds per variety were placed on filter paper (VWR 413, size 9 cm) in a 9 cm diameter petri dish. Next, 1 mL of distilled water as the control and 1 mL of each salt treatment were applied to the filter paper. Then, 0.5 mL of the solutions were added overtime whenever dryness was observed on the filter paper. The petri dishes were sealed with parafilm to prevent evaporation and kept in a humidity chamber at 20 ± 1 °C to stimulate germination. Seeds were considered to have germinated when radicle emergence was observed through the seed coat [21].
Germinated seeds were counted in each petri dish daily at the same time for 7 days to determine germination speed (GS). Seven days after initiation of the experiment, the total number of seeds germinated was recorded to calculate germination percentage (GP) and hypocotyl and radicle length (cm) measurements were recorded.
The germination percentage was calculated using the formula below [22,23]:
G P = N S G T N S S     100
where NSG is the number of seeds germinated, and TNSS is the total number of seeds sown. The following formula was used to calculate germination speed [22,23]:
G S = n 1 d 1 + n 2 d 2 + n 3 d 3 +
where n1 is the number of seeds germinated on day one after sowing, and d1 the number of days taken for germination from the day of sowing.

2.2. Greenhouse Experiment

The growth and reproductive stage evaluation took place at the CSU Plant Growth Facility in a greenhouse ranging from 19 °C to 23 °C during the day and from 18 °C to 21 °C at night, with a photoperiod of 16 h. The experimental soil was collected from the CSU Agricultural Research, Development, and Education Center (ARDEC) north of Fort Collins, CO (40°36′36.9″ N 104°59′38.2″ W). It was a clay soil with low salinity (Table 1), classified as a Garrett loam (fine-loamy, mixed, mesic Pachic Argiustolls) [24]. Soil was air-dried and placed into 15.5 cm × 13.5 cm pots. Each pot was an experimental unit and was filled with 1050 g of soil.
Saline solutions with appropriate salt concentrations (0.05 M NaCl, 0.1 M CaCl2, 0.15 M MgSO4·7H2O) (Table 2) were prepared to reach an EC of 5 dS m−1 for each of the treatments and compared to tap water (0.05 dS/m) (control). The solutions and control were applied to reach Field Capacity (FC) whenever 75% of the pots were dry on the surface. The treatments were applied five times during the entire experiment [14, 17, 22, 29, and 37 days after planting (DAP)].
Three representative seeds per variety were sown per pot, and after emergence, pots were thinned to 1 plant pot−1. After the first true leaves appeared, 0.29 g urea per pot and 0.19 g Triple Super Phosphate (TSP) per pot were applied to compensate for the N and P deficiencies in the soil (9 DAP), based on the CSU dry bean fertilizer recommendations [27], equivalent to 72 kg N ha−1 and 44 kg P2O5 ha−1. Plant height, growth stage, leaf area index (LAI), and chlorophyll level were recorded to determine plant growth parameters throughout the vegetative stage. Flower and pod numbers were recorded during the reproductive stage.
Plant height was measured with a tape measure from the soil surface to the highest leaf tip 38 DAP. At the late vegetative stage (39 DAP), photos of the plant canopy were taken from above and uploaded to an image processing software (ImageJ version 1.54d) [28] to calculate the LAI. The chlorophyll level was recorded with a portable chlorophyll meter (SPAD-502, Konica Minolta; Tokyo, Japan) by taking the average of three measurements of the old and young leaves, respectively, at the late vegetative stage (40 DAP) [29]. Flower numbers were counted when they were completely open at 30 and 38 DAP, and pod number was measured 35 and 47 DAP.
The plants were harvested 55 DAP, and fresh biomass for shoot and root were measured separately by weighing all the living plant materials. The samples were stored in paper bags and dried in an oven at 70 °C for 3 days to determine the dry biomass of all plant parts. The relative growth was calculated by dividing the variables of plant height, LAI, chlorophyll level, and dry shoot biomass of each variety by the average of the control replications for that variety.
After harvest, the soil was collected from each pot and air-dried. The soil was ground (Grinder General Purpose, MTRP331AB18, Automation Direct; Cumming, GA, USA) and passed through a 2 mm sieve to determine salt accumulation. ECe was measured in a saturated paste extract for each of the samples [25].

2.3. Statistical Analysis

For the germination experiment, the experimental design was a randomized complete block design with five replications. One replicate was conducted at a time to prevent contamination, and to facilitate monitoring. Regarding the greenhouse study, the six pinto bean varieties and salt solutions were arranged in a Complete Random Design (CRD) with 10 replicates. Analysis of variance (ANOVA) was conducted, using RStudio software (version R 4.3.2). Means of each parameter were compared using the Tukey test at p ≤ 0.05.

3. Results

3.1. Germination Experiment

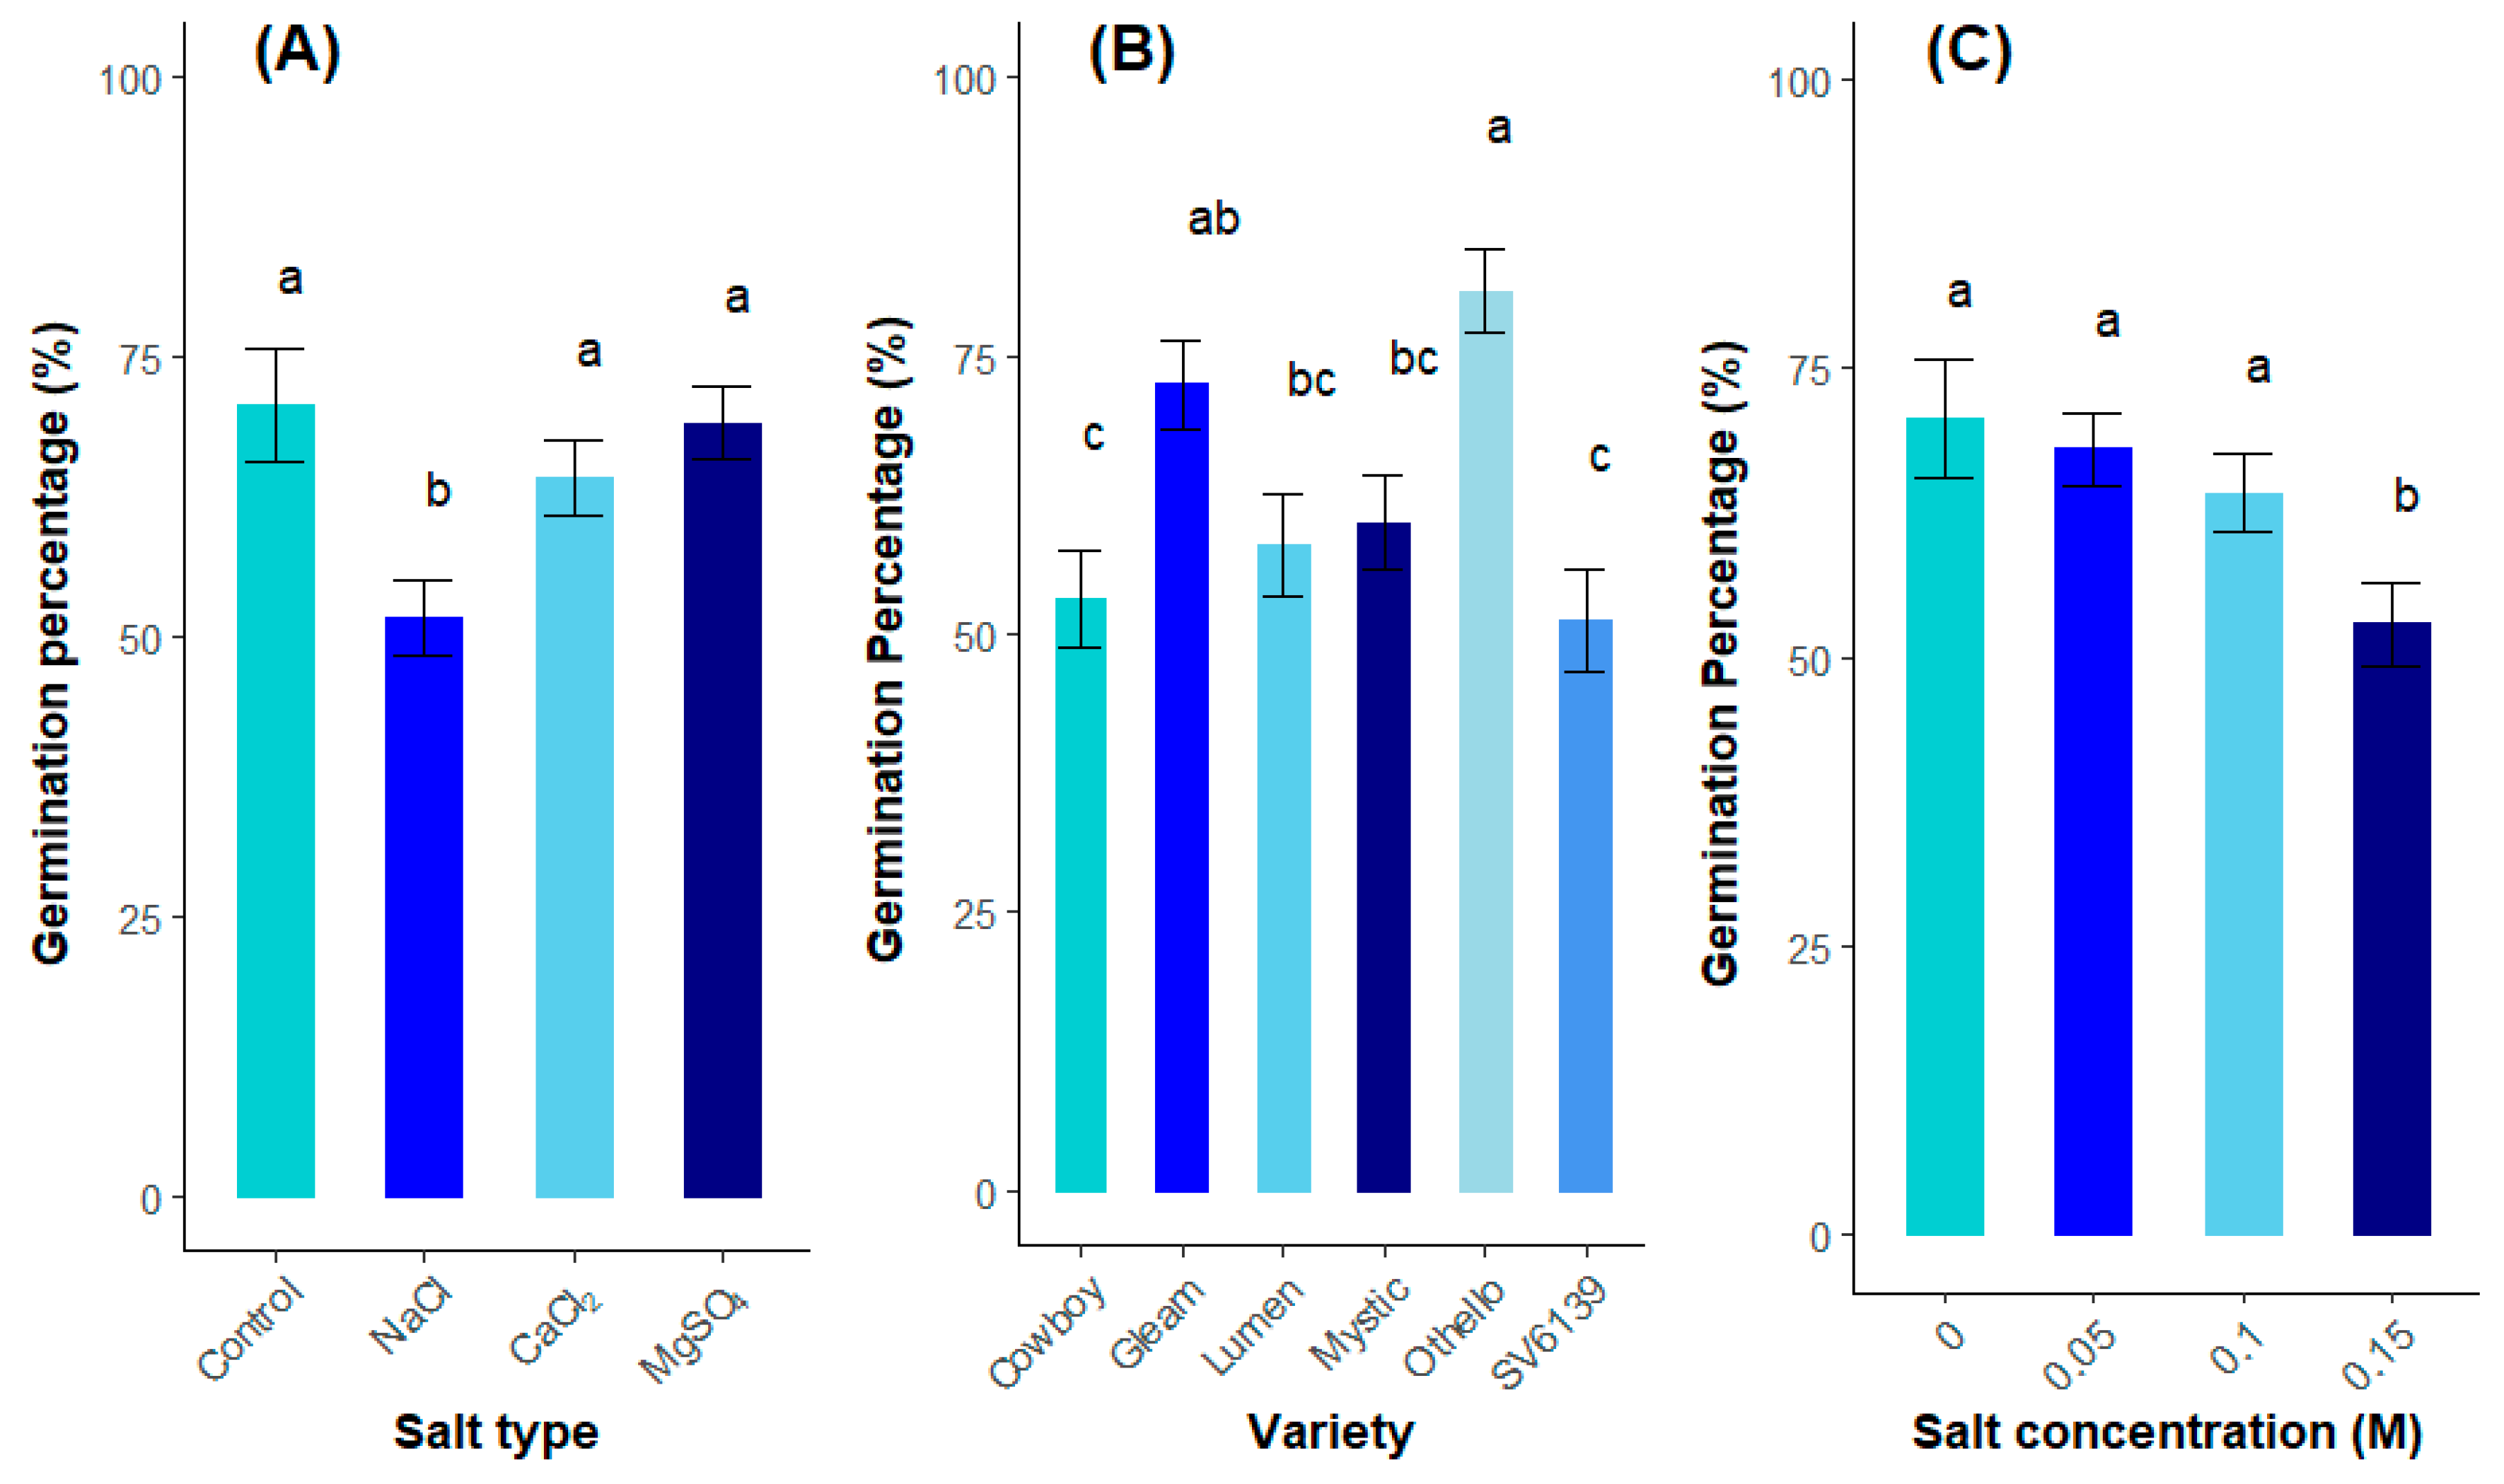
3.1.1. Germination Percentage

Analysis of variance (ANOVA) (Table S1) showed that the types of salt, the pinto bean varieties, and the salt concentrations each significantly (p ≤ 0.05) influenced the germination percentage of pinto bean seeds (Figure 1). The highest germination percentages were recorded in the control, MgSO4, and CaCl2 treatments with 70.6%, 69.1%, and 64.2%, respectively. NaCl presented the lowest germination percentage (51.8%). Regarding germination percentage among varieties, Othello was the variety with the highest germination percentage (80.8%) followed by Gleam (72.4%). The lowest germination percentage was recorded from Cowboy (53.2%) and SV6139 (51.2%). Regarding the germination percentage as influenced by salt concentration, the highest germination percentage was recorded at the 0 concentration (70.6%), representing the control treatment, followed by 0.05 M (68.0%) and 0.1 M (64.2%), respectively. The only salt concentration that was significantly different from the control was 0.15 M (52.9%).

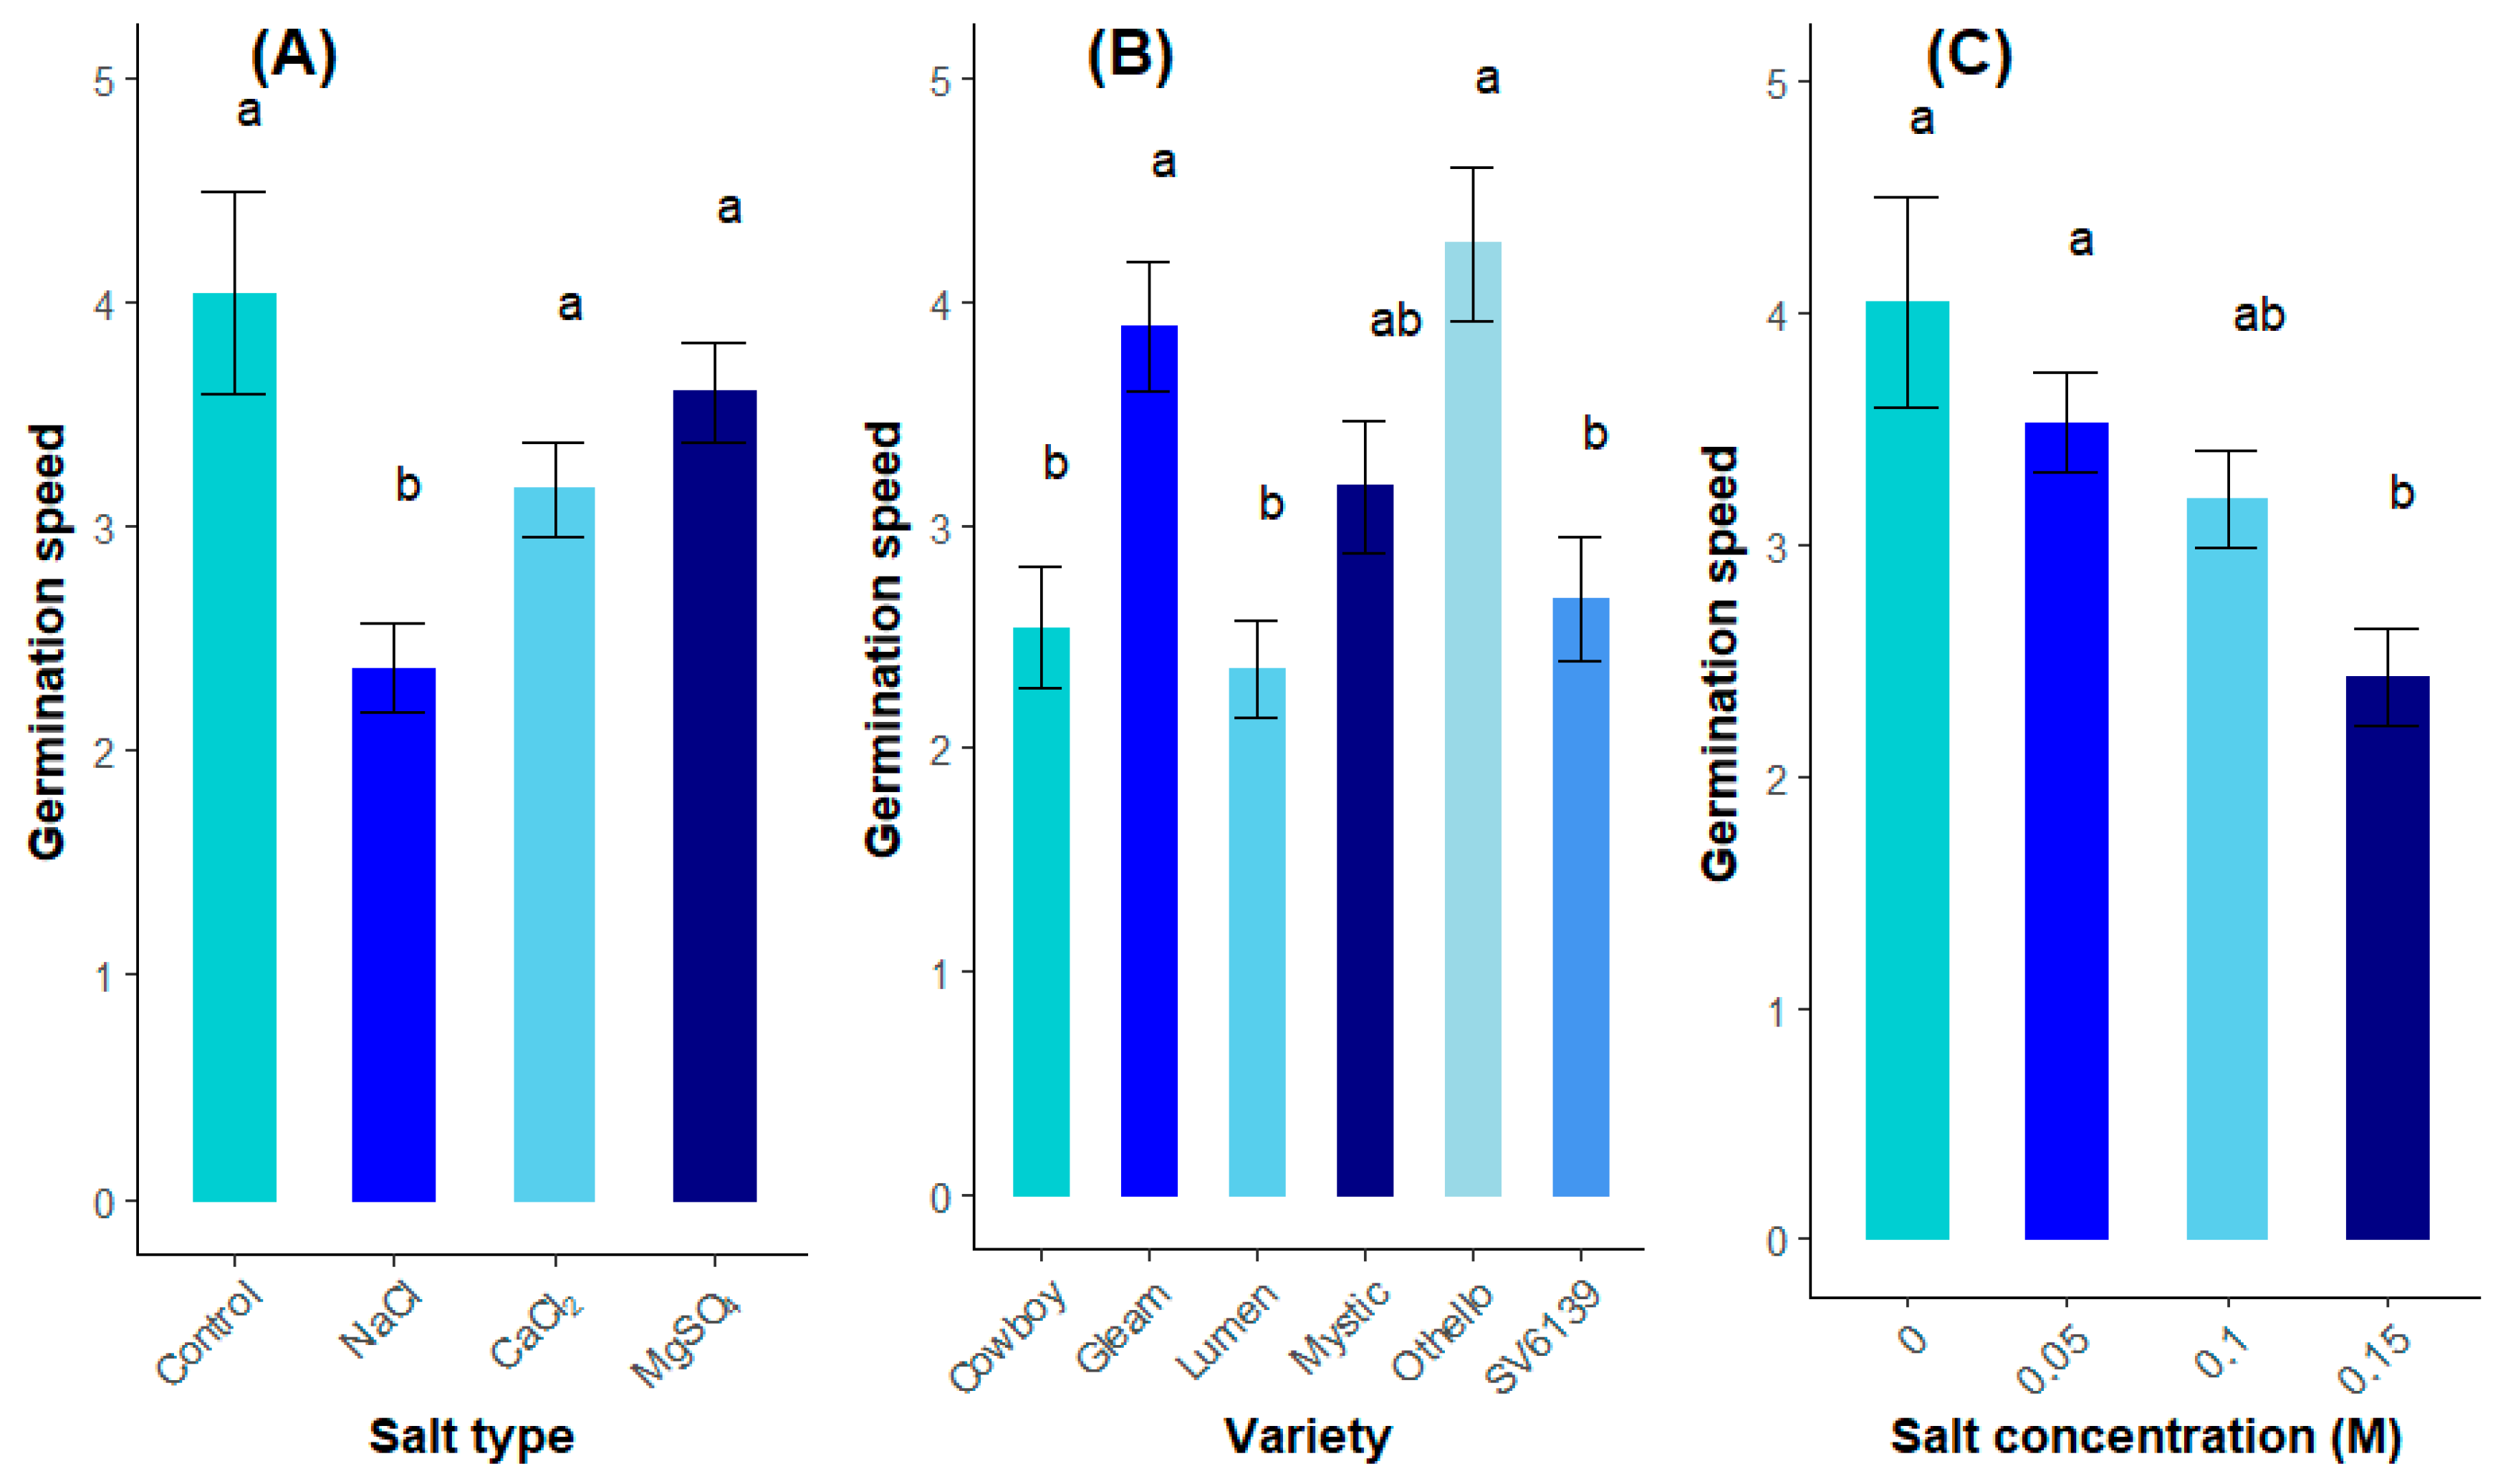
3.1.2. Speed of Germination

Analysis of variance (ANOVA) (Table S1) showed that salt type, pinto bean variety, and salt concentrations each significantly (p ≤ 0.05) influenced the germination speed of pinto bean seeds (Figure 2). The highest germination speeds were recorded in the control, MgSO4, and CaCl2 treatments, with 4.04, 3.60, and 3.17, respectively. NaCl presented the lowest germination speed (2.36). Regarding germination speed among varieties, Othello was the variety with the highest germination speed (4.26) followed by Gleam (3.88) and Mystic (3.17). The lowest germination speeds were recorded for Cowboy (2.54), Lumen (2.36), and SV6139 (2.67); however, there was no statistical difference among Cowboy, Lumen, SV6139, and Mystic. With respect to germination speed as affected by salt concentration, the highest germination speed was recorded at concentration 0 M (4.04), representing the control treatment, followed by 0.05 M (3.52) and 0.1 M (3.19), respectively. The lowest germination speed was recorded at the 0.15 M concentration (2.42). However, there was no statistical difference among 0 M, 0.05 M, and 0.10 M.

3.1.3. Hypocotyl and Radicle Length

The results of the ANOVA analysis (Table S1) indicate statistical differences across salt type, variety, and salt concentrations in hypocotyl and radicle length (Table 3). For the salt types, the highest hypocotyl length was recorded from the control, followed by MgSO4. However, there was no statistical difference between NaCl and CaCl2 which resulted in significantly shorter hypocotyls. Othello was the variety with the longest hypocotyl. However, there was no significant difference between Cowboy, Gleam, Mystic, Othello, and SV6139. The hypocotyl length of Lumen was significantly lower than all other varieties. In terms of salt concentrations, the 0.05 M treatment had the greatest hypocotyl length after the control. Most importantly, as concentration increased, hypocotyl length decreased.
For radicle length, the analysis of variance showed no statistical differences among varieties; however, there was a significant difference among salt types and concentrations (Table S1). The longest radicle length was recorded in CaCl2 followed by the control. However, there was no significant difference between the control and CaCl2, or between the control and MgSO4. Regarding the salt concentrations, there was no significant difference between 0 M, 0.05 M, and 0.1 M in radicle length, but the 0.15 M concentration resulted in significantly shorter radicles.

3.2. Greenhouse Experiment

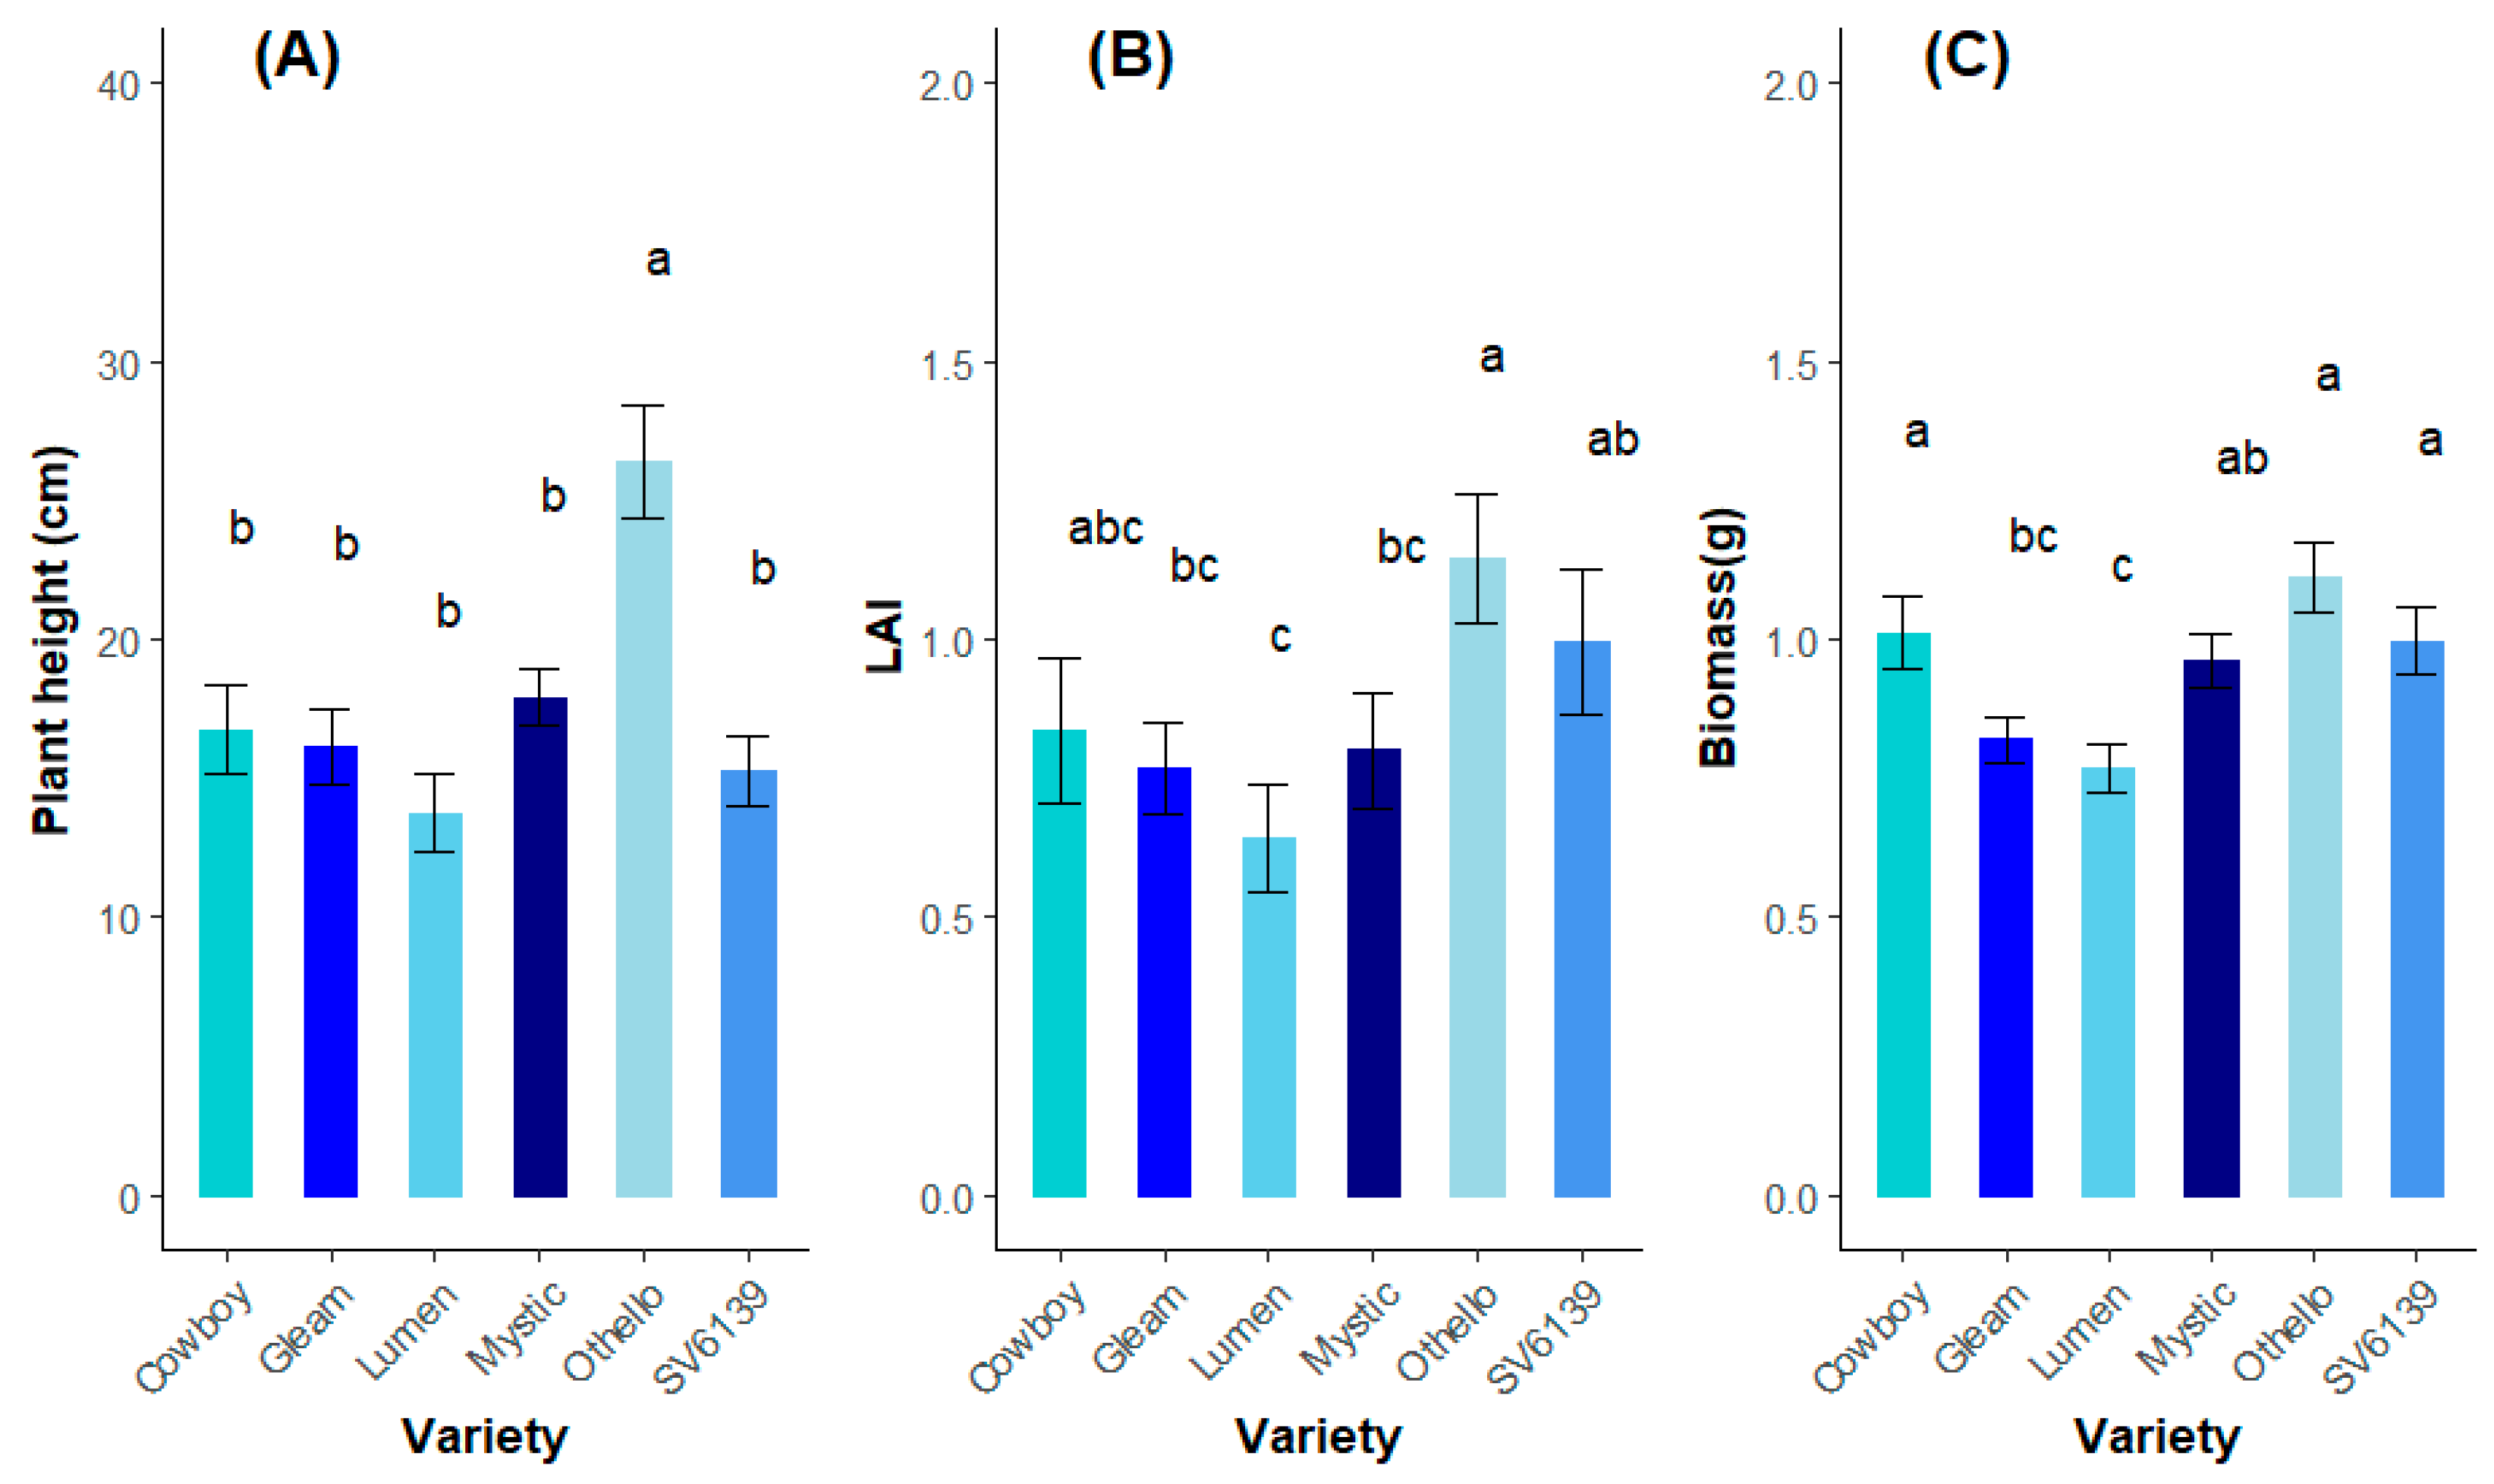
3.2.1. Growth Comparisons among Varieties

The analysis of variance indicated a statistical difference in plant height, LAI, and dry shoot biomass across salt types and varieties (Table S2). Othello was significantly taller than the other varieties with a plant height of 26.4 cm, and Othello also had the highest LAI (1.15) (Figure 3). However, there was no statistical difference in LAI between Othello, Cowboy, and SV6139. The highest dry shoot biomass was also recorded in Othello (1.11 g) followed by Cowboy (1.01 g) and SV6139 (0.99 g). On the other hand, comparison of the relative growth parameters (plant height, LAI, and shoot dry biomass of treatments divided by control) did not reveal any significant difference among varieties.
Regarding the chlorophyll level in young and old leaves, the ANOVA presented evidence that the chlorophyll level of both young and old leaves was influenced by salt type, pinto bean variety, and by the interaction of salt type and variety (Table S2). Overall, Othello was significantly higher than the other varieties in the chlorophyll level of both young and old leaves within each salt type (Table 4). For the salt types, the chlorophyll level of young and old leaves was generally higher in MgSO4 (Table 4).

3.2.2. Flower and Pod Number

The results of the ANOVA (Table S3) show the influence of salt type and variety on flower number at 30 and 38 DAP (Table 5). The salt types presented no significant difference at 30 DAP, although NaCl resulted in fewer flowers than the control and MgSO4 treatments at 38 DAP. Regarding flower number among pinto bean varieties, Othello was significantly different from the other varieties at 30 DAP, in that it was the only variety which flowered this early. Flowers were observed in all the varieties 38 DAP. The highest number of flowers was recorded in Othello (2 flowers plant−1). However, there were no statistical differences among Gleam, Mystic, Othello, and SV6139.
Analysis of variance (Table S3) showed the influence of salt type and variety on pod number at 35 and 47 DAP. MgSO4 had the highest pod number on both sampling dates; however, CaCl2 was not significantly different from MgSO4 at 35 DAP (Table 5). Regarding the pod number in pinto bean varieties, Othello was the only variety with pods present 35 DAP. By 47 DAP, pods were observed in all the varieties, but the highest number of pods was recorded in Othello (3 pods plant−1), which was statistically different from all other varieties.

3.2.3. ECe Analysis of Saturated Paste Extracts

The ANOVA indicates that pinto bean variety had an impact on soil ECe within each salt type, since the interaction between variety and salt types were significant (Table S4). The control (1.03 dS m−1) presented the lowest ECe followed by MgSO4 (3.84 dS m−1), which was significantly lower than CaCl2 (4.80 dS m−1) and NaCl (4.99 dS m−1) (Table 6). For the control, SV6139 had the highest ECe compared to the other varieties, and the lowest ECe was recorded in Othello followed by Lumen. However, in NaCl, the varieties did not present any statistical difference. In CaCl2, Gleam had a significantly higher ECe than Cowboy. Mystic, SV6139, and Cowboy had significantly higher ECe values than Lumen in MgSO4 solution.

4. Discussion

The results from the germination experiment demonstrated reductions in germination percentage and germination speed as salt concentrations increased. Another study on the impact of salinity on seed germination of field pea (P. sativum L.) indicated that the germination and growth parameters of field pea were significantly affected by higher salt concentrations [30]. Research on the effect of salinity on germination and seed physiology of three bean cultivars (P. vulgaris L.) also documented that the germination percentage, seedling growth, and respiration decreased under saline conditions at iso-molar concentrations (100 mM) [31]. Exposure to high salt concentrations not only influences germination inhibition but also reduces germination speed and rate [22]. The effect on seed germination under salinity stress may be attributed to delayed water absorption and a decline in the activity of α-amylase, an enzyme associated with starch hydrolysis [32]. This enzyme breaks down the starch stored in the endosperm into metabolizable sugars that provide energy to the growing embryo and radicle. Hence, a decrease in α-amylase activity results in a notable reduction in the transfer of sugars, which slows the embryo’s growth and development. Consequently, seed germination rate is reduced and delayed [32,33,34,35,36,37]. The α-amylase activity of common bean during germination is an important parameter that could be evaluated in future studies on salt stress tolerance.
Compared to the control and the other salt types, CaCl2 resulted in longer radicles in the germination study. Other investigations have reported that Ca2+ plays an important role in the regulation of plant growth and development [38]. It improves root morphogenesis through mediating phytohormone and stress signaling. Ca2+ impacts primary root (PR) development through auxin accumulation, transport, and signaling, along with the expression of many auxin-related genes. Ca2+ also promotes PR growth by influencing brassinosteroid signaling, an important phytohormone for PR development in plants and stimulates PR growth under both normal and stressful conditions [39,40,41,42]. It has been corroborated that Ca2+ signaling can enable cell wall integrity and modulate PR elongation under salt stress [39,43].
Compared to the other salt types and the control in the greenhouse study, MgSO4 resulted in significantly higher vegetative parameters, such as plant height and chlorophyll level in old and young leaves, and in reproductive parameters, such as flower and pod numbers. This finding suggests that MgSO4 may generate a possible fertilizer effect. Magnesium (Mg) is an essential element for plant growth and development and plays a crucial role in plant defense mechanisms in abiotic stress conditions. It is well known as the central atom of the chlorophyll molecule in the light-absorbing complex of chloroplasts and its contribution to photosynthesis [44,45,46,47]. Mg is a mobile nutrient [48], and its high phloem mobility allows it to be easily transferred to active growing parts of the plant where it is required for chlorophyll composition, enzyme activation for protein biosynthesis, and phloem export of photosynthates [44,49,50]. A meta-analysis showed that Mg fertilization enhances the average yield in crop production by 8.5% [51], and significantly enhanced production of fruits (12.5%), grasses (10.6%), tobacco (9.8%), tubers (9.4%), vegetables (8.9%), cereals (8.2%), oil crops (8.2%), and tea (6.9%) [51]. Another study has indicated that MgSO4 application at 3.0 g/m2 promoted the growth and grain yield of paddy rice and flowers [52].
The positive effect of MgSO4 on growth parameters in the greenhouse study could also be induced by the presence of sulfur (S), another essential nutrient required for plant growth and development [53]. Its deficiency affects disease resistance, performance of plants, the nutritional quality of crops, and yield [54,55]. Plants absorb the anionic form of sulfate (SO42−) from soil through the roots and synthesize S-amino acids cysteine and methionine, a fundamental amino acid for cell and DNA functions [54,55]. Scarcity of the S-containing amino acids cysteine and methionine leads to chlorosis and inhibition of protein synthesis, and leaves of S-deficient plants have low chlorophyll contents [56,57,58,59,60]. A study on the effects of S nutrition on the growth and photosynthesis of rice showed that an increase in the sulfate concentration in the medium up to 0.03 mM resulted in a significant increase in the relative growth rate [60]. Sulfur is a component of numerous protein enzymes that regulate photosynthesis and N fixation [61]. The greatest levels of S are accumulated in cruciferous plants, less in legumes and root vegetables, and the least in grains and grasses [53,62,63]. Because of the role of S in N fixation, it is needed at higher levels for legumes like alfalfa and soybeans than for grass hay and corn [61].
Othello presented the highest germination percentage and germination speed as compared to other varieties in both control and saline conditions. In addition, the greenhouse experiment showed that Othello performed better aboveground in terms of vegetative and reproductive growth than the other varieties. Othello had the highest plant height, maturity, LAI, shoot biomass, and chlorophyll level in young and old leaves. This may have been facilitated by the early season maturity trait of Othello. Othello (PI 578268) was developed by USDA-ARS in cooperation with Washington State University and released in 1986 [64]. Othello is an F7 selection from the lineage ‘NW-410’ Pinto/2/‘Victor’ Pink/‘Aurora’ (NW-410 = ‘Pinto UI-114’/‘Sutter Pink’; Victor = ‘Red Mexican UI-35’/1/PI 203958/2 UI-35/3/Sutter Pink/4/Aurora). It was identified as GH-215 and tested thoroughly in the Pacific Northwest from 1984 to 1986, in the inter-regional Cooperative Dry Bean Nursery (CDBN) across the USA and Canada. Othello equaled or exceeded other pinto cultivars in seed yield, size, and quality [64]. It has very early maturity (70 to 90 days), and the plants are vigorous, short, and adequately rigid [53]. A study on bean common mosaic virus and rust-resistant pinto bean cultivars reported that the mean seed weight for Othello compared to two other varieties (UIP35 and UIP40) was higher across 10 locations in the CDBN in the USA and Canada in 2015 [65]. Other results in the same study showed that the cultivar Othello (85 d) had early maturity compared to other varieties tested [Blackfoot (86 d), Nez Perce (94 d), Twin Falls (108 d)] in the greenhouse at Kimberly, ID [65].
Although Othello had the greatest plant height, LAI, and shoot biomass under saline conditions compared to the other varieties, the relative height, LAI, and shoot biomass were not significantly different among varieties. Othello’s early maturity gave it an advantage under both control and saline conditions.
Other salt-tolerant plants, called halophytes, use a mechanism of osmotic adjustment to maintain water uptake under salinity and drought stress by accumulating large quantities of osmolytes, especially organic solutes and inorganic ions [13,66,67,68]. Organic solutes, including amino acids, glycerol, sugars, proline, glycine-betaine, polyamines, and other low molecular weight metabolites, serve a function in cells to lower or balance the osmotic potential of intracellular and extracellular ions in resistance to osmotic stresses. Inorganic ions used for osmotic adjustment are primarily Na+, K+, Ca2+, and Cl. Inorganic ions are beneficial in osmotic adjustment through ion transport processes with related ion antiporters and ion channels [13,66]. Salinity stress induces the synthesis of osmolytes [13,69]. Some mechanisms of salt tolerance include strategies for ion exclusion from salt-sensitive organs by containing them in less sensitive areas such as the root, old leaves, or vacuoles. For this reason, some plants compartmentalize Na+ into the vacuoles of most tissues to reduce the toxic concentration of Na+ in the cytosol, thereby protecting plants from salinity stress [13,70,71]. However, salt-sensitive plants, such as dry beans, generally do not use the same salt accumulation avoidance mechanism.

5. Conclusions

In semi-arid regions dependent on irrigation for agricultural production, soil and water salinity threaten agricultural sustainability. To tackle these threats, changes can be made in soil and water management, crop alternatives, and variety selection. This study provides information to aid farmers in choosing varieties of a saline sensitive crop (pinto beans) which could permit them to successfully continue pinto bean production in a region undergoing salinization.
High salt concentrations affected the germination percentage and speed of the pinto bean varieties evaluated in this study. As concentration increased, germination percentage, germination speed, and hypocotyl length decreased. The course of germination was significantly negatively affected by NaCl, and CaCl2 enhanced the radicle length.
Each variety responded differently to saline conditions during their vegetative and reproductive stages. This study showed that salt buildup over time caused a height reduction, especially in soil affected by NaCl and CaCl2. Othello (an early maturing variety) started flowering earlier than all the other varieties, regardless of salt treatment. Flower and pod numbers were negatively affected by the presence of NaCl or CaCl2 applications for most varieties. The growth variables measured in this study presented significantly higher performance in the control and MgSO4 treatments than in the Cl salt treatments.
Pinto beans are sensitive to salinity, but the extent of sensitivity varied among cultivars and salt types. Farmers growing beans in saline soils or with saline irrigation water may be able to avoid negative yield impacts by selecting an early maturing or salt-tolerant variety. This research demonstrates that Othello’s early maturity contributed to its improved growth under saline conditions as compared to other pinto bean varieties.

Supplementary Materials

The following supporting information can be downloaded at https://www.mdpi.com/article/10.3390/agronomy14091877/s1: Table S1: ANOVA for germination percentage (GP), germination speed (GS), hypocotyl length (HL), and radicle length (RL) showing main effects and two and three factor interactions; Table S2: ANOVA for plant height, leaf area index (LAI), dry shoot biomass, and chlorophyll level in old and young leaves, showing main effects and the two-factor interaction; Table S3: ANOVA for flower numbers 30 and 38 days after planting, and pod numbers 35 and 47 days after planting showing main effects and the two-factor interaction; Table S4: ANOVA for EC (saturated paste extract) showing main effects and the two-factor interaction.

Author Contributions

Conceptualization, W.S.P., A.A. and J.G.D.; methodology, W.S.P., A.A., A.A.A., Y.Q. and J.G.D.; investigation, W.S.P.; resources, J.G.D.; writing—original draft, W.S.P.; writing—review and editing, A.A., A.A.A., Y.Q. and J.G.D.; supervision, J.G.D. All authors have read and agreed to the published version of the manuscript.

Funding

This research was funded by the COLORADO AGRICULTURAL EXPERMENT STATION.

Data Availability Statement

Data are contained within the article and Supplementary Materials.

Conflicts of Interest

The authors declare no conflicts of interest.

References

  1. Keshavarz, R.; Didinger, C.; Duncan, A.; Thompson, H.J. Pulse Crops and Their Key Role as Staple Foods in Healthful Eating Patterns. In Colorado State University Extension Factsheet 0.312; Colorado State University: Fort Collins, CO, USA, 2020; Available online: https://extension.colostate.edu/topic-areas/agriculture/pulse-crops-and-their-key-role-as-staple-foods-in-healthful-eating-patterns-0-313/ (accessed on 15 July 2024).
  2. Didinger, C.; Thompson, H.J. The role of pulses in improving human health: A review. Legume Sci. 2022, 4, e147. [Google Scholar] [CrossRef]
  3. Keeping the Spotlight on Pulses: “Roots” for Sustainable Agriculture and Food Security. United Nations. Available online: https://www.un.org/en/un-chronicle/keeping-spotlight-pulses-%E2%80%9Croots%E2%80%9D-sustainable-agriculture-and-food-security (accessed on 15 July 2024).
  4. Ghassemi-Golezani, K.; Nikpour-Rashidabad, N.; Zehtab-Salmasi, S. Effect of salinity on yield and yield components of pinto bean cultivars. Int. J. Plant Anim. Environ. Sci. 2012, 2, 47–51. [Google Scholar]
  5. Schwartz, H.F.; Brick, M.A. Eco-Tillage, Biopesticide and Resistance Management of White Mold in Dry Bean. Available online: https://www.ars.usda.gov/ARSUserFiles/30000000/WhiteMoldResearch/AnnualMeetingFiles/2004/Schwartz.pdf (accessed on 15 July 2024).
  6. Colorado Beans Are a Magical Ingredient—Colorado Proud’s January Recipe of the Month. Colorado Department of Agriculture. Available online: https://ag.colorado.gov/press-release/colorado-beans-are-a-magical-ingredient-colorado-prouds-january-recipe-of-the-month (accessed on 15 July 2024).
  7. Dealers—Colorado Dry Beans. Available online: https://coloradodrybeans.org/colorado-dry-bean-committee/dealers/ (accessed on 15 July 2024).
  8. Duwadi, K.; Austin, R.S.; Mainali, H.R.; Bett, K.; Marsolais, F.; Dhaubhadel, S. Slow darkening of pinto bean seed coat is associated with significant metabolite and transcript differences related to proanthocyanidin biosynthesis. BMC Genom. 2018, 19, 260. [Google Scholar] [CrossRef]
  9. Park, D.; Maga, J.A. Dry bean (Phaseolis vulgaris) color stability as influenced by time and moisture content. J. Food Process. Preserv. 1999, 23, 515–522. [Google Scholar] [CrossRef]
  10. Hildebrant, D. Slow-Darkening Pinto Beans Developed by NDSU. Farm & Ranch Guide 2020. Available online: https://agupdate.com/farmandranchguide/news/crop/slow-darkening-pinto-beans-developed-by-ndsu/article_f8bf7bf4-d745-11ea-8d06-5fdf555291a3.html (accessed on 15 July 2024).
  11. Rhoades, J.D.; Kandiah, A.; Mashali, A.M. The Use of Saline Waters for Crop Production; FAO Irrigation and Drainage Paper; Food and Agriculture Organization, United Nations: Rome, Italy, 1992; ISBN 978-92-5-103237-4. [Google Scholar]
  12. Cardon, G.E.; Davis, J.G.; Bauder, T.A.; Waskom, R.M. Managing Saline Soils. In Colorado State University Extension Factsheet 0.503; Colorado State University: Fort Collins, CO, USA, 2014; Available online: https://extension.colostate.edu/topic-areas/agriculture/managing-saline-soils-0-503/ (accessed on 15 July 2024).
  13. Bernstein, N. Chapter 5—Plants and salt: Plant response and adaptations to salinity. In Model Ecosystems in Extreme Environments; Seckbach, J., Rampelotto, P., Eds.; Astrobiology Exploring Life on Earth and Beyond; Academic Press: Cambridge, MA, USA, 2019; pp. 101–112. ISBN 978-0-12-812742-1. [Google Scholar]
  14. Joshi, R.; Durgesh, K. Salt stress in pulses: A learning from global research on salinity in crop plants. Indian J. Genet. Plant Breed. 2021, 81, 159–185. [Google Scholar] [CrossRef]
  15. Keshtiban, R.K.; Carvani, V.; Imandar, M. Effects of salinity stress and drought due to different concentrations of sodium chloride and polyethylene glycol 6000 on germination and seedling growth characteristics of pinto bean (Phaseolus vulgaris L.). Adv. Environ. Biol. 2015, 9, 229–235. [Google Scholar]
  16. Dasgan, H.; Koc, S. Evaluation of salt tolerance in common bean genotypes by ion regulation and searching for screening parameters. J. Food Agric. Environ. 2009, 77, 363–372. [Google Scholar]
  17. Niknam, S.R.; McComb, J. Salt tolerance screening of selected Australian woody species—A review. For. Ecol. Manag. 2000, 139, 1–19. [Google Scholar] [CrossRef]
  18. Kökten, K.; Karaköy, T.; Bakoglu, A.; Akçura, M. Determination of salinity tolerance of some lentil (Lens culinaris M.) varieties. J. Food Agric. Env. 2009, 8, 140–143. [Google Scholar]
  19. Goertz, S.H.; Coons, J.M. Tolerance of tepary and navy beans to NaCl during germination and emergence. HortScience 1991, 26, 246–249. [Google Scholar] [CrossRef]
  20. Salim, M.; Pitman, M.G. Salinity tolerance of mung bean (Vigna radiata L.): Seed production. Biol. Plant. 1988, 30, 53–57. [Google Scholar] [CrossRef]
  21. Afkairin, A.; Dixon, M.M.; Buchanan, C.; Ippolito, J.A.; Manter, D.K.; Davis, J.G.; Vivanco, J.M. Harnessing phosphorous (P) fertilizer-insensitive bacteria to enhance rhizosphere P bioavailability in legumes. Microorganisms 2024, 12, 353. [Google Scholar] [CrossRef] [PubMed]
  22. Rubio-Casal, A.E.; Castillo, J.M.; Luque, C.J.; Figueroa, M.E. Influence of salinity on germination and seeds viability of two primary colonizers of Mediterranean salt pans. J. Arid. Environ. 2003, 53, 145–154. [Google Scholar] [CrossRef]
  23. Ehtaiwesh, A.; Emsahel, M. Impact of salinity stress on germination and growth of pea (Pisum sativum L.) plants. Al-Mukhtar J. Sci. 2020, 35, 146–159. [Google Scholar] [CrossRef]
  24. Official Series Description—GARRETT Series. United States Department of Agriculture. Available online: https://soilseries.sc.egov.usda.gov/OSD_Docs/G/GARRETT.html (accessed on 15 July 2024).
  25. Rhoades, J.D. Salinity: Electrical conductivity and total dissolved solids. In Methods of Soil Analysis; John Wiley & Sons, Ltd.: New York, NY, USA, 1996; pp. 417–435. ISBN 978-0-89118-866-7. [Google Scholar]
  26. Olsen, S.R. Estimation of Available Phosphorus in Soils by Extraction with Sodium Bicarbonate; United States Department of Agriculture: Washington, DC, USA, 1954.
  27. Davis, J.; Brick, M. Fertilizing Dry Beans. In Colorado State University Extension Factsheet 0.539; Colorado State University: Fort Collins, CO, USA, 2009; Available online: https://extension.colostate.edu/topic-areas/agriculture/fertilizing-dry-beans-0-539/ (accessed on 15 July 2024).
  28. Schneider, C.A.; Rasband, W.S.; Eliceiri, K.W. NIH image to ImageJ: 25 years of image analysis. Nat. Methods 2012, 9, 671–675. [Google Scholar] [CrossRef]
  29. Gutierrez, M.; Escalante-Estrada, J.; Rodriguez-Gonzalez, M. Differences in salt tolerance between Phaseolus vulgaris and Phaseolus coccineus cultivars. Int. J. Agric. Res. 2009, 4, 270–278. [Google Scholar] [CrossRef]
  30. Wolde, G.; Adamu, C. Impact of salinity on seed germination and biomass yields of field pea (Pasum satrium L.). Asian J. Sci. Tech. 2018, 9, 7565–7569. [Google Scholar]
  31. Kaymakanova, M. Effect of salinity on germination and seed physiology in bean (Phaseolus vulgaris L.). Biotechnol. Biotechnol. Equip. 2009, 23, 326–329. [Google Scholar] [CrossRef]
  32. Atta, K.; Mondal, S.; Gorai, S.; Singh, A.P.; Kumari, A.; Ghosh, T.; Roy, A.; Hembram, S.; Gaikwad, D.J.; Mondal, S.; et al. Impacts of salinity stress on crop plants: Improving salt tolerance through genetic and molecular dissection. Front. Plant Sci. 2023, 14, 1241736. [Google Scholar] [CrossRef]
  33. Munns, R.; Passioura, J.B.; Colmer, T.D.; Byrt, C.S. Osmotic adjustment and energy limitations to plant growth in saline soil. New Phytol. 2020, 225, 1091–1096. [Google Scholar] [CrossRef]
  34. Daszkowska-Golec, A. Arabidopsis seed germination under abiotic stress as a concert of action of phytohormones. OMICS J. Integr. Biol. 2011, 15, 763–774. [Google Scholar] [CrossRef]
  35. EL Sabagh, A.; Islam, M.S.; Skalicky, M.; Ali Raza, M.; Singh, K.; Anwar Hossain, M.; Hossain, A.; Mahboob, W.; Iqbal, M.A.; Ratnasekera, D.; et al. Salinity stress in wheat (Triticum aestivum L.) in the changing climate: Adaptation and management strategies. Front. Agron. 2021, 3, 661932. [Google Scholar] [CrossRef]
  36. Weiss, D.; Ori, N. Mechanisms of cross talk between gibberellin and other hormones. Plant Physiol. 2007, 144, 1240–1246. [Google Scholar] [CrossRef] [PubMed]
  37. Hasanuzzaman, M.; Raihan, M.R.H.; Masud, A.A.C.; Rahman, K.; Nowroz, F.; Rahman, M.; Nahar, K.; Fujita, M. Regulation of reactive oxygen species and antioxidant defense in plants under salinity. Int. J. Mol. Sci. 2021, 22, 9326. [Google Scholar] [CrossRef] [PubMed]
  38. Hepler, P.K. Calcium: A central regulator of plant growth and development. Plant Cell 2005, 17, 2142–2155. [Google Scholar] [CrossRef] [PubMed]
  39. Zhang, X.P.; Ma, C.X.; Sun, L.R.; Hao, F.S. Roles and mechanisms of Ca2+ in regulating primary root growth of plants. Plant Signal. Behav. 2020, 15, 1748283. [Google Scholar] [CrossRef] [PubMed]
  40. Bergonci, T.; Ribeiro, B.; Ceciliato, P.H.O.; Guerrero-Abad, J.C.; Silva-Filho, M.C.; Moura, D.S. Arabidopsis Thaliana RALF1 opposes brassinosteroid effects on root cell elongation and lateral root formation. J. Exp. Bot. 2014, 65, 2219–2230. [Google Scholar] [CrossRef]
  41. Wei, Z.; Li, J. Brassinosteroids regulate root growth, development, and symbiosis. Mol. Plant 2016, 9, 86–100. [Google Scholar] [CrossRef]
  42. Campos, W.F.; Dressano, K.; Ceciliato, P.H.; Guerrero-Abad, J.C.; Silva, A.L.; Fiori, C.S.; Canto, A.M.D.; Bergonci, T.; Claus, L.A.; Silva-Filho, M.C.; et al. Arabidopsis thaliana rapid alkalinization factor 1–mediated root growth inhibition is dependent on calmodulin-like protein 38. J. Biol. Chem. 2018, 293, 2159–2171. [Google Scholar] [CrossRef]
  43. Feng, W.; Kita, D.; Peaucelle, A.; Cartwright, H.N.; Doan, V.; Duan, Q.; Liu, M.-C.; Maman, J.; Steinhorst, L.; Schmitz-Thom, I.; et al. The feronia receptor kinase maintains cell-wall integrity during salt stress through Ca2+ signaling. Curr. Biol. 2018, 28, 666–675. [Google Scholar] [CrossRef]
  44. Cakmak, I.; Kirkby, E.A. Role of magnesium in carbon partitioning and alleviating photooxidative damage. Physiol. Plant. 2008, 133, 692–704. [Google Scholar] [CrossRef] [PubMed]
  45. Senbayram, M.; Gransee, A.; Wahle, V.; Thiel, H. Role of magnesium fertilisers in agriculture: Plant–soil continuum. Crop Pasture Sci. 2015, 66, 1219–1229. [Google Scholar] [CrossRef]
  46. Cakmak, I.; Yazici, A. Magnesium: A forgotten element in crop production. Better Crops 2010, 94, 23–25. [Google Scholar]
  47. Gerendás, J.; Führs, H. The significance of magnesium for crop quality. Plant Soil 2013, 368, 101–128. [Google Scholar] [CrossRef]
  48. Marschner, H. Preface to second edition. In Marschner’s Mineral Nutrition of Higher Plants, 3rd ed.; Marschner, P., Ed.; Academic Press: San Diego, CA, USA, 2012; p. ix. ISBN 978-0-12-384905-2. [Google Scholar]
  49. White, P.J.; Broadley, M.R. Biofortification of crops with seven mineral elements often lacking in human diets—Iron, zinc, copper, calcium, magnesium, selenium and iodine. New Phytol. 2009, 182, 49–84. [Google Scholar] [CrossRef] [PubMed]
  50. Gransee, A.; Führs, H. Magnesium mobility in soils as a challenge for soil and plant analysis, magnesium fertilization and root uptake under adverse growth conditions. Plant Soil 2013, 368, 5–21. [Google Scholar] [CrossRef]
  51. Wang, Z.; Hassan, M.U.; Nadeem, F.; Wu, L.; Zhang, F.; Li, X. Magnesium fertilization improves crop yield in most production systems: A meta-analysis. Front. Plant Sci. 2020, 10, 1727. [Google Scholar] [CrossRef]
  52. Biswas, B.; Dey, D.; Pal, S.; Kole, N. Integrative effect of magnesium sulphate on the growth of flowers and grain yield of paddy: A chemist’s perspective. Rasayan J. Chem. 2013, 6, 300–302. [Google Scholar]
  53. Narayan, O.P.; Kumar, P.; Yadav, B.; Dua, M.; Johri, A.K. Sulfur nutrition and its role in plant growth and development. Plant Signal. Behav. 2023, 18, 2030082. [Google Scholar] [CrossRef]
  54. Kopriva, S.; Malagoli, M.; Takahashi, H. Sulfur nutrition: Impacts on plant development, metabolism, and stress responses. J. Exp. Bot. 2019, 70, 4069–4073. [Google Scholar] [CrossRef]
  55. Dietz, K.-J.; Heilos, L. Carbon metabolism in spinach leaves as affected by leaf age and phosphorus and sulfur nutrition. Plant Physiol. 1990, 93, 1219–1225. [Google Scholar] [CrossRef] [PubMed]
  56. Xu, H.; Lopez-Baltazar, J.; Rachii, F.; Tremblay, N.; Gauthier, L.; Desjardins, Y.; Gosselin, A. Effect of sulphate on photosynthesis in greenhouse–grown tomato plants. Physiol. Plant. 2006, 96, 722–726. [Google Scholar] [CrossRef]
  57. SO42− Deprivation Has an Early Effect on the Content of Ribulose-1,5-Bisphosphate Carboxylase/Oxygenase and Photosynthesis in Young Leaves of Wheat. Rothamsted Research. Available online: https://repository.rothamsted.ac.uk/item/8w157/so42-deprivation-has-an-early-effect-on-the-content-of-ribulose-1-5-bisphosphate-carboxylase-oxygenase-and-photosynthesis-in-young-leaves-of-wheat (accessed on 15 July 2024).
  58. Lencioni, L.; Ranieri, A.; Fergola, S.; Soldatini, G.F. Photosynthesis and metabolic changes in leaves of rapeseed grown under long-term sulfate deprivation. J. Plant Nutr. 1997, 20, 405–415. [Google Scholar] [CrossRef]
  59. Blake-Kalff, M.M.A.; Harrison, K.R.; Hawkesford, M.J.; Zhao, F.J.; McGrath, S.P. Distribution of sulfur within oilseed rape leaves in response to sulfur deficiency during vegetative growth. Plant Physiol. 1998, 118, 1337–1344. [Google Scholar] [CrossRef]
  60. Resurreccion, A.P.; Makino, A.; Bennett, J.; Mae, T. Effects of sulfur nutrition on the growth and photosynthesis of rice. Soil Sci. Plant Nutr. 2001, 47, 611–620. [Google Scholar] [CrossRef]
  61. Place, S.; Kilcer, T.; Ketterings, Q.; Cherney, D.; Cherney, J. Sulfur for Field Crops. Cornell University Cooperative Extension, Agronomy Fact Sheet 34. Available online: http://nmsp.cals.cornell.edu/guidelines/factsheets.html (accessed on 19 July 2024).
  62. Jones, M.B. Sulfur availability indexes. In Sulfur in Agriculture; John Wiley & Sons, Ltd.: New York, NY, USA, 1986; pp. 549–566. ISBN 978-0-89118-220-7. [Google Scholar]
  63. Zhao, F.; Tausz, M.; De Kok, L.J. Role of sulfur for plant production in agricultural and natural ecosystems. In Sulfur Metabolism in Phototrophic Organisms; Hell, R., Dahl, C., Knaff, D., Leustek, T., Eds.; Springer: Dordrecht, The Netherlands, 2008; pp. 417–435. ISBN 978-1-4020-6863-8. [Google Scholar]
  64. Burke, D.W.; Silbernagel, M.J.; Kraft, J.M.; Koehler, H.H. Registration of ‘Othello’ pinto bean. Crop Sci. 1995, 35, 943. [Google Scholar] [CrossRef]
  65. Singh, S.P.; Miklas, P.N.; Brick, M.A.; Schwartz, H.F.; Urrea, C.A.; Terán, H.; Centeno, C.; Ogg, B.; Otto, K.; Soler, A. Pinto bean cultivars Blackfoot, Nez Perce, and Twin Falls. J. Plant Regist. 2017, 11, 212–217. [Google Scholar] [CrossRef]
  66. Chen, H.; Jiang, J.-G. Osmotic adjustment and plant adaptation to environmental changes related to drought and salinity. Environ. Rev. 2010, 18, 309–319. [Google Scholar] [CrossRef]
  67. Munns, R. Why measure osmotic adjustment? Funct. Plant Biol. 1988, 15, 717–726. [Google Scholar] [CrossRef]
  68. Hsiao, T.C.; Acevedo, E.; Fereres, E.; Henderson, D.W.; Monteith, J.L.; Weatherley, P.E. Water stress, growth and osmotic adjustment. Philos. Trans. R. Soc. Lond. B Biol. Sci. 1997, 273, 479–500. [Google Scholar] [CrossRef]
  69. Stepien, P.; Johnson, G.N. Contrasting responses of photosynthesis to salt stress in the glycophyte Arabidopsis and the halophyte Thellungiella: Role of the plastid terminal oxidase as an alternative electron sink. Plant Physiol. 2009, 149, 1154–1165. [Google Scholar] [CrossRef] [PubMed]
  70. Keisham, M.; Mukherjee, S.; Bhatla, S.C. Mechanisms of sodium transport in plants—Progresses and challenges. Int. J. Mol. Sci. 2018, 19, 647. [Google Scholar] [CrossRef] [PubMed]
  71. Zhu, J.-K. Regulation of ion homeostasis under salt stress. Curr. Opin. Plant Biol. 2003, 6, 441–445. [Google Scholar] [CrossRef] [PubMed]
Figure 1. Germination percentage as affected by (A) salt type, (B) variety, and (C) salt concentrations. Error bars represent the standard error of each mean. Salt types, varieties, and salt concentrations with a common letter are not significantly different (p < 0.05) based on Tukey’s HSD Test.
Agronomy 14 01877 g001
Figure 2. Germination speed as affected by (A) salt type, (B) variety, and (C) salt concentrations. Error bars represent the standard error of each mean. Salt types, varieties, and salt concentrations with a common letter are not significantly different (p < 0.05) based on Tukey’s HSD Test.
Agronomy 14 01877 g002
Figure 3. Variety effects on (A) plant height 38 days after planting, (B) leaf area index (LAI) 39 days after planting, and (C) dry shoot biomass 55 days after planting in the greenhouse experiment. Error bars represent the standard error of each mean. Varieties with a common letter are not significantly different (p < 0.05) based on Tukey’s HSD Test.
Agronomy 14 01877 g003
Table 1. Physical and chemical properties of the soil used in the greenhouse experiment.
ParameterValue
pH 18.1
Electrical conductivity 2 (dS m−1)0.78
OM 3 (%)1.6
Nitrate-N 4 (mg kg−1)3.2
Olsen-P 5 (mg kg−1)6
1 A 1:1 soil–water analysis was used to measure the soil pH by shaking the soil with deionized water for two hours prior to assessment [25]. 2 Electrical conductivity was measured using the modified saturated paste method. 3 Loss on Ignition analysis was used to determine the level of OM (organic matter) content in the soil. 4 The Nitrate-N was determined by Flow Injection Analysis in 1 M KCl extracts. 5 The P content in the soil was determined by Sodium Bicarbonate Olsen-P extraction [26].
Table 2. The type and level of salt concentration and electrical conductivity (EC) in the irrigation water treatments.
SaltConcentration (M)EC 1 (dS m−1)
NaCl0.055.04
CaCl20.105.01
MgSO4·7H2O0.155.00
1 The EC was measured by placing one drop of each saline solution into an EC tester (Oakton ECTestr high conductivity tester, 0 to 19.99 dS/m).
Table 3. The effect of salt type, pinto bean variety, and salt concentration on hypocotyl length and radicle length.
FactorsHypocotyl LengthRadicle Length
-------------------------cm-------------------------
Salt types
Control1.09 (0.04) 1 a2.47 (0.18) ab
NaCl0.85 (0.02) c1.61 (0.08) c
CaCl20.87 (0.02) c3.02 (0.17) a
MgSO40.98 (0.03) b2.38 (0.11) b
Variety
Cowboy0.92 (0.04) a2.67 (0.19) a
Gleam0.94 (0.02) a2.60 (0.18) a
Lumen0.76 (0.03) b2.17 (0.16) a
Mystic0.95 (0.03) a2.16 (0.16) a
Othello1.01 (0.03) a2.59 (0.16) a
SV61390.93 (0.05) a2.05 (0.17) a
Salt concentrations (M)
01.09 (0.04) a2.47 (0.18) a
0.050.94 (0.03) b2.77 (0.14) a
0.10.92 (0.02) bc2.53 (0.14) a
0.150.83 (0.03) c1.72 (0.09) b
1 Means of five replicates with standard error (SE) in parentheses. Salt types, varieties, and salt concentrations trait with a common letter are not significantly different (p < 0.05) based on Tukey’s HSD Test.
Table 4. The chlorophyll level of young and old leaves within salt types 40 days after planting in the greenhouse study.
FactorsYoung LeavesOld Leaves
Salt types (Control)
Cowboy31.9 (1.43) 1 ab34.9 (1.92) ab
Gleam22.3 (1.37) c34.3 (1.28) ab
Lumen24.6 (3.12) bc31.7 (4.16) b
Mystic29.1 (1.96) abc36.3 (1.61) ab
Othello35.3 (1.29) a41.5 (0.91) a
SV613928.1 (3.45) abc36.2 (2.32) ab
Salt type (NaCl)
Cowboy13.1 (3.36) b5.9 (3.96) b
Gleam16.0 (2.21) ab13.7 (4.78) ab
Lumen15.9 (1.720 ab7.9 (4.08) b
Mystic25.7 (4.07) a28.3 (3.94) a
Othello26.8 (2.36) a26.0 (2.47) a
SV61399.3 (2.81) b12.4 (4.61) ab
Salt type (CaCl2)
Cowboy11.4 (3.16) a3.0 (3.02) c
Gleam22.4 (3.15) a5.6 (3.76) bc
Lumen16.1 (3.34) a11.3 (4.12) abc
Mystic22.5 (2.57) a20.8 (4.82) ab
Othello24.0 (3.54) a24.8 (3.17) a
SV613917.5 (4.60) a13.3 (4.93) abc
Salt type (MgSO4)
Cowboy33.1 (1.13) ab42.4 (1.15) a
Gleam29.6 (2.52) b35.1 (4.14) a
Lumen31.0 (1.88) b39.9 (1.77) a
Mystic31.8 (2.68) b40.2 (1.56) a
Othello40.4 (0.95) a44.3 (1.47) a
SV613937.5 (2.05) ab39.4 (4.64) a
1 Means of 10 replicates with standard error (SE) in parentheses. Varieties with a common letter within salt type are not significantly different (p < 0.05) based on Tukey’s HSD Test.
Table 5. The effect of salt type and pinto bean variety on flower and pod number.
FactorsFlower Number
30 Days after Planting
Flower Number
38 Days after Planting
Pod Number 35 Days after PlantingPod Number
47 Days after
Planting
Salt types
Control0.2 (0.09) 1 a1.3 (0.16) a0.2 (0.10) b2.0 (0.21) b
NaCl0.2 (0.07) a0.7 (0.20) b0.2 (0.10) b0.3 (0.10) c
CaCl20.1 (0.05) a1.0 (0.18) ab0.3 (0.12) ab1.0 (0.21) c
MgSO40.3 (0.10) a1.4 (0.18) a1.0 (0.20) a3.2 (0.28) a
Variety
Cowboy0.0 (0.00) b0.4 (0.12) b0.0 (0.00) b1.1 (0.20) b
Gleam0.0 (0.00) b1.5 (0.21) a0.0 (0.00) b1.6 (0.32) b
Lumen0.0 (0.00) b0.4 (0.10) b0.0 (0.00) b1.0 (0.24) b
Mystic0.0 (0.00) b1.1 (0.24) ab0.0 (0.00) b1.4 (0.34) b
Othello1.1 (0.20) a2.0 (0.30) a2.0 (0.30) a3.0 (0.33) a
SV61390.0 (0.00) b1.4 (0.24) a0.0 (0.00) b1.6 (0.31) b
1 Means of 10 replicates with standard error (SE) in parentheses. Salt types or varieties with a common letter are not significantly different (p < 0.05) based on Tukey’s HSD Test.
Table 6. The effect of pinto bean variety on soil ECe (saturated paste extract) within salt types.
FactorsECe (dS m−1)
Salt type (Control)
Cowboy1.06 (0.05) 1 ab
Gleam1.04 (0.10) ab
Lumen0.90 (0.05) b
Mystic1.00 (0.06) ab
Othello0.85 (0.06) b
SV61391.32 (0.12) a
Salt type (NaCl)
Cowboy4.06 (0.33) a
Gleam5.36 (0.39) a
Lumen5.36 (0.41) a
Mystic5.10 (0.25) a
Othello4.69 (0.45) a
SV61395.35 (0.56) a
Salt type (CaCl2)
Cowboy3.71 (0.25) b
Gleam5.96 (0.41) a
Lumen4.44 (0.47) ab
Mystic4.95 (0.41) ab
Othello4.60 (0.49) ab
SV61395.14 (0.69) ab
Salt type (MgSO4)
Cowboy4.00 (0.11) a
Gleam3.81 (0.26) ab
Lumen3.21 (0.22) b
Mystic4.08 (0.16) a
Othello3.86 (0.15) ab
SV61394.05 (0.10) a
1 Means of 10 replicates with significant letters and standard error (SE) in parentheses. Treatments with a common letter are not significantly different (p < 0.05) based on Tukey’s HSD Test.
Disclaimer/Publisher’s Note: The statements, opinions and data contained in all publications are solely those of the individual author(s) and contributor(s) and not of MDPI and/or the editor(s). MDPI and/or the editor(s) disclaim responsibility for any injury to people or property resulting from any ideas, methods, instructions or products referred to in the content.

