Article

Deep Learning-Based Methods for Multi-Class Rice Disease Detection Using Plant Images

College of Information Engineering, Sichuan Agricultural University, Ya’an 625000, China
*
Author to whom correspondence should be addressed.
Agronomy 2024, 14(9), 1879; https://doi.org/10.3390/agronomy14091879 (registering DOI)
Submission received: 23 July 2024 / Revised: 20 August 2024 / Accepted: 21 August 2024 / Published: 23 August 2024

Abstract

:
Rapid and accurate diagnosis of rice diseases can prevent large-scale outbreaks and reduce pesticide overuse, thereby ensuring rice yield and quality. Existing research typically focuses on a limited number of rice diseases, which makes these studies less applicable to the diverse range of diseases currently affecting rice. Consequently, these studies fail to meet the detection needs of agricultural workers. Additionally, the lack of discussion regarding advanced detection algorithms in current research makes it difficult to determine the optimal application solution. To address these limitations, this study constructs a multi-class rice disease dataset comprising eleven rice diseases and one healthy leaf class. The resulting model is more widely applicable to a variety of diseases. Additionally, we evaluated advanced detection networks and found that DenseNet emerged as the best-performing model with an accuracy of 95.7%, precision of 95.3%, recall of 94.8%, F1 score of 95.0%, and a parameter count of only 6.97 M. Considering the current interest in transfer learning, this study introduced pre-trained weights from the large-scale, multi-class ImageNet dataset into the experiments. Among the tested models, RegNet achieved the best comprehensive performance, with an accuracy of 96.8%, precision of 96.2%, recall of 95.9%, F1 score of 96.0%, and a parameter count of only 3.91 M. Based on the transfer learning-based RegNet model, we developed a rice disease identification app that provides a simple and efficient diagnosis of rice diseases.

1. Introduction

Rice is one of the world’s most important food crops, with a cultivated area exceeding that of any other major grain. However, the growth and development of rice are susceptible to disease. Early disease assessment and treatment can prevent the spread of diseases and the misuse of pesticides, thereby ensuring rice yield and quality. Therefore, accurately identifying rice diseases is of paramount importance for rice production.
Rice diseases have a significant impact on agricultural economics. For example, the global threat posed by rice diseases to production can lead to food security risks, affecting many countries in Asia, Africa, and Europe [1].
Traditional methods for detecting rice diseases rely on the observations of experienced farmers, requiring highly skilled inspectors to identify the phenotypic expressions of different diseases. However, this approach has limitations, necessitating the development of more accurate and rapid field detection methods. With technological advancements, the use of automated tools, including drones, has become increasingly prevalent in agriculture. For instance, XAG Technology Company has demonstrated the use of drones for direct rice seeding, helping to address labor shortages in China caused by an aging population and the COVID-19 pandemic [2,3].
The target subjects for automated detection applications include field growers and automated drones. For example, the Drones4Rice project, initiated by the International Rice Research Institute (IRRI) and the Department of Agriculture—Philippine Rice Research Institute (DA-PhilRice), aims to establish standardized protocols for drone applications in rice production in the Philippines. This highlights the need for precision agriculture and sustainable rice farming practices. The motivation behind developing automated rice disease detection applications is to improve the accuracy and efficiency of disease detection, reduce economic losses caused by diseases, and promote the digital transformation of agriculture. The traditional methods for detecting rice diseases involve manually extracting features and using techniques such as machine learning, support vector machines, and random forests to identify diseases on rice leaves. Ahmed et al. [4] proposed a rice disease detection system based on machine learning methods, which requires input images of leaves against a white background. Using a decision tree method, this system achieves 97% accuracy in identifying three rice diseases: black smut, bacterial blight, and brown spot. Pothen et al. [5] utilized Otsu’s method for segmenting images of bacterial blight, black smut, and brown spot. They then extracted features using Local Binary Pattern (LBP) and Histogram of Oriented Gradients (HOG). The features were classified using a support vector machine (SVM) with a polynomial kernel, achieving 94.6% accuracy.
Current mainstream deep convolutional neural networks no longer rely on manual feature extraction but instead extract features through extensive labeled data and computational resources. As a result, they exhibit better accuracy and generalization capabilities [6]. Liang et al. [7] proposed a novel rice blast disease recognition method based on convolutional neural networks, demonstrating that the features extracted by convolutional neural networks are more distinguishable and effective compared to traditional handcrafted features. This method achieves a higher recognition accuracy. Jiang et al. [8] first used convolutional neural networks (CNNs) to extract features from rice disease images and then classified and predicted the diseases using the SVM method. This approach achieved 96.8% accuracy in identifying four types of rice diseases. Shah et al. [9] compared the performance of Inception V3, VGG16, VGG19, and ResNet50 networks on a dataset containing two categories: rice blast and healthy leaves. ResNet50 showed the best performance with an accuracy of 99.75%. Mannepalli et al. [10] used VGG16 to identify three rice diseases: bacterial leaf blight, rice blast, and brown spot. Their approach achieved 97.7% classification accuracy on a public dataset. Mohapatra et al. [11] employed a deep CNN model to identify four rice leaf diseases, brown spot, rice blast, bacterial blight, and Tungro disease, achieving an accuracy of 97.47%. Poorni et al. [12] used the Inception V3 network model to identify three rice diseases, bacterial blight, brown spot, and bacterial leaf streak, achieving an accuracy of 94.48%. Wang et al. [13] proposed the ADSNN-BO model, combining the MobileNet network and an augmented attention mechanism. This model achieved 94.65% accuracy on a dataset containing four categories: narrow brown leaf spot, rice pest damage, rice blast, and healthy leaves. Thai-Nghe et al. [14] used the EfficientNet network to identify brown spot, rice blast, narrow brown leaf spot, healthy leaves, and other leaves, achieving an accuracy of 95%. They also deployed the model on embedded devices for practical application. Lu et al. [15] proposed a rice disease recognition method based on deep convolutional neural networks, achieving a recognition accuracy of 95.4% on a dataset of 500 rice leaf images, significantly higher than traditional machine learning models. Rahman et al. [16] fine-tuned large models like VGG16 and InceptionV3 to detect rice diseases and pests and introduced a small convolutional neural network to support mobile devices. In their experiments, this lightweight model achieved an accuracy of 93.3%.
Although existing research on rice disease identification has significant value, there are several shortcomings. First, the range of rice diseases examined in these experiments is limited, while rice production is affected by a wide variety of diseases. Models based on a limited range of diseases lack the necessary generalizability. Second, these studies lack discussions on current advanced recognition methods, making it difficult to determine the optimal detection solutions.
To address these issues, this study has constructed a dataset that includes healthy leaves and 11 types of rice diseases to more comprehensively reflect the disease conditions encountered during rice growth. Additionally, this paper discusses the performance of current advanced image classification networks in identifying multiple categories of rice diseases. Moreover, to make it more accessible to the general public, this study developed a rice disease identification app that can diagnose rice diseases simply and efficiently. By constructing a comprehensive dataset and discussing advanced recognition methods, this study aims to enhance both the accuracy and general applicability of rice disease identification. The developed identification app is expected to play an important role in practical applications, providing valuable technical support for agricultural practices.

2. Materials and Methods

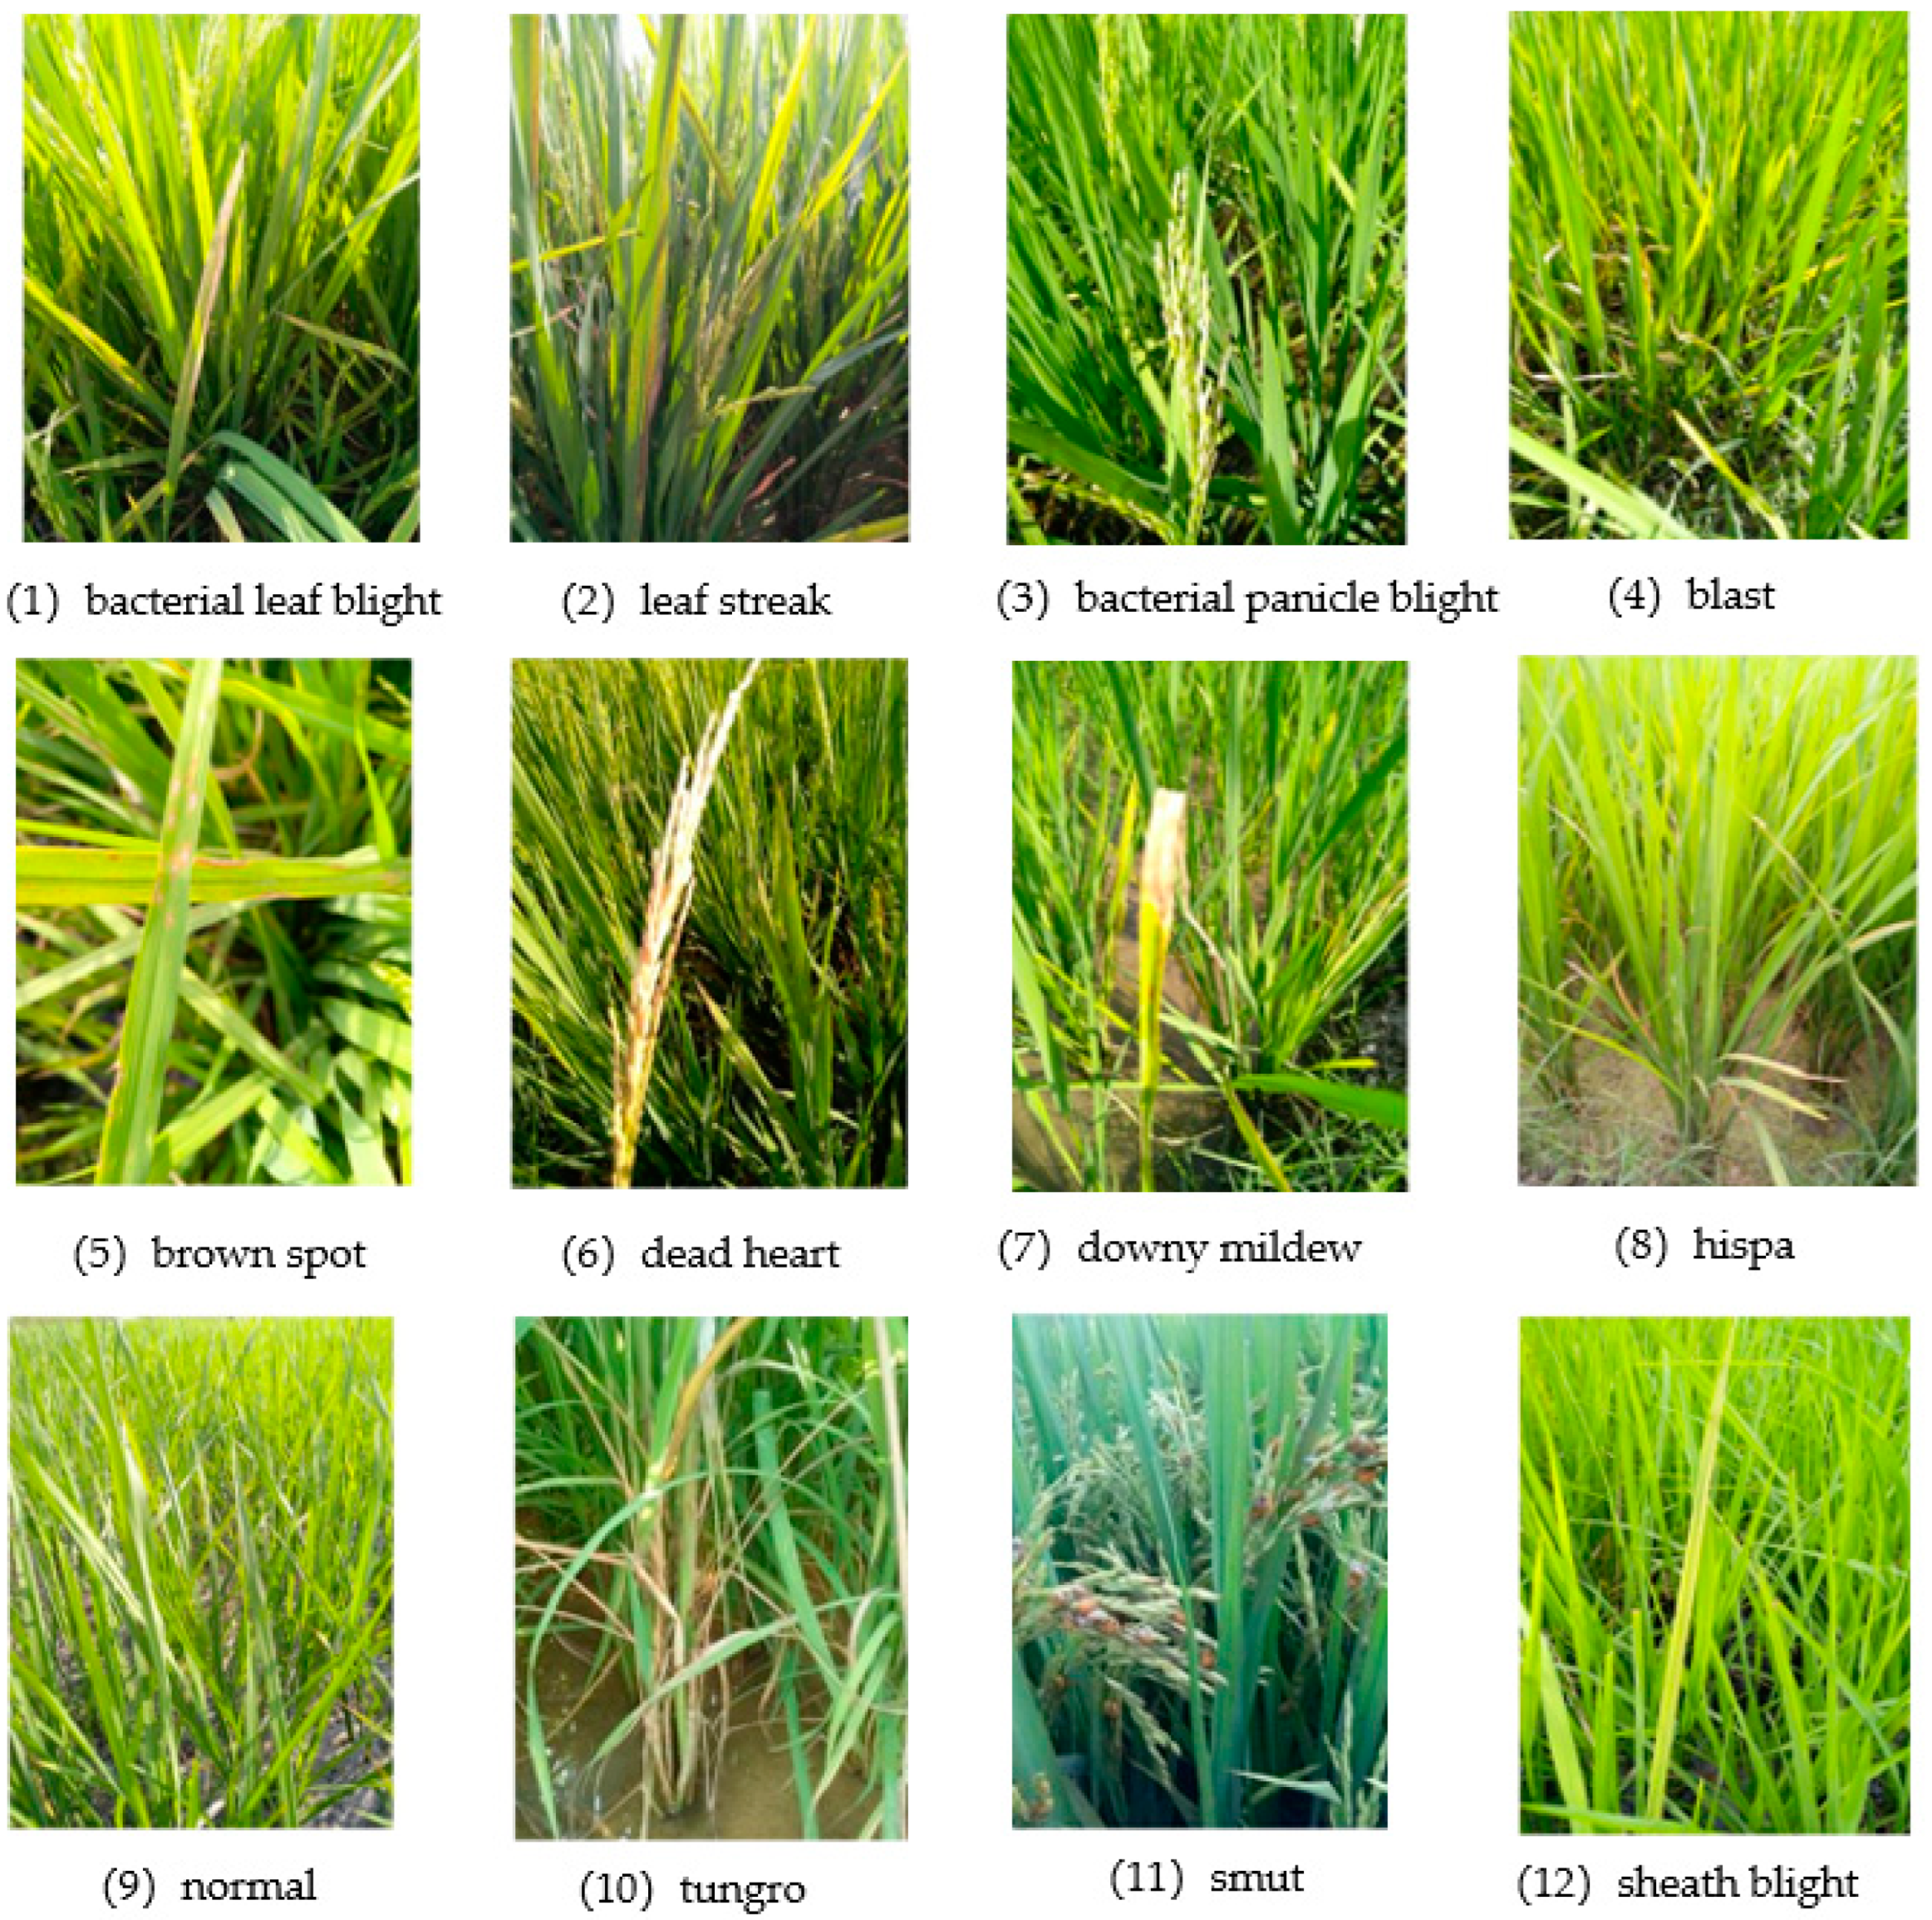
2.1. Dataset Construction

In constructing the dataset, we employed two methods: collecting images via search engines and acquiring data from the Kaggle platform. The resulting rice disease dataset includes 11 categories of rice diseases and 1 category of healthy leaves, totaling 11,281 images. The categories in the dataset are illustrated in Figure 1, and the number of images per category is detailed in Table 1. The dataset is divided into training, validation, and testing sets, with a ratio of 60:20:20 (https://www.kaggle.com/datasets/trumanrase/rice-leaf-diseases, accessed on 22 July 2024). The search engine method involves automatically downloading images by inputting keywords into Google using a Python script. The downloaded images are then filtered and cleaned to ensure data accuracy. The images for the disease categories bacterial leaf streak, Hispa, and rice sheath blight were all sourced from search engines.
Bacterial leaf blight (BLB) is a rice disease caused by the bacterium Xanthomonas oryzae pv. oryzae, and it is one of the most destructive diseases in rice cultivation. BLB leads to extensive wilting of rice leaves, severely impacting photosynthesis, slowing rice growth, and causing poor grain filling, which ultimately results in significant reductions in rice yield. In severe cases, yield losses can reach 20–50% or even higher [17]. Due to the rapid spread of this disease, if not controlled in time, BLB can quickly spread throughout a field, affecting all rice plants. Infected seeds are one of the primary transmission routes for BLB [18].
Bacterial leaf streak disease is a rice disease caused by Xanthomonas oryzae pv. oryzicola (Xoc), which affects the photosynthesis of rice leaves. Bacterial leaf streak disease can lead to yield losses of up to 40% to 60%, severely impacting the quantity and quality of rice production. In China, this disease is classified as an important quarantine disease, and its geographic range is gradually expanding. Key factors contributing to its spread include the virulence of the pathogen, the susceptibility of host plants, and favorable conditions for disease development [19]. Bacterial leaf streak is primarily transmitted by wind, water, and seeds. Xoc can spread from one field to another via wind or irrigation water and can also infect seeds, leading to long-distance transmission [20].
Bacterial panicle blight is a severe rice disease caused by Burkholderia glumae, posing a significant threat to global rice production. This disease leads to reduced grain filling rates, discoloration, rotting, and deformation of the grains, with potential yield losses of up to 75% in severe cases [21]. The primary transmission routes include infected seeds and diseased rice straw as initial infection sources. Infected panicles are also critical factors for secondary infection, especially during the week before and after rice heading, which is the most susceptible period for grain infection [22].
Rice blast, caused by the fungus Magnaporthe oryzae, is a significant disease that poses a serious threat to both the yield and quality of rice. This disease can occur throughout the entire growth period of rice, leading to varying degrees of yield loss. In severe cases, yield reductions can range from 40% to 50%, or even result in complete crop failure. The primary transmission routes for rice blast include infected seeds and diseased rice straw as initial sources of infection [23]. The pathogen’s conidia and mycelia can persist in the rice straw left in the fields or on the grains, entering the soil with the seeds after sowing, thus becoming sources of infection. Under favorable environmental conditions, the pathogen continually produces spores, which are spread by wind to rice plants, causing infection and further spore production, leading to repeated cycles of infection.
Brown spot, caused by the fungus Bipolaris oryzae, is a rice disease that affects the leaves of rice plants and has a global distribution. While brown spot primarily impacts the leaves, it can also affect the grains, stems, and husks [24]. Infected leaves develop circular or elliptical lesions that impair photosynthesis, weaken plant growth and development, and lead to stunted and prematurely aging rice plants, ultimately reducing yield. The primary mode of transmission for brown spot is through infected seeds.
Dead Heart Disease typically occurs during the seedling or tillering stages of rice growth, primarily manifesting as wilting and yellowing of the central leaf, eventually leading to the death of the plant. Rice plants infected with Dead Heart Disease exhibit stunted growth, reduced tillering, and in severe cases, complete plant death, significantly impacting yield. The disease is usually transmitted by pests such as the rice stem borer (Chilo suppressalis) or the yellow stem borer (Scirpophaga incertulas), which spread the disease-causing pathogens by feeding on the rice plant’s stems or leaf sheaths.
Downy mildew is a disease caused by fungi of the Peronosclerospora species, primarily affecting rice during its seedling stage. Infected rice plants typically exhibit symptoms such as leaf yellowing, wilting, and stunted growth, with severe cases potentially leading to plant death. The spread of downy mildew mainly occurs through infected plant debris, soil, and airborne spores [25].
Hispa disease is primarily caused by the rice Hispa beetle (Dicladispa armigera). This disease primarily damages rice by adults feeding on the epidermal tissue of rice leaves. Infected leaves exhibit streaks of white lesions, which gradually turn brown and may lead to leaf desiccation. The spread of Hispa disease mainly occurs through the flight of adult beetles [26].
Tungro disease is a complex disease caused by the co-infection of rice Tungro bacilliform virus (RTBV) and rice Tungro spherical virus (RTSV). This disease has a severe impact on rice, leading to stunted growth, yellowing leaves with characteristic yellow-green streaks, and a reduction in tillering. Infected plants show a significant decrease in the number of tillers, panicles, and grains [27]. The spread of Tungro disease primarily depends on vector insects such as the green leafhopper (Nephotettix virescens) and the zigzag leafhopper (Nephotettix cincticeps). These insects transmit the virus to healthy plants after feeding on the sap of infected rice plants [28].
Rice false smut is a disease caused by the fungus Ustilaginoidea virens. This disease leads to the formation of larger “false smut balls” on some grains of the rice panicle, which fail to develop properly, resulting in reduced rice yield. The fungus produces toxins such as ustiloxins, which can be harmful to both animals and humans, potentially affecting health if consumed over time. The spores of the fungus are primarily spread by wind, with the rice panicle formation and flowering stages being the most susceptible to infection [29].
Rice sheath blight is a severe rice disease caused by the fungus Rhizoctonia solani. This disease results in damage to the stems and sheaths of the rice plants, affecting photosynthesis and subsequently reducing grain yield. The pathogen can spread through irrigation water in the field, where water flow can disseminate the pathogen to other plants [30,31].

2.2. Experimental Platform Training Parameters

The experimental environment for the models in this study is detailed in Table 2. All algorithms were tested under the same conditions. Network training was performed using the Adam optimizer with a learning rate of 0.0001, a batch size of 16, and 4 concurrent threads, iterating 100 times. The cross-entropy loss function was used. The experiments were conducted on a machine running the Windows 10 operating system, with a 26-thread E5-2690 v4 processor, a 3060Ti graphics processor with 8 GB of VRAM, and 32 GB of RAM.

2.3. Evaluation Indicators

The detection performance in this study is evaluated using precision, accuracy, recall, parameter count, and F1 score [32]. TP (True Positive) refers to the number of samples correctly predicted as positive by the model, TN (True Negative) refers to the number of samples correctly predicted as negative by the model, FP (False Positive) refers to the number of samples incorrectly predicted as positive by the model, and FN (False Negative) refers to the number of samples incorrectly predicted as negative by the model. Precision measures the proportion of actual positive samples among the samples predicted as positive by the model. Accuracy is the probability of actual positive samples among all the samples predicted as positive. Recall measures the proportion of actual positive samples that are correctly predicted as positive by the model. There is usually a trade-off between precision and recall. Increasing precision may reduce recall, and vice versa. To comprehensively evaluate model performance, the F1 score, which is the harmonic mean of precision and recall, is often used, as shown in the following formula [33]:
A c c u r a c y = T P + T N T P + T N + F P + F N
P r e c i s i o n = T P T P + F P
R e c a l l = T P T P + F N
F 1 = 2 × P r e c i s i o n × R e c a l l P r e c i s i o n + R e c a l l

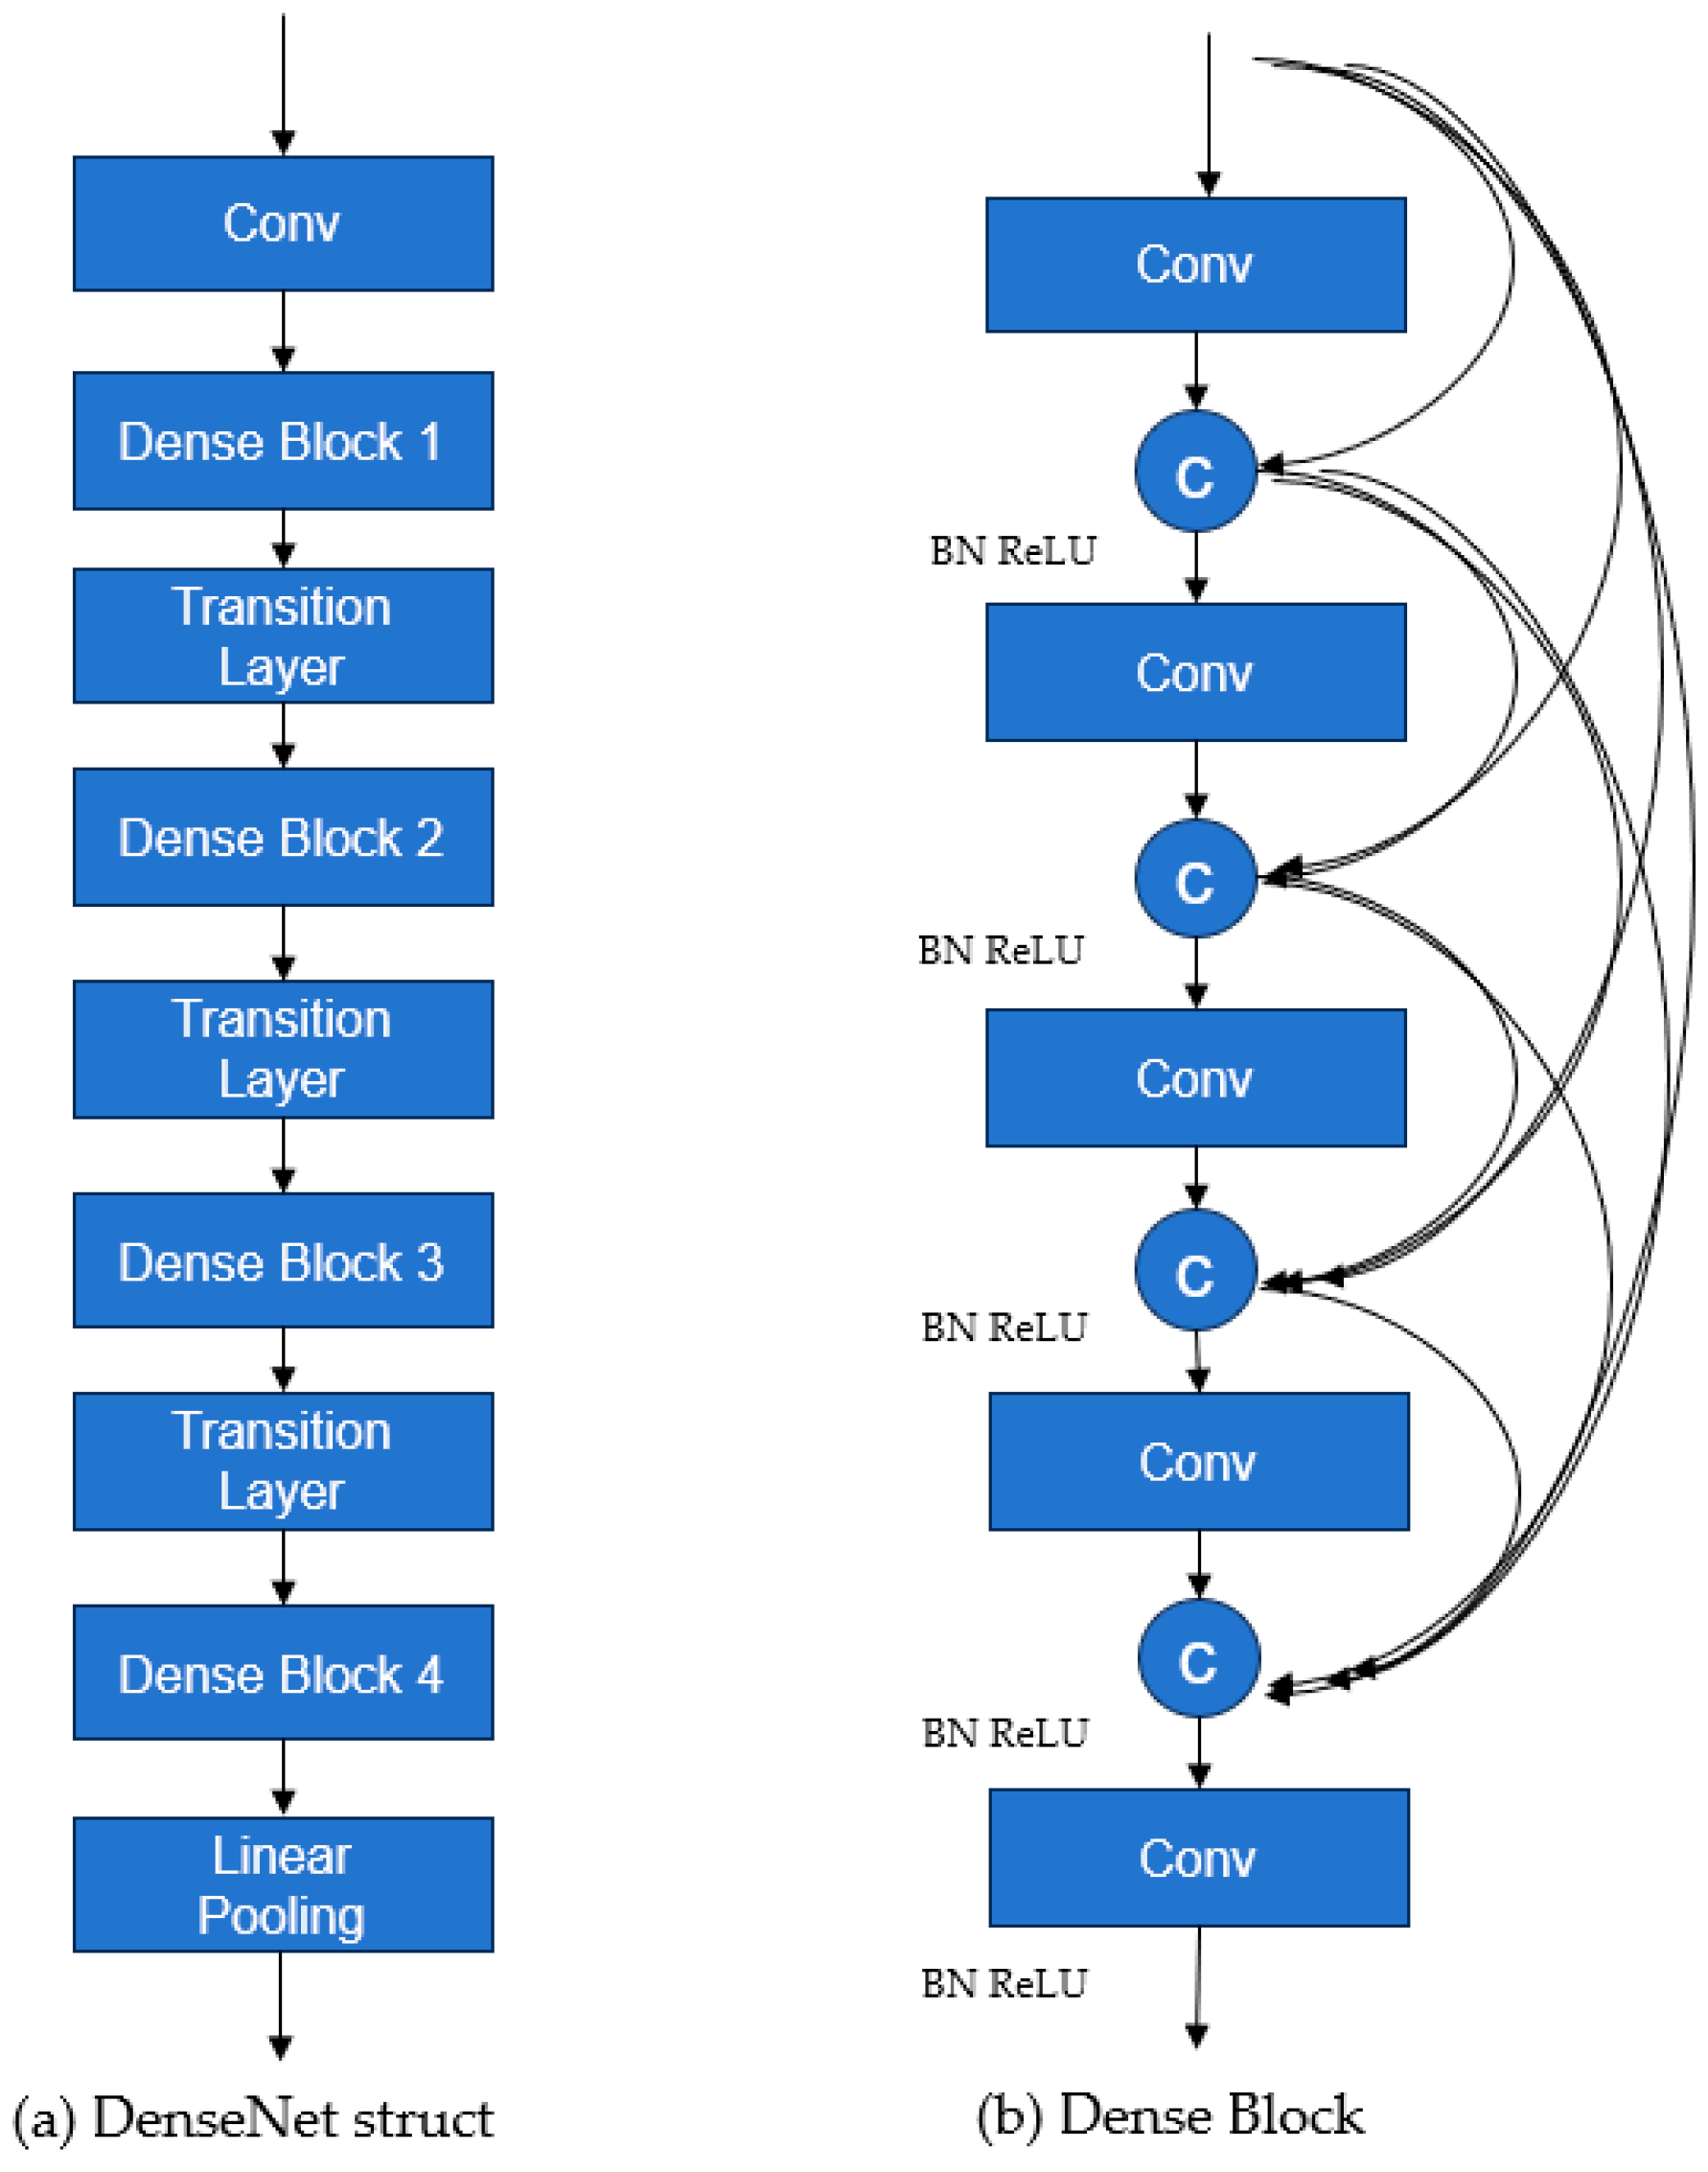
2.4. DenseNet Network

In deep convolutional neural networks, issues such as gradient vanishing or exploding gradients commonly occur. ResNet proposed a cross-layer connection method to address these problems. However, ResNet’s cross-layer connections are implemented by addition, allowing each layer to directly access only the output of the previous layer. This results in ResNet reusing fewer effective features. DenseNet’s core idea is to enhance feature transmission and gradient flow through dense connections, thereby reusing more effective features and achieving efficient network training. In DenseNet, each layer is connected to all previous layers, meaning that the i-th layer receives the feature maps of all i − 1 preceding layers as input. This connection method significantly enhances information flow and helps alleviate the issue of vanishing gradients.
The DenseNet network structure mainly consists of three parts: DenseLayer, DenseBlock, and Transition, as shown in Figure 2. The DenseNet struct show in Figure 2a. DenseLayer is simply a convolutional layer used for basic feature extraction in the network. DenseBlock is the core part of the network and serves as the basic unit(Figure 2b). In this module, dense connections are used to repeatedly utilize features [34]. The Transition module contains a convolutional layer and a pooling layer. It is used to connect different DenseBlocks, ensuring that the width and height of the feature maps remain consistent. The input to the Transition module is a feature matrix of size C × H × W. The DenseBlock following the Transition module requires an input of size C1 × H/2 × W/2. Therefore, the number of channels in the convolutional layer within the Transition module is set to C1, and the pooling layer size is 2 × 2, ensuring that the width and height requirements for the input feature map to the DenseBlock are met.

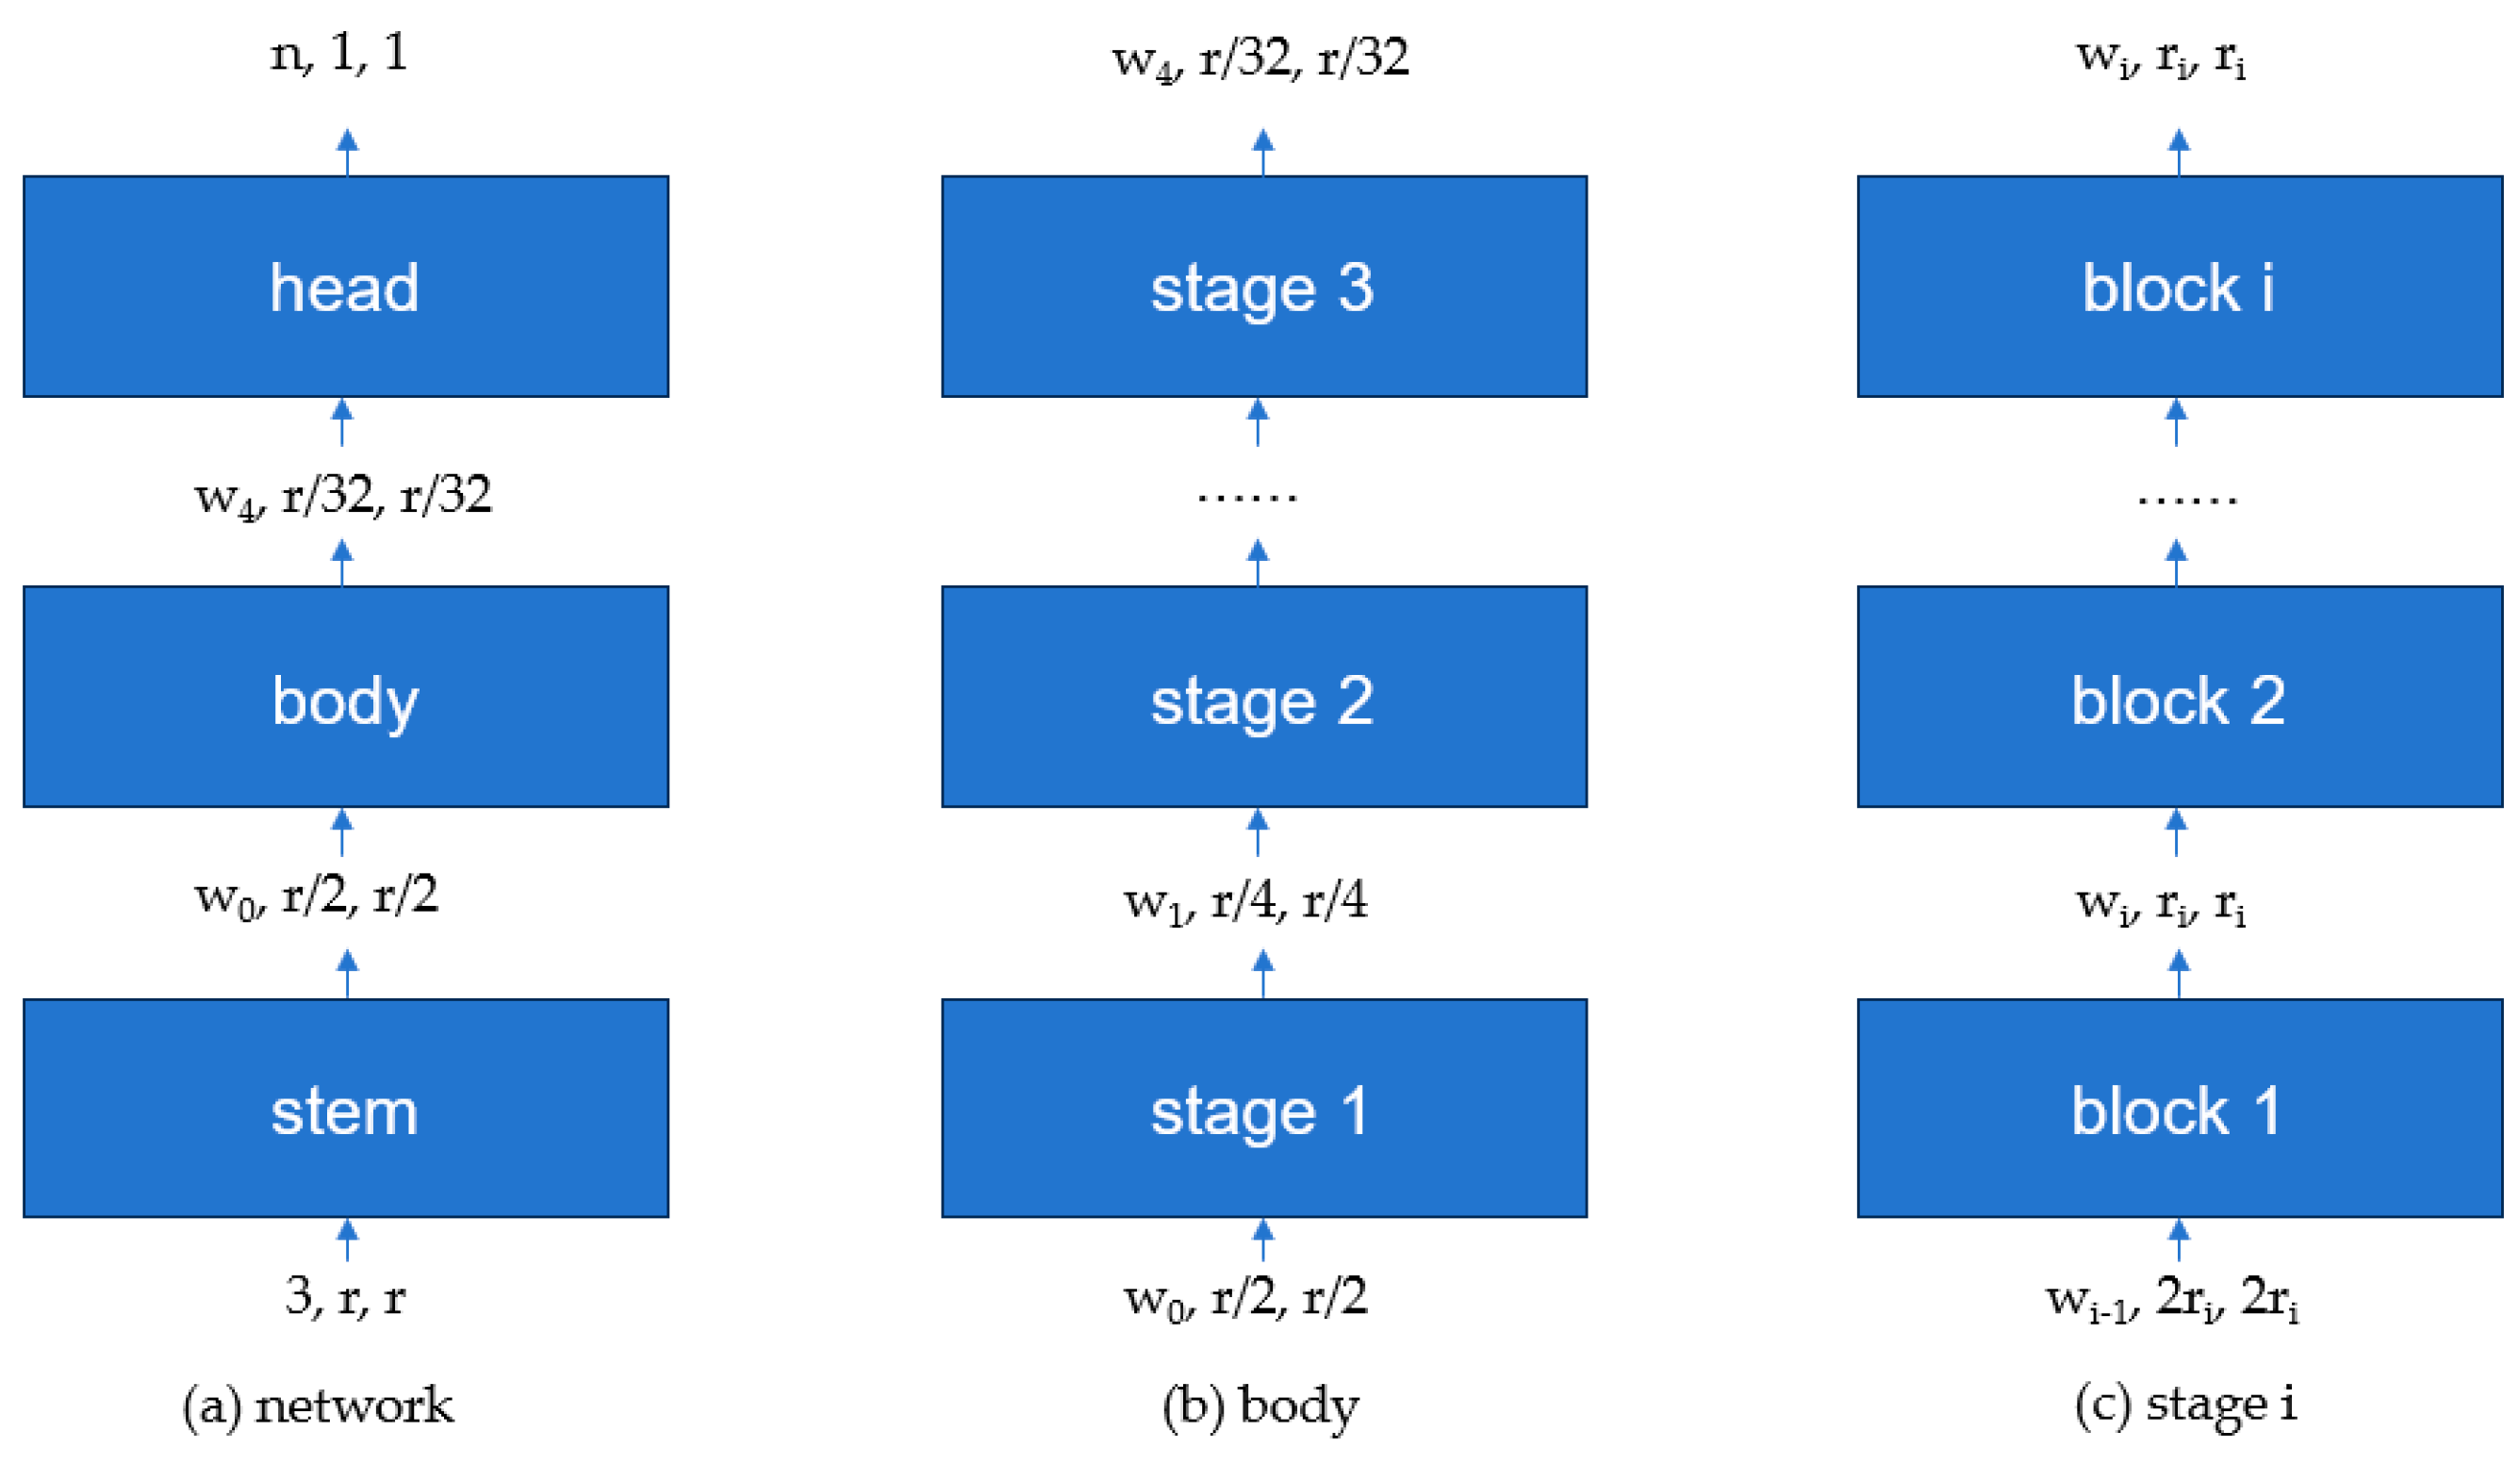
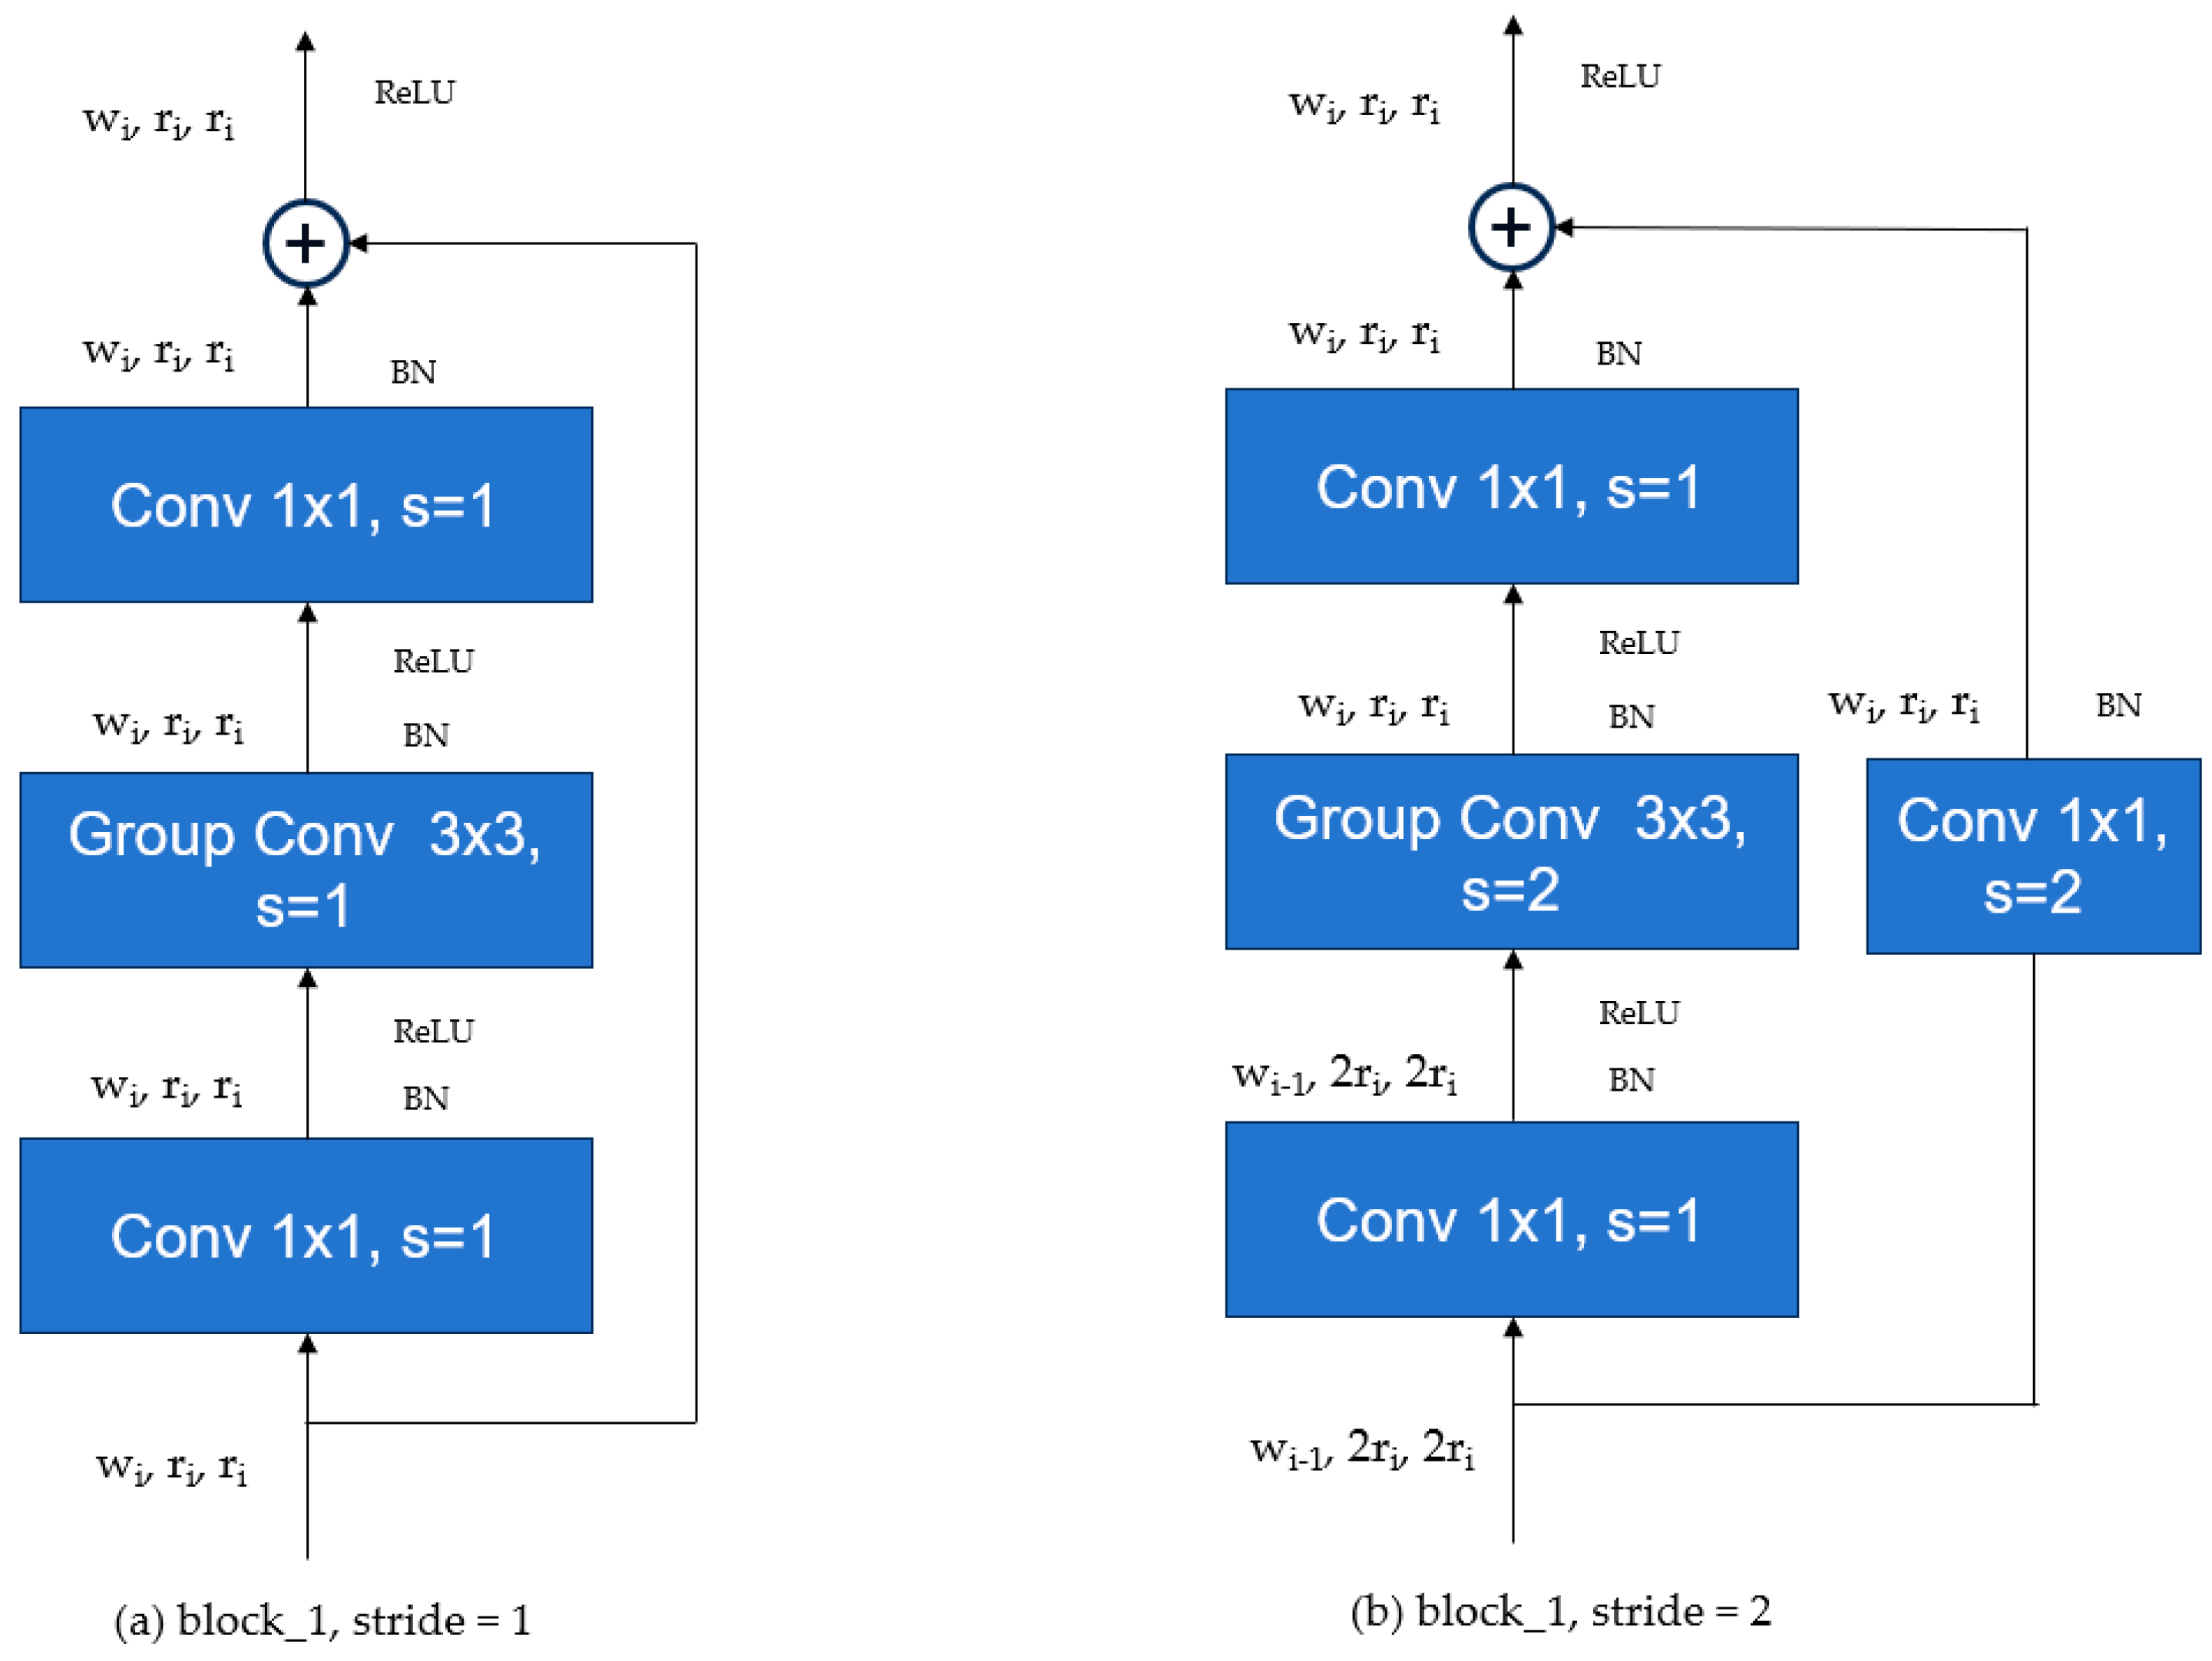
2.5. Regularization Network

RegNet (Regularization Network) is a flexible and scalable convolutional neural network (CNN) architecture proposed by researchers at Facebook AI Research (FAIR) in 2020 [35]. The main goal of RegNet is to create a series of efficient networks by introducing new design principles and constraints [35], addressing the issues of complexity and computational cost in automated architecture search. RegNet defines network architecture in a parameterized way, including aspects such as network width, depth, and the configuration of group convolutions, thus enabling the generation of networks with various scales and complexities. RegNet provides a flexible framework that can adjust the network’s complexity based on specific tasks and computational resource requirements.
The structure of the RegNet network is shown in Figure 3. The RegNet architecture mainly consists of three parts: stem (Figure 3a), body (Figure 3b), and head (Figure 3c). The stem is a convolutional layer with 32 filters, each with a kernel size of 3 × 3 and a stride of 2. It also includes Batch Normalization and a ReLU activation function. The body is composed of four stacked stages, where the height and width of the feature matrix output from each stage are halved compared to the input. Each stage consists of a series of blocks, as shown in Figure 4. The first block in each stage has a stride of 2, as depicted in (Figure 4b), while the remaining blocks have a stride of 1, as depicted in (Figure 4a). The head is the classifier of the network, composed of a global average pooling layer and a fully connected layer.

3. Results

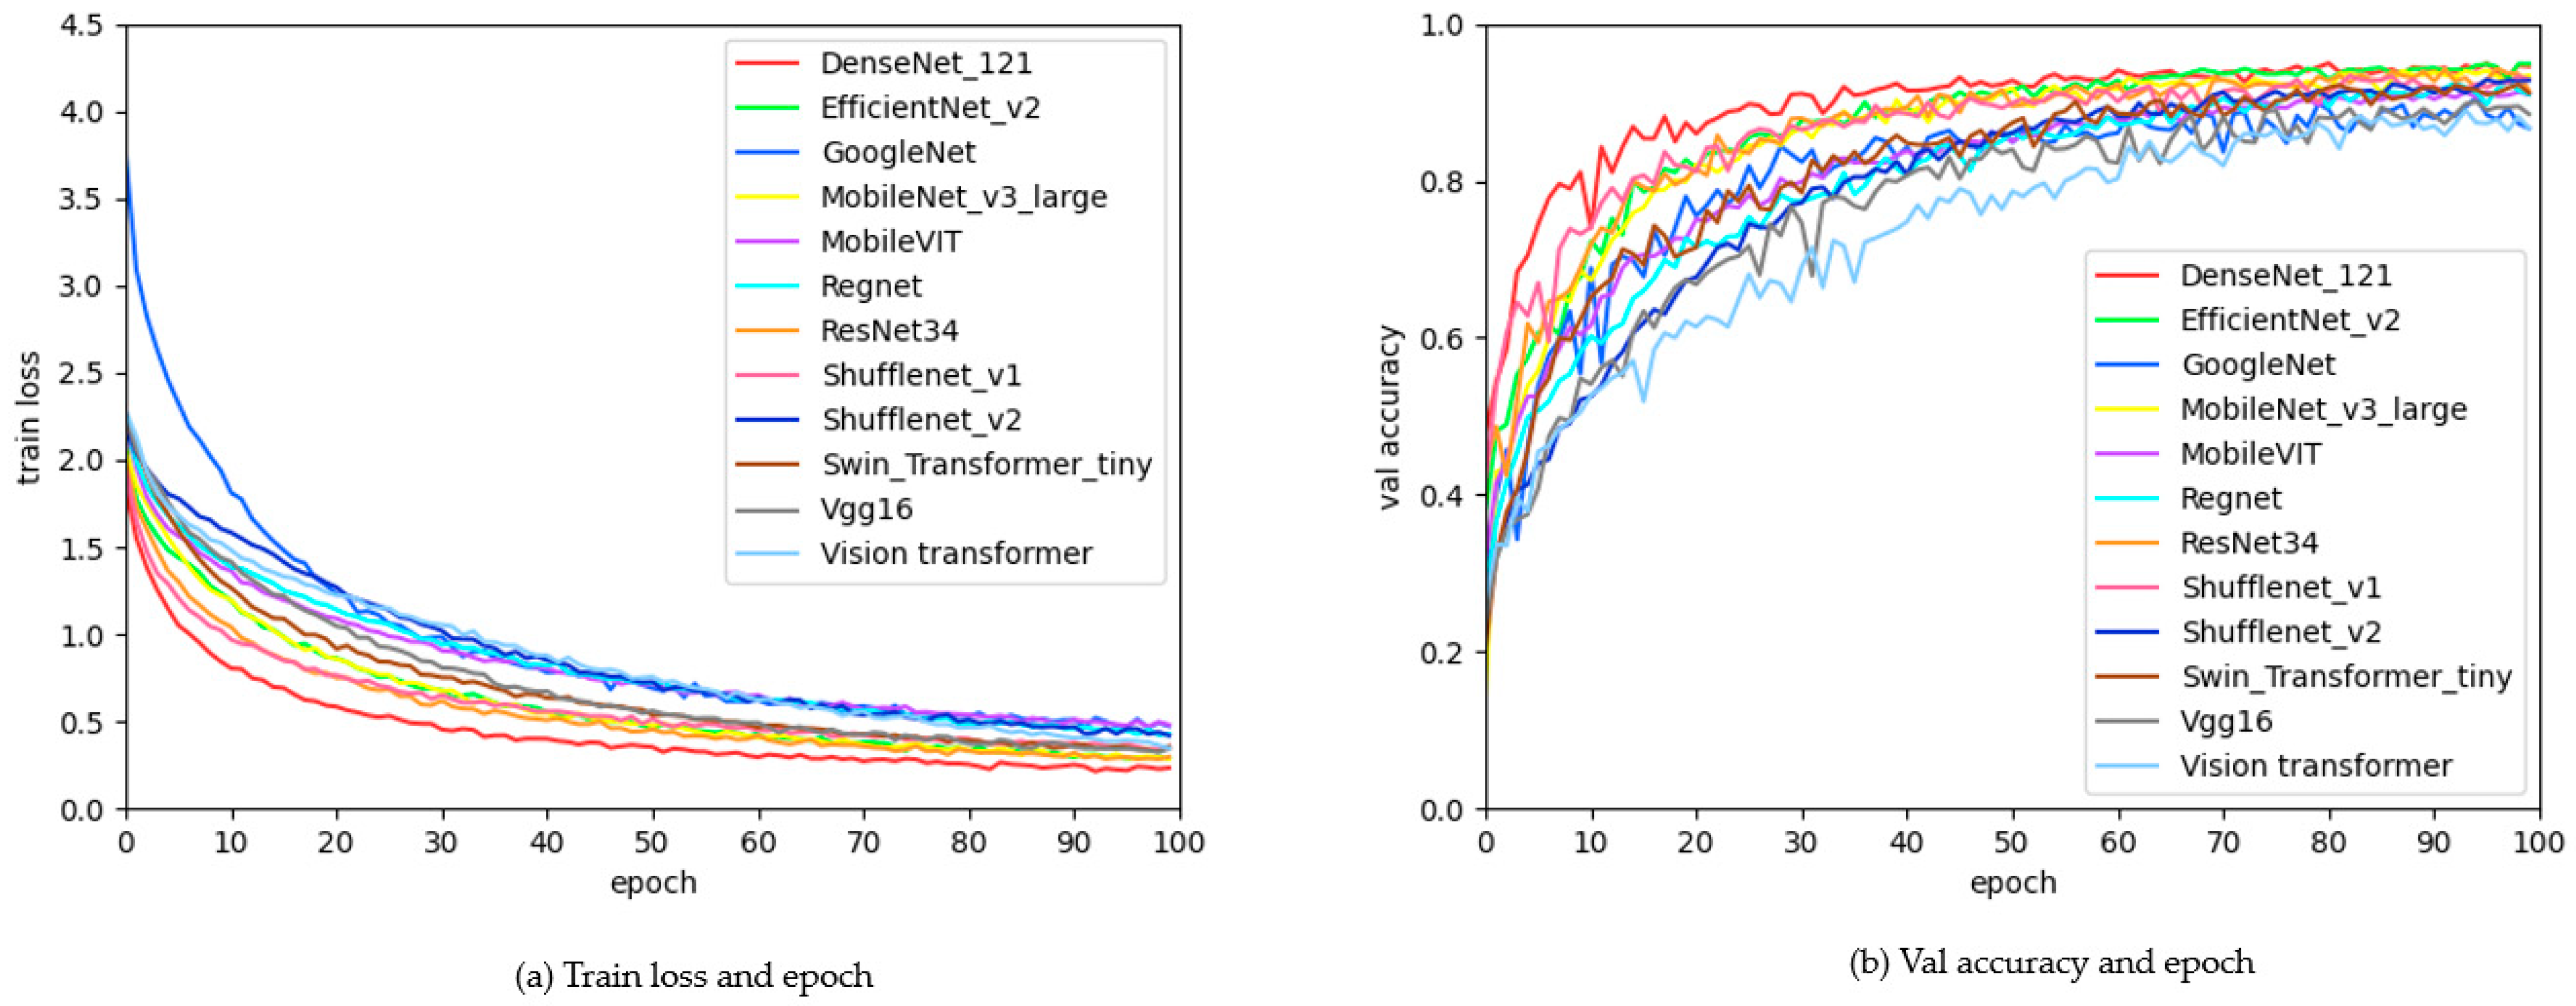
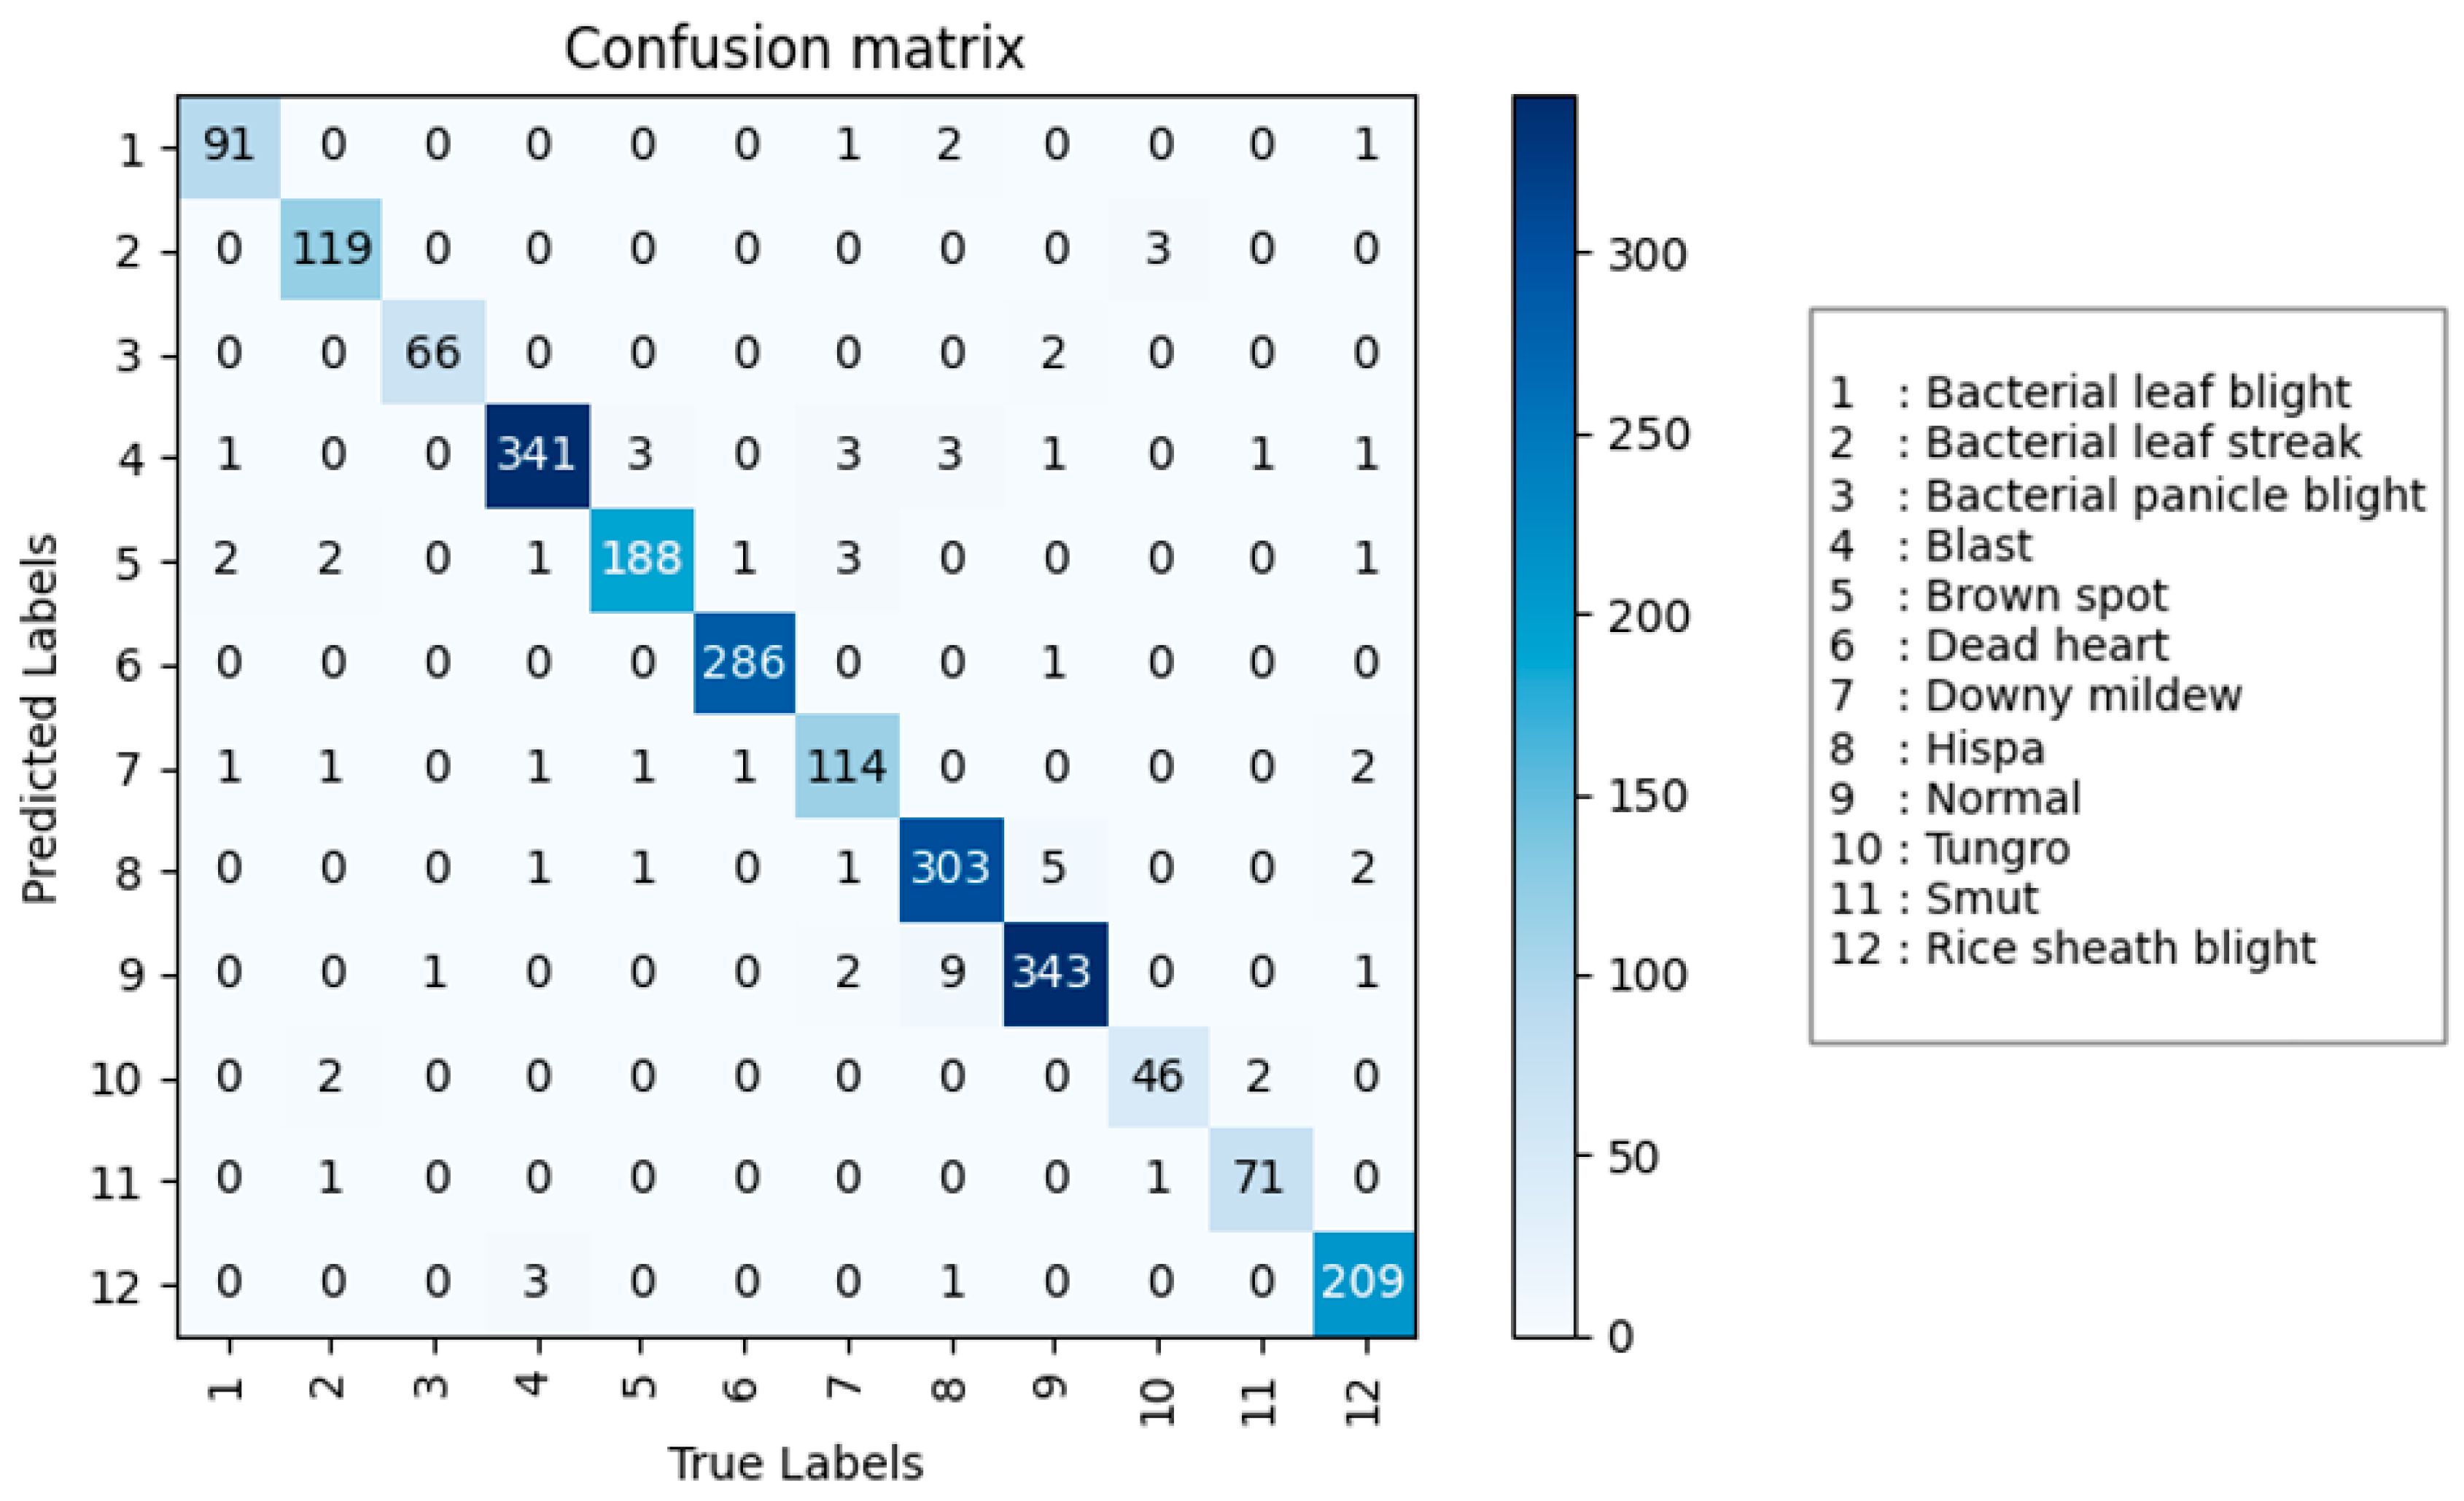
3.1. Comparison Study

The mainstream classification algorithms compared in this study include VGG16 [36], GoogleNet [37], ResNet34 [38], MobileNet v2 [39], MobileNet v3 [40], ShuffleNet v1 [41], ShuffleNet v2 [42], DenseNet, EfficientNet v2 [43], Swin Transformer [44], MobileVIT [45], RegNet, and Vision Transformer [46]. The comparison results of these algorithms without pre-trained weights are shown in Table 3. The DenseNet model performed the best, with a precision of 95.7%, an accuracy of 95.3%, a recall of 94.8%, an F1 score of 95.0%, and a parameter count of 6.97M. The next best performer was ShuffleNet v1, with a precision of 94.2%, an accuracy of 93.6%, a recall of 92.9%, an F1 score of 93.2%, and a parameter count of only 0.92 M, which is one-eighth the size of the DenseNet model. The changes in the model loss value during training and its performance on the validation set are shown in Figure 5. In (Figure 5a), the variation in the training loss function as the number of training epochs increases is illustrated, where the loss function gradually decreases and stabilizes. In (Figure 5b), the changes in accuracy on the validation set as training progresses are depicted, showing that accuracy increases with the number of training epochs and gradually stabilizes.
In image classification algorithms, the parameter count of a model determines its complexity and computational requirements. Models with a parameter count of less than 10 M are suitable for devices with very limited resources, such as embedded systems, mobile devices, edge devices, and mobile applications [47]. This study investigates models with a parameter count of less than 10 M in rice disease identification. The accuracy results for these models in each category are shown in Table 4. Among them, the highest accuracy for healthy leaf identification is 97.4%, while the lowest accuracy for Tungro identification is 88.0%. Overall, the DenseNet model exhibited the best performance across all categories.
The F1 scores of models with a parameter count of less than 10 M in each category are shown in Table 5. The highest F1 score is for the Dead Heart category, with an F1 value of 99.5%, while the lowest F1 score is for the Tungro category, with an F1 value of 90.7%. Across all categories, the DenseNet model demonstrated the best overall F1 performance.
The accuracy of models with a parameter count greater than 10 M in each category is shown in Table 6. The highest accuracy is for the Dead Heart category, with an accuracy of 99.3%, while the lowest accuracy is for the Tungro category, with an accuracy of 88.0%. Across all categories, the model with the best overall accuracy is EfficientNet v2.
The F1 scores of models with a parameter count greater than 10 M in each category are shown in Table 7. The highest F1 score is for the Dead Heart category, with an F1 score of 99.1%, while the lowest F1 score is for Tungro, with an F1 score of 86.6%. Across all categories, the model with the best overall F1 performance is EfficientNet v2.
In summary, among models with a parameter count less than 10 M, DenseNet performed the best, with a precision of 95.7%, an accuracy of 95.3%, a recall of 94.8%, an F1 core of 95.0%, and a parameter count of only 6.97 M. Among models with a parameter count greater than 10 M, EfficientNet v2 performed the best, with a precision of 95.3%, an accuracy of 94.2%, a recall of 93.6%, an F1 score of 93.9%, and a parameter count of 24.20 M. DenseNet not only has higher precision, accuracy, recall, and F1 score than EfficientNet v2, but its parameter count is also one-eighth of that of EfficientNet v2, making DenseNet more suitable for practical algorithm implementation. The DenseNet model was evaluated on the validation set, and its confusion matrix is shown in Figure 6. It can be seen that the model has high accuracy in identifying rice diseases.

3.2. Transfer Learning Experiments

Transfer learning involves applying a deep learning model pre-trained on a large-scale dataset to a new, related task dataset. Transfer learning is particularly effective in computer vision, especially when data are limited [48,49,50]. The ImageNet dataset is a large-scale dataset for object recognition and image classification tasks, containing over 14 million images across thousands of object categories [51,52,53]. Therefore, this study utilizes ImageNet-trained models for rice disease research. The experimental results are shown in Table 8. Among the models, RegNet performed the best, with an accuracy of 96.8%, a precision of 96.2%, a recall of 95.9%, and an F1 score of 96.0%, with a parameter count of only 3.91 M. The next best performer was ResNet34, with an accuracy of 96.7%, a precision of 96.0%, a recall of 95.7%, and an F1 score of 95.8%. However, it has a higher parameter count of 21.29 million, which is more than five times that of RegNet.
The changes in model loss values and validation accuracy during training with pre-trained weights are shown in Figure 7; (Figure 7a) illustrates the variation in the training loss function as the number of training epochs increases, where it can be observed that the loss function gradually decreases and stabilizes, and (Figure 7b) depicts the change in validation accuracy with the increase in training epochs, showing that the accuracy rises and eventually stabilizes. The figure indicates that introducing pre-trained weights allows the model to converge more quickly.
The accuracy of models with a parameter count less than 10 M in each category is shown in Table 9. The highest accuracy is for the Dead Heart category, with an accuracy of 99.3%, while the lowest accuracy is for Tungro, with an accuracy of 92.0%. Across all categories, the model with the best overall accuracy is RegNet.
The F1 scores of models with a parameter count less than 10 M in each category are shown in Table 10. The highest F1 score is for the Dead Heart category, with an F1 score of 99.5%, while the lowest F1 score is for Tungro, with an F1 score of 90.2%. Across all categories, the model with the best overall F1 performance is RegNet.
The accuracy of models with a parameter count greater than 10 M in each category is shown in Table 11. The highest accuracy is for the blast category, with an accuracy of 100%, while the lowest accuracy is for the downy mildew category, with an accuracy of 93.5%. Across all categories, the model with the best overall accuracy is Vision Transformer.
The F1 scores of models with a parameter count greater than 10 M in each category are shown in Table 12. The highest F1 score is for the Dead Heart category, with an F1 score of 99.5%, while the lowest F1 score is for the downy mildew category, with an F1 score of 93.5%. Across all categories, the model with the best overall F1 performance is Vision Transformer.
In summary, among models with a parameter count less than 10 M, RegNet performs the best, with an accuracy of 96.8%, a precision of 96.2%, a recall of 95.9%, and an F1 score of 96.0%, with a parameter count of only 3.91 M. Among models with a parameter count greater than 10 M, Vision Transformer is the best performer, with an accuracy of 96.6%, a precision of 96.2%, a recall of 95.9%, and an F1 score of 96.0%, with a parameter count of 85.81 M. RegNet not only surpasses Vision Transformer in accuracy, precision, recall, and F1 score, but also has a parameter count that is one-twentieth that of Vision Transformer, making RegNet more suitable for practical algorithm implementation. The RegNet model was evaluated on the validation set, and its confusion matrix is shown in Figure 8. Compared to the confusion matrix of the DenseNet model in Figure 6, RegNet demonstrates better performance.
By incorporating pre-trained weights, most models have shown improvements in accuracy, precision, recall, and F1 score. The RegNet model’s recognition accuracy increased by 3.0%, precision by 4.4%, recall by 3.9%, and F1 score by 4.2%, highlighting the importance of transfer learning. Without transfer learning, the model with the best overall performance is DenseNet, with an accuracy of 95.7%, precision of 95.3%, recall of 94.8%, and an F1 score of 95.0%, with a parameter count of only 6.97 M. Comparing RegNet with pre-trained weights to DenseNet, RegNet’s recognition accuracy improved by 1.1%, precision by 0.9%, recall by 1.1%, and F1 score by 1.0%, while RegNet’s model size is only half that of DenseNet. Overall, DenseNet with transfer learning performs best, with a smaller model size, making it suitable for practical algorithm implementation.

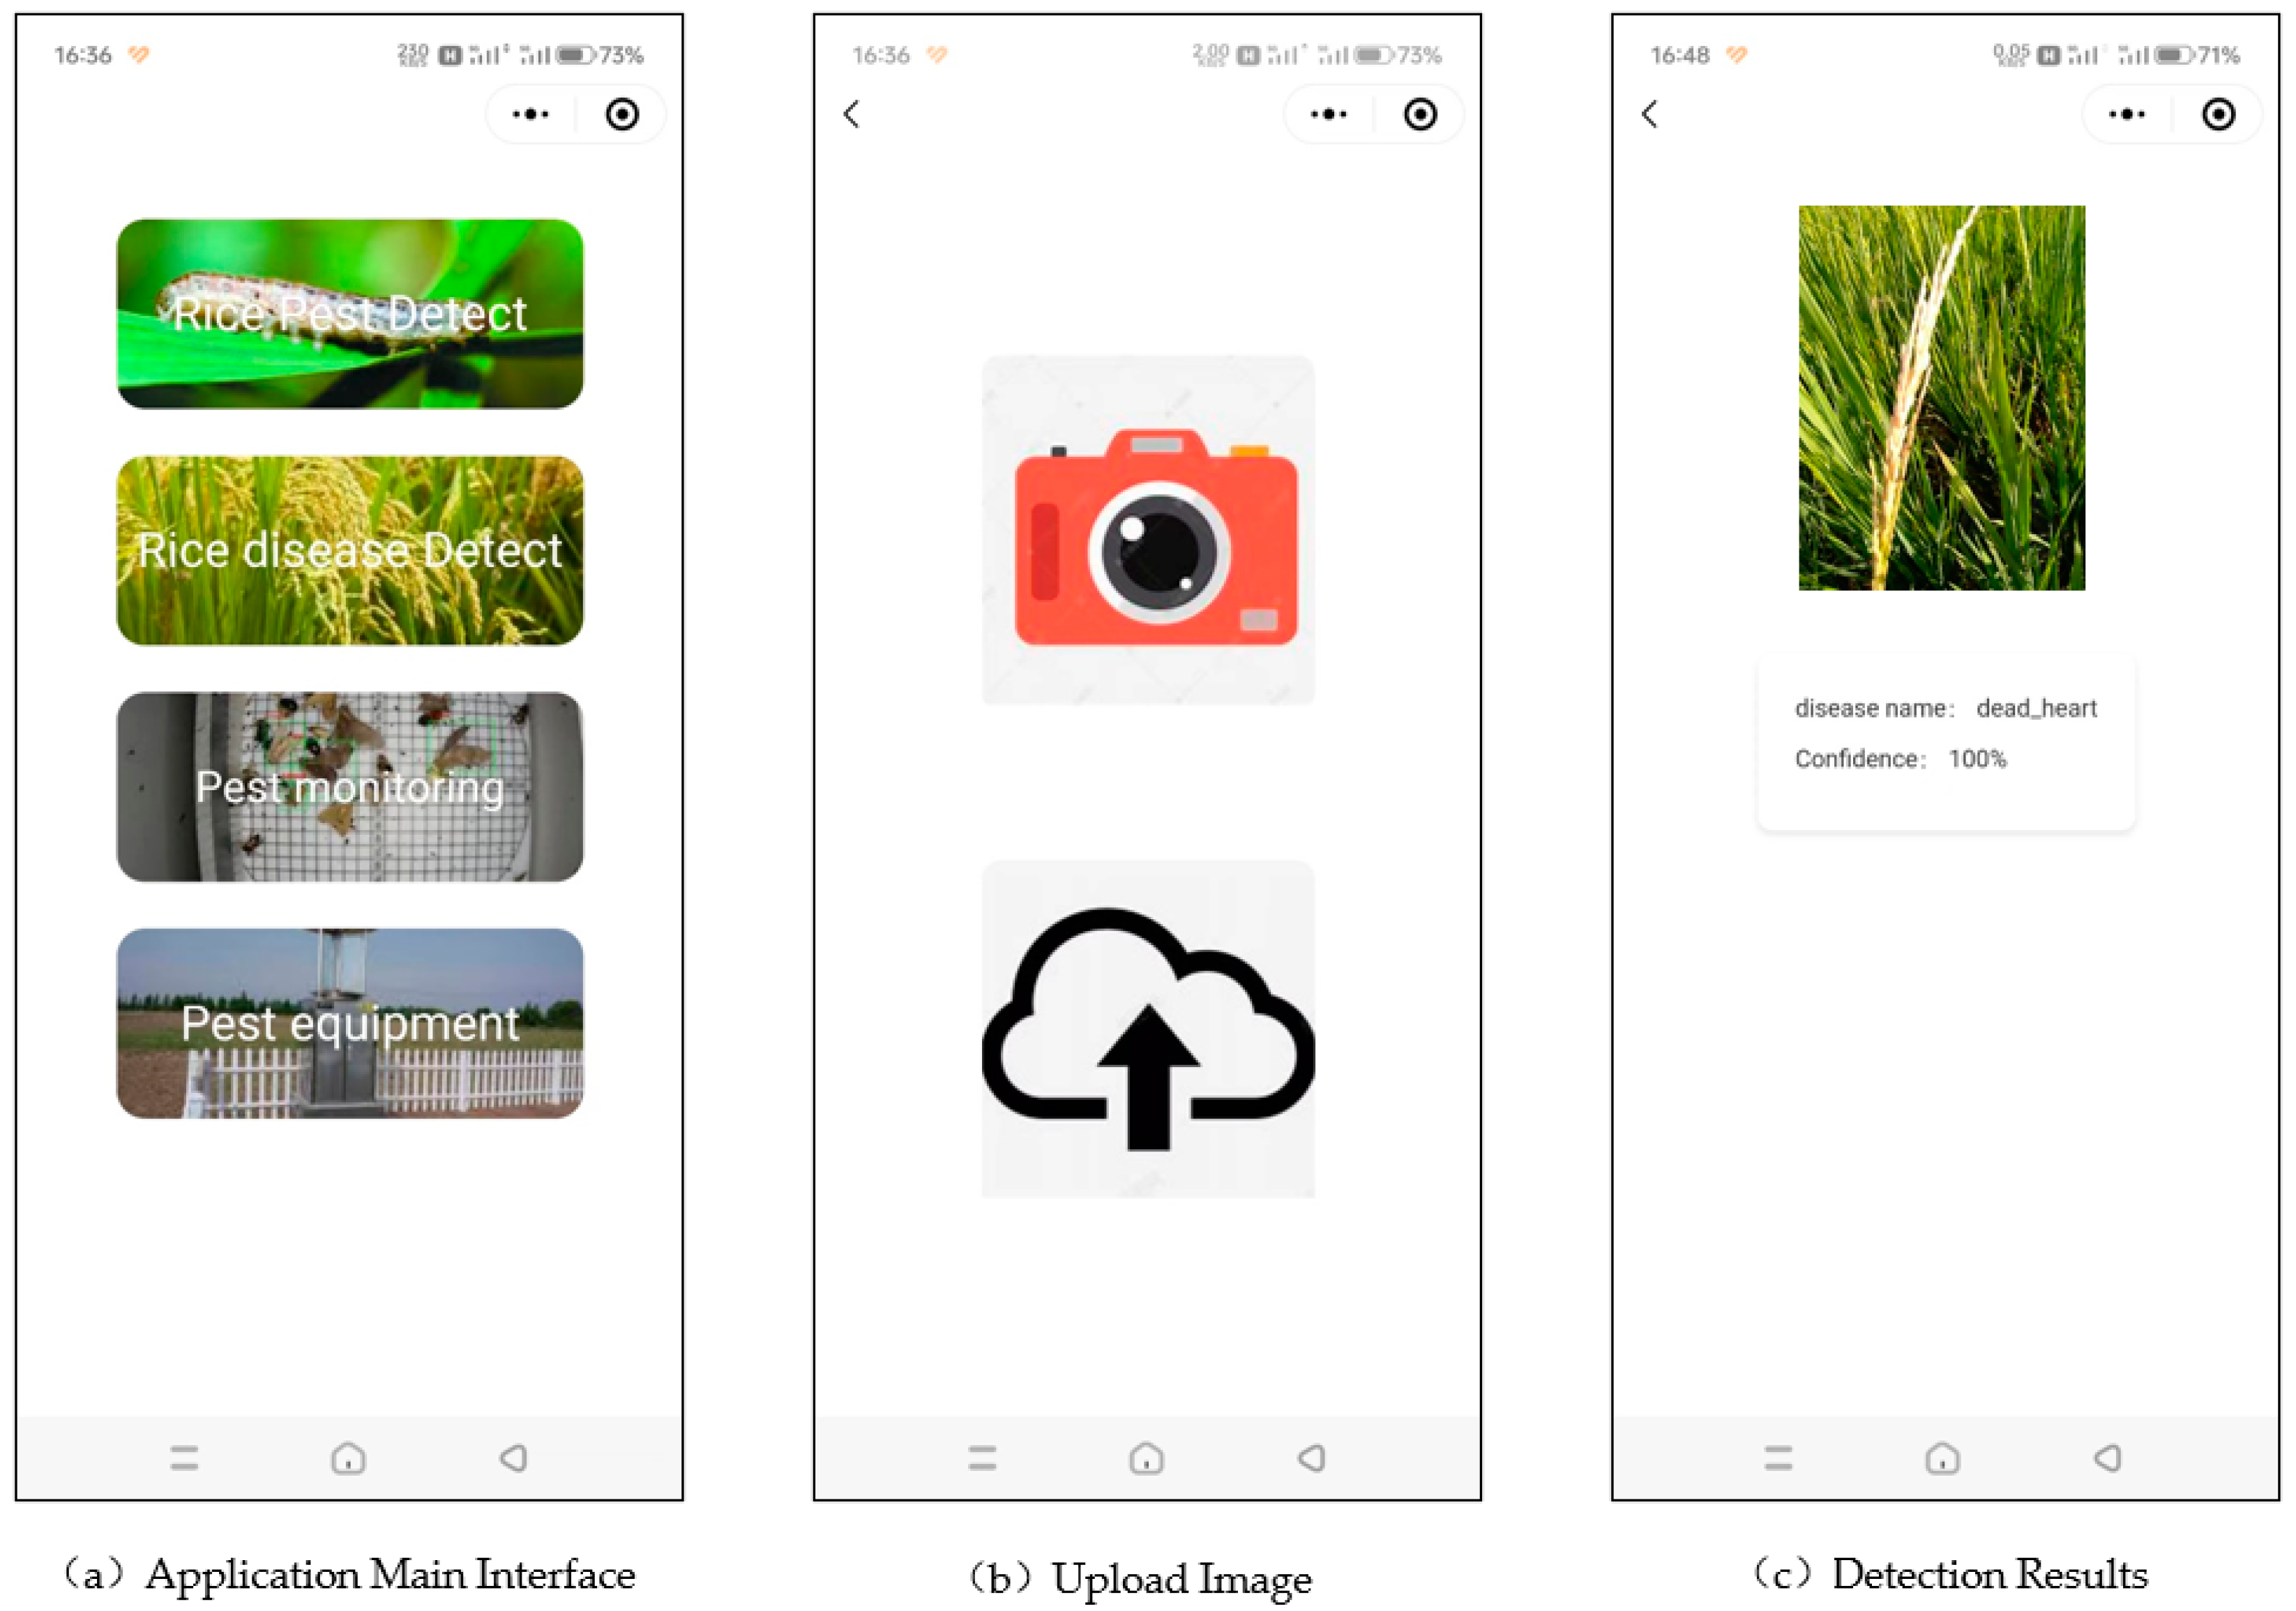
3.3. Rice Disease Detection App

This study develops a rice disease identification app based on the RegNet model with pre-trained weights, suitable for agricultural workers carrying mobile devices in the field. The app’s average inference time is within 200 ms, meeting the daily work requirements of the users. The rice disease detection app is developed using Uni-app technology [54], a cross-platform framework that supports writing once and running on multiple platforms, including mini programs, H5, and apps. Its high portability makes it well suited for mobile application development. The model deployment is handled using Python and the Python-based web framework FastAPI, with Python being ideal for rapid development, data analysis, and machine learning, while FastAPI is focused on building high-performance web APIs [55].
The rice disease identification app is shown in Figure 9, with an intuitive interface that allows users to easily identify rice diseases. Panel (a) displays the app’s homepage, which has four options: rice pest identification, rice disease identification, pest monitoring, and pest monitoring equipment. Upon selecting the rice disease identification function, two options are available: capturing and uploading an image using the camera or uploading an image from the local gallery, as shown in panel (b). After uploading the image, as shown in panel (c), the app will display the uploaded image, the name of the rice disease detected in the image, and the model’s confidence in its identification.

4. Discussion

In this study, the F1 score and accuracy for each class varied, and we conducted an analysis to understand the reasons behind this. Firstly, the number of samples for each disease class differed, leading to variability in the training effectiveness across classes. Additionally, the information contained within the images of each class varied. Each disease image included symptoms from different growth stages, and significant variation in these symptoms can make training more challenging for the model, as seen with classes like Tungro and downy mildew.
This study focuses on multi-class rice disease recognition by comparing the performance of the most advanced detection algorithms on a rice disease dataset and optimizing the models with transfer learning to identify the best detection model for application. However, there are still certain limitations. Firstly, as more advanced detection methods emerge in the future, the methods presented in this study may require further validation through additional experiments to confirm their optimality. Moreover, the ideal approach to rice disease detection is full automation. The app developed in this study requires manual disease detection for identification. This approach may not detect the initial stages of rice diseases. Future research will concentrate on developing more automated systems for monitoring rice growth, representing a pivotal direction for our ongoing research.

5. Conclusions

Rapid and accurate diagnosis of rice diseases can prevent large-scale spread and overuse of pesticides, thereby ensuring the yield and quality of rice. Currently, existing research addresses a limited number of rice diseases, making them less applicable to the diverse range of rice diseases encountered today. Additionally, current studies lack sufficient discussion on advanced detection algorithms, making it difficult to determine the optimal application approach. To address these issues, this study constructs a multi-class rice disease dataset encompassing 11 disease categories and a healthy leaf class, providing a more comprehensive and practical representation of rice disease categories. Furthermore, this study evaluates state-of-the-art detection networks, finding that DenseNet offers the best overall performance with an accuracy of 95.7%, precision of 95.3%, recall of 94.8%, and F1 score of 95.0%, with a parameter count of only 6.97 M. In response to the current trend of transfer learning, this study incorporates pre-trained weights from the large-scale ImageNet dataset and finds that the RegNet model provides the best overall performance with an accuracy of 96.8%, precision of 96.2%, recall of 95.9%, and F1 score of 96.0%, with a parameter count of just 3.91 M. Additionally, an app for rice disease recognition based on the RegNet model has been developed, offering a user-friendly and efficient tool for diagnosing rice diseases.

Author Contributions

Conceptualization, Y.L., L.Y. and Y.H.; methodology, Y.L.; software, L.Y. and Y.H.; validation, L.Y. and Y.H.; formal analysis, Y.L. and X.C.; investigation, Y.L., X.C., L.Y. and Y.H.; resources, X.C.; data curation, Y.L., L.Y. and Y.H.; writing—original draft preparation, Y.L.; writing—review and editing, Y.L. and X.C.; visualization, Y.L., L.Y. and Y.H.; supervision, X.C.; project administration, X.C.; funding acquisition, X.C. All authors have read and agreed to the published version of the manuscript.

Funding

Research on Key Technical Equipment for AI-based Rice Pest and Disease Identification and Control. Regional Innovation Cooperation Project of Sichuan Provincial Department of Science and Technology, grant number 24QYCX0185. The duration is from January 2024 to December 2025.

Data Availability Statement

The original contributions presented in the study are included in the article; further inquiries can be directed to the corresponding author.

Acknowledgments

Thanks to the Conference on Computer Vision and Pattern Recognition.

Conflicts of Interest

The authors declare no conflicts of interest.

References

  1. Li, R.; Chen, S.; Matsumoto, H.; Gouda, M.; Gafforov, Y.; Wang, M.; Liu, Y. Predicting rice diseases using advanced technologies at different scales: Present status and future perspectives. aBIOTECH 2023, 4, 359–371. [Google Scholar] [CrossRef]
  2. Worakuldumrongdej, P.; Maneewam, T.; Ruangwiset, A. Rice Seed Sowing Drone for Agriculture. In Proceedings of the 2019 19th International Conference on Control, Automation and Systems (ICCAS), Jeju, Republic of Korea, 15–18 October 2019. [Google Scholar] [CrossRef]
  3. Marzuki, O.F.; Teo, E.Y.L.; Rafie, A.S.M. The mechanism of drone seeding technology: A review. Malays. For. 2021, 84, 349–358. [Google Scholar]
  4. Ahmed, K.; Shahidi, T.R.; Alam, S.M.I.; Momen, S. Rice Leaf Disease Detection Using Machine Learning Techniques. In Proceedings of the 2019 International Conference on Sustainable Technologies for Industry 4.0 (STI), Dhaka, Bangladesh, 24–25 December 2019. [Google Scholar] [CrossRef]
  5. Pothen, M.E.; Pai, M.L. Detection of Rice Leaf Diseases Using Image Processing. In Proceedings of the 2020 Fourth International Conference on Computing Methodologies and Communication (ICCMC), Erode, India, 11–13 March 2020. [Google Scholar] [CrossRef]
  6. Jhatial, M.J.; Shaikh, R.A.; Shaikh, N.A.; Rajper, S.; Arain, R.H.; Chandio, G.H.; Bhangwar, A.Q.; Shaikh, H.; Shaikh, K.H. Deep learning-based rice leaf diseases detection using Yolov5. Sukkur IBA J. Comput. Math. Sci. 2022, 6, 49–61. [Google Scholar]
  7. Liang, W.-J.; Zhang, H.; Zhang, G.-F.; Cao, H.-X. Rice Blast Disease Recognition Using a Deep Convolutional Neural Network. Sci. Rep. 2019, 9, 2869. [Google Scholar] [CrossRef] [PubMed]
  8. Jiang, F.; Lu, Y.; Chen, Y.; Cai, D.; Li, G. Image recognition of four rice leaf diseases based on deep learning and support vector machine. Comput. Electron. Agric. 2020, 179, 105824. [Google Scholar] [CrossRef]
  9. Shah, S.R.; Qadri, S.; Bibi, H.; Shah, S.M.W.; Sharif, M.I.; Marinello, F. Comparing Inception V3, VGG 16, VGG 19, CNN, and ResNet 50: A Case Study on Early Detection of a Rice Disease. Agronomy 2023, 13, 1633. [Google Scholar] [CrossRef]
  10. Mannepalli, P.K.; Pathre, A.; Chhabra, G.; Ujjainkar, P.A.; Wanjari, S. Diagnosis of bacterial leaf blight, leaf smut, and brown spot in rice leafs using VGG16. Procedia Comput. Sci. 2024, 235, 193–200. [Google Scholar] [CrossRef]
  11. Mohapatra, S.; Marandi, C.; Sahoo, A.; Mohanty, S.; Tudu, K. Rice Leaf Disease Detection and Classification Using a Deep Neural Network. In International Conference on Computing, Communication and Learning; Springer: Cham, Switzerland, 2022. [Google Scholar] [CrossRef]
  12. Poorni, R.; Kalaiselvan, P.; Thomas, N.; Srinivasan, T. Detection of Rice Leaf Diseases using Convolutional Neural Network. ECS Trans. 2022, 107, 5069–5080. [Google Scholar] [CrossRef]
  13. Wang, Y.; Wang, H.; Peng, Z. Rice Diseases Detection and Classification Using Attention Based Neural Network and Bayesian Optimization. Expert Syst. Appl. 2022, 178, 114770. [Google Scholar] [CrossRef]
  14. Thai-Nghe, N.; Tri, N.T.; Hoa, N.H. Deep Learning for Rice Leaf Disease Detection in Smart Agriculture. In International Conference on Artificial Intelligence and Big Data in Digital Era; Springer: Cham, Switzerland, 2022. [Google Scholar] [CrossRef]
  15. Lu, Y.; Yi, S.; Zeng, N.; Liu, Y.; Zhang, Y. Identification of rice diseases using deep convolutional neural networks. Neurocomputing 2017, 267, 378–384. [Google Scholar] [CrossRef]
  16. Rahman, C.R.; Arko, P.S.; Ali, M.E.; Khan, M.A.I.; Apon, S.H.; Nowrin, F.; Wasif, A. Identification and recognition of rice diseases and pests using convolutional neural networks. Biosyst. Eng. 2020, 194, 112–120. [Google Scholar] [CrossRef]
  17. Sanya, D.R.A.; Syed-Ab-Rahman, S.F.; Jia, A.; Onésime, D.; Kim, K.-M.; Ahohuendo, B.C.; Rohr, J.R. A review of approaches to control bacterial leaf blight in rice. World J. Microbiol. Biotechnol. 2022, 38, 113. [Google Scholar] [CrossRef] [PubMed]
  18. Niño-Liu, D.O.; Ronald, P.C.; Bogdanove, A.J. Xanthomonas oryzae pathovars: Model pathogens of a model crop. Mol. Plant Pathol. 2010, 7, 303–324. [Google Scholar] [CrossRef]
  19. Wang, Z.; Chen, B.; Zhang, T.; Zhou, G.; Yang, X. Rice Stripe Mosaic Disease: Characteristics and Control Strategies. Front. Microbiol. 2021, 12, 715223. [Google Scholar] [CrossRef]
  20. Zhu, X.; Chen, L.; Zhang, Z.; Li, J.; Zhang, H.; Li, Z.; Pan, Y.; Wang, X. Genetic-based dissection of resistance to bacterial leaf streak in rice by GWAS. BMC Plant Biol. 2023, 23, 396. [Google Scholar] [CrossRef]
  21. Ngalimat, M.S.; Hata, E.M.; Zulperi, D.; Ismail, S.I.; Ismail, M.R.; Zainudin, N.A.I.M.; Saidi, N.B.; Yusof, M.T. A laudable strategy to manage bacterial panicle blight disease of rice using biocontrol agents. J. Basic Microbiol. 2023, 63, 1180–1195. [Google Scholar] [CrossRef]
  22. Shew, A.M.; Durand-Morat, A.; Nalley, L.L.; Zhou, X.-G.; Rojas, C.; Thoma, G. Warming increases Bacterial Panicle Blight (Burkholderia glumae) occurrences and impacts on USA rice production. PLoS ONE 2019, 14, e0219199. [Google Scholar] [CrossRef]
  23. Wen, X.H.; Xie, M.J.; Jiang, J.; Yang, B.; Shao, Y.L.; He, W.; Liu, L.; Zhao, Y. Advances in research on control method of rice blast. Chin. Agric. Sci. Bull. 2013, 29, 190–195. [Google Scholar]
  24. Sunder, S.; Singh, R.A.M.; Agarwal, R. Brown spot of rice: An overview. Indian Phytopathol. 2014, 67, 201–215. [Google Scholar]
  25. Valent, B. The Impact of Blast Disease: Past, Present, and Future. In Magnaporthe oryzae; Methods in Molecular Biology; Humana: New York, NY, USA, 2021; pp. 1–18. [Google Scholar] [CrossRef]
  26. Rubia, E.; Heong, K.; Zalucki, M.; Gonzales, B.; Norton, G. Mechanisms of compensation of rice plants to yellow stem borer Scirpophaga incertulas (Walker) injury. Crop Prot. 1996, 15, 335–340. [Google Scholar] [CrossRef]
  27. Azzam, O.; Chancellor, T.C.B. The Biology, Epidemiology, and Management of Rice Tungro Disease in Asia. Plant Dis. 2002, 86, 88–100. [Google Scholar] [CrossRef] [PubMed]
  28. Hibino, H.; Cabunagan, R.C. Cabunagan. Rice tungro associated viruses and their relation to host plants and vector leafhopper. Trop. Agric. Res. Ser. 1986, 19, 173–182. [Google Scholar]
  29. Khanal, S.; Gaire, S.P.; Zhou, X.-G. Kernel Smut and False smut: The old-emerging diseases of rice—A review. Phytopathology 2023, 113, 931–944. [Google Scholar] [CrossRef]
  30. Savary, S.; Willocquet, L.; Elazegui, F.A.; Teng, P.S.; Van Du, P.; Zhu, D.; Tang, Q.; Huang, S.; Lin, X.; Singh, H.M.; et al. Rice Pest Constraints in Tropical Asia: Characterization of Injury Profiles in Relation to Production Situations. Postep. Astron. Krakow 2000, 84, 341–356. [Google Scholar] [CrossRef] [PubMed]
  31. Lee, F.N. Rice Sheath Blight: A Major Rice Disease. Plant Dis. 1983, 67, 829. [Google Scholar] [CrossRef]
  32. Bengio, Y.; Goodfellow, I.; Courville, A. Deep Learning; MIT Press: Cambridge, MA, USA, 2017; Volume 1. [Google Scholar]
  33. Chen, L.; Li, S.; Bai, Q.; Yang, J.; Jiang, S.; Miao, Y. Review of image classification algorithms based on convolutional neural networks. Remote Sens. 2021, 13, 4712. [Google Scholar] [CrossRef]
  34. Simonyan, K.; Zisserman, A. Very Deep Convolutional Networks for Large-Scale Image Recognition. arXiv 2014, arXiv:1409.1556v6. [Google Scholar] [CrossRef]
  35. Szegedy, C.; Liu, W.; Jia, Y.; Sermanet, P.; Reed, S.; Anguelov, D.; Erhan, D.; Vanhoucke, V.; Rabinovich, A.; Liu, W.; et al. Going Deeper with Convolutions. In Proceedings of the 2015 IEEE Conference on Computer Vision and Pattern Recognition (CVPR), Boston, MA, USA, 7–12 June 2015; pp. 1–9. [Google Scholar] [CrossRef]
  36. He, K.; Zhang, X.; Ren, S.; Sun, J. Deep residual learning for image recognition. In Proceedings of the IEEE Conference on Computer Vision and Pattern Recognition, Las Vegas, NV, USA, 26 June–1 July 2016; pp. 770–778. [Google Scholar]
  37. Sandler, M.; Howard, A.; Zhu, M.; Zhmoginov, A.; Chen, L. MobileNetV2: Inverted Residuals and Linear Bottlenecks. In Proceedings of the IEEE Conference on Computer Vision and Pattern Recognition, Salt Lake City, UT, USA, 18–23 June 2018. [Google Scholar] [CrossRef]
  38. Howard, A.; Sandler, M.; Chen, B.; Wang, W.; Chen, L.-C.; Tan, M.; Chu, G.; Vasudevan, V.; Zhu, Y.; Pang, R.; et al. Searching for MobileNetV3. In Proceedings of the 2019 IEEE/CVF International Conference on Computer Vision (ICCV), Seoul, Republic of Korea, 27 October–2 November 2019; pp. 1314–1324. [Google Scholar] [CrossRef]
  39. Zhang, X.; Zhou, X.; Lin, M.; Sun, J. ShuffleNet: An Extremely Efficient Convolutional Neural Network for Mobile Devices. In Proceedings of the IEEE Conference on Computer vision and Pattern Recognition, Honolulu, HI, USA, 21–26 July 2017. [Google Scholar] [CrossRef]
  40. Ma, N.; Zhang, X.; Zheng, H.-T.; Sun, J. ShuffleNet V2: Practical Guidelines for Efficient CNN Architecture Design. In Proceedings of the European Conference on Computer Vision (ECCV), Munich, Germany, 8–14 September 2018; Springer: Cham, Switzerland, 2018; pp. 116–131. [Google Scholar] [CrossRef]
  41. Huang, G.; Liu, Z.; Van Der Maaten, L.; Weinberger, K.Q. Densely Connected Convolutional Networks. In Proceedings of the 2017 IEEE Conference on Computer Vision and Pattern Recognition, Honolulu, HI, USA, 21–26 July 2017; pp. 2261–2269. [Google Scholar] [CrossRef]
  42. Tan, M.; Le, Q. EfficientNetV2: Smaller Models and Faster Training. arXiv 2021, arXiv:2104.00298. [Google Scholar]
  43. Liu, Z.; Lin, Y.; Cao, Y.; Hu, H.; Wei, Y.; Zhang, Z.; Lin, S.; Guo, B. Swin Transformer: Hierarchical Vision Transformer using Shifted Windows. In Proceedings of the IEEE/CVF International Conference on Computer Vision, Montreal, BC, Canada, 11–17 October 2021. [Google Scholar] [CrossRef]
  44. Mehta, S.; Rastegari, M. MobileViT: Light-weight, General-purpose, and Mobile-friendly Vision Transformer. arXiv 2021, arXiv:2110.02178. [Google Scholar] [CrossRef]
  45. Radosavovic, I.; Kosaraju, R.P.; Girshick, R.; He, K.; Dollar, P. Designing Network Design Spaces. In Proceedings of the 2020 IEEE/CVF Conference on Computer Vision and Pattern Recognition (CVPR), Seattle, WA, USA, 13–19 June 2020. [Google Scholar] [CrossRef]
  46. Dosovitskiy, A.; Beyer, L.; Kolesnikov, A.; Weissenborn, D.; Zhai, X.; Unterthiner, T.; Dehghani, M.; Minderer, M.; Heigold, G.; Gelly, S.; et al. An Image is Worth 16×16 Words: Transformers for Image Recognition at Scale. In Proceedings of the International Conference on Learning Representations, Virtual Event, Austria, 3–7 May 2021. [Google Scholar]
  47. Menghani, G. Efficient Deep Learning: A Survey on Making Deep Learning Models Smaller, Faster, and Better. ACM Comput. Surv. 2023, 55, 259.1–259.37. [Google Scholar]
  48. Pan, S.J.; Yang, Q. A Survey on Transfer Learning. IEEE Trans. Knowl. Data Eng. 2010, 22, 1345–1359. [Google Scholar] [CrossRef]
  49. Tan, C.; Sun, F.; Kong, T.; Zhang, W.; Yang, C.; Liu, C. A Survey on Deep Transfer Learning. In Proceedings of the 27th International Conference on Artificial Neural Networks, Rhodes, Greece, 4–7 October 2018; pp. 270–279. [Google Scholar] [CrossRef]
  50. Zhuang, F.; Qi, Z.; Duan, K.; Xi, D.; Zhu, Y.; Zhu, H.; Xiong, H.; He, Q. A Comprehensive Survey on Transfer Learning. Proc. IEEE 2021, 109, 43–76. [Google Scholar] [CrossRef]
  51. Deng, J.; Dong, W.; Socher, R.; Li, L.-J.; Li, K.; Fei-Fei, L. ImageNet: A large-scale hierarchical image database. In Proceedings of the 2009 IEEE Conference on Computer Vision and Pattern Recognition, Miami, FL, USA, 20–25 June 2009; pp. 248–255. [Google Scholar] [CrossRef]
  52. Russakovsky, O.; Deng, J.; Su, H.; Krause, J.; Satheesh, S.; Ma, S.; Huang, Z.; Karpathy, A.; Khosla, A.; Bernstein, M.; et al. ImageNet Large Scale Visual Recognition Challenge. Int. J. Comput. Vis. 2015, 115, 211–252. [Google Scholar] [CrossRef]
  53. Deng, J.; Russakovsky, O.; Krause, J.; Bernstein, M.S.; Berg, A.; Fei-Fei, L. Scalable Multi-label Annotation. In Proceedings of the SIGCHI Conference on Human Factors in Computing Systems; ACM: New York, NY, USA, 2014. [Google Scholar] [CrossRef]
  54. Zhang, Q.; Yang, S.; Ren, R. Research on Uni-app Based Cross-platform Digital Textbook System. In Proceedings of the CSSE 2020: 2020 3rd International Conference on Computer Science and Software Engineering, Beijing, China, 22–24 May 2020. [Google Scholar] [CrossRef]
  55. Voron, F. Building Data Science Applications with FastAPI: Develop, Manage, and Deploy Efficient Machine Learning Applications with Python; Packt Publishing Ltd.: Birmingham, UK, 2023. [Google Scholar]
Figure 1. Sample images from each category in the dataset.
Agronomy 14 01879 g001
Figure 2. Network structure diagram of DenseNet.
Agronomy 14 01879 g002
Figure 3. Network structure diagram of Regularization Network.
Agronomy 14 01879 g003
Figure 4. Schematic diagram of the Regularization Network module.
Agronomy 14 01879 g004
Figure 5. Graph of changes in loss function values and validation accuracy during training.
Agronomy 14 01879 g005
Figure 6. The confusion matrix of the DenseNet model on the test set.
Agronomy 14 01879 g006
Figure 7. Graph of changes in loss function values and validation accuracy during training.
Agronomy 14 01879 g007
Figure 8. The confusion matrix of the RegNet model on the test set.
Agronomy 14 01879 g008
Figure 9. Schematic diagram of the rice disease identification app interface.
Agronomy 14 01879 g009
Table 1. Number of images per category in the dataset.
IndexDisease NameImages
1Bacterial leaf blight479
2Bacterial leaf streak629
3Bacterial panicle blight337
4Blast1738
5Brown spot965
6Dead Heart1442
7Downy mildew620
8Hispa1594
9Normal1764
10Tungro1088
11Smut373
12Rice sheath blight252
Table 2. Experimental environment configuration table.
ConfigurationParameter
CPUIntel(R) Xeon(R) CPU E5-2690 v4
GPUNVIDIA GeForce RTX 3060 Ti, 8192 MB VRAM
Operating systemWindows 10
CUDA accelerated environment2.0.1+cu117
Python3.10.12
Pytorch11.8
Lr0.0001
Batch-size16
Workers4
Epoch100
OptimizerAdam
Table 3. Comparison experiments.
Model NameAccuracy%Precision%Recall%F1 ScoreParameters/M
Vgg1692.190.590.190.3134.31
GoogleNet90.388.788.888.710.34
ResNet3494.093.092.792.821.29
MobileNet v293.092.390.691.32.24
MobileNet v3 small91.990.389.890.01.53
MobileNet v3 large93.892.192.692.34.22
ShuffleNet v293.392.591.491.81.27
ShuffleNet v194.293.692.993.20.92
DenseNet95.795.394.895.06.97
EfficientNet v295.394.293.693.924.20
Swin Transformer tiny92.891.290.390.727.53
MobileVIT93.892.492.391.20.96
RegNet93.891.892.091.83.91
Vision Transformer91.890.590.890.685.81
Table 4. The accuracy of models with a parameter volume less than 10 M on various disease categories.
Disease Name MobileNet v3 LargeShufflenet v1Shufflenet v2DenseNet 121MobileVITRegNet
Bacterial leaf blight93.796.892.695.892.691.6
Bacterial leaf streak88.089.690.492.088.888.0
Bacterial panicle blight98.597.097.097.098.597.0
Blast94.892.594.296.895.196.8
Brown spot92.793.894.394.895.891.2
Dead Heart98.999.798.999.397.997.9
Downy mildew90.388.783.992.786.391.9
Hispa93.494.991.295.392.494.6
Normal94.395.796.697.496.396.9
Tungro84.084.076.088.080.084.0
Smut89.286.587.894.690.593.2
Rice sheath blight93.595.493.594.093.588.9
Table 5. The F1 score of models with a parameter volume less than 10 M on various disease categories.
Disease NameMobileNet v3 LargeShufflenet v1Shufflenet v2DenseNet 121MobileVITRegNet
Bacterial leaf blight89.595.391.694.893.192.1
Bacterial leaf streak88.789.990.792.391.490.9
Bacterial panicle blight97.194.992.898.595.095.6
Blast95.294.194.296.195.095.6
Brown spot93.994.094.595.093.094.4
Dead Heart98.699.098.699.598.798.4
Downy mildew87.886.988.292.087.786.0
Hispa93.593.893.494.893.395.1
Normal95.295.793.197.095.394.9
Tungro83.989.482.690.781.686.6
Smut91.190.889.094.090.591.4
Rice sheath blight93.394.592.995.793.592.1
Table 6. The accuracy of models with a parameter volume greater than 10 M on various disease categories.
Disease NameVgg16GoogleNetResNet34EfficientNet v2Swin
Transformer
Vision
Transformer
Bacterial leaf blight82.182.191.692.684.289.5
Bacterial leaf streak87.286.488.092.888.890.4
Bacterial panicle blight94.092.597.097.094.098.5
Blast95.786.496.896.896.293.6
Brown spot89.187.592.096.493.391.7
Dead Heart99.098.397.999.398.695.1
Downy mildew85.589.591.988.782.287.9
Hispa94.090.294.694.391.289.9
Normal96.094.396.996.594.993.7
Tungro86.082.084.084.084.088.0
Smut86.585.193.287.879.781.1
Rice sheath blight89.490.888.996.896.890.8
Table 7. The F1 score of models with a parameter volume greater than 10 M on various disease categories.
Disease NameVgg16GoogleNetResNet34EfficientNet v2Swin
Transformer
Vision
Transformer
Bacterial leaf blight85.280.892.193.187.086.7
Bacterial leaf streak88.288.590.991.787.490.4
Bacterial panicle blight94.791.895.697.795.497.8
Blast93.090.795.696.094.593.3
Brown spot90.587.394.496.193.592.2
Dead Heart98.697.098.499.197.995.8
Downy mildew82.883.586.088.784.784.5
Hispa93.090.495.195.892.089.3
Normal95.192.694.997.095.194.4
Tungro85.183.786.685.780.884.6
Smut86.587.591.490.885.585.7
Rice sheath blight90.690.192.194.494.892.7
Table 8. Experiments with pre-trained weights.
Model NameAccuracy%Precision%Recall%F1 ScoreParameters/M
Vgg1693.593.492.893.1134.31
GoogleNet91.089.090.089.210.34
ResNet3496.796.095.795.821.29
MobileNet v271.673.471.071.72.24
MobileNet v3_small87.687.986.086.81.53
MobileNet v3_large91.891.691.091.34.22
Shufflenet v296.695.795.795.71.27
Shufflenet v194.493.792.292.90.92
DenseNet94.994.593.894.26.97
EfficientNet v295.694.294.394.224.20
Swin Transformer tiny94.093.292.692.927.53
MobileVIT92.691.191.391.10.96
RegNet96.896.295.996.03.91
Vision Transformer96.696.295.996.085.81
Table 9. The accuracy of models with a parameter volume less than 10 M on various disease categories.
Disease NameMobileNet v3 LargeShuffleNet v1ShuffleNet v2DenseNetMobileVITRegNet
Bacterial leaf blight92.694.794.797.993.693.7
Bacterial leaf streak92.094.496.092.889.696.8
Bacterial panicle blight94.086.598.597.097.098.5
Blast93.697.795.995.194.298.0
Brown spot87.595.898.994.889.697.4
Dead Heart97.298.299.398.998.299.3
Downy mildew86.390.393.586.388.793.5
Hispa89.094.095.693.492.496.2
Normal94.696.097.498.093.298.0
Tungro86.082.088.086.086.092.0
Smut89.286.593.291.981.191.9
Rice sheath blight89.490.397.294.091.295.8
Table 10. The F1 score of models with a parameter volume less than 10 M on various disease categories.
Disease NameMobileNet v3 LargeShuffleNet v1ShuffleNet v2DenseNetMobileVITRegNet
Bacterial leaf blight89.794.294.796.991.394.7
Bacterial leaf streak91.692.996.093.987.895.6
Bacterial panicle blight93.392.096.397.095.698.5
Blast92.395.096.594.892.796.7
Brown spot89.295.498.296.093.297.4
Dead Heart97.497.899.399.098.399.5
Downy mildew87.391.493.587.786.393.5
Hispa88.394.496.094.793.096.3
Normal93.895.496.895.594.197.7
Tungro88.684.589.887.781.190.2
Smut91.788.393.893.188.295.1
Rice sheath blight91.793.397.293.390.897.4
Table 11. The accuracy of models with a parameter volume greater than 10 M on various disease categories.
Disease NameVgg16GoogleNetResNet34EfficientNet v2Swin
Transformer
Vision
Transformer
Bacterial leaf blight84.281.096.898.990.596.8
Bacterial leaf streak91.287.296.892.887.295.2
Bacterial panicle blight10097.010097.097.0100
Blast94.591.698.596.297.798.8
Brown spot94.391.795.394.395.896.4
Dead Heart98.695.199.699.699.399.3
Downy mildew86.386.393.591.187.190.3
Hispa91.893.494.694.694.094.6
Normal97.792.097.797.193.497.7
Tungro94.088.086.080.08890.0
Smut95.682.491.993.290.595.9
Rice sheath blight86.688.997.295.890.395.8
Table 12. The F1 score of models with a parameter volume greater than 10 M on various disease categories.
Disease NameVgg16GoogleNetResNet34EfficientNet v2Swin
Transformer
Vision
Transformer
Bacterial leaf blight86.986.194.793.992.495.8
Bacterial leaf streak93.486.595.693.188.996.3
Bacterial panicle blight97.191.598.594.997.097.8
Blast92.791.796.796.395.097.0
Brown spot92.690.297.495.895.197.4
Dead Heart98.996.699.599.799.399.3
Downy mildew87.782.393.590.490.092.1
Hispa92.892.196.395.392.695.1
Normal95.594.097.797.294.397.0
Tungro94.084.690.283.384.691.8
Smut95.285.395.195.192.494.6
Rice sheath blight89.588.997.495.292.697.6
Disclaimer/Publisher’s Note: The statements, opinions and data contained in all publications are solely those of the individual author(s) and contributor(s) and not of MDPI and/or the editor(s). MDPI and/or the editor(s) disclaim responsibility for any injury to people or property resulting from any ideas, methods, instructions or products referred to in the content.

