Article

Nonlinear Logistic Model for Describing Strawberry Fruit Production

by
Maria Inês Diel
1,
Alessandro Dal Col Lucio
2,*,
Dilson Antonio Bisognin
2,
Gabriel de Araujo Lopes
2 and
Valdeci Jose dos Santos
2
1
Department of Plant Scince, Cachoeira do Sul Campus 1, Federal University of Santa Maria, Cachoeira do Sul 96503-205, Brazil
2
Crop Science Department, Rural Science Center, Santa Maria Campus, Federal University of Santa Maria, Santa Maria 97105-900, Brazil
*
Author to whom correspondence should be addressed.
Agronomy 2024, 14(9), 1884; https://doi.org/10.3390/agronomy14091884
Submission received: 26 July 2024 / Revised: 15 August 2024 / Accepted: 16 August 2024 / Published: 23 August 2024
(This article belongs to the Special Issue Small Fruit Physiology, Production Systems and Management)

Abstract

:
Strawberry (Fragaria × ananassa Duch.) production can be evaluated as repeated measurements, since the same plant is harvested multiple times during the production season. The objectives were to evaluate the production of fresh mass and fruit number in successive harvests and compare three strawberry clones in two cultivation conditions. Two experiments were carried out in two environmental cultivations: the rural property and the experimental area of the Plant Science Department, Federal University of Santa Maria, Brazil. The parameters of the nonlinear logistic model and their critical points were estimated via bootstrap for each condition and clone for fresh mass and fruit number with accumulated values, depending on the thermal sum accumulated during the production season. For nonlinear regression analysis, the ordinary least squares method was used with the Gauss–Newton algorithm. Confidence intervals were obtained for each parameter and estimated critical points, and they did not cross; the treatments were considered different. There were significant differences between clones and cultivation conditions for fruit mass and number. The nonlinear logistic models, adjusted for mass and number of strawberry fruits, detailed the production season, highlighting the main differences between cultivation conditions and clones.

1. Introduction

Strawberry (Fragaria × ananassa Duch.) is a widely cultivated fruit crop in the world, with vast quality sensory qualities, benefits for human health and profitability [1,2]. The strawberry is in the Rosaceae family, of the genus Fragaria, and is an allooctaploid species that emerged in France in the 18th century from a spontaneous crossing between the octaploid species (2n = 8x = 56) F. chiloensis (endemic to Chile) and F. virginiana (native to the eastern United States) [3]. Interspecific hybridization combined characteristics such as the larger size and firmness of fruits from F. chiloensis with the dark red color and more aromatic fruits of F. virginiana. Strawberry has been widely cultivated and is considered one of the most recently domesticated plants in the history of agriculture [4].
Strawberry production in 2021 was 9.2 million tons, with a total cultivated area of 389,665 hectares and productivity of 23.5 tons ha−1. China and the United States contribute 50% of world production [5]. The main strawberry cultivars in the world have been developed in the breeding programs of countries with temperate climates, such as the United States, Spain and Italy. For this reason, it generally has poor adaptation to tropical environments [6].
Nurseries in Argentina, Chile and more recently Spain grow most of South America’s strawberry plantlets, significantly increasing the cost of production [7] in importing countries, such as Brazil. Strawberries are cultivated on 5279 hectares in Brazil, and more than 75% of plantlets are imported, all of them as bare root plantlets from these nurseries [5,8]. Delays in delivery are common, resulting in late planting, late start to fruit production and selling when fruit price is lower [6]. For the implementation of the crop, plantlet acquisition can represent approximately 25% of the annual production cost [9].
Strawberry crop has an important socioeconomic role in the south and southeast regions of Brazil. It is an alternative for diversifying production and income for family properties. Generally, the area allocated for cultivation varies from 0.2 to 2.0 hectares [10]. Strawberries are produced for the fresh market and the food industry [11]. Currently, production in a conventional cultivation system faces problems with diseases, insect damage and high labor costs [12].
Thus, the crop is in the process of migrating to protected soilless cultivation environments, as it is the most efficient way to overcome climate risks, such as hail, rain, frost, strong winds and solar radiation [13]. Furthermore, protected cultivation facilitates cultural management practices, improves worker ergonomics and allows reduction in disease incidence due to a microclimate unfavorable to the pathogen, providing the plant with more efficient use of water and fertilizers and consequently, greater productivity [8,14,15].
Strawberry plantlets produced in Brazil are of low phytosanitary and physiological quality. They use few technological innovations, and their production is carried out in the field [16]. Traditionally, producers choose to use imported plantlets, aiming to mitigate the risk of contaminating their production system with pathogens that are easily spread over long distances [17]. Faced with this unfavorable scenario for strawberry fruit producers to acquire their plantlets, the Federal University of Santa Maria developed and obtained intellectual property privilege (PI 1105802-1) for a new technology for producing plugged plantlets. These plantlets have high quality and availability for producers at the most appropriate time for planting, allowing precocity of production and low plant mortality during crop establishment [18].
Strawberry fruit production is distributed almost throughout the whole year, and therefore, the same plant is harvested multiple times during the season, allowing the possibility of using regression models as a statistical tool for data analysis [19,20,21,22]. The accumulation of values of productive variables in each harvest shows that production starts slowly and goes through an exponential growth that later decreases to a point at which it stabilizes. This type of response is sigmoidal and typical of nonlinear regression models known as growth models [23].
Bio-based nonlinear growth models can be used to extract as much information as possible from a data set. They provide the reality of the production cycle in each experimental treatment, allowing inferences and interpretations not obtained in analysis of variance or complementary statistical tests, such as comparisons of treatment means or linear regression analyses [21,24,25,26]. The objectives were to evaluate the production of fresh mass and fruit number in successive harvests and compare three strawberry clones in two soilless cultivation conditions.

2. Material and Methods

The present study was carried out in Santa Maria, RS, Brazil, during the year 2021. The region has a Cfa climate according to the Köppen classification [27]. The daily minimum and maximum air temperatures were measured at a meteorological station belonging to the National Institute of Meteorology located at UFSM. Two experiments were conducted, which we referred to as experiments I and II, considering the cultivation condition.

2.1. Experiment I

It was installed in the experimental area of the Plant Breeding and Vegetative Propagation Center (29°43′24″ S, 53°43′11″ W, at 99 m altitude) belonging to the Department of Plant Science at the Federal University of Santa Maria—UFSM. On 1 July 2021, the plantlets were transplanted to the production system, which used a 200 μm plastic gutter covered with 100 μm plastic. A 2 cm layer of medium basalt gravel was used, above which a polyethylene mesh screen was placed to separate the gravel from the substrate. The substrate was a mixture of commercial substrate (based on Sphagnum peat and expanded vermiculite) and carbonized rice husk (proportion 2:1—v/v). Seedlings were spaced by 25 cm within row and 15 cm between rows.

2.2. Experiment II

The cultivation was carried out on a rural property (29°40′02″ S, 53°41′11″ W, at 97 m altitude). The plantlets were transplanted on June 18, 2021, and the cultivation system was constructed in a plastic greenhouse with opened sides. Wood benches were prepared and covered with a 7 cm layer of medium basalt gravel, above which a polyethylene screen was placed that separated the substrate from the gravel [28]. The substrate was formed by a 5 cm layer of coarse sand. The plantlets were established at a spacing of 25 cm within each row and 20 cm between rows.
For both locations, the cultivars Albion and Estiva and an advanced breeding clone A were evaluated. For simplification, we refer to Albion and Estiva as clones also. The closed soilless cultivation system was leveled with a 1% slope to provide drainage of excess nutrient solution to the storage container. The plantlets were produced in accordance with PI 1105802-1 [18]. Irrigation was carried out with the aid of a digital timer to allow total immersion of the substrate without the use of drip tapes. The pH of the nutrient solution was maintained between 5.5 and 6.0 and the electrical conductivity between 1.0 and 1.3 dS m−1. Cultural management and treatments followed technical recommendations for the crop.
The fruits were harvested twice a week with at least 75% red-color skin. In each harvest, the number of fruits was recorded and the production was weighed, expressed, respectively, in number and mass of fruits per individual plant.
The average daily air temperature (Tmed) was calculated by the arithmetic mean of the minimum and maximum daily air temperatures. The daily thermal sum (STd, °C day) was calculated by the following method: STd = (Tmed − Tb).1 day; if Tmed < Tb, then Tmed = Tb, where Tb is the lower basal temperature. STd was accumulated from planting, resulting in the accumulated thermal sum (STa), that is, STa = ΣSTd. The Tb used was 0 °C [29].
The mass (g) and the number of fruits per plant obtained in each harvest were consecutively accumulated for each experimental plot (H1, H1 + H2, H1 + H2 + H3,..., H1 + H2 +… Hn). The following parameterization of the logistic model was adjusted: Y i = β 1 1 + e β 2 β 3 X i (I), where Yi is the mass of fruits or number of fruits (dependent variable); Xi is accumulated thermal sum (STa) in degree days, elapsed from time of transplant to harvest (independent trait) and equidistant; β1 is the asymptotic value, and its values represent the total production of treatments; β2 is a parameter that reflects the distance between the initial value (observation) and the asymptote; and β3 is the parameter associated with growth rate.
The parameter estimates were obtained using the ordinary least squares method with a Gauss–Newton algorithm. The intrinsic (cI) and parametric (cθ) nonlinearity were calculated by the curve method, as Bates and Watts [30] suggested. Values below 0.3 and 1.0 mean that the parameters are almost unbiased. The normality, homogeneity and independence of residuals were assessed by the Shapiro–Wilk (SW), Breusch–Pagan (BP) and Durbin–Watson (DW) tests, respectively. The adjusted coefficient of determination was also calculated.
The confidence intervals (CIs) of the model parameters were obtained via bootstrap, with 1000 resamplings for each parameter and treatment. The CIs were used to compare the treatments, and when the CIs did not cross, the treatments were different. The coordinates (X and Y) of the critical points of the logistical model, known as the maximum acceleration point (MAP), inflection point (IP), maximum deceleration point (MDP) and asymptotic deceleration point (ADP), were obtained by setting the following derivatives as equal to zero, according to the methodology described by Mischan et al. (2011) [23]: inflection point (IP): d 2 y x d x 2 = 0 (IV); point of maximum acceleration (MAP) and point of maximum deceleration (MDP): d 3 y x d x 3 = 0 (V); and point of asymptotic deceleration (ADP): d 4 y x d x 4 = 0 (VI). IP corresponds to the precocity of the clone, and the difference between MAP and MDP defines the concentration of production (production increased) [31]. All analyses were performed using R software, version 4.4.1 [32].

3. Results

The results of the quality of fit parameters for the logistic model adjusted for mass and number of strawberry fruits for experiments I and II did not fully meet the model assumptions (Table 1). These problems were overcome by adjusting the model via bootstrap. The intrinsic and parametric nonlinearity were satisfactory, as were the results of the adjusted coefficient of determination, for all variables and clones tested (Table 1).
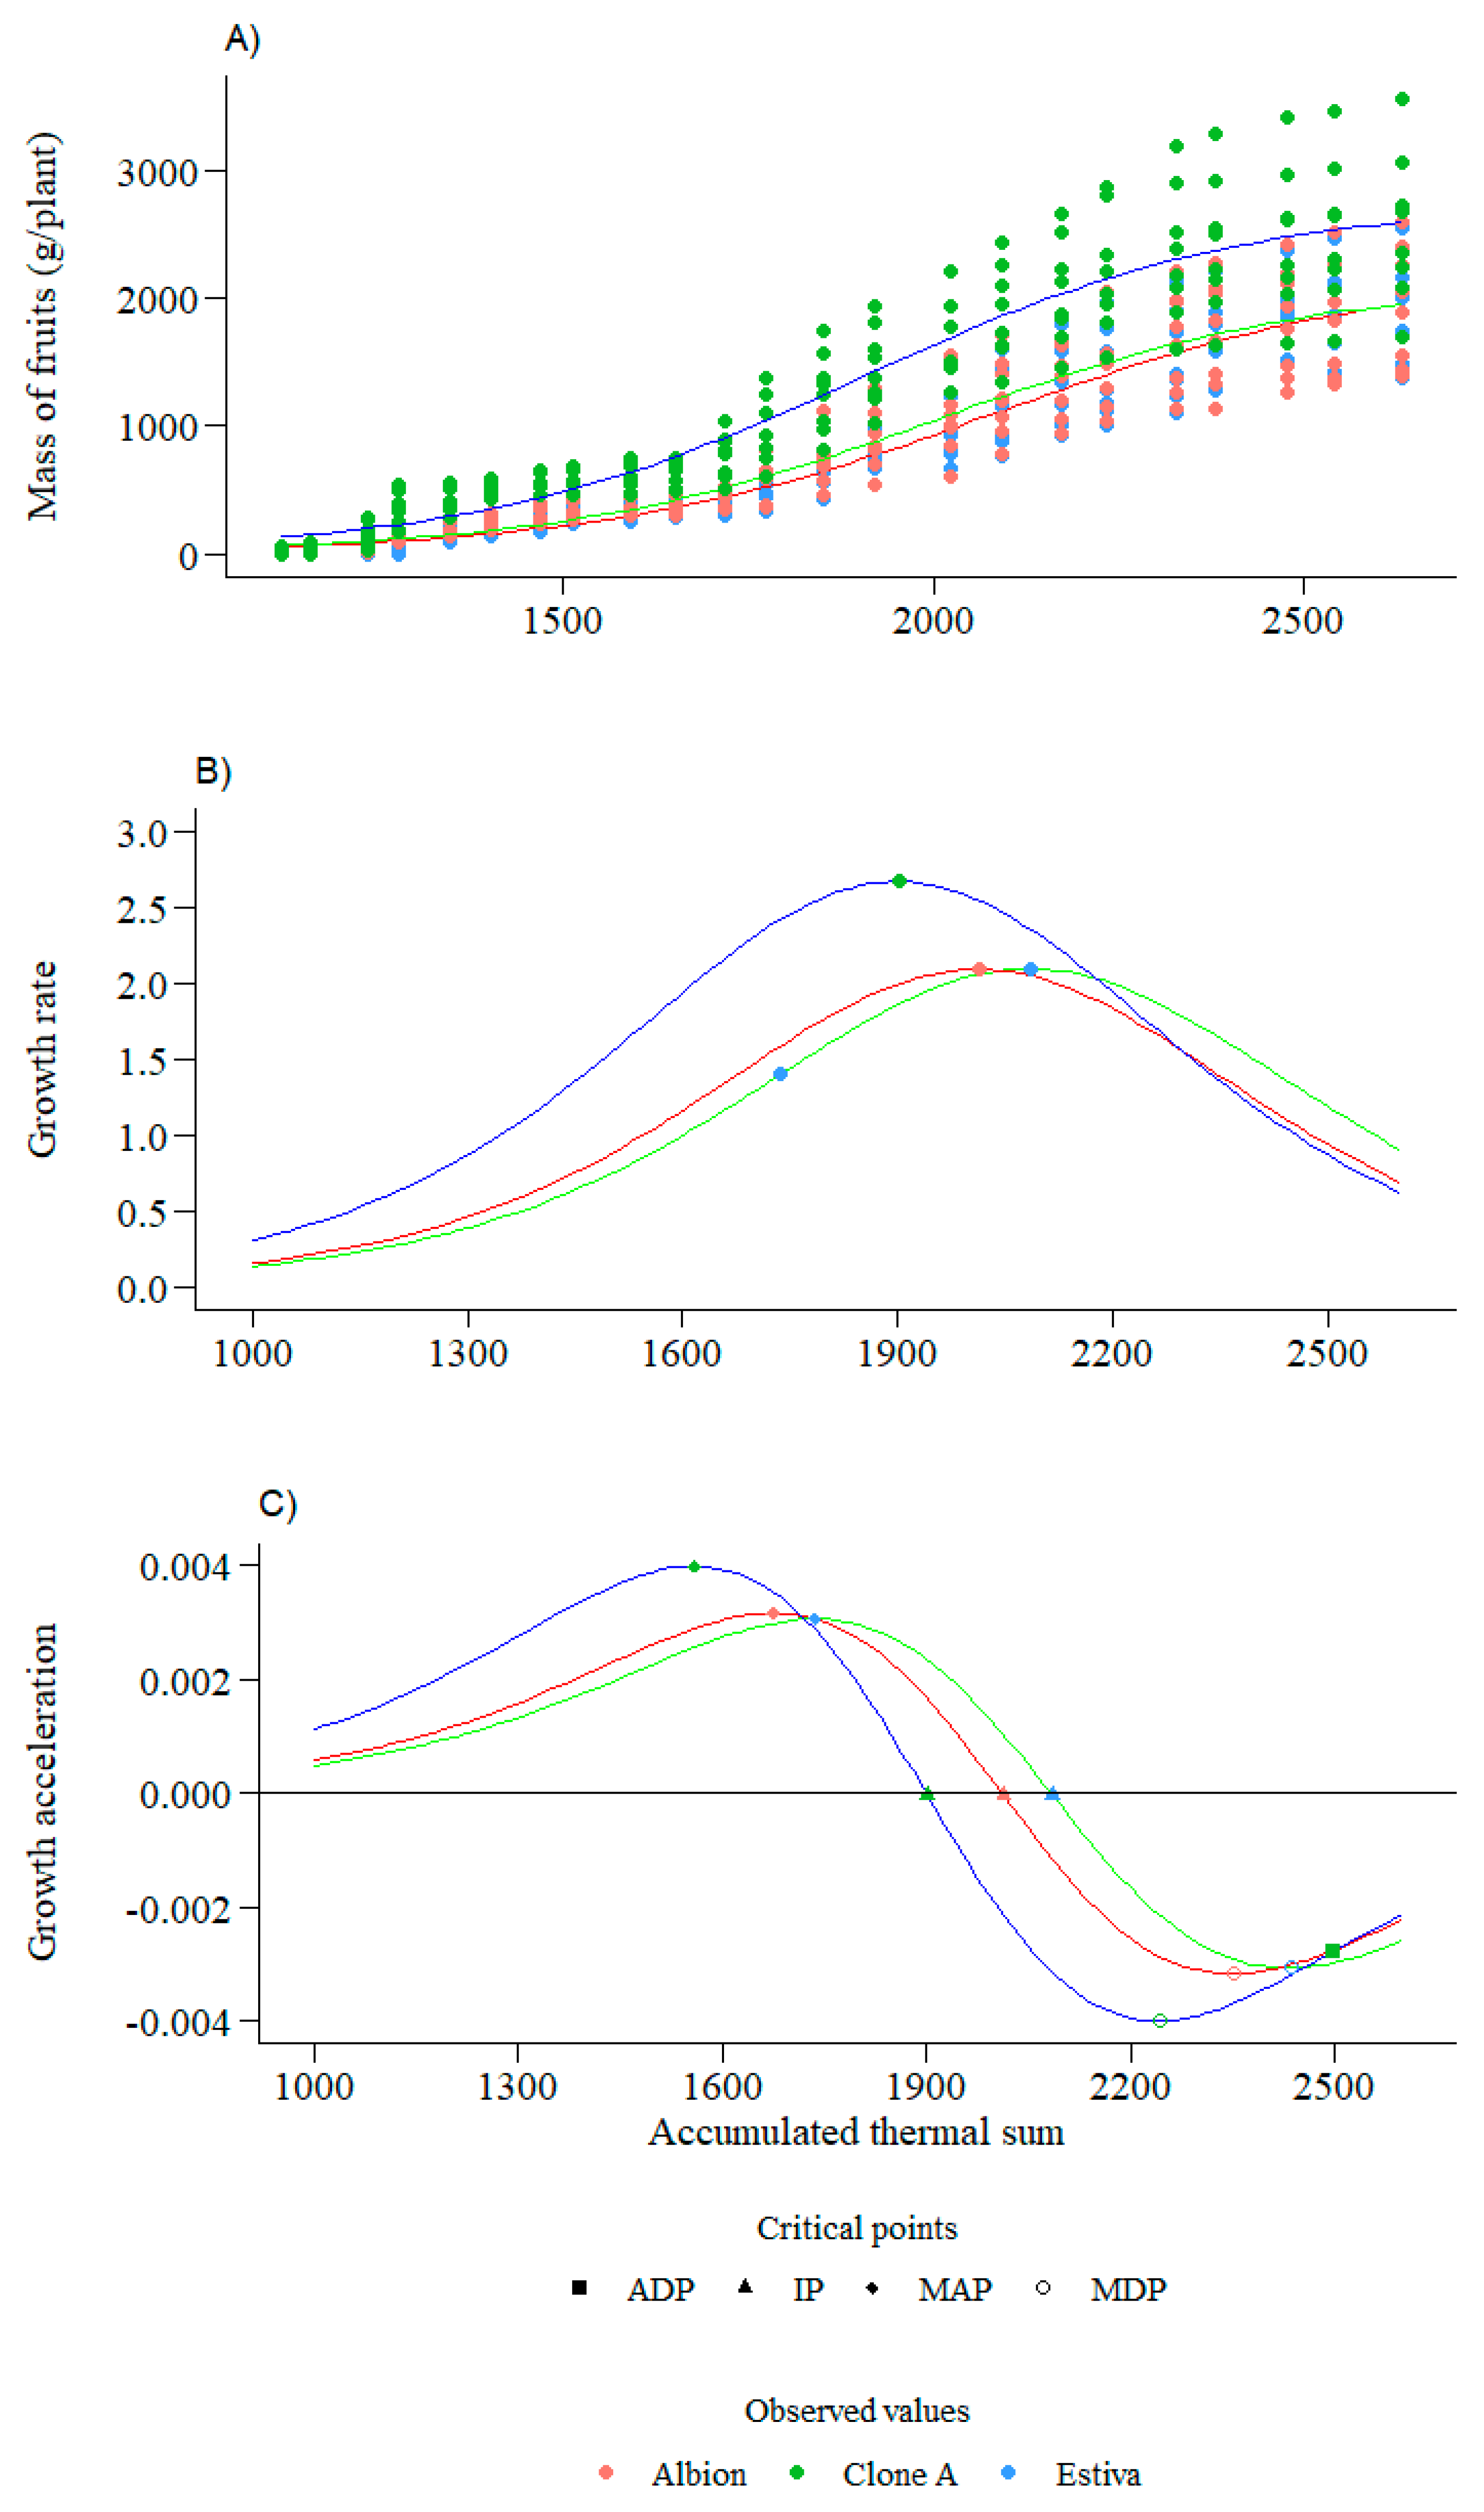
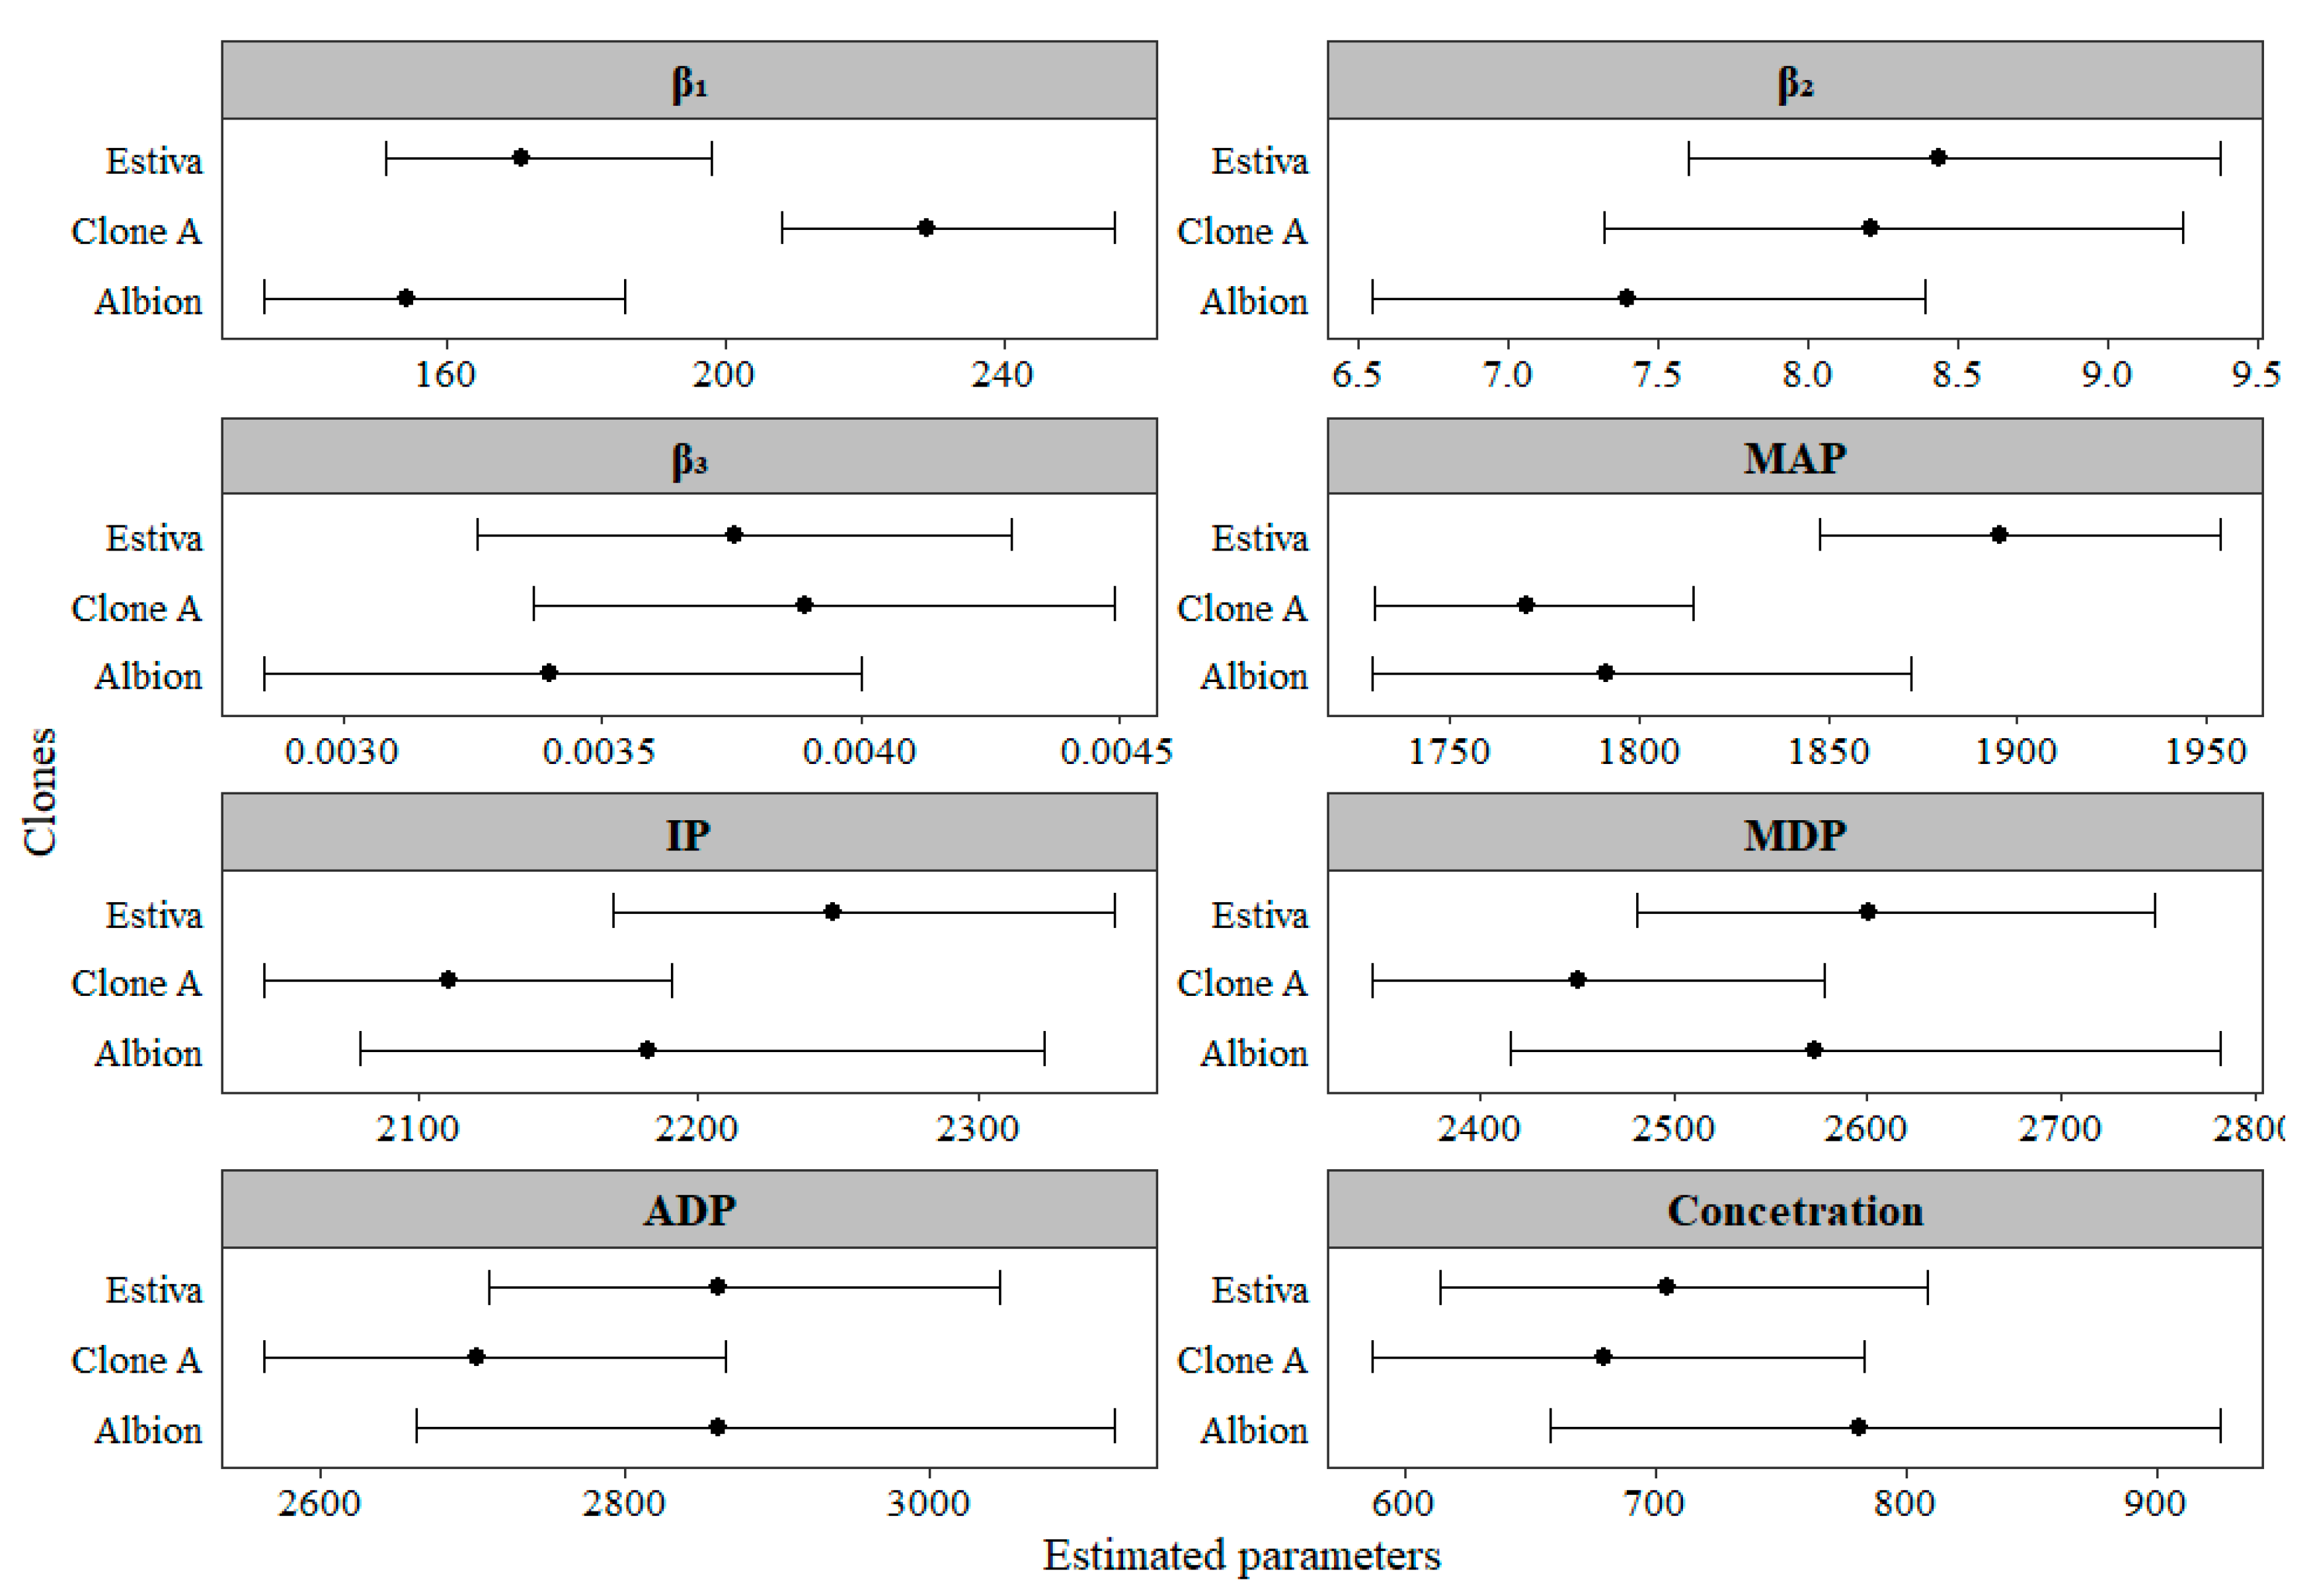
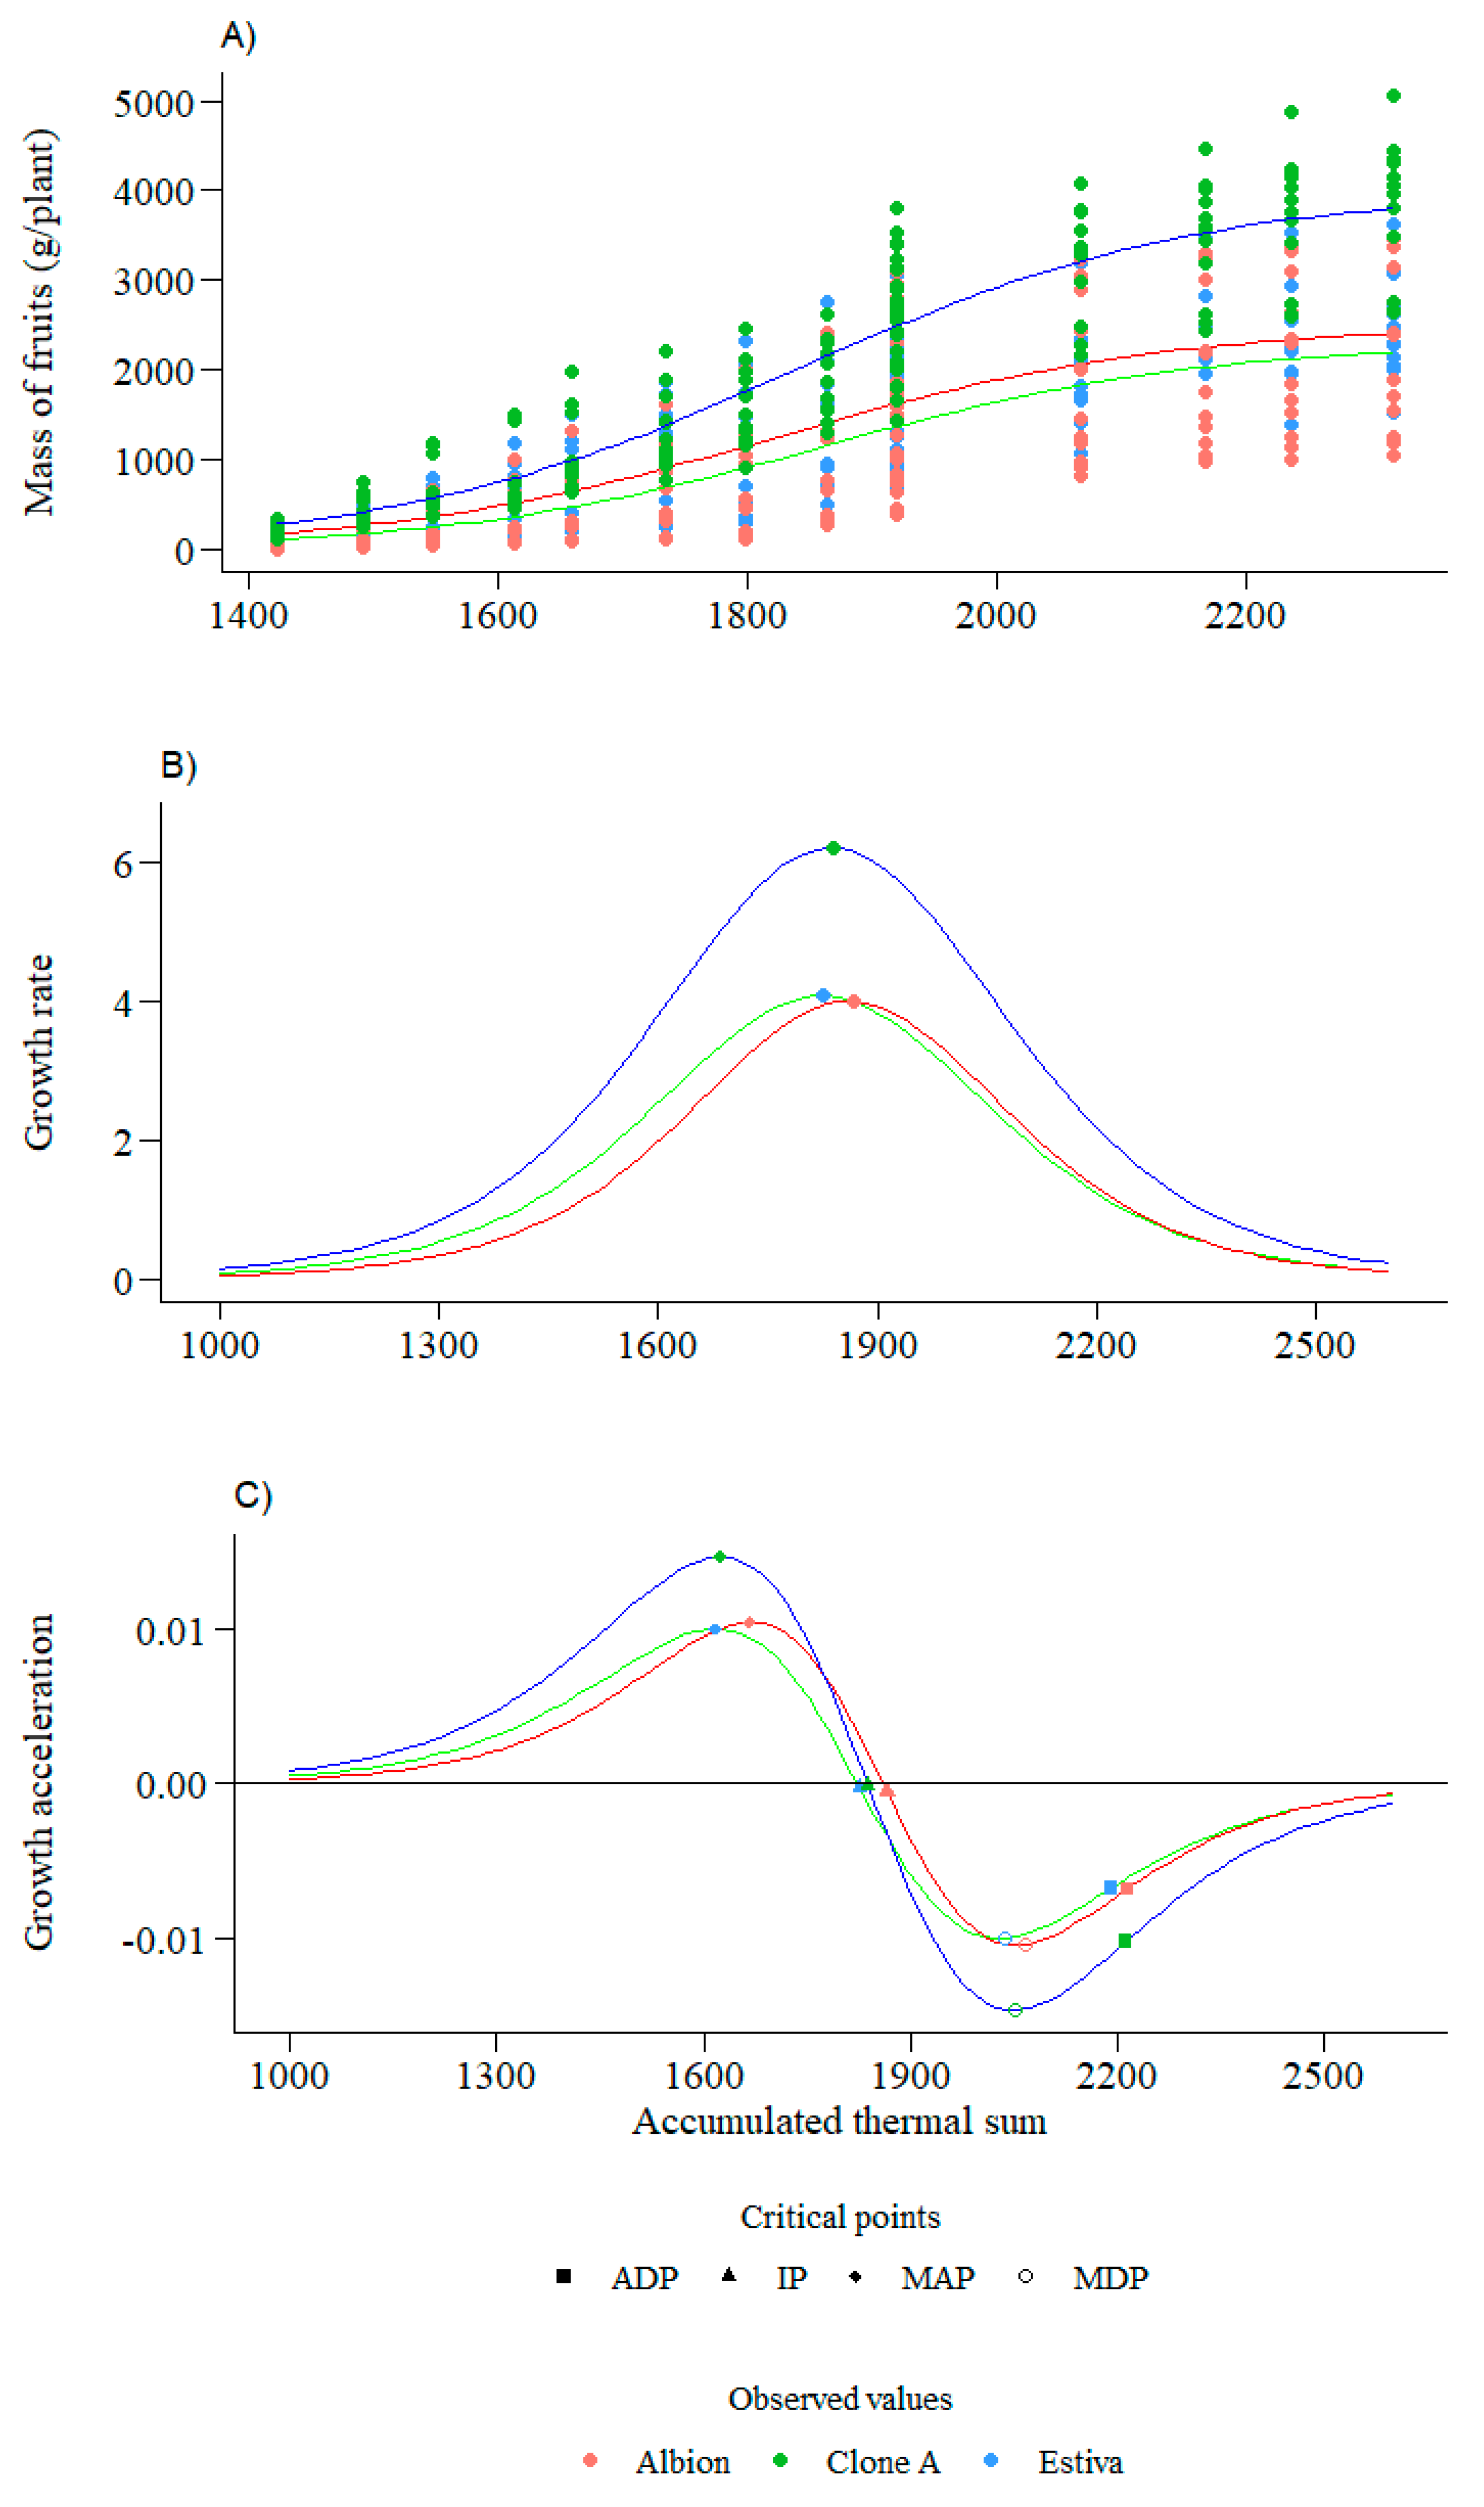
The adjustment of the logistic model for the fruit mass in experiment I revealed high clone productivity, interpreted by the parameter (model asymptote). The clone with the highest production was A, and it differed statistically from the others, reaching a productivity of 2755.0 g plant−1. The other clones also showed high productivity but did not differ statistically from each other, with Albion and Estiva producing 2130 and 2200 g plant−1, respectively (Figure 1 and Figure 2A). The parameter that we can interpret as how early the fruits were produced, as it indicates the rate of fruit maturation at the beginning of the harvest, presented similar values for all clones and did not show significant differences between them (Figure 1 and Figure 2).
The parameter β 3 did not show a significant difference between treatments, and the production rate was basically the same for all treatments (Figure 1 and Figure 2B). Evaluating the critical points of the adjusted logistic model, it was noticed that the point of maximum acceleration (MAP), which indicates the moment when production increases in treatments, differed statistically between treatments, with clone A having maximum increases in production in a shorter period, causing a high production peak in relation to the other ones. Clone A also presented MAP values with larger increments at the beginning of production, while Estiva and Albion did not differ statistically from each other and presented higher MAP values, thus being related to the slow increase in production at the beginning of the harvests (Figure 1 and Figure 2C). The MAP results are confirmed by the inflection point (IP), as clone A reached peak production earlier, at around 1748 °C day−1, while Albion and Estiva took longer to reach peak fruit production, between 2000 and 2100 °C day−1 (Figure 1 and Figure 2C).
This same pattern can be observed at the point of maximum deceleration (MDP), which indicates the end of the period of exponential growth in fruit production. Clone A decreased and ended its production earlier compared to Albion and Estiva, as it started production and reached IP sooner. With this, clone A started production earlier and finished earlier, while Estiva and Albion started production later and finished later. We need to evaluate the concentration of production, which is determined by the difference between the occurrence of the acceleration point (MAP) and maximum deceleration (MDP). It can determine how long the treatments have an exponential growth in production and how long it is concentrated. Thus, this critical point shows small differences between the clones, but they are without significance (Figure 1 and Figure 2C). These inform the farmer which clone is most interesting for production at a given time, whether they want to market earlier to achieve higher prices for the fruit produced and add value or whether they intend to have a production peak later. It also allows the farmer to adjust and plan the harvest based on clones that can be used together and offer fruit production to the consumer market more regularly.
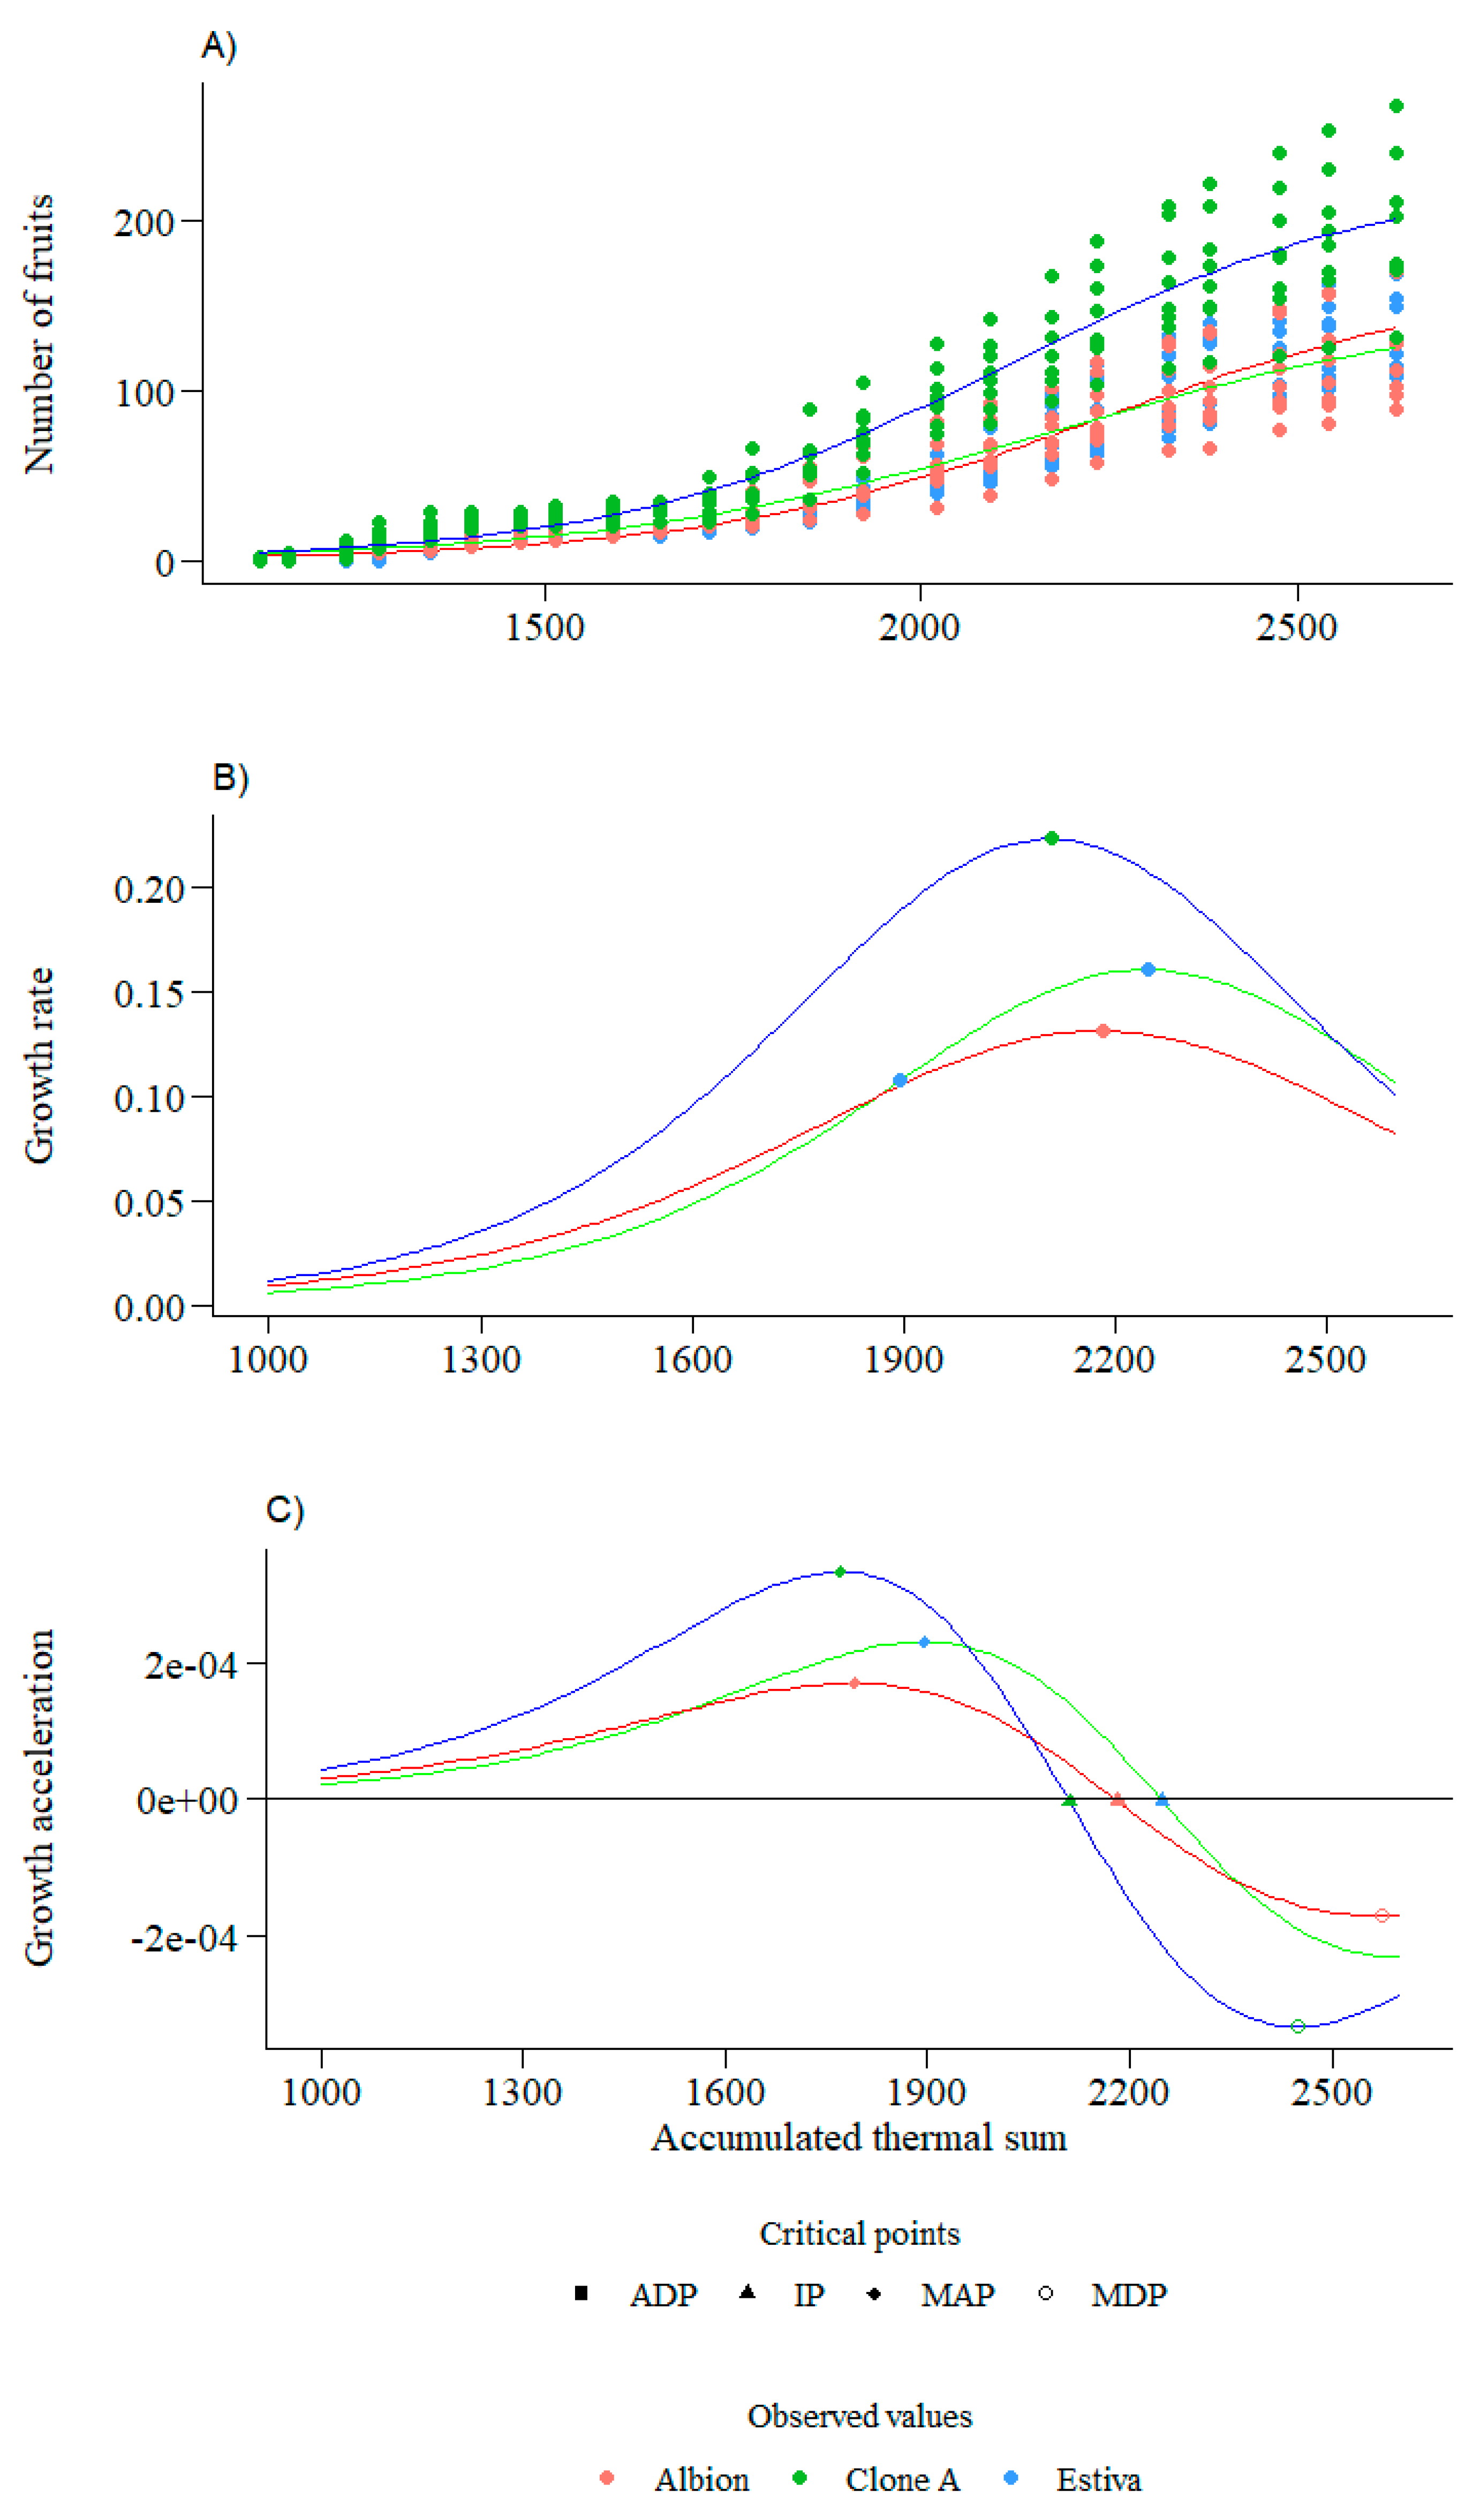
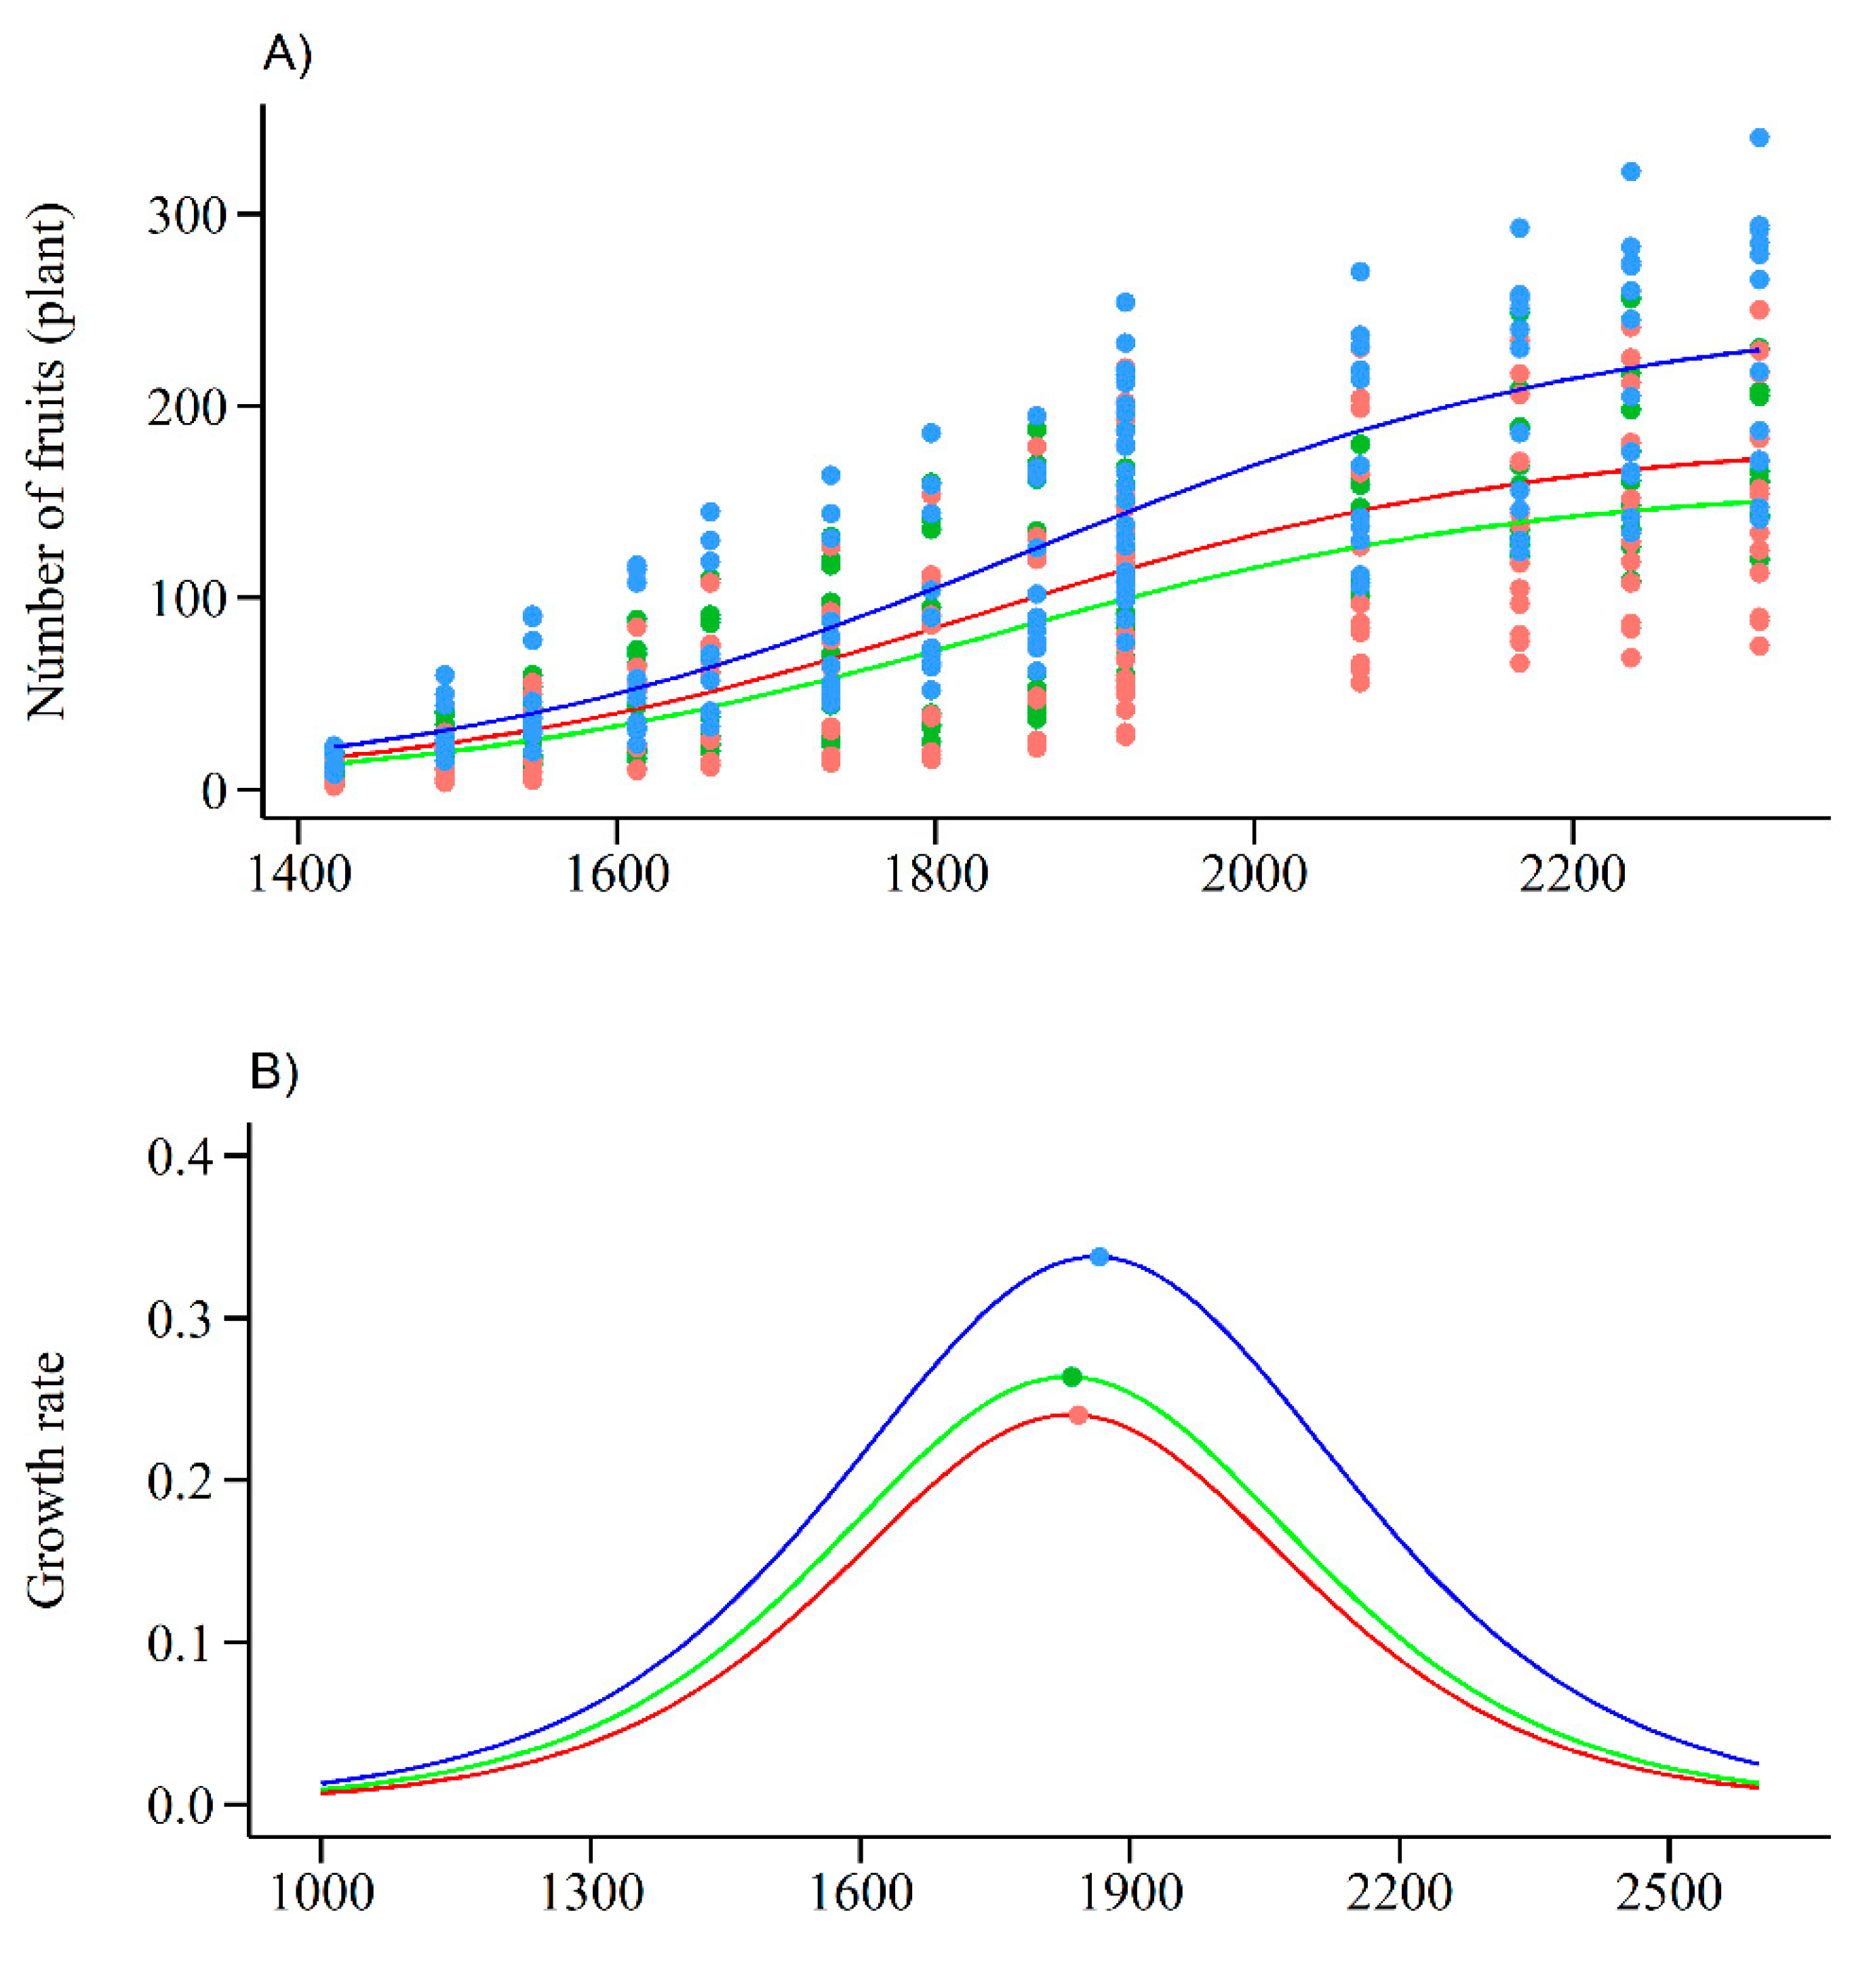
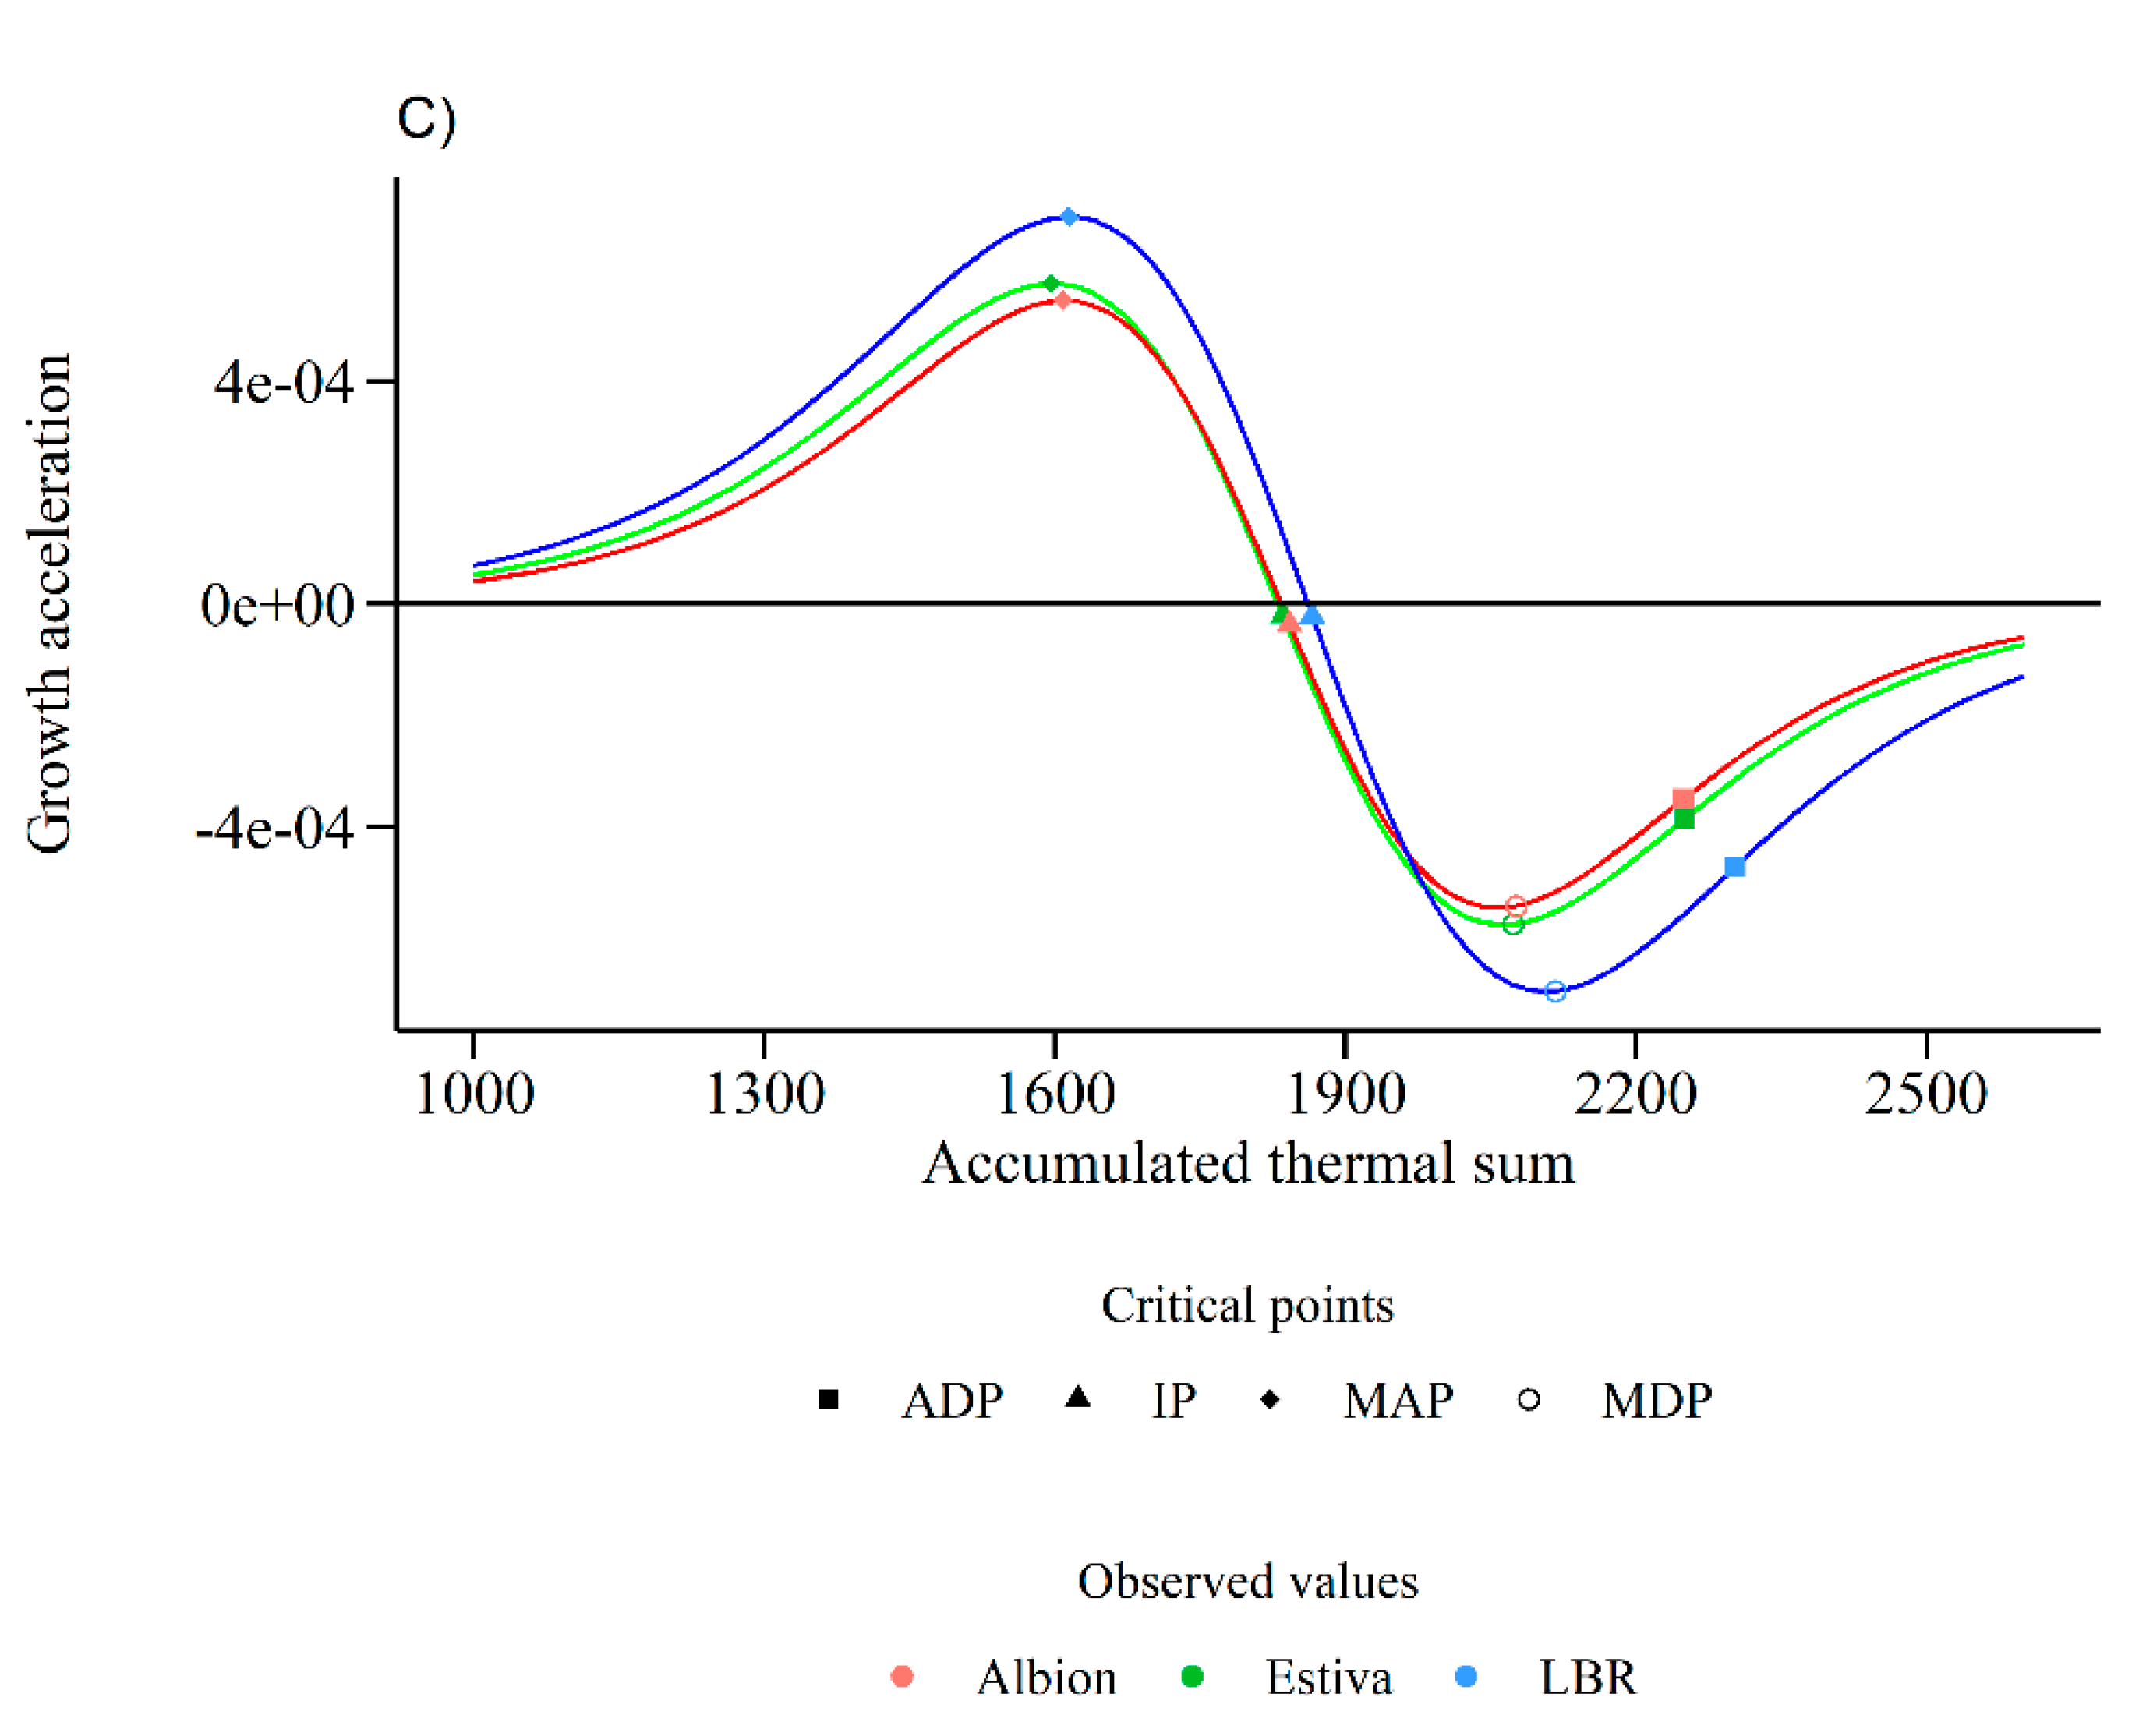
For the number of fruits per plant in experiment I, the parameters of the adjusted logistic model and the critical points of the model, had similar results with fruit mass (Figure 3 and Figure 4A–C) as expected, with some small differences, such as the Albion having lower results than the others. This is because the size of the fruit influences the mass (Figure 3).
The results of experiment II had the adjusted model parameters and their critical points, like those of experiment I, with the clones having the same response; however, they showed greater plant productivity. Clone A, the most productive one, presented the highest asymptote ( β 1 ) of 3994.70 g plant−1, showing a significant difference from Estiva and Albion. These results are like those of experiment I, presenting 2512.45 and 2229.53 g plant−1 for Estiva and Albion, respectively, and showing no significant difference between them (Figure 5 and Figure 6A).
The parameters β 2 e β 3 did not show significant differences among clones (Figure 5 and Figure 6). Evaluating the critical points of the adjusted logistic model, it was noticed that the point of maximum acceleration (MAP) differed statistically between the treatments. Albion had a higher MAP value, thus being related to the slow increase in production at the beginning of the harvests (Figure 5 and Figure 6C), while clone A and Estiva had higher production peaks at the beginning of the harvest, thus being earlier in relation to Albion. The MAP results are confirmed by the inflection point (IP), although they are not statistically significant, but Estiva and clone A reached peak production earlier than Albion (Figure 5 and Figure 6C). The critical points MDP, ADP and concentration did not show significant differences between the clones but followed the same pattern as MAP and IP (Figure 5 and Figure 6C).
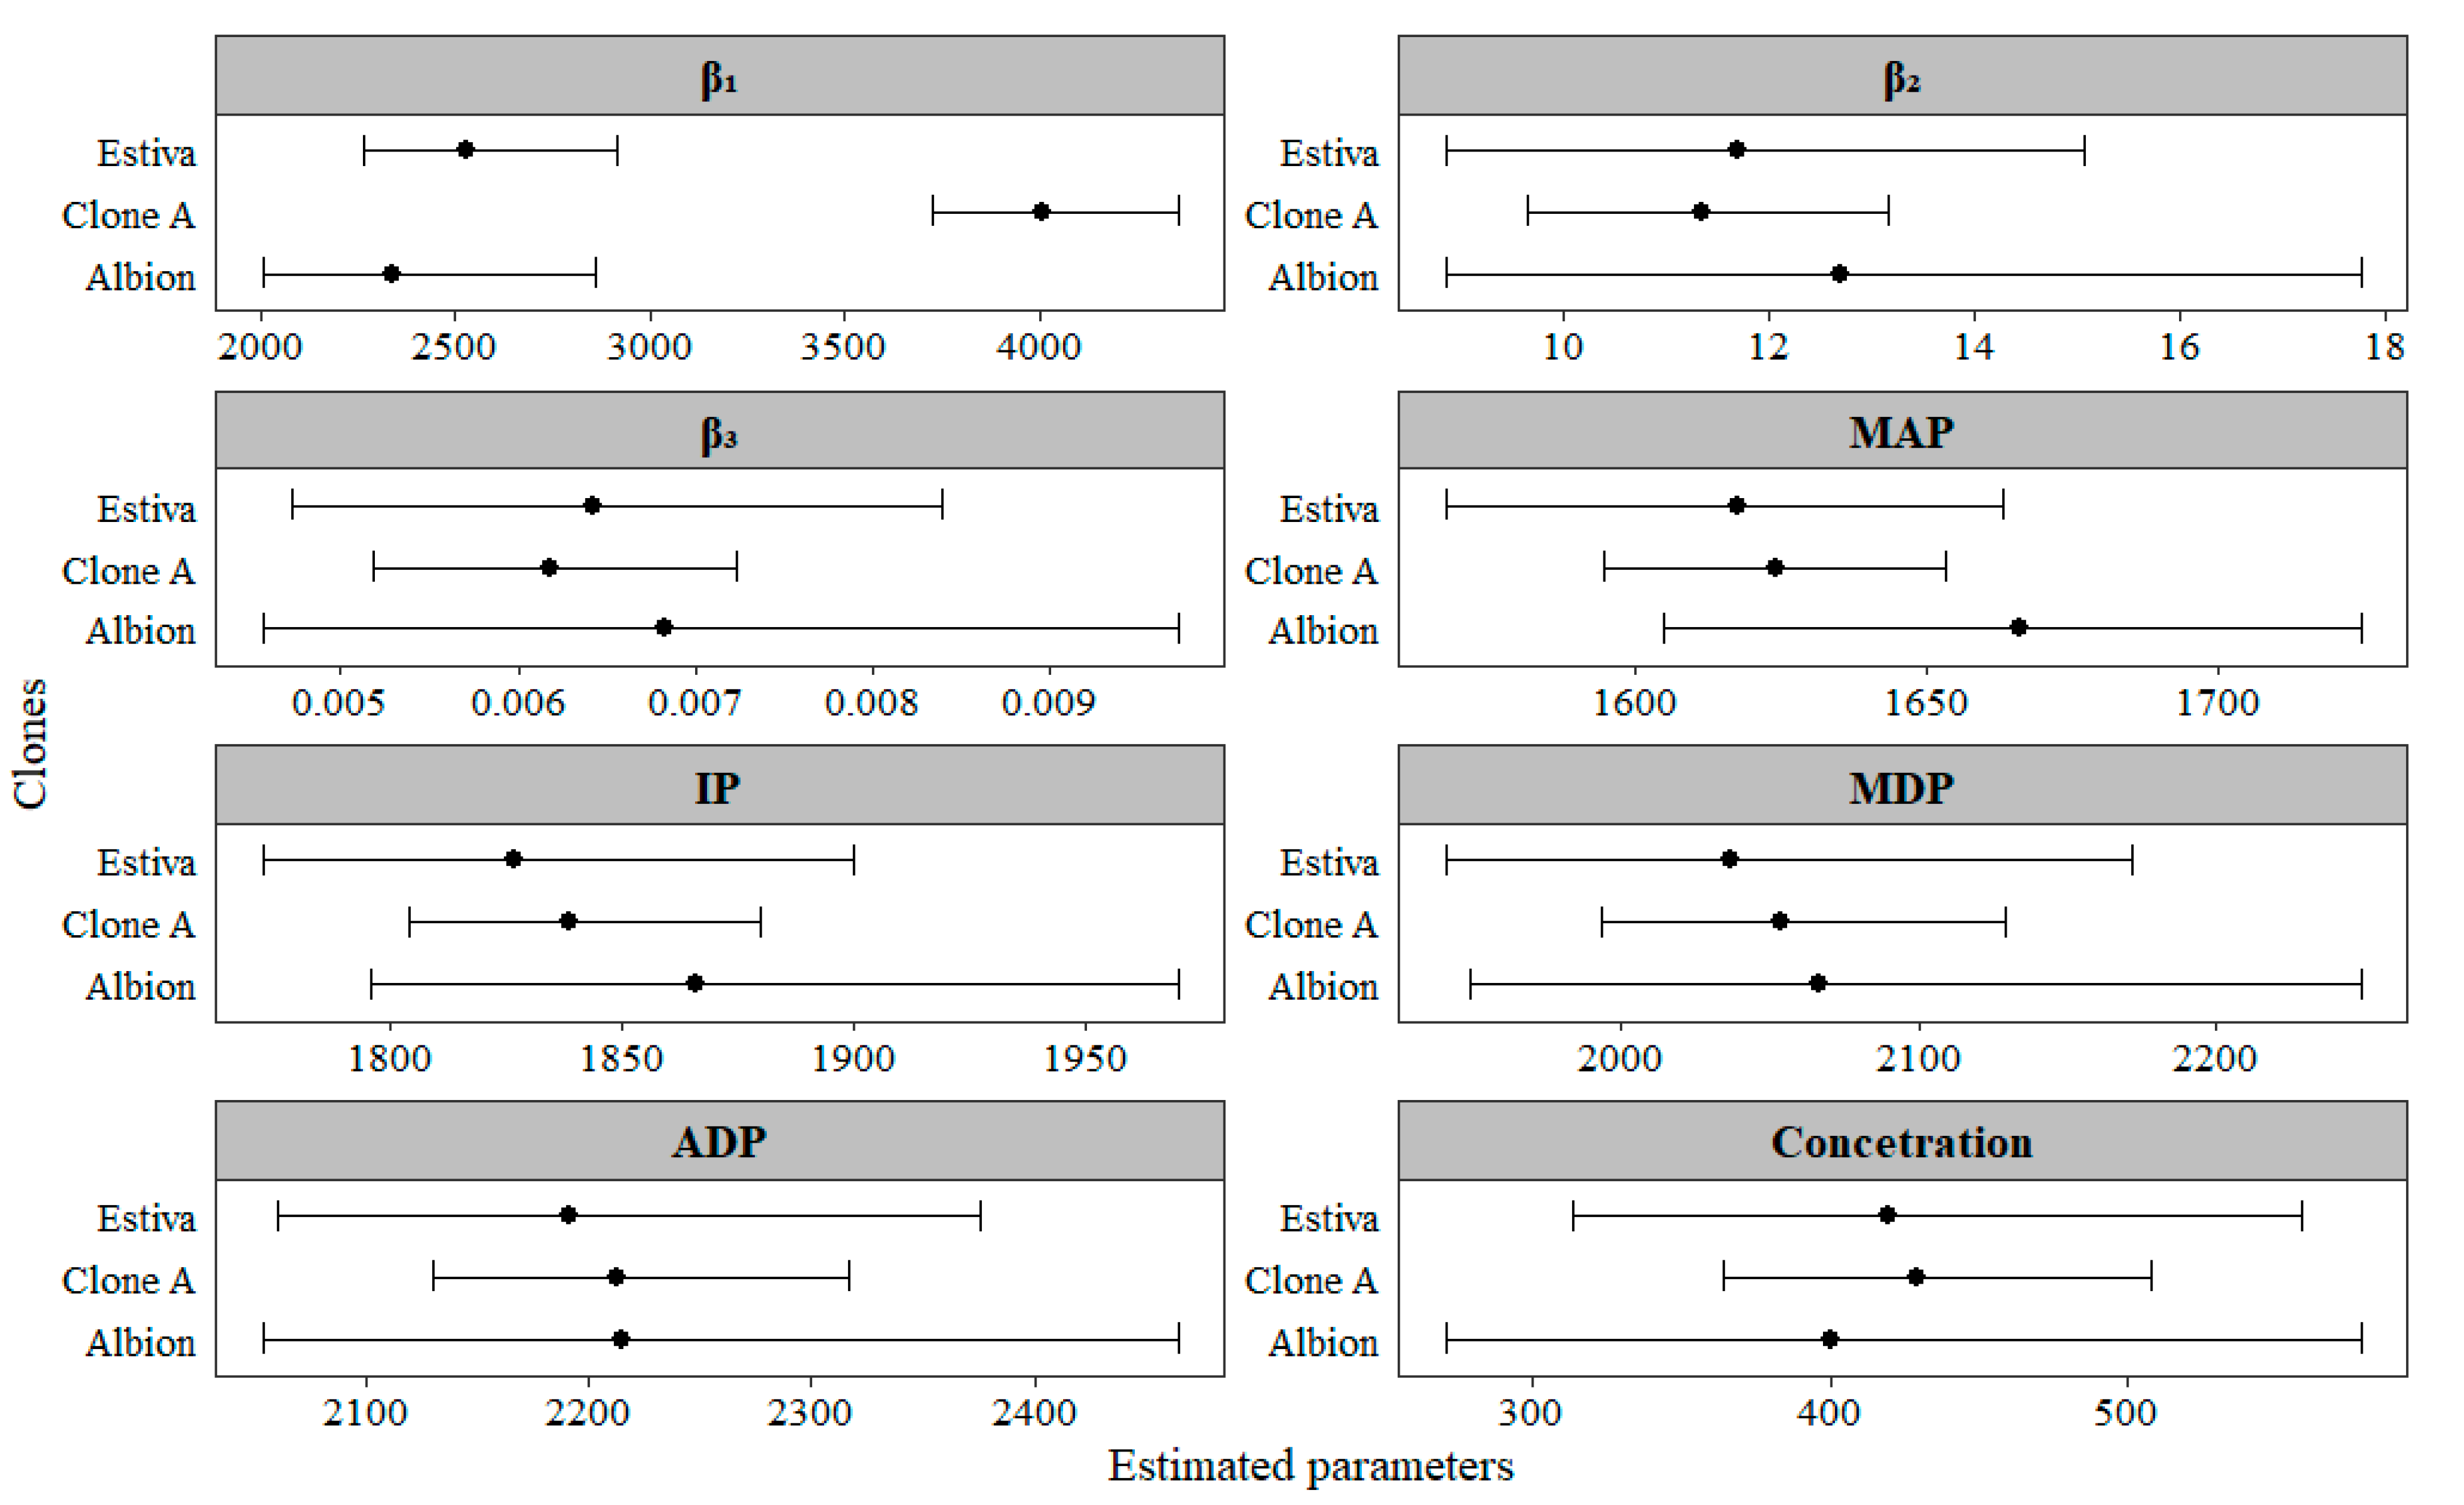
For the number of fruits per plant in experiment II, the parameters of the adjusted logistic model and the critical points of the model had similar results to experiment I as expected, as well as similar results with fruit mass (Figure 7 and Figure 8A–C).

4. Discussion

When fitting a nonlinear growth model, we need to make sure that it meets the model’s assumptions. Normality, heteroscedasticity and autocorrelation of the errors are necessary [33], as they are directly related to the accuracy of the estimates [34]. In this study, the assumptions of normality and heteroscedasticity were violated in both experiments and variables, and the assumption of autocorrelation of errors was violated in experiment II for mass and number of fruits per plant. This problem can and was solved by estimating confidence intervals using bootstrap resampling, as this is a technique that allows the distributional properties of the estimators to be studied [35] and is the most suitable for solving problems where the assumptions of the mathematical model are not met, according to [36].
Other measures of quality of fit need to be assessed before we can confirm that the model can be used for a given crop. These are the intrinsic and parametric nonlinearity measures, which are related to non-biased parameters. In the present work, these measures showed low values, with the ideal for intrinsic nonlinearity being results up to 0.3 and the ideal for parametric nonlinearity being results up to [30,37]. Adjusting growth models for multi-harvest crops provides a broader view of the crop cycle by adjusting just one variable, such as fruit mass, and these inferences would not be possible if this variable was evaluated using mean comparison tests or a linear model, for example [24].
The parameter estimates for fruit mass per plant in experiment I were high. All the clones produced an interesting amount of fruit, exceeding 2000 g plant−1, but the main highlight was clone A, which reached 2700 g plant−1. This productivity is considered high when compared to other experiments, regardless of cultivar. The researchers in [38] evaluated the productive growth of two strawberry cultivars under planting seasons in a subtropical environment and found productivity ranging from 20 to 345.5 g plant−1 for the Yvapitá and Arazá cultivars, respectively. These results were achieved in the same location as the present study, but with other cultivars. In contrast, Ref. [39] evaluated the fruit production of different strawberry cultivars and found yields of up to 500 g plant−1 for the Camarosa cultivar.
Still on the subject of fruit mass in experiment II, Estiva and Albion production were similar to those found in experiment I, but for clone A, the production was much higher in experiment II, reaching 4000 g plant−1. The growing conditions of the experiments evaluated were different, and the high yields achieved in experiment II may be related to the differences in the way the plants were managed, such as the fact that the plastic film was covered with a 50% transmissivity shade screen, providing a milder environment than in experiment I due to less solar radiation passing through, as well as the spacing of the plants, where the plants were arranged with 0.25 × 0.15 m between the plants and the row in experiment I, while in experiment II, it was 0.25 × 0.20 m between the plants and the row. In this sense, we suggest that clone A performed better per plant when its plants had more space for production.
In experiments evaluating plant density on the productive performance of the Camarosa cultivar, Ref. [40] concluded that, among the various strawberry planting densities, the largest spacing tested (50 × 40 cm) was most suitable for improving growth, productivity and fruit quality. According to these authors, the greatest spacing between plants produced the greatest number of fruits per plant, and this decreased with plant space. In plants with wider spacing, the sufficient availability of natural resources, i.e., space, light, humidity and nutrients, results in more carbohydrate reserves and a better number of fruits. In addition, who tested different spacings for the Pircinque cultivar [41], found the highest number of fruits and the highest total production averages per plant at the widest plant spacing (30 cm), but for total productivity considering the number of fruits harvested per unit area, the highest productivity was obtained at the smallest planting spacing (from 5 to 15 cm) and the highest planting densities.
The results for the number of fruits can be interpreted in the same way as for the fruit mass, as clone A showed the highest productivity. Therefore, clone A stands out. The selection of suitable clones is necessary to achieve higher strawberry yields, so the variation in fruit mass is different because the characteristics of each clone are regulated by their common genetic configuration, as well as by their interaction with the environment [42].
The maximum acceleration point (MAP), which tells us which treatment is earlier, showed significant differences between the clones evaluated in both experiments and variables. In experiment I, clone A was earlier than Estiva and Albion, and these results were confirmed by the inflection point (IP). In experiment II, clone A and Estiva were earlier than Albion, and these results are explained by the genetic characteristics of each clone [43]. As an octaploid species, strawberry clones have high genetic variability due to the greater possibility of different gene combinations [43]. It should be noted that these results cannot be related to photoperiodic response, as the three clones are neutral to photoperiod.
Day-neutral strawberry clones do not respond to photoperiod [44], and the regulation of the phenological and production cycle is regulated exclusively by temperature; they can produce under the condition of long days when temperatures are not too high [45]. This characteristic of the clones evaluated in this study may have contributed to them achieving high productivity and not decreasing production when the days began to lengthen, remaining longer-producing, as we can see in the results of the critical points (Figure 2, Figure 4, Figure 6 and Figure 8).
The cycle of the clones evaluated in this study basically followed the same behavior at both experimental sites, which is mainly because these experiments are located close to each other, i.e., the same amount of solar radiation and temperature. The growing substrate was different in the experiments, but this factor did not seem to limit or improve the productive characteristics of the clones, since the nutritional demand was supplied via fertigation.
From a production point of view, the concentration of harvests is important for defining the time when the fruit will be available for the consumer market and in what quantities. This is because we can have a clone with high yields but low concentration of production, causing the producer to have a period with a lot of fruit. It is also possible for a clone to produce with fewer increments over time, which will mean that the concentration of production is longer and the producer will have a longer supply of fruit on the market, keeping up with changing prices, for example. For all the clones evaluated in this study, the concentration of harvests did not differ because, as discussed above, they are indifferent to photoperiod and continued their production even on longer days, which was confirmed by the maximum deceleration points (MDPs) and asymptotic deceleration point (ADP).

5. Conclusions

The nonlinear logistic models adjusted for mass and number of fruits worked well to differentiate the strawberry clones along with the production season in a high-yield condition.
The adjusted logistic model expanded the inferences about the clone cycle, making it possible to understand productive behavior using the production variables and accumulated thermal sum.

Author Contributions

Conceptualization, D.A.B. and A.D.C.L.; methodology, M.I.D., D.A.B. and A.D.C.L.; software, M.I.D. and A.D.C.L.; validation, A.D.C.L. and D.A.B.; formal analysis, M.I.D. and A.D.C.L.; investigation, G.d.A.L. and V.J.d.S.; resources, G.d.A.L. and V.J.d.S.; data curation, G.d.A.L. and V.J.d.S.; writing—original draft preparation, M.I.D. and A.D.C.L.; writing—review and editing, M.I.D., A.D.C.L. and D.A.B. All authors have read and agreed to the published version of the manuscript.

Funding

This research was funded by CAPES—Brazil, process PROEX/88881.844984/2023-01.

Data Availability Statement

The raw data supporting the conclusions of this article will be made available by the authors on request.

Conflicts of Interest

The authors declare no conflict of interest.

References

  1. Whitaker, V.M.; Knapp, S.J.; Hardigan, M.A.; Edger, P.P.; Slovin, J.P.; Bassil, N.V.; Hytönen, T.; Mackenzie, K.K.; Lee, S.; Jung, S.; et al. A Roadmap for Research in Octoploid Strawberry. Hortic. Res. 2020, 7, 1–17. [Google Scholar] [CrossRef]
  2. Negi, Y.K.; Sajwan, P.; Uniyal, S.; Mishra, A.C. Enhancement in Yield and Nutritive Qualities of Strawberry Fruits by the Application of Organic Manures and Biofertilizers. Sci. Hortic. 2021, 283, 110038. [Google Scholar] [CrossRef]
  3. Ameri, A.; Tehranifar, A.; Davarynejad, G.; Shoor, M. Flowering Times and Some Growth Indicators of Strawberry Were Affected by Physical Properties of the Growing Media. Sci. Hortic. 2020, 272, 109601. [Google Scholar] [CrossRef]
  4. Liston, A.; Cronn, R.; Ashman, T.L. Fragaria: A Genus with Deep Historical Roots and Ripe for Evolutionary and Ecological Insights. Am. J. Bot. 2014, 101, 1686–1699. [Google Scholar] [CrossRef] [PubMed]
  5. Faostat FAO: Food and Agriculture Organization of the United Nations Statistics Division. Available online: http://www.fao.org/faostat/en/#data/QC (accessed on 15 July 2024).
  6. Zeist, A.R.; Resende, J.T.V. de Strawberry Breeding in Brazil: Current Momentum and Perspectives. Hortic. Bras. 2019, 37, 7–16. [Google Scholar] [CrossRef]
  7. Barth, E.; de Resende, J.T.V.; Mariguele, K.H.; de Resende, M.D.V.; da Silva, A.L.B.R.; Ru, S. Multivariate Analysis Methods Improve the Selection of Strawberry Genotypes with Low Cold Requirement. Sci. Rep. 2022, 12, 11458. [Google Scholar] [CrossRef]
  8. Alves, M.C.; Matoso, E.S.; Peil, R.M. What Is the Profile of Strawberry Producers in the South Brazilian Region and What Do They Think about Substrate Cultivation? Hortic. Bras. 2020, 38, 428–433. [Google Scholar] [CrossRef]
  9. Gonçalves, M.A.; Vignolo, G.K.; Antunes, L.E.C.; Reisser Junior, C. Produção de Morango Fora Do Solo; Embrapa Cl.: Pelotas, Brazil, 2016. [Google Scholar]
  10. Antunes, L.E.C.; Peres, N.A. Strawberry Production in Brazil and South America. Int. J. Fruit Sci. 2013, 13, 156–161. [Google Scholar] [CrossRef]
  11. Lin, Y.; Hou, G.; Jiang, Y.; Liu, X.; Yang, M.; Wang, L.; Long, Y.; Li, M.; Zhang, Y.; Wang, Y.; et al. Joint Transcriptomic and Metabolomic Analysis Reveals Differential Flavonoid Biosynthesis in a High-Flavonoid Strawberry Mutant. Front. Plant Sci. 2022, 13, e-919619. [Google Scholar] [CrossRef]
  12. Claire, D.; Watters, N.; Gendron, L.; Boily, C.; Pépin, S.; Caron, J. High Productivity of Soilless Strawberry Cultivation under Rain Shelters. Sci. Hortic. 2018, 232, 127–138. [Google Scholar] [CrossRef]
  13. Singh, A.; Syndor, A.; Deka, B.C.; Singh, R.K.; Patel, R.K. The Effect of Microclimate inside Low Tunnels on Off-Season Production of Strawberry (Fragaria × Ananassa Duch.). Sci. Hortic. 2012, 144, 36–41. [Google Scholar] [CrossRef]
  14. Diel, M.I.; Pinheiro, M.V.M.; Cocco, C.; Fontana, D.C.; Caron, B.O.; de Paula, G.M.; Pretto, M.M.; Thiesen, L.A.; Schmidt, D. Phyllochron and Phenology of Strawberry Cultivars from Different Origins Cultivated in Organic Substracts. Sci. Hortic. 2017, 220, 226–232. [Google Scholar] [CrossRef]
  15. Antunes, L.E.C.; Bonow, P.; de Lima, R.H.; Costa, H.; Paulus, G.; Ries, J. Morango: Produção Aumenta Ano a Ano. Campo Negócio-Anuário HF 2021, 1, 88–92. [Google Scholar]
  16. Fagherazzi, A.F.; Suek Zanin, D.; Soares Dos Santos, M.F.; Martins de Lima, J.; Welter, P.D.; Francis Richter, A.; Regianini Nerbass, F.; Anneliese Kretzschmar, A.; Rufato, L.; Baruzzi, G. Initial Crown Diameter Influences on the Fruit Yield and Quality of Strawberry Pircinque. Agronomy 2021, 11, 184. [Google Scholar] [CrossRef]
  17. Schiavon, A.V.; Becker, T.B.; Delazeri, E.E.; Vignolo, G.K.; Mello-Farias, P.; Antunes, L.E.C. Production and Quality of Strawberry Plants Produced from Different Nutrient Solutions in Soilless Cultivation. Rev. Ceres 2022, 69, 348–357. [Google Scholar] [CrossRef]
  18. Bisognin, D.A.; Pivetta, C.R.; Janisch, D.I.; Fischer, H.; Dalpicio, M. Método de Propagação de Plantas. Rev. Propr. Ind. 2019, 2511, 644–690. [Google Scholar]
  19. Lúcio, A.D.; Sari, B.G.; Rodrigues, M.; Bevilaqua, L.M.; Voss, H.M.G.; Copetti, D.; Faé, M. Modelos Não-Lineares Para a Estimativa Da Produção de Tomate Do Tipo Cereja. Ciênc. Rural 2015, 46, 233–241. [Google Scholar] [CrossRef]
  20. Lucio, A.D.; Nunes, L.F.; Rego, F. Nonlinear Regression and Plot Size to Estimate Green Beans Production. Hortic. Bras. 2016, 34, 507–513. [Google Scholar] [CrossRef]
  21. Diel, M.I.; Sari, B.G.; Krysczun, D.K.; Vinícius, M.; Pinheiro, M.; Meira, D.; Schmidt, D.; Dal, A.; Lúcio, C.; Vinícius, M.; et al. Nonlinear Regression for Description of Strawberry (Fragaria × Ananassa) Production. J. Hortic. Sci. Biotechnol. 2019, 94, 259–273. [Google Scholar] [CrossRef]
  22. Diel, M.I.; Lúcio, A.D.; Sari, B.G.; Olivoto, T.; Pinheiro, M.V.M.; Krysczum, D.K.; De Melo, P.J.; Schmidt, D. Behavior of Strawberry Production with Growth Models: A Multivariate Approach. Acta Sci. Agron. 2020, 43, e47812. [Google Scholar] [CrossRef]
  23. Mischan, M.M.; de Pinho, S.Z.; de Carvalho, L.R. Determination of a Point Sufficiently Close to the Asymptote in Nonlinear Growth Functions. Sci. Agric. 2011, 68, 109–114. [Google Scholar] [CrossRef]
  24. Diel, M.I.; Lúcio, A.D.; Schmidt, D.; de Lima Tartaglia, F.; Tischler, A.L.; Lambrecht, D.M. Using Nonlinear Models to Define Production, Production Rate, and Precocity of Strawberry Cultivars. Rev. Ceres 2022, 69, 55–61. [Google Scholar] [CrossRef]
  25. Sari, B.G.; Lúcio, A.D.; Santana, C.S.; Savian, T.V. Describing Tomato Plant Production Using Growth Models. Sci. Hortic. 2019, 246, 146–154. [Google Scholar] [CrossRef]
  26. Sari, B.G.; Lúcio, A.D.; Souza Santana, C.; Olivoto, T.; Diel, M.I.; Krysczun, D.K. Nonlinear Growth Models: An Alternative to ANOVA in Tomato Trials Evaluation. Eur. J. Agron. 2019, 104, 21–36. [Google Scholar] [CrossRef]
  27. Alvares, C.A.; Stape, J.L.; Sentelhas, P.C.; De Moraes Gonçalves, J.L.; Sparovek, G. Koppen’s Climate Classification Map for Brazil. Meteorol. Z. 2013, 22, 711–728. [Google Scholar] [CrossRef]
  28. Burin, C.; Antônio Bisognin, D.; Haygert Lencina, K.; Salvatierra Gimenes, E. Early Selection of Cabralea Canjerana for Propagation by Mini-Cutting. Pesqui. Agropecu. Bras. 2018, 53, 1018–1024. [Google Scholar] [CrossRef]
  29. Rosa, H.T.; Walter, L.C.; Streck, N.A.; Andriolo, J.L.; da Silva, M.R.; Langner, J.A. Base Temperature for Leaf Appearance and Phyllochron of Selected Strawberry Cultivars in a Subtropical Environment. Bragantia 2011, 70, 939–945. [Google Scholar] [CrossRef]
  30. Bates, D.M.; Watts, D.G. Nonlinear Regression Analysis and Its Applications, 2nd ed.; John Wiley & Sons, Inc.: New York, NY, USA, 1988; Volume 85, ISBN 9780470316757. [Google Scholar]
  31. Sari, B.G.; Olivoto, T.; Diel, M.I.; Krysczun, D.K.; Lúcio, A.D. Nonlinear Modeling for Analyzing Data from Multiple Harvest Crops. Agron. J. 2018, 110, 2331–2342. [Google Scholar] [CrossRef]
  32. R Core Team. R: A Language and Environment for Statistical Computing; R Foundation for Statistical Computing: Vienna, Austria, 2024. [Google Scholar]
  33. Casella, G. Statistical Design, 1st ed.; Springer: New York, NY, USA, 2008. [Google Scholar]
  34. Muniz, J.A.; Nascimento, M.D.S.; Fernandes, T.J.; Muniz, J.A.; Nascimento, M.D.S.; Fernandes, T.J. Nonlinear Models for Description of Cacao Fruit Growth with Assumption Violations. Rev. Caatinga 2017, 30, 250–257. [Google Scholar] [CrossRef]
  35. Souza, E.M.; Muniz, J.A.; Marchi, G.; Guilherme, L.R.G. Modelagem Não Linear Da Extração de Zinco de Um Solo Tratado Com Lodo de Esgoto. Acta Sci.—Technol. 2010, 32, 193–199. [Google Scholar] [CrossRef]
  36. Ratkowski, D. Nonlinear Regression Modeling; M. Dekker: New York, NY, USA, 1983; 276p. [Google Scholar]
  37. Seber, G.A.F.; Wild, C.J. Nonlinear Regression; Sons, J.W.: Hoboken, NJ, USA, 2003. [Google Scholar]
  38. Rosa, H.T.; Streck, N.A.; Walter, L.C.; Andriolo, J.L.; da Silva, M.R. Crescimento Vegetativo e Produtivo de Duas Cultivares de Morango Sob Épocas de Plantio Em Ambiente Subtropical. Rev. Cienc. Agron. 2013, 44, 604–613. [Google Scholar] [CrossRef]
  39. Conti, J.H.; Minami, K.; Tavares, F.C.A. Produção e Qualidade de Frutos de Diferentes Cultivares de Morangueiro Em Ensaios Conduzidos Em Atibaia e Piracicaba. Hortic. Bras. 2002, 20, 10–17. [Google Scholar] [CrossRef]
  40. Hazarika, T.K.; Lalrinfeli, L.; Lalthlamuani, L.; Lalchhanmawia, J.; Nautiyal, B.P. Effect of Planting Density on Growth, Yield and Quality of Strawberry (Fragaria × Ananassa) Cv. Camarosa. Indian J. Agric. Sci. 2019, 89, 489–493. [Google Scholar] [CrossRef]
  41. de Lima, J.M.; Welter, P.D.; Dos Santos, M.F.S.; Kavcic, W.; Costa, B.M.; Fagherazzi, A.F.; Nerbass, F.R.; Kretzschmar, A.A.; Rufato, L.; Baruzzi, G. Planting Density Interferes with Strawberry Production Efficiency in Southern Brazil. Agronomy 2021, 11, 408. [Google Scholar] [CrossRef]
  42. Rahman, M.M.; Rahman, M.M.; Hossain, M.M.; Khaliq, Q.A.; Moniruzzaman, M. Effect of Planting Time and Genotypes Growth, Yield and Quality of Strawberry (Fragaria × ananassa Duch.). Sci. Hortic. 2014, 167, 56–62. [Google Scholar] [CrossRef]
  43. Moreira, A.F.P.; de Resende, J.T.V.; Shimizu, G.D.; Hata, F.T.; do Nascimento, D.; Oliveira, L.V.B.; Zanin, D.S.; Mariguele, K.H. Characterization of Strawberry Genotypes with Low Chilling Requirement for Cultivation in Tropical Regions. Sci. Hortic. 2022, 292, 110629. [Google Scholar] [CrossRef]
  44. Hancock, J. Strawberries; Springer: Wallingford, CT, USA, 1999. [Google Scholar]
  45. Durner, E.F. Photoperiod Affects Floral Ontogeny in Strawberry (Fragaria × ananassa Duch.) Plug Plants. Sci. Hortic. 2015, 194, 154–159. [Google Scholar] [CrossRef]
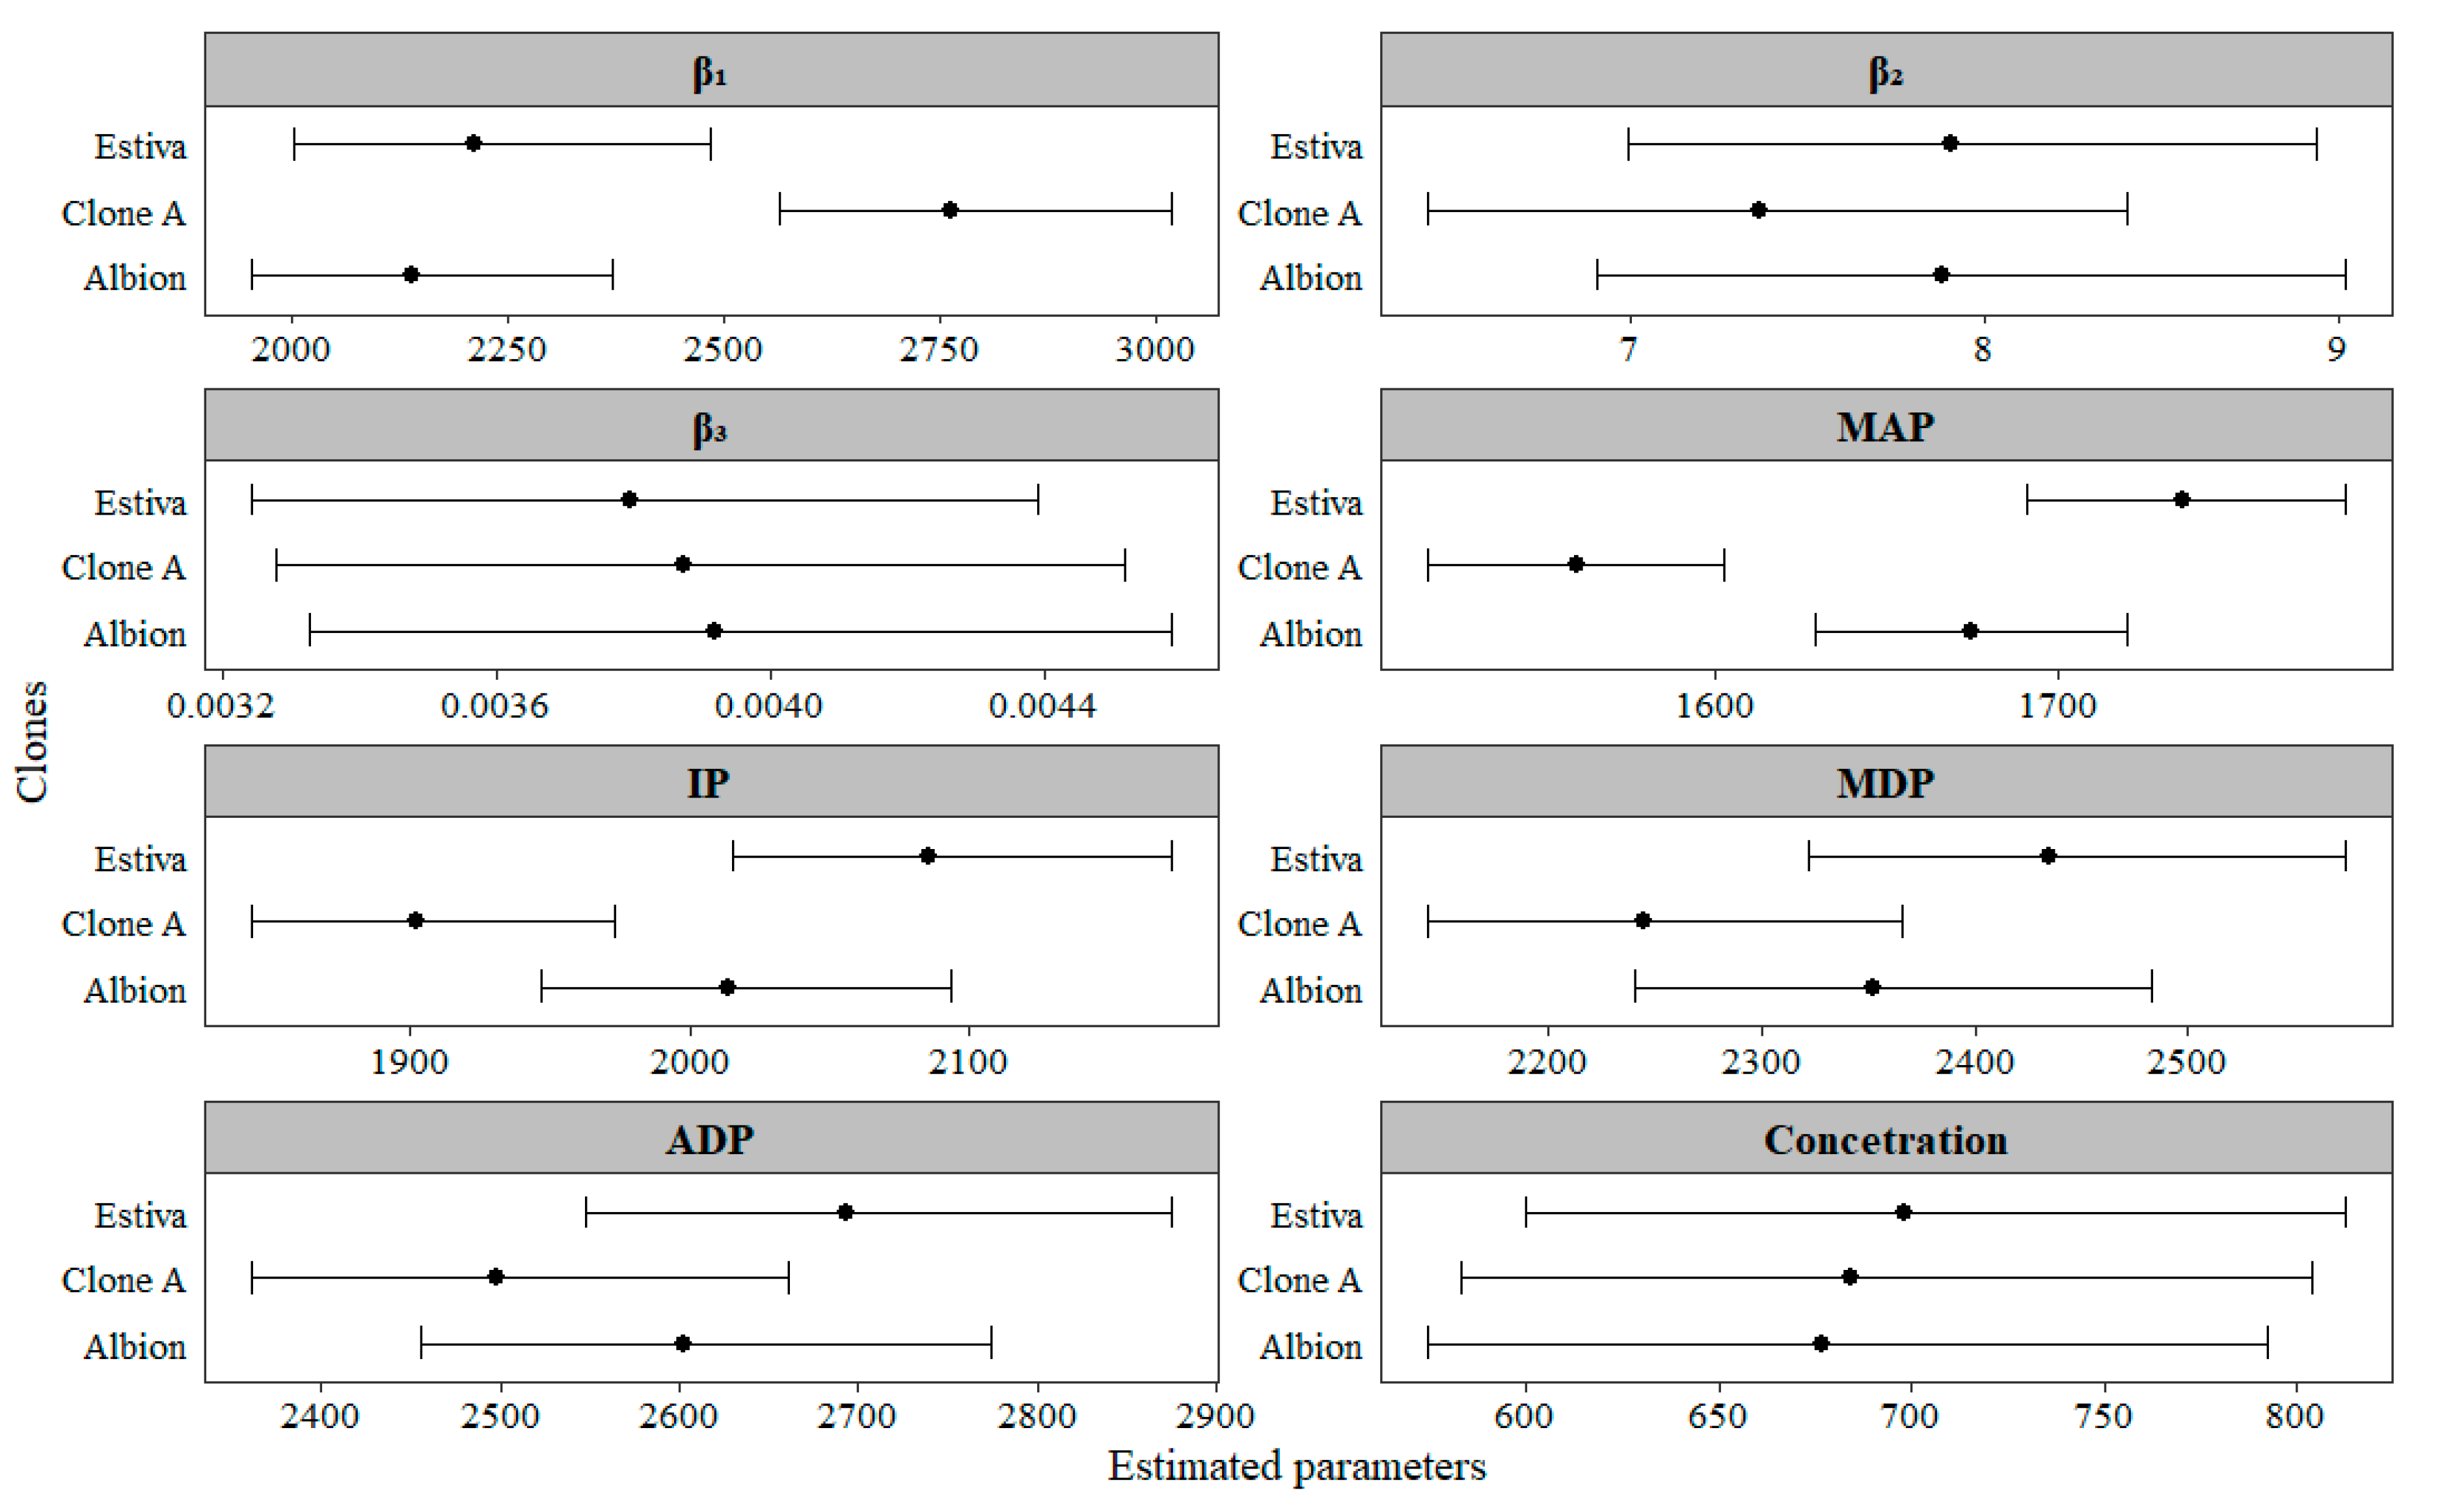
Figure 1. Confidence intervals of the parameters and critical points of the nonlinear logistic model estimated via bootstrap for mass of strawberry fruits as a function of the accumulated thermal sum in experiment I. β 1 (represents production), β 2 (represents the earliness of production), β 3 (represents the fruit production rate), MAP (maximum acceleration point), IP (inflection point), MDP (maximum deceleration point), ADP (asymptotic deceleration point) and MDP-MAP (concentration).
Agronomy 14 01884 g001
Figure 2. Logistic model adjusted for strawberry fruit mass (A), fruit production rate (B) and critical points of the adjusted model (PI: inflection point, MAP: maximum acceleration point, ADP: asymptotic deceleration point, MDP: maximum deceleration point) (C) in experiment I.
Agronomy 14 01884 g002
Figure 3. Confidence intervals of the parameters and critical points of the nonlinear logistic model estimated via bootstrap for the number of strawberry fruits as a function of the accumulated thermal sum, in experiment I. β 1 (represents production), β 2 (represents the earliness of production), β 3 (represents the fruit production rate), MAP (maximum acceleration point), IP (inflection point), MDP (maximum deceleration point), ADP (asymptotic deceleration point) and MDP-MAP (concentration).
Agronomy 14 01884 g003
Figure 4. Logistic model adjusted for number of strawberry fruits (A), fruit production rate (B) and critical points of the adjusted model (PI: inflection point, MAP: maximum acceleration point, ADP: asymptotic deceleration point, MDP: maximum deceleration point) (C) in experiment I.
Agronomy 14 01884 g004
Figure 5. Confidence intervals of the parameters and critical points of the nonlinear logistic model estimated via bootstrap for fruit mass of strawberry as a function of the accumulated thermal sum, in experiment II. β 1 (represents production), β 2 (represents the earliness of production), β 3 (represents the fruit production rate), MAP (maximum acceleration point), IP (inflection point), MDP (maximum deceleration point), ADP (asymptotic deceleration point) and MDP-MAP (concentration).
Agronomy 14 01884 g005
Figure 6. Logistic model adjusted for fruit mass of strawberry (A), fruit production rate (B) and critical points of the adjusted model (PI: inflection point, MAP: maximum acceleration point, ADP: asymptotic deceleration point, MDP: maximum deceleration point) (C) in experiment II.
Agronomy 14 01884 g006
Figure 7. Confidence intervals of the parameters and critical points of the nonlinear logistic model estimated via bootstrap for the number of strawberry fruits as a function of the accumulated thermal sum in experiment II. β 1 (represents production), β 2 (represents the earliness of production), β 3 (represents the fruit production rate), MAP (maximum acceleration point), IP (inflection point), MDP (maximum deceleration point), ADP (asymptotic deceleration point) and MDP-MAP (concentration).
Agronomy 14 01884 g007
Figure 8. Logistic model adjusted for number of strawberry fruits (A), fruit production rate (B) and critical points of the adjusted model (PI: inflection point, MAP: maximum acceleration point, ADP: asymptotic deceleration point, MDP: maximum deceleration point) (C) in experiment II.
Agronomy 14 01884 g008aAgronomy 14 01884 g008b
Table 1. p-value for tests of normality (SW), homogeneity (BP) and independence (DW) of residuals, estimates of intrinsic (ci) and parametric (cθ) nonlinearity and adjusted coefficient of determination (R2aj) for the adjusted logistic model for mass and number of strawberry fruits in two growth conditions.
Experiment I
ClonesSWBPDWcicθR2aj
Mass of fruit Estiva5.03 × 10−62.10 × 10−150.450.080.860.91
Albion6.02 × 10−71.22 × 10−170.570.090.770.89
A2.41 × 10−41.48 × 10−110.430.090.630.88
Experiment II
Estiva0.002529.33 × 10−600.140.830.69
Albion0.000539.35 × 10−1000.201.140.58
A0.064731.87 × 10−600.080.540.85
Experiment I
Number of fruits Estiva3.66 × 10−54.00 × 10−220.750.081.190.93
Albion1.48 × 10−71.75 × 10−160.980.091.40.88
A9.23 × 10−89.79 × 10−130.090.080.820.92
Experiment II
Estiva2.54 × 10−45.50 × 10−800.141.110.65
Albion8.56 × 10−41.80 × 10−900.181.370.53
A8.13 × 10−42.74 × 10−900.121.140.70
Disclaimer/Publisher’s Note: The statements, opinions and data contained in all publications are solely those of the individual author(s) and contributor(s) and not of MDPI and/or the editor(s). MDPI and/or the editor(s) disclaim responsibility for any injury to people or property resulting from any ideas, methods, instructions or products referred to in the content.