Article

Metabolomic and Transcriptomic Analyses Provide New Insights into Health-Promoting Metabolites from Cannabis Seeds Growing in the Bama Region of China

1
State Key Laboratory for Conservation and Utilization of Subtropical Agro-Bioresources, College of Agriculture, Guangxi University, Nanning 530004, China
2
College of Agronomy and Life Sciences, Zhaotong University, Zhaotong 657000, China
3
Key Laboratory of Horticultural Plant Biology (Ministry of Education), Key Laboratory of Biology and Genetic Improvement of Horticultural Crops (Ministry of Agriculture), Huazhong Agricultural University, Wuhan 430070, China
4
Shenzhen Branch, Guangdong Laboratory for Lingnan Modern Agriculture, Key Laboratory of Synthetic Biology, Ministry of Agriculture and Rural Affairs, Agricultural Genomics Institute at Shenzhen, Chinese Academy of Agricultural Sciences, Shenzhen 518116, China
*
Author to whom correspondence should be addressed.
These authors contributed equally to this work.
Agronomy 2024, 14(4), 787; https://doi.org/10.3390/agronomy14040787
Submission received: 23 February 2024 / Revised: 31 March 2024 / Accepted: 4 April 2024 / Published: 10 April 2024
(This article belongs to the Special Issue Small Fruit Physiology, Production Systems and Management)

Abstract

:
Hemp seeds are consumed in “Bama longevity villages” in China and are believed to contribute to the locals’ longevity. However, the molecular breeding of hemp seeds is limited due to our lack of understanding of molecular regulation and metabolite accumulation at different maturity stages. Here, we conducted metabolomic and transcriptomic analyses of hemp seeds from the Bama region at four maturity stages (S1 to S4). In total, 1231 metabolites of 11 classes were detected in hemp seeds from S1–S4, including 233 flavonoids, 214 phenolic acids, 159 lipids, 118 amino acids and derivatives, 100 alkaloids, 100 organic acids, 71 nucleotides and derivatives, 43 lignans and coumarins, 14 terpenoids, 13 tannins, and 166 others. The metabolomic analysis of hemp seeds (from the Bama region) revealed a higher number of flavonoid metabolites compared with seven other varieties from other regions in China. Hemp seeds are rich in metabolites like cannflavin, trigonelline, citric acid, vitexin, choline alfoscerate, and choline, which may potentially contribute to the longevity of the Bama people. Through transcriptomic and metabolomic analyses, a gradual decrease in the overall expression pattern of genes and metabolite accumulation was observed during seed maturation. Weighted gene co-expression network analysis revealed that two genes (ncbi_115696993 and ncbi_115706674) are involved in regulating main metabolites, while transcription factor association analysis revealed that three transcription factor genes (MYB, NAC, and GRAS) are also involved in regulating the metabolites. The expression pattern of these five candidate genes was further verified by qPCR. Our study provides valuable insights into the metabolic substances during seed maturation and identifies candidate genes that could be utilized for future genetic engineering to enhance the endogenous biosynthesis of health-promoting metabolites in hemp seeds, potentially leading to improved nutritional and medicinal properties.

1. Introduction

Hemp (Cannabis sativa L.) is a versatile crop that can be used to make a variety of foods, and hemp seeds can be used for oil production. The leaves, inflorescences, and stems of hemp have various applications in industry and medicine [1]. Hemp varieties can be divided into low-drug varieties, which are used for making items such as food and fiber, and high-drug varieties, which are used for making psychostimulant drugs, according to the content of addictive cannabinoid metabolites [2]. Some hemp seeds of low-drug varieties are rich in several health-promoting compounds, e.g., flavonoids [3,4].
Hemp seeds are high-quality food sources containing several nutrients, and they have long been used in China [5] because they are rich in protein, starch, oil, fiber, and minerals [6,7]. Previous studies have shown that hemp seeds are rich in flavonoid metabolites [5,8]. Flavonoids also exhibit diverse biological activities, including anticancer, antidiabetic, antiviral, anti-heart disease, antimicrobial, antioxidant, and anti-Alzheimer activities, and have been shown to promote the homeostasis of the intestinal flora [9,10,11,12,13,14,15]. The oil of hemp seeds also provides various health benefits; previous studies have shown that it contains more polyunsaturated fatty acids and rare fatty acids, such as γ-linolenic acid and stearidonic acid, compared with other cooking oils [16,17]. The medicinal value of the oil of hemp seeds has also been studied [18].
The “Bama longevity villages” in Guangxi Province, China, are famous for the high longevities of the local people [19,20]. Several studies have shown that the unique geographical features, climatic conditions, and eating habits of the Bama people contribute to their high longevities [21,22,23,24]. Hemp seeds derived from the local variety in Bama are a key source of protein and oil for the local people. These seeds have been shown to provide various health benefits, including promoting gut flora health; the consumption of hemp seeds is thus thought to contribute to the high longevity of the Bama people [21,23,24]. Given that hemp is widely cultivated, the metabolite composition of hemp seeds varies among varieties and climatic zones [1,5,8]. The unique geographical features and climatic conditions of the Bama region, as well as the soil environment [25], might confer hemp seeds from the Bama region with unique properties that contribute to the high longevity of the Bama people. Ning (2022) described the metabolites of different varieties of hemp seeds from seven regions in China (but not including Bama) and showed that the metabolites of hemp seeds varied substantially in areas differing in climate and geography [5]. This study provides a valuable dataset for evaluating whether the hemp seeds from the Bama region have properties that differ from those from other regions in China.
Despite the rich nutrients and medicinal properties of hemp seeds, the lack of research on their metabolite synthesis and gene regulation has hindered the use of molecular breeding to enhance hemp’s properties. Furthermore, the absence of studies characterizing metabolite composition and gene expression regulation during hemp seed maturation is a significant gap considering its impact on seed yield. In this study, our objective was to (i) characterize the composition of metabolites in hemp seeds from the Bama region; (ii) assess gene expression variation across different maturity stages of hemp seeds; (iii) identify genes associated with metabolite synthesis and regulation in hemp seeds and their potential impact on the longevity of the local population. Additionally, we aimed to identify the key genes responsible for regulating the synthesis of essential metabolites (Figure 1a,b). We conducted a targeted metabolomics analysis and transcriptomic analysis to characterize the composition of metabolites in hemp seeds from the Bama region at four maturity stages. A multi-omics association analysis was performed to identify genes involved in metabolite synthesis and regulation. This study contributes to the understanding of the nutritional value and genetic regulation of hemp seeds, potentially offering insights to promote health and longevity in the local population.

2. Results

2.1. Metabolome of Hemp Seeds at Different Maturity Stages

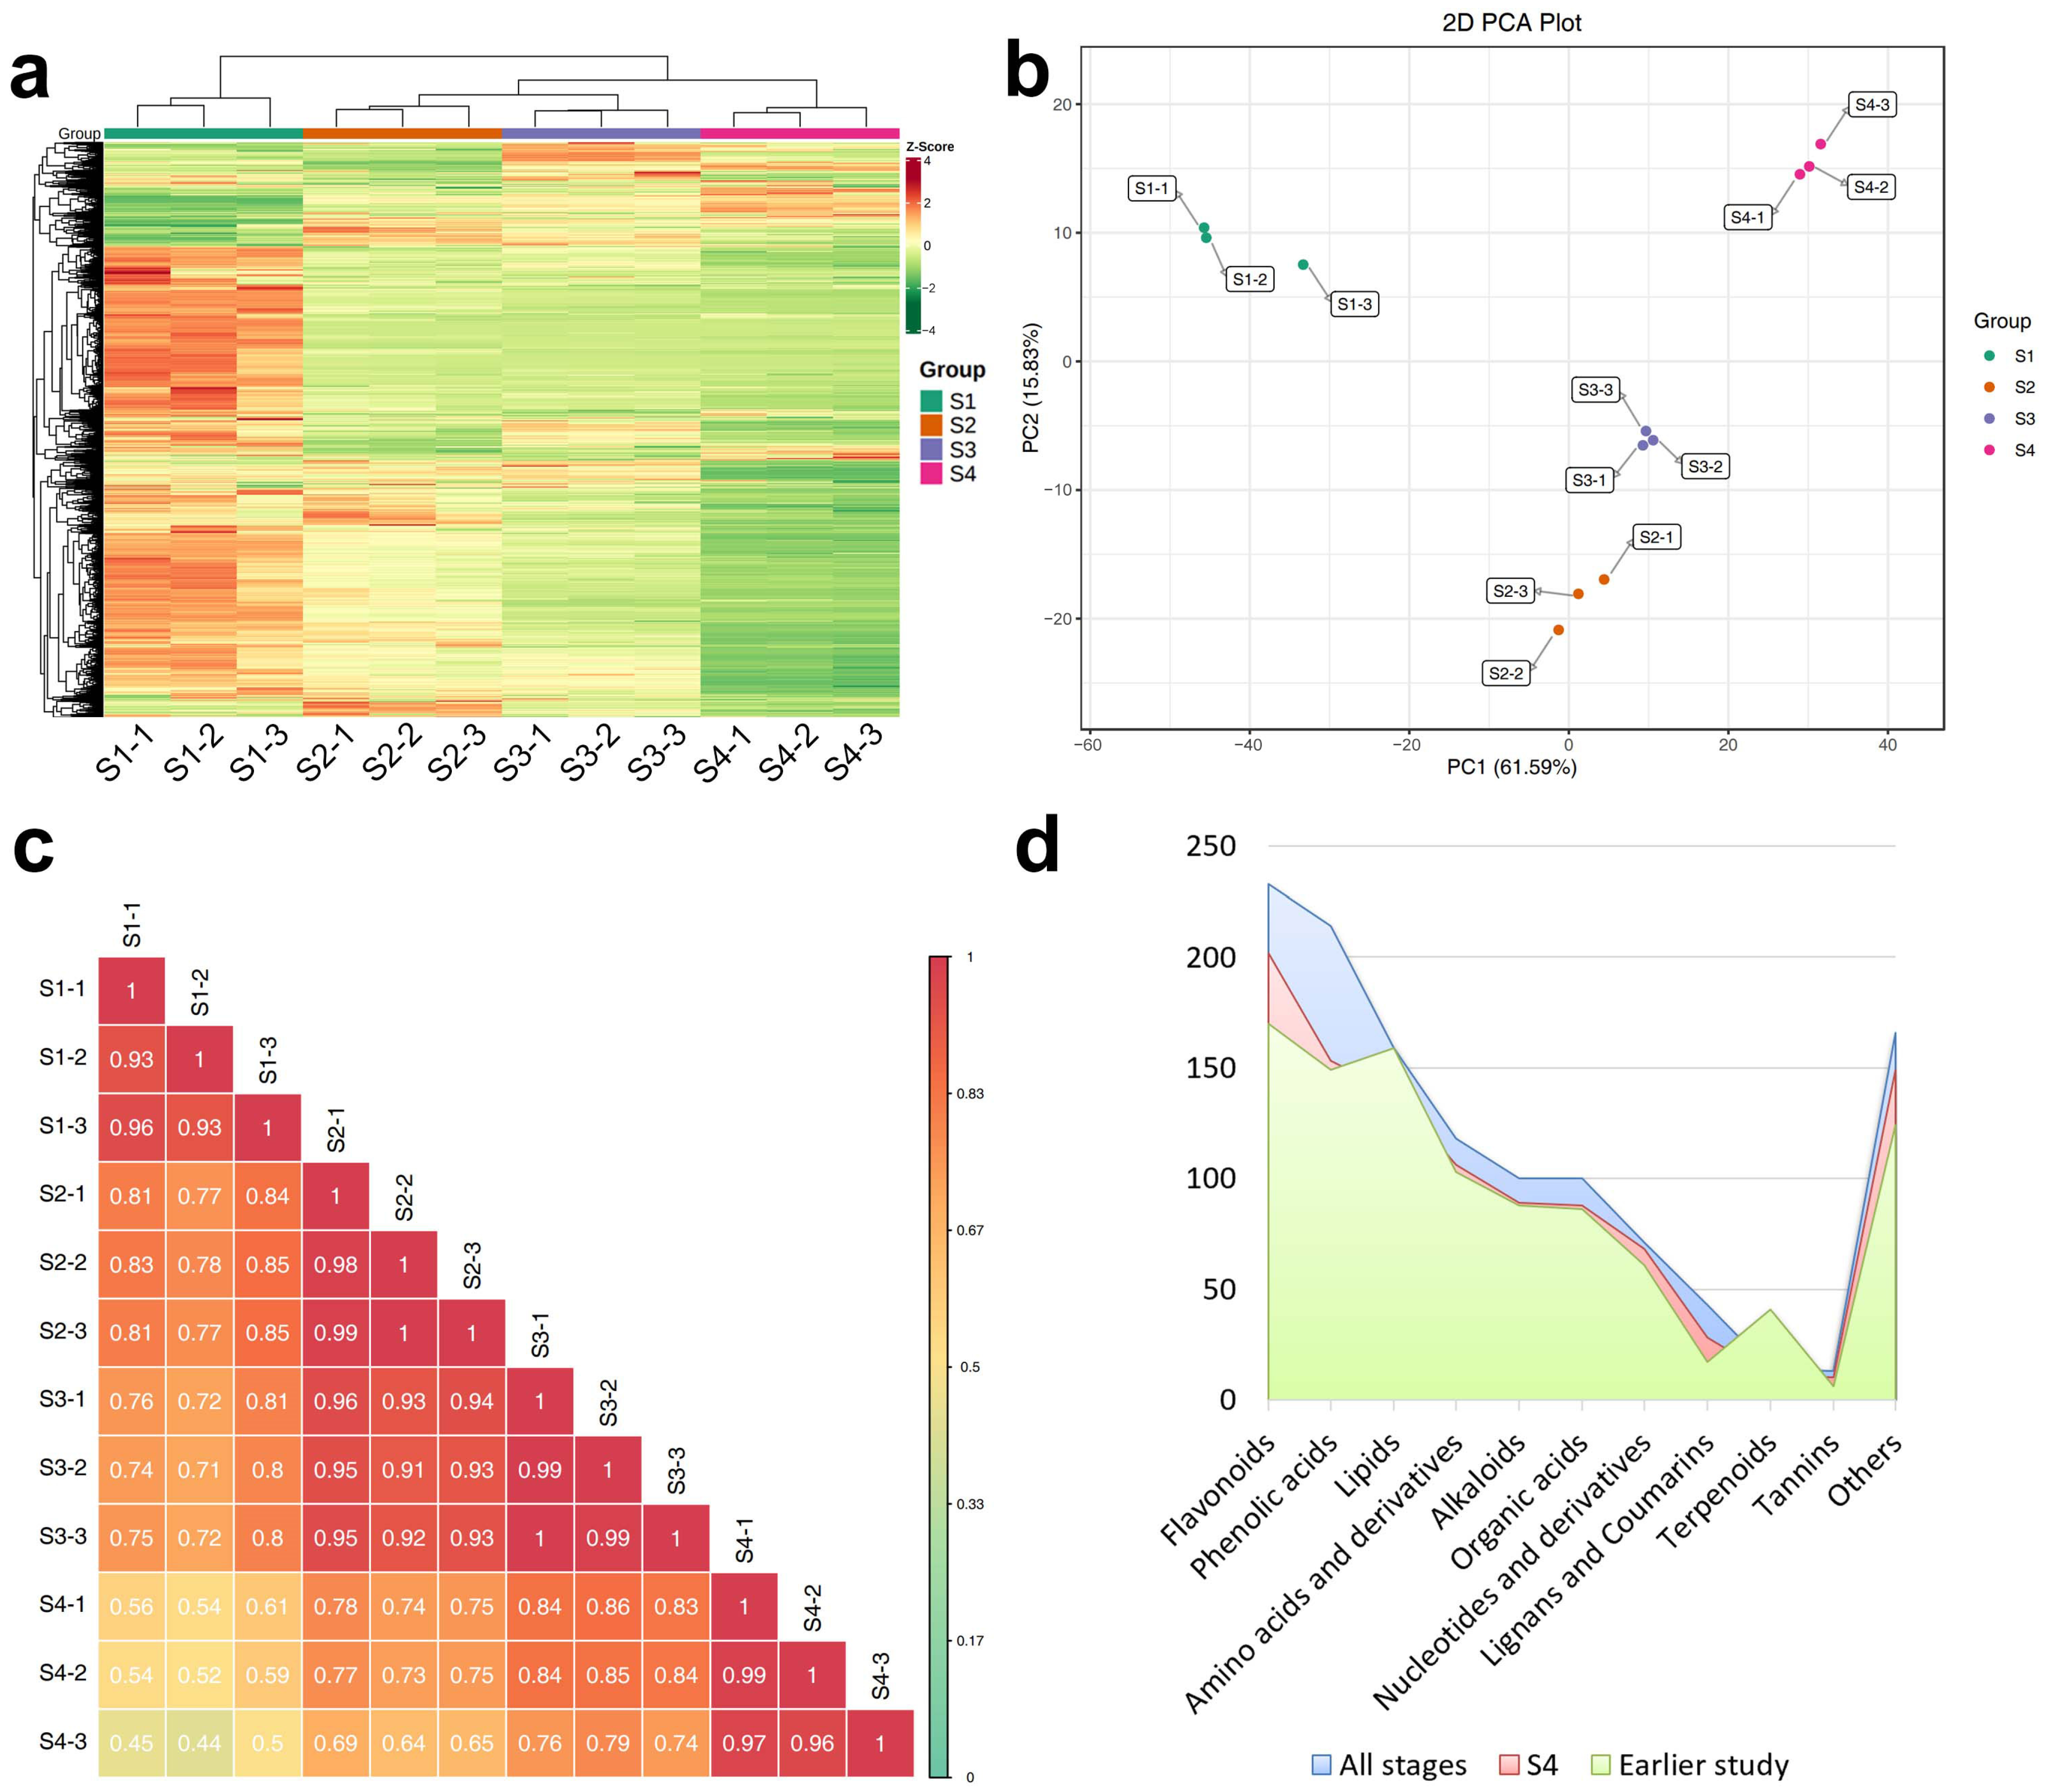
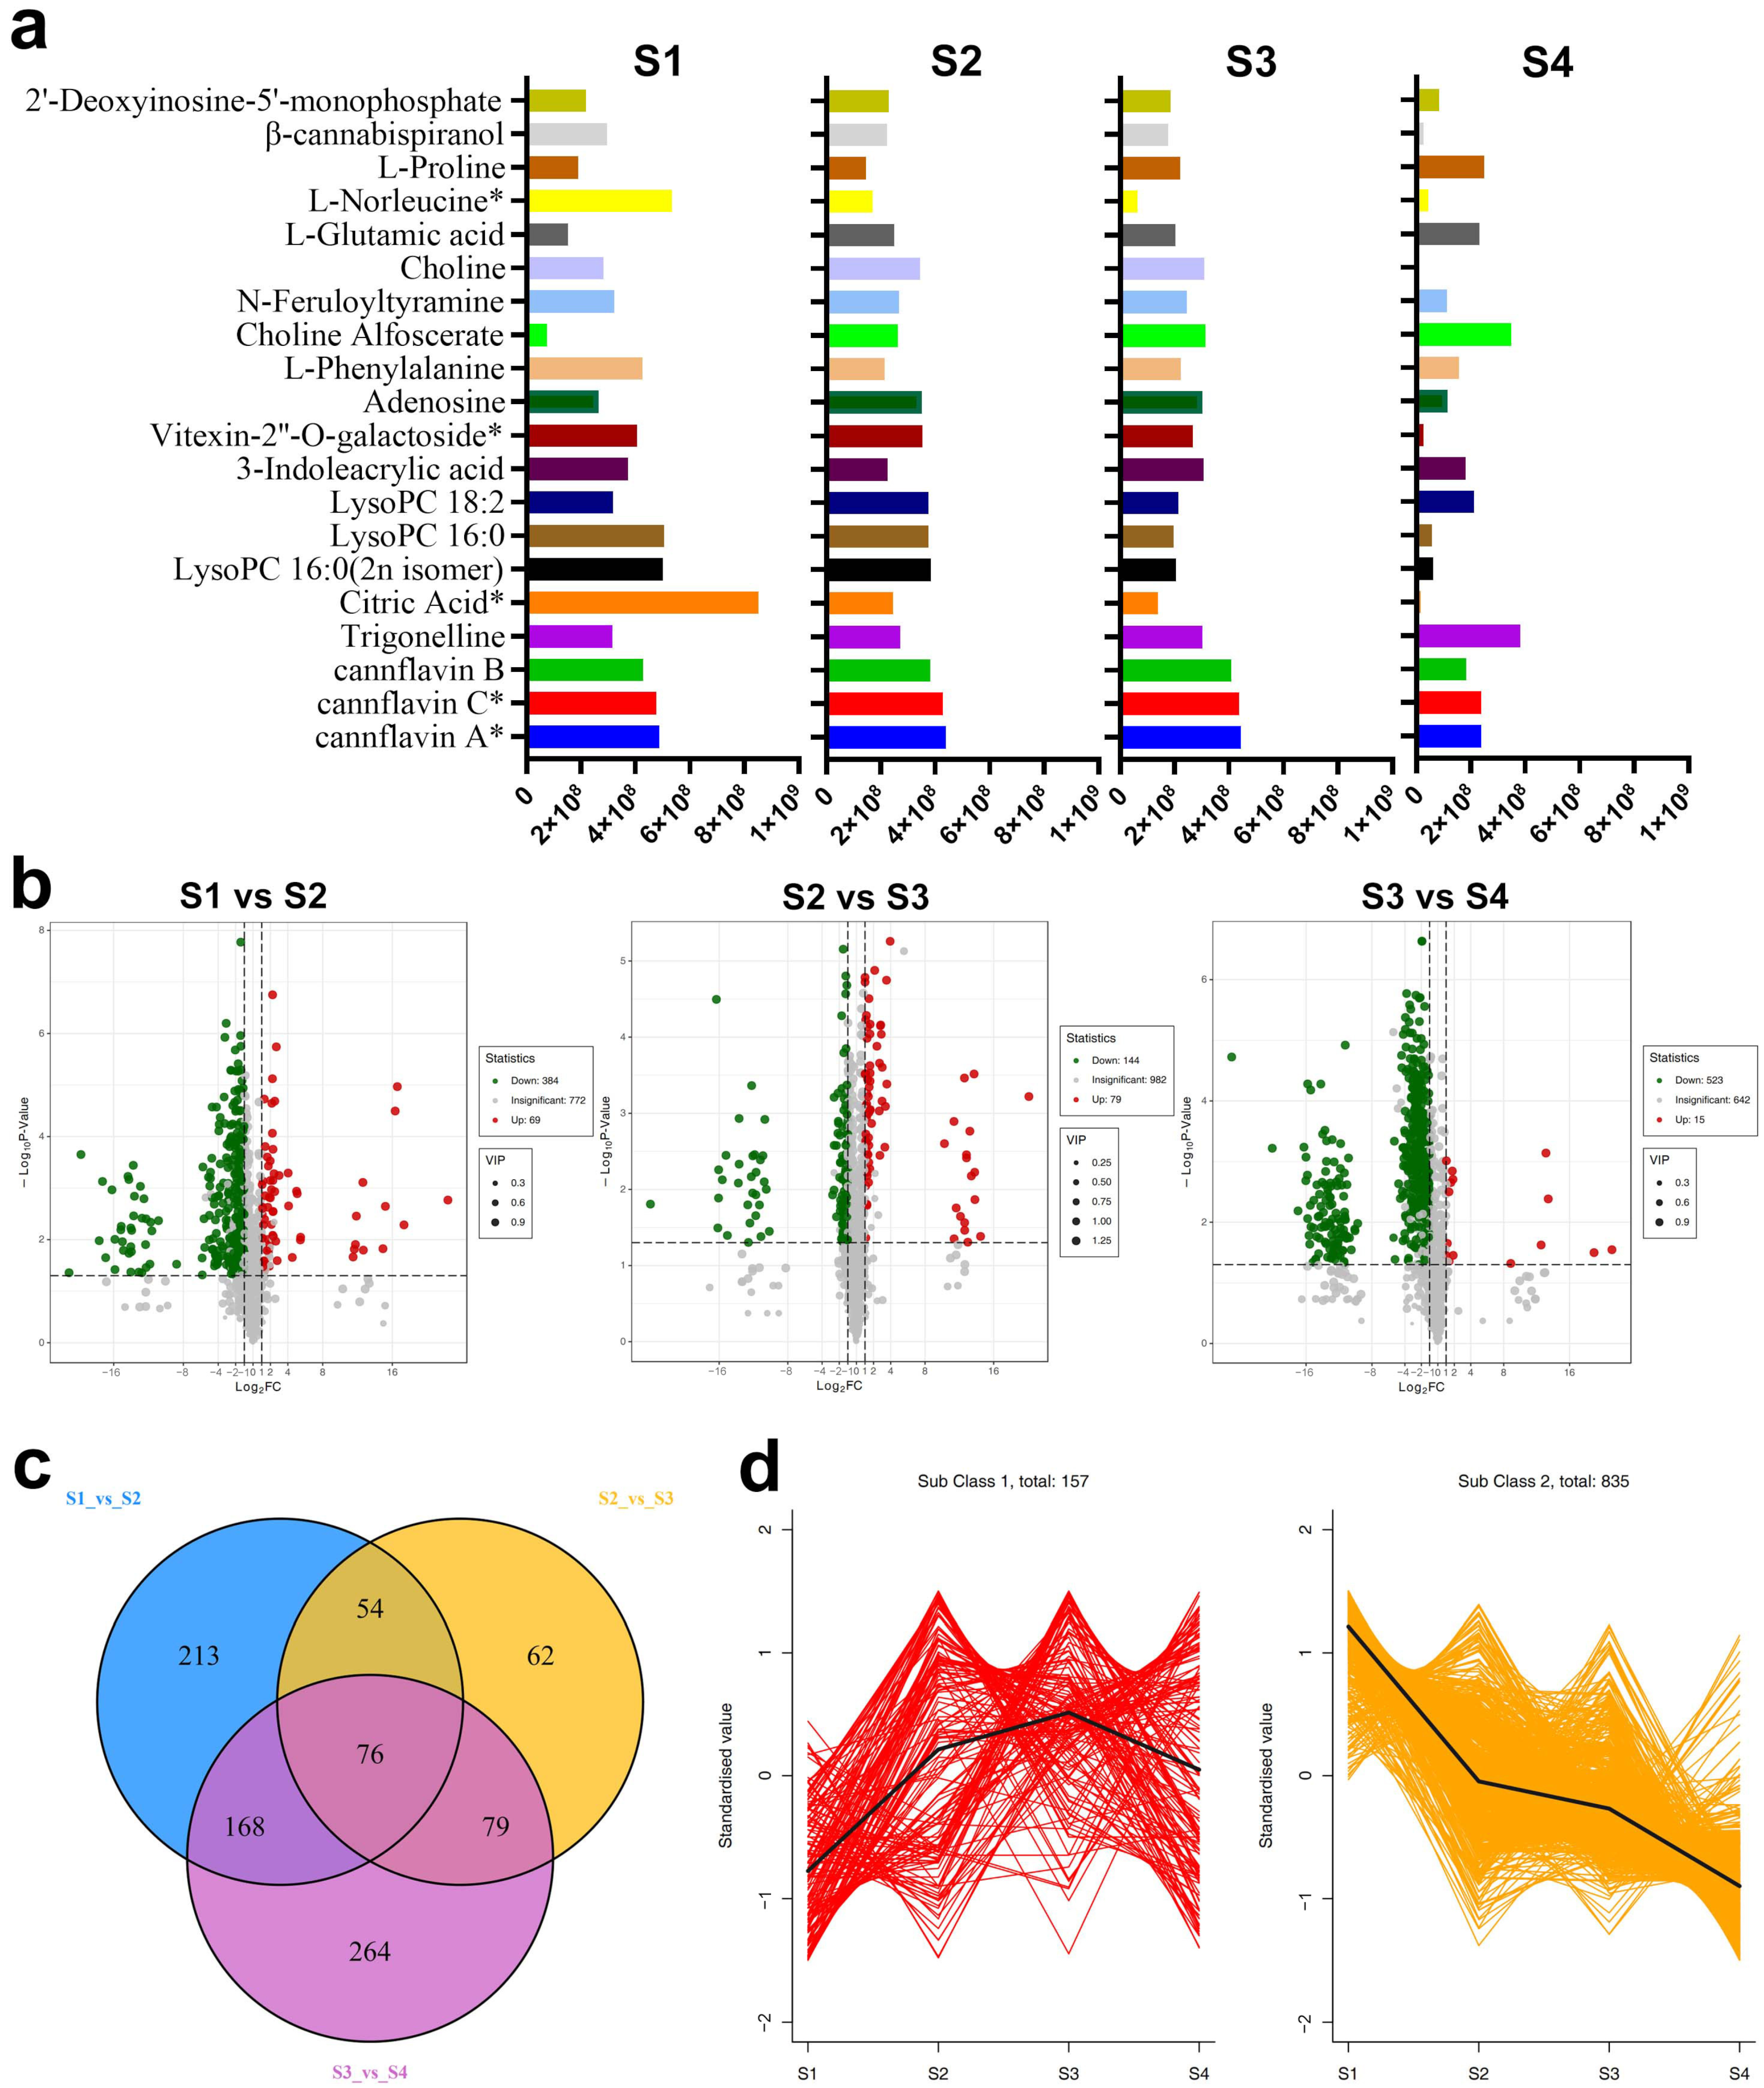
2.1.1. Composition of Metabolites

We first compared the composition of the main metabolites in hemp seeds at different maturity stages. The abundance of all metabolites was assessed using a heat map; the abundances of most metabolites decreased from S1 to S4 (Figure 2a), which suggests that metabolic changes in hemp seeds were gradual during the maturation process. Principal component analysis (PCA) revealed significant differences in the abundances of metabolites between S1 and S4 (with PC1 explaining 61.59% and PC2 accounting for 15.83% of the variables, highlighting the importance of these principal components in capturing the variability and structure of the dataset), and the abundances of metabolites in S2 and S3 did not significantly differ (Figure 2b). A heat map of metabolite correlations among samples revealed a similar pattern of gradual changes in metabolites, wherein the abundances of metabolites in S1 were weakly correlated with those in S4 and the abundances of metabolites in S2 were highly correlated with those in S3 (Figure 2c). According to our metabolic results, a total of 1231 metabolites in 11 classes were detected in hemp seeds from S1 to S4, including 233 flavonoids, 214 phenolic acids, 159 lipids, 118 amino acids and derivatives, 100 alkaloids, 100 organic acids, 71 nucleotides and derivatives, 43 lignans and coumarins, 14 terpenoids, 13 tannins, and 166 others (Figure 2d). Given that a recent study has characterized the composition of metabolites in the hemp seeds of seven cultivars in different regions in China [5], we compared the results of our study with those of this previous study to clarify differences in the composition of metabolites in hemp seeds from the Bama region compared to those from other regions in China. The number of metabolite components was higher in hemp seeds from the Bama region than in hemp seeds from the other seven varieties from the other regions [5] (Figure 2d); the metabolites showing the greatest difference between the hemp seeds from the Bama region and those from other regions were flavonoids (170 in the seven varieties vs. 233 in the variety from the Bama region). Even if comparisons are restricted to S4, which was the maturity stage at which seeds were sampled in this previous study, we still found that the number of flavonoids was higher in the hemp seeds from the Bama region than in hemp seeds from other regions (170 vs. 202, Figure 2d). Table S1 provides detailed information on the numbers of metabolites detected at each maturity stage.

2.1.2. Differentially Accumulated Metabolites

We compared the abundances of metabolites in hemp seeds from S1 to S4. The 20 most abundant metabolites from S1 to S4 were analyzed (Figure 3a), including cannflavin A*, cannflavin C*, cannflavin B, trigonelline, citric acid*, LysoPC 16:0 (2 n isomer), LysoPC 16:0, LysoPC 18:2, 3-indoleacrylic acid, vitexin-2″-O-galactoside*, adenosine, L-phenylalanine, choline alfoscerate, N-feruloyltyramine, choline, L-glutamic acid, L-norleucine*, L-proline, β-cannabispiranol, and 2′-deoxyinosine-5′-monophosphate. According to quantitative estimates of the relative peak area, the abundance of most metabolites, such as citric Acid* and LysoPC 16:0, decreased from S1 to S4; an increase in abundance from S1 to S4 was only observed for choline alfoscerate. Trigonelline remained unchanged across all stages. In S4, no choline was detected; choline was the only metabolite out of the 20 most abundant metabolites that was not detected in S4. Next, we characterized differences in differentially accumulated metabolites among maturity stages; specifically, we compared differentially accumulated metabolites using the following comparison groups: S1 vs. S2, S2 vs. S3, and S3 vs. S4. We detected a total of 69, 79, and 15 up-regulated metabolites and 384, 144, and 523 down-regulated metabolites in the S1 vs. S2, S2 vs. S3, and S3 vs. S4 comparison groups, respectively (Figure 3b). Differences in differentially accumulated metabolites were most pronounced in the S1 vs. S2 and S3 vs. S4 comparison groups. The differentially accumulated metabolites were distributed uniformly among the comparison groups; there were thus no metabolite classes that were markedly more enriched in one of the comparison groups. Tables S2 to S4 show the abundances of the differentially accumulated metabolites in each of the comparison groups. The Venn analysis also revealed gradual decreases in the abundances of metabolites (Figure 3c); the number of unique differentially accumulated metabolites was higher in S1 vs. S2 (213) and S3 vs. S4 (264) than in S2 vs. S3 (62). Next, we analyzed the distribution of all metabolites using the K-means clustering method. There were two significant patterns of metabolite change identified in hemp seeds during the maturation process. Subclass 1 included 157 metabolites, and the abundances of these metabolites increased gradually from S1 to S3 and then decreased slightly in S4; subclass 2 included 835 metabolites, and the abundances of these metabolites decreased gradually from S1 to S4 (Figure 3d; Table S5). Our analysis of differentially accumulated metabolites indicated that the maturation of hemp seeds is a process characterized by gradual metabolic changes.

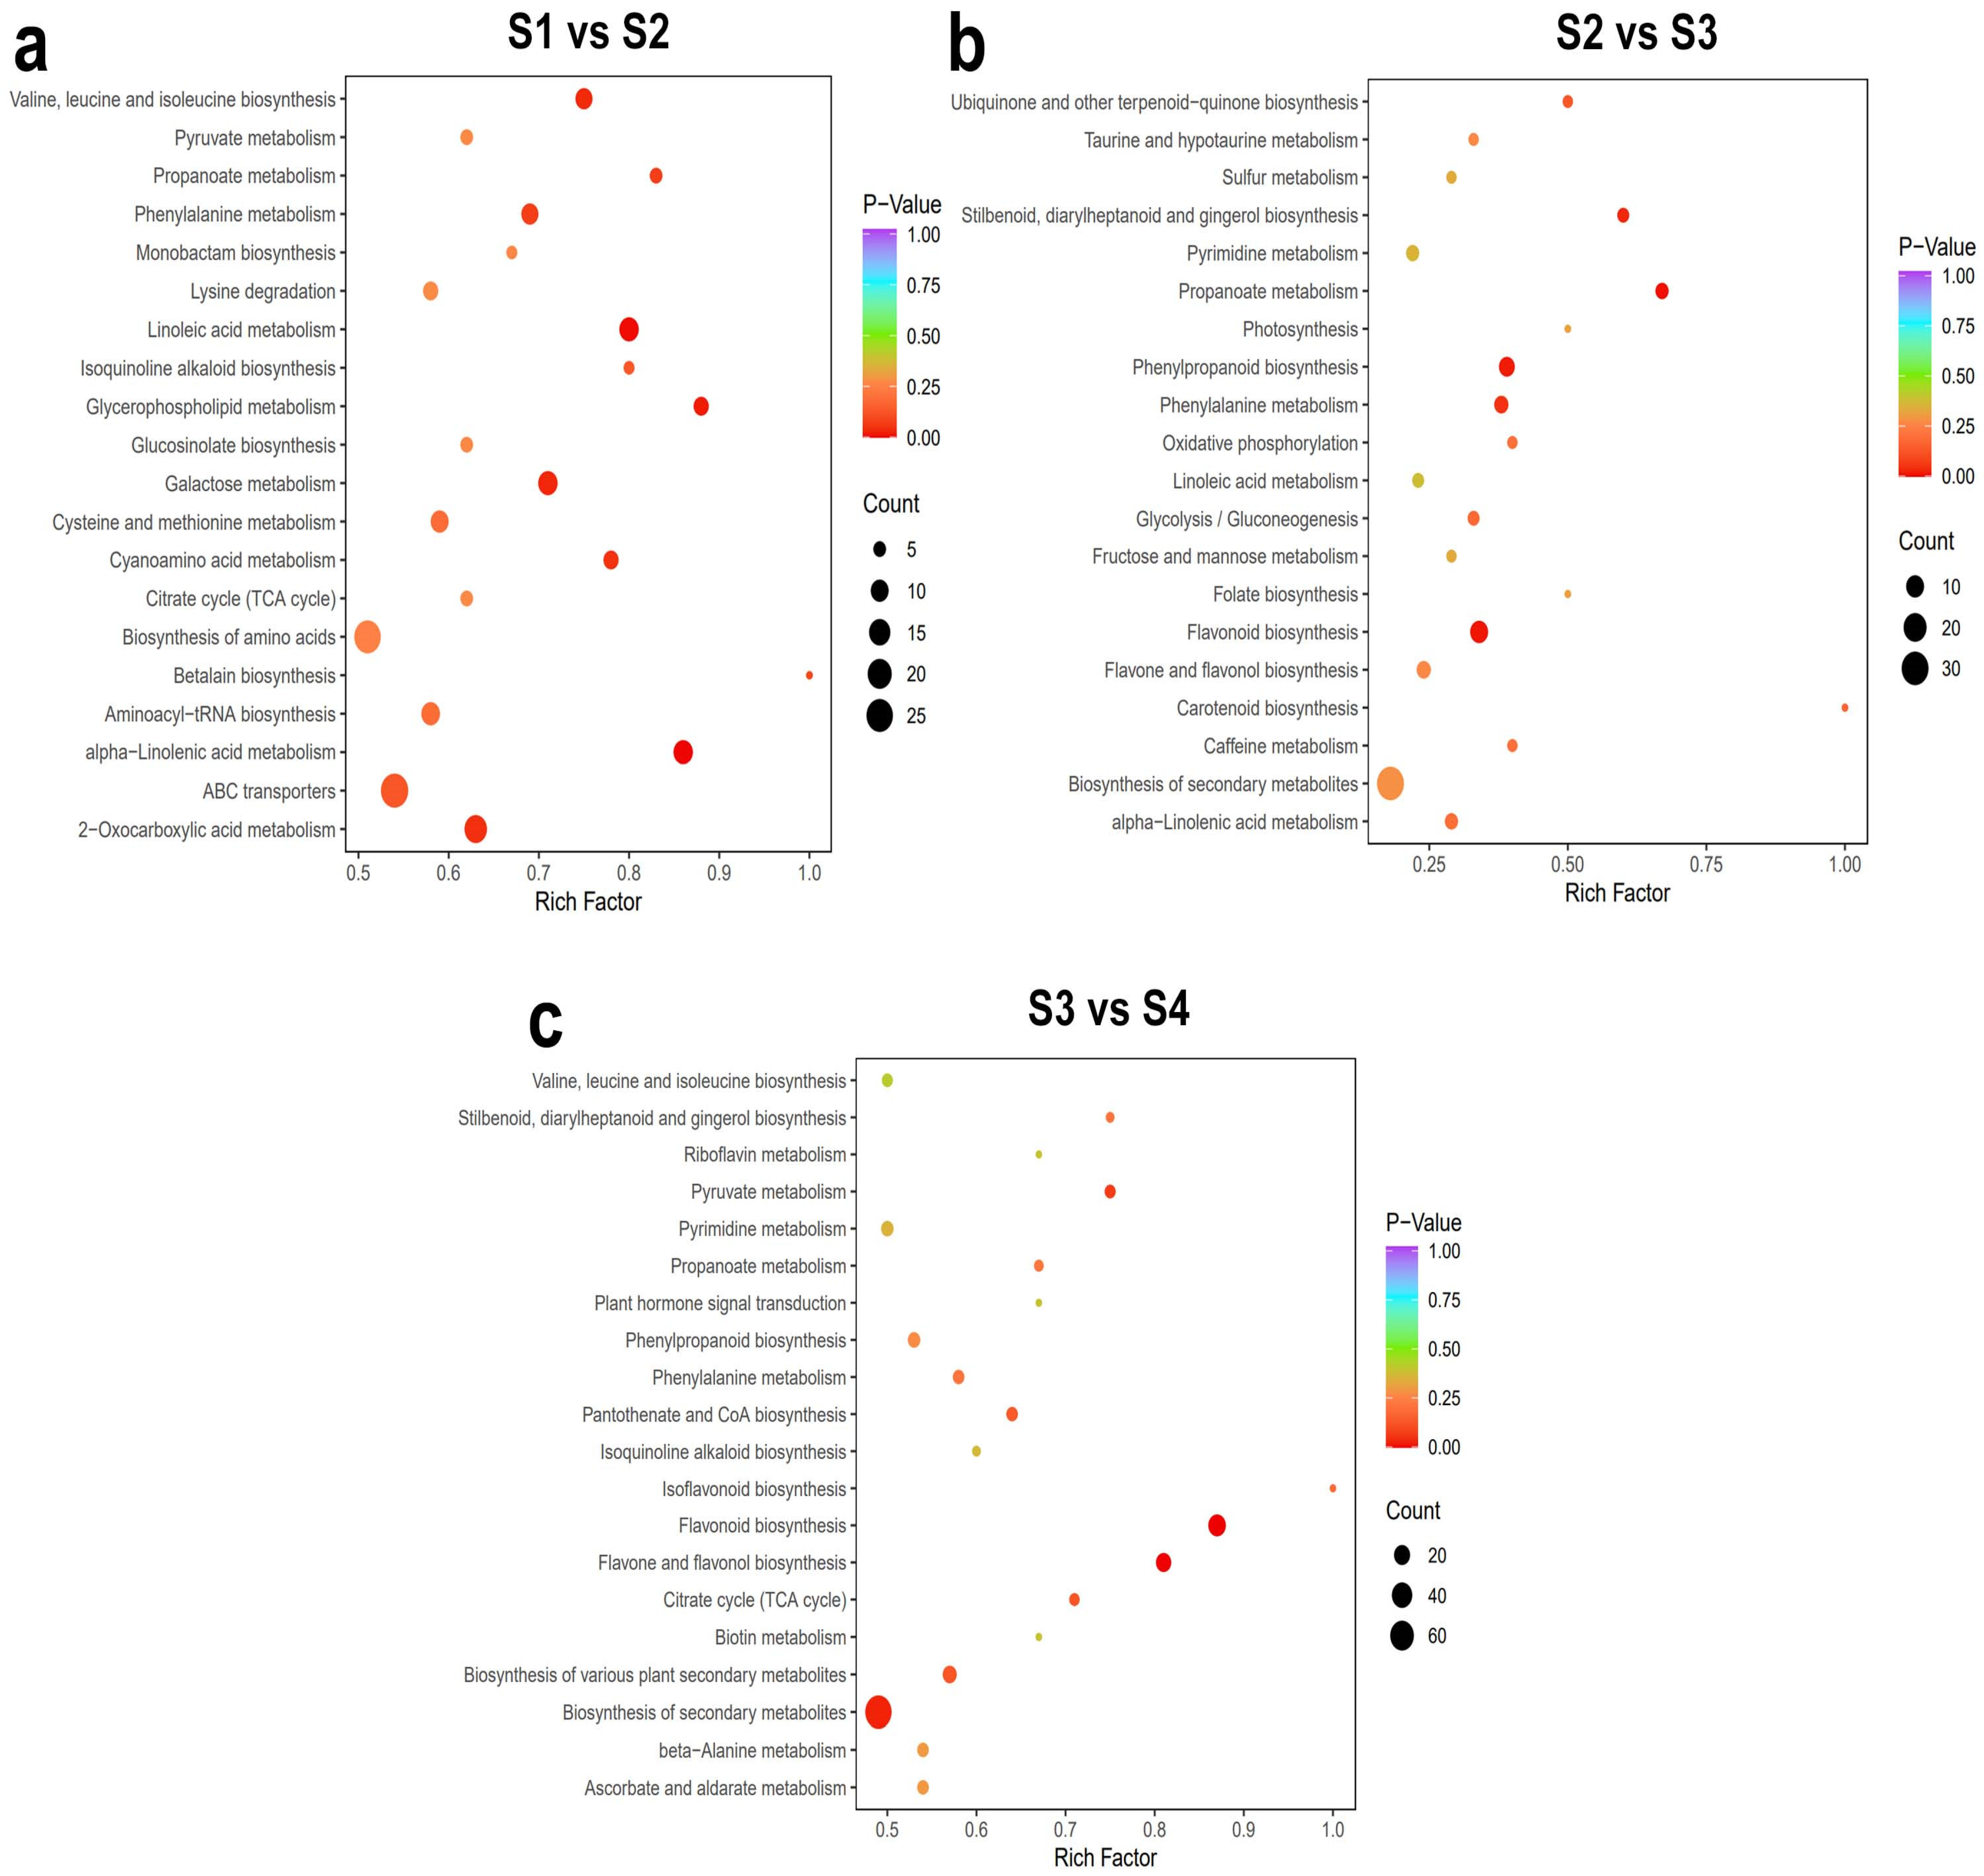
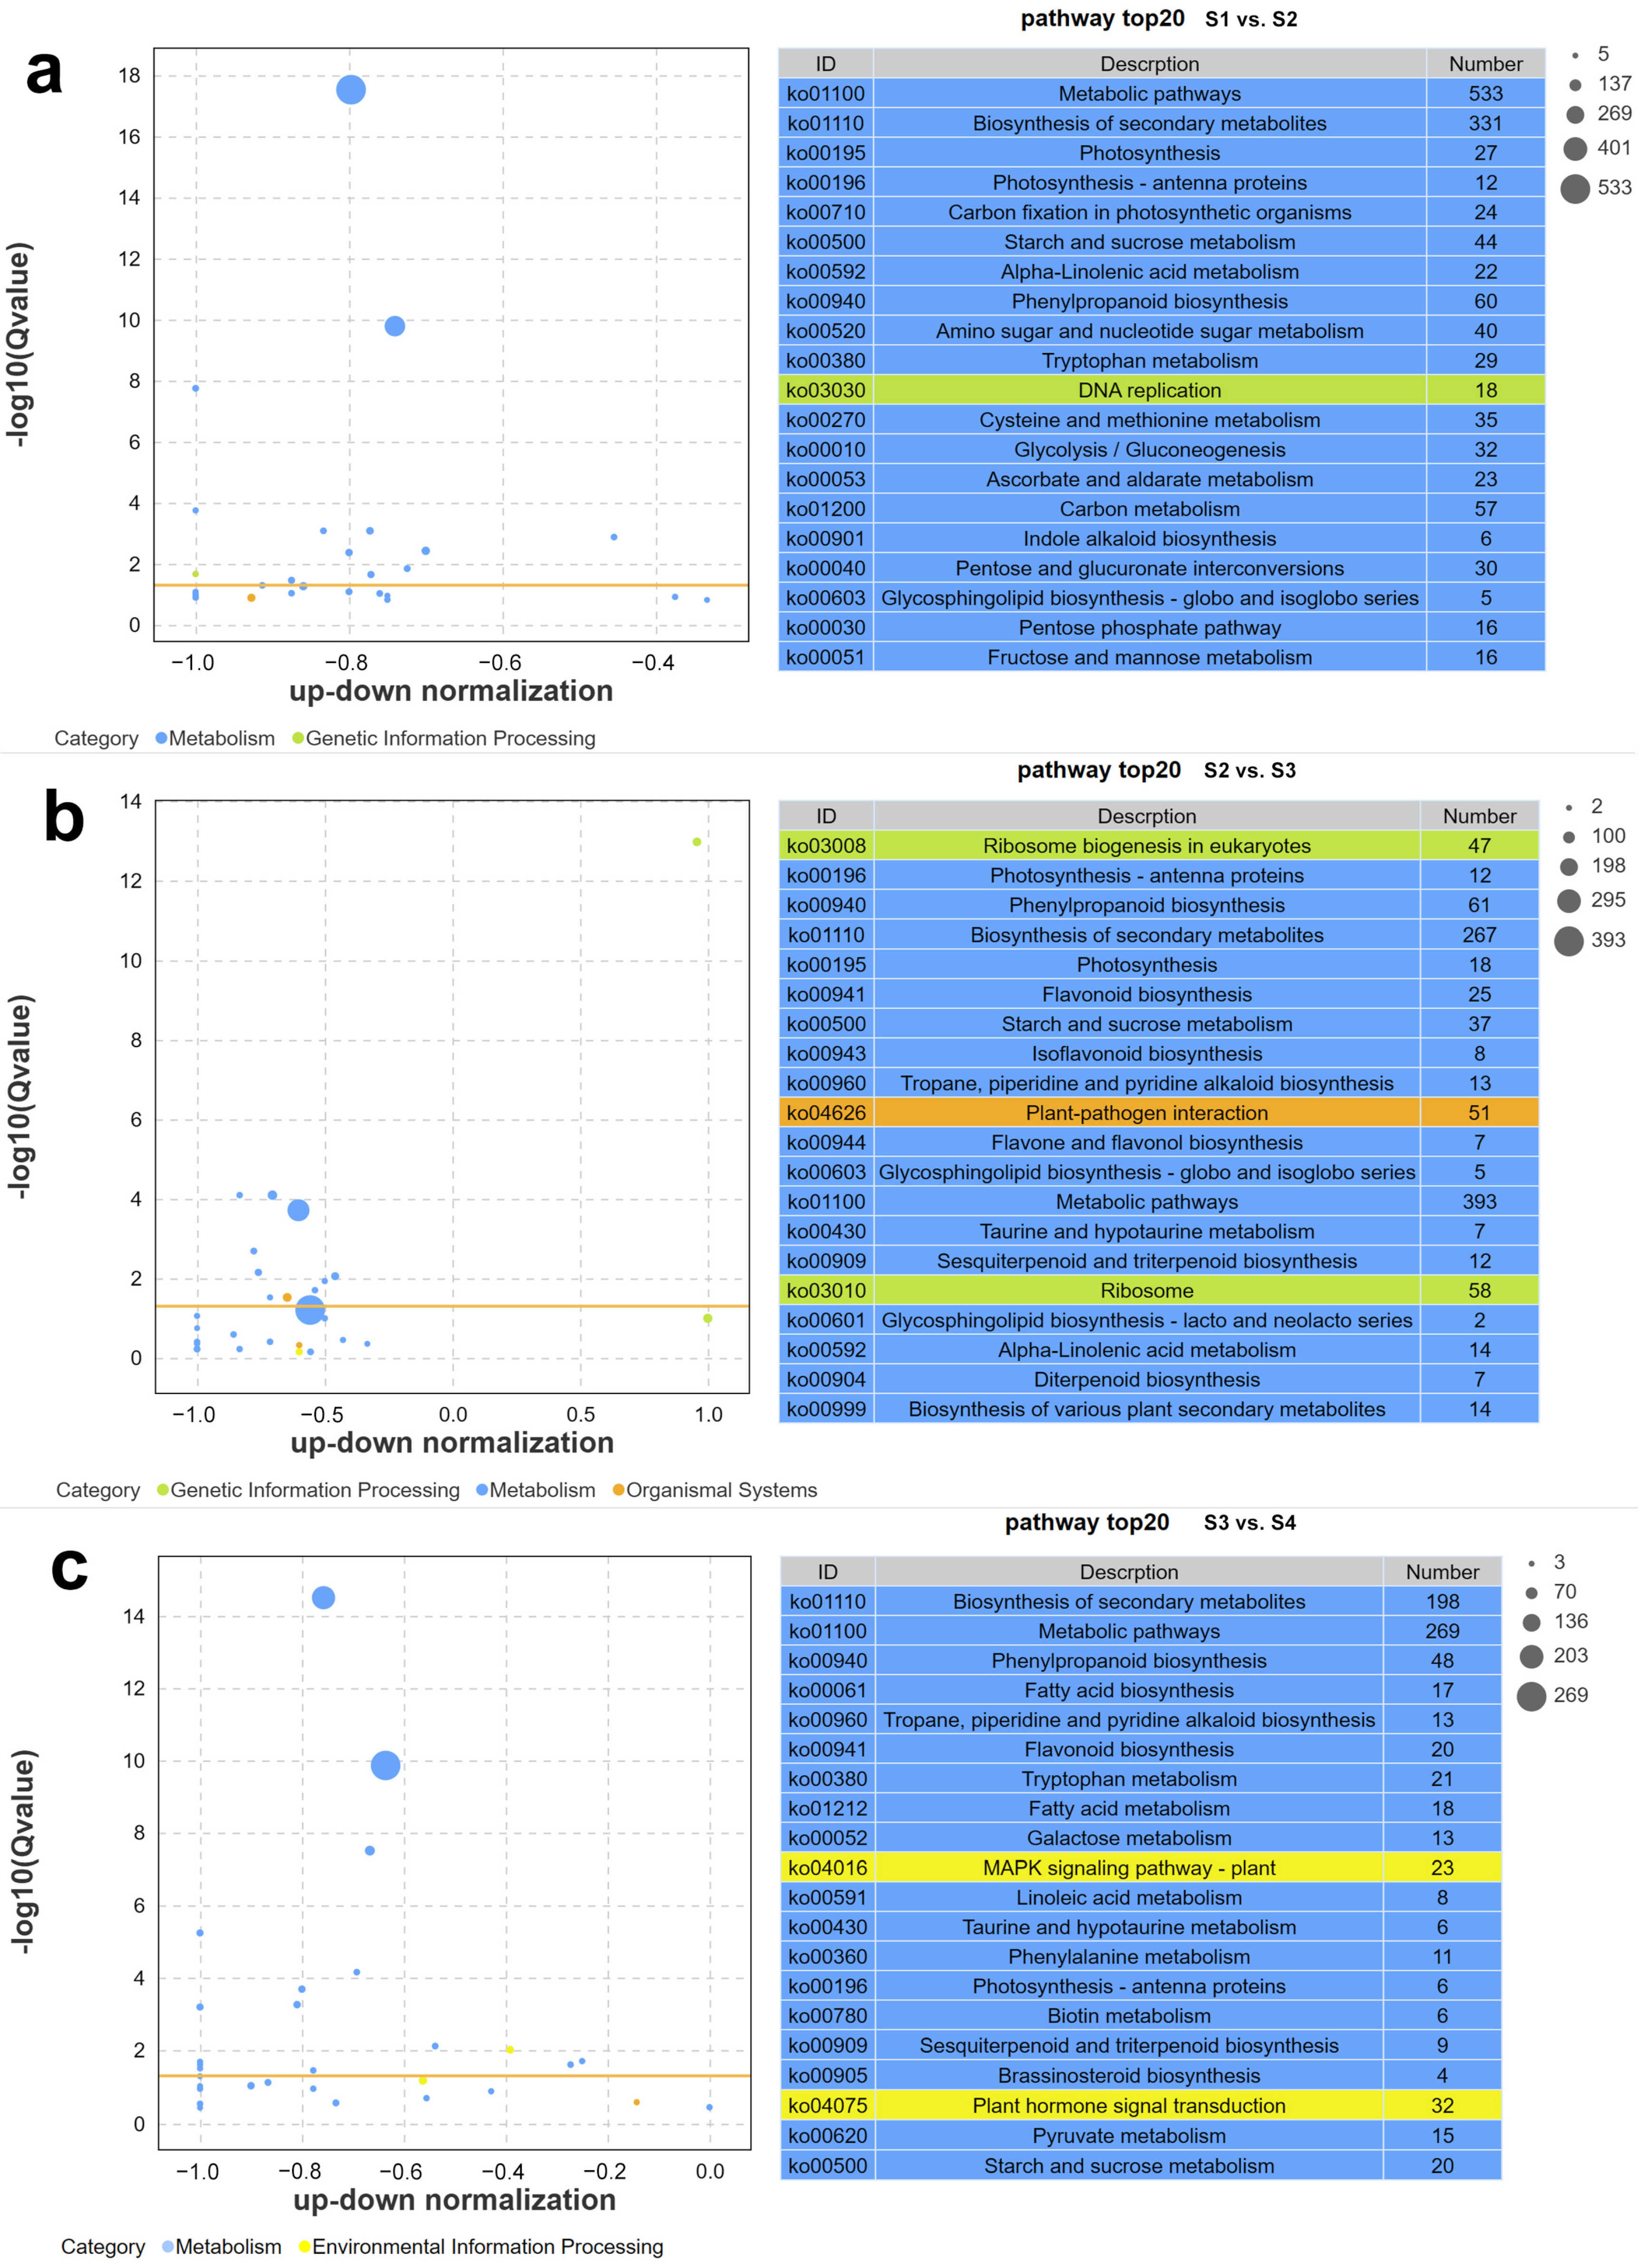
2.1.3. Kyoto Encyclopedia of Genes and Genomes (KEGG) Analysis

We conducted a KEGG analysis to clarify the functions of the differentially accumulated metabolites involved in the maturation of hemp seeds. In the S1 vs. S2 comparison group (Figure 4a), the differentially accumulated metabolites were significantly enriched in the following pathways (FDR < 0.05): “alpha-Linolenic acid metabolism” (ko00592), “Linoleic acid metabolism,” “Glycerophospholipid metabolism” (ko00564), “Galactose metabolism” (ko00052), “Valine, leucine and isoleucine biosynthesis” (ko00290), and “2-Oxocarboxylic acid metabolism” (ko01210). In the S2 vs. S3 comparison group (Figure 4b), the differentially accumulated metabolites were significantly enriched in the following pathways (FDR < 0.05): “Propanoate metabolism” (ko00640), “Flavonoid biosynthesis” (ko00941), “Phenylpropanoid biosynthesis” (ko00940), “Stilbenoid, diarylheptanoid and gingerol biosynthesis” (ko00945), and “Phenylalanine metabolism” (ko00360). In the S3 vs. S4 comparison group (Figure 4c), the differentially accumulated metabolites were significantly enriched (FDR < 0.05) in the following pathways: “Flavonoid biosynthesis” (ko00941), “Flavone and flavonol biosynthesis” (ko00944), and “Biosynthesis of secondary metabolites” (ko01110). In Table S1, the section denoted as “kegg_map” shows detailed information on metabolite enrichment. Overall, the KEGG analysis revealed that flavonoid metabolism is a key pathway involved in the maturation of hemp seeds.

2.2. Transcriptome Analysis of Hemp Seeds at Different Stages of Maturity

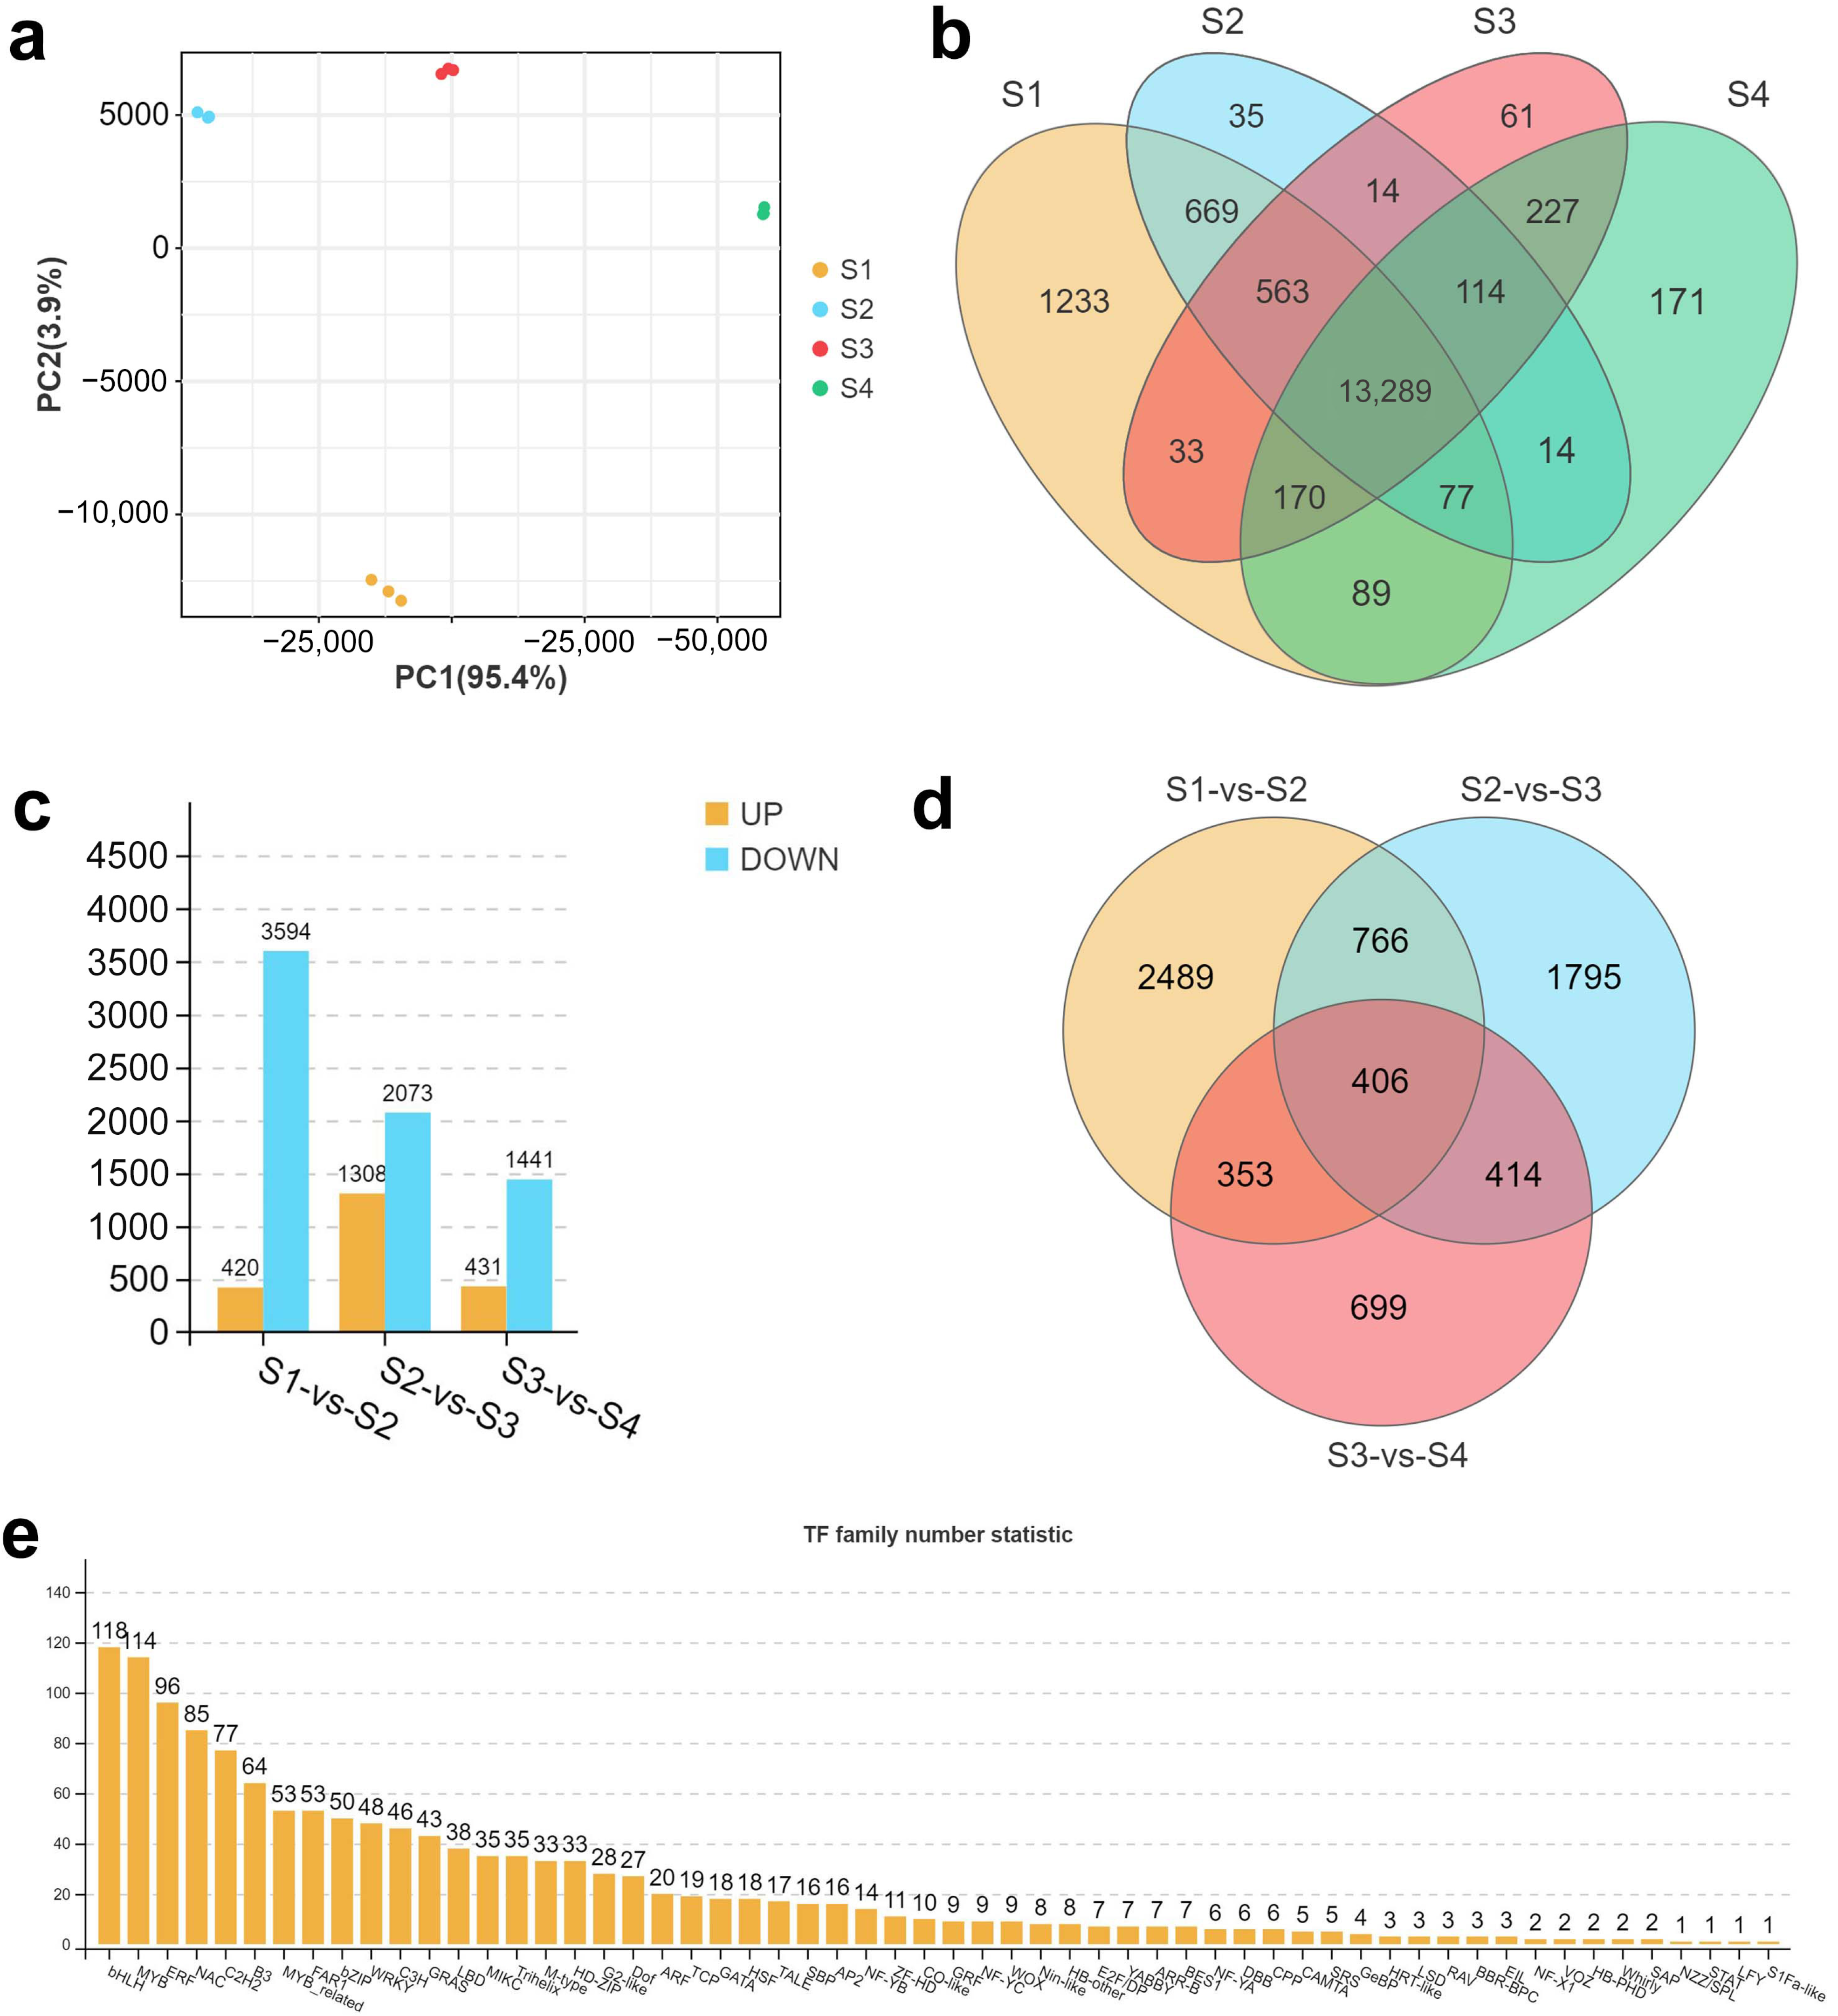
2.2.1. Sequencing Statistics

To clarify differences in gene expression patterns in hemp seeds at different stages of maturity, we sequenced the transcriptome of hemp seeds from S1 to S4. A total of 91.25 GB of next-generation sequencing data were generated, and an average of 7.6 GB of data were generated per sample; the lowest Q30 value was 93.33% (S3–3), and the total mapped rate of all samples was at least 89.2% (S4–2), indicating that the transcriptome data were robust (Table S6).
We identified DEGs using this dataset. We conducted a PCA of the transcriptome data and found significant differences in PC1 (95.4%) among all stages; all samples were clustered into groups corresponding to the different stages, which suggest that there were pronounced differences in the expression of DEGs from S1 to S4 (Figure 5a). Venn analysis revealed 13,289 DEGs that were shared among all stages; a total of 1233, 35, 61, and 171 DEGs were unique to S1, S2, S3, and S4, respectively (Figure 5b). Next, we analyzed the DEGs in each of the comparison groups. Down-regulated DEGs were more common than up-regulated DEGs, and the number of down-regulated DEGs decreased from S1 to S4 (Figure 5c). A total of 3594, 2073, and 1441 down-regulated DEGs were identified in the S1 vs. S2, S2 vs. S3, and S3 vs. S4 comparison groups, respectively. The number of up-regulated DEGs was high in the S2 vs. S3 comparison group but low in the S1 vs. S2 and S3 vs. S4 comparison groups; specifically, the number of up-regulated DEGs was 420, 1308, and 431 in the S1 vs. S2, S2 vs. S3, and S3 vs. S4 comparison groups, respectively. Next, we analyzed the distribution of DEGs between comparison groups. The number of unique DEGs continuously decreased in the three comparison groups (Figure 5d); the number of unique DEGs was 2489, 1795, and 699 in the S1 vs. S2, S2 vs. S3, and S3 vs. S4 comparison groups, respectively. We also identified the transcription factor (TF) families of all the DEGs. There were a total of 1262 TF genes from 58 gene families, and genes in the bHLH (118), MYB (114), and ERF (96) TF families were the most common (Figure 5e and Table S7). These TF genes might play a role in regulating the synthesis of metabolites in hemp seeds at different maturity stages. We found that the expression of DEGs in hemp seeds gradually decreased during maturation, which was consistent with the results of the metabolomic analysis (Section 2.1).

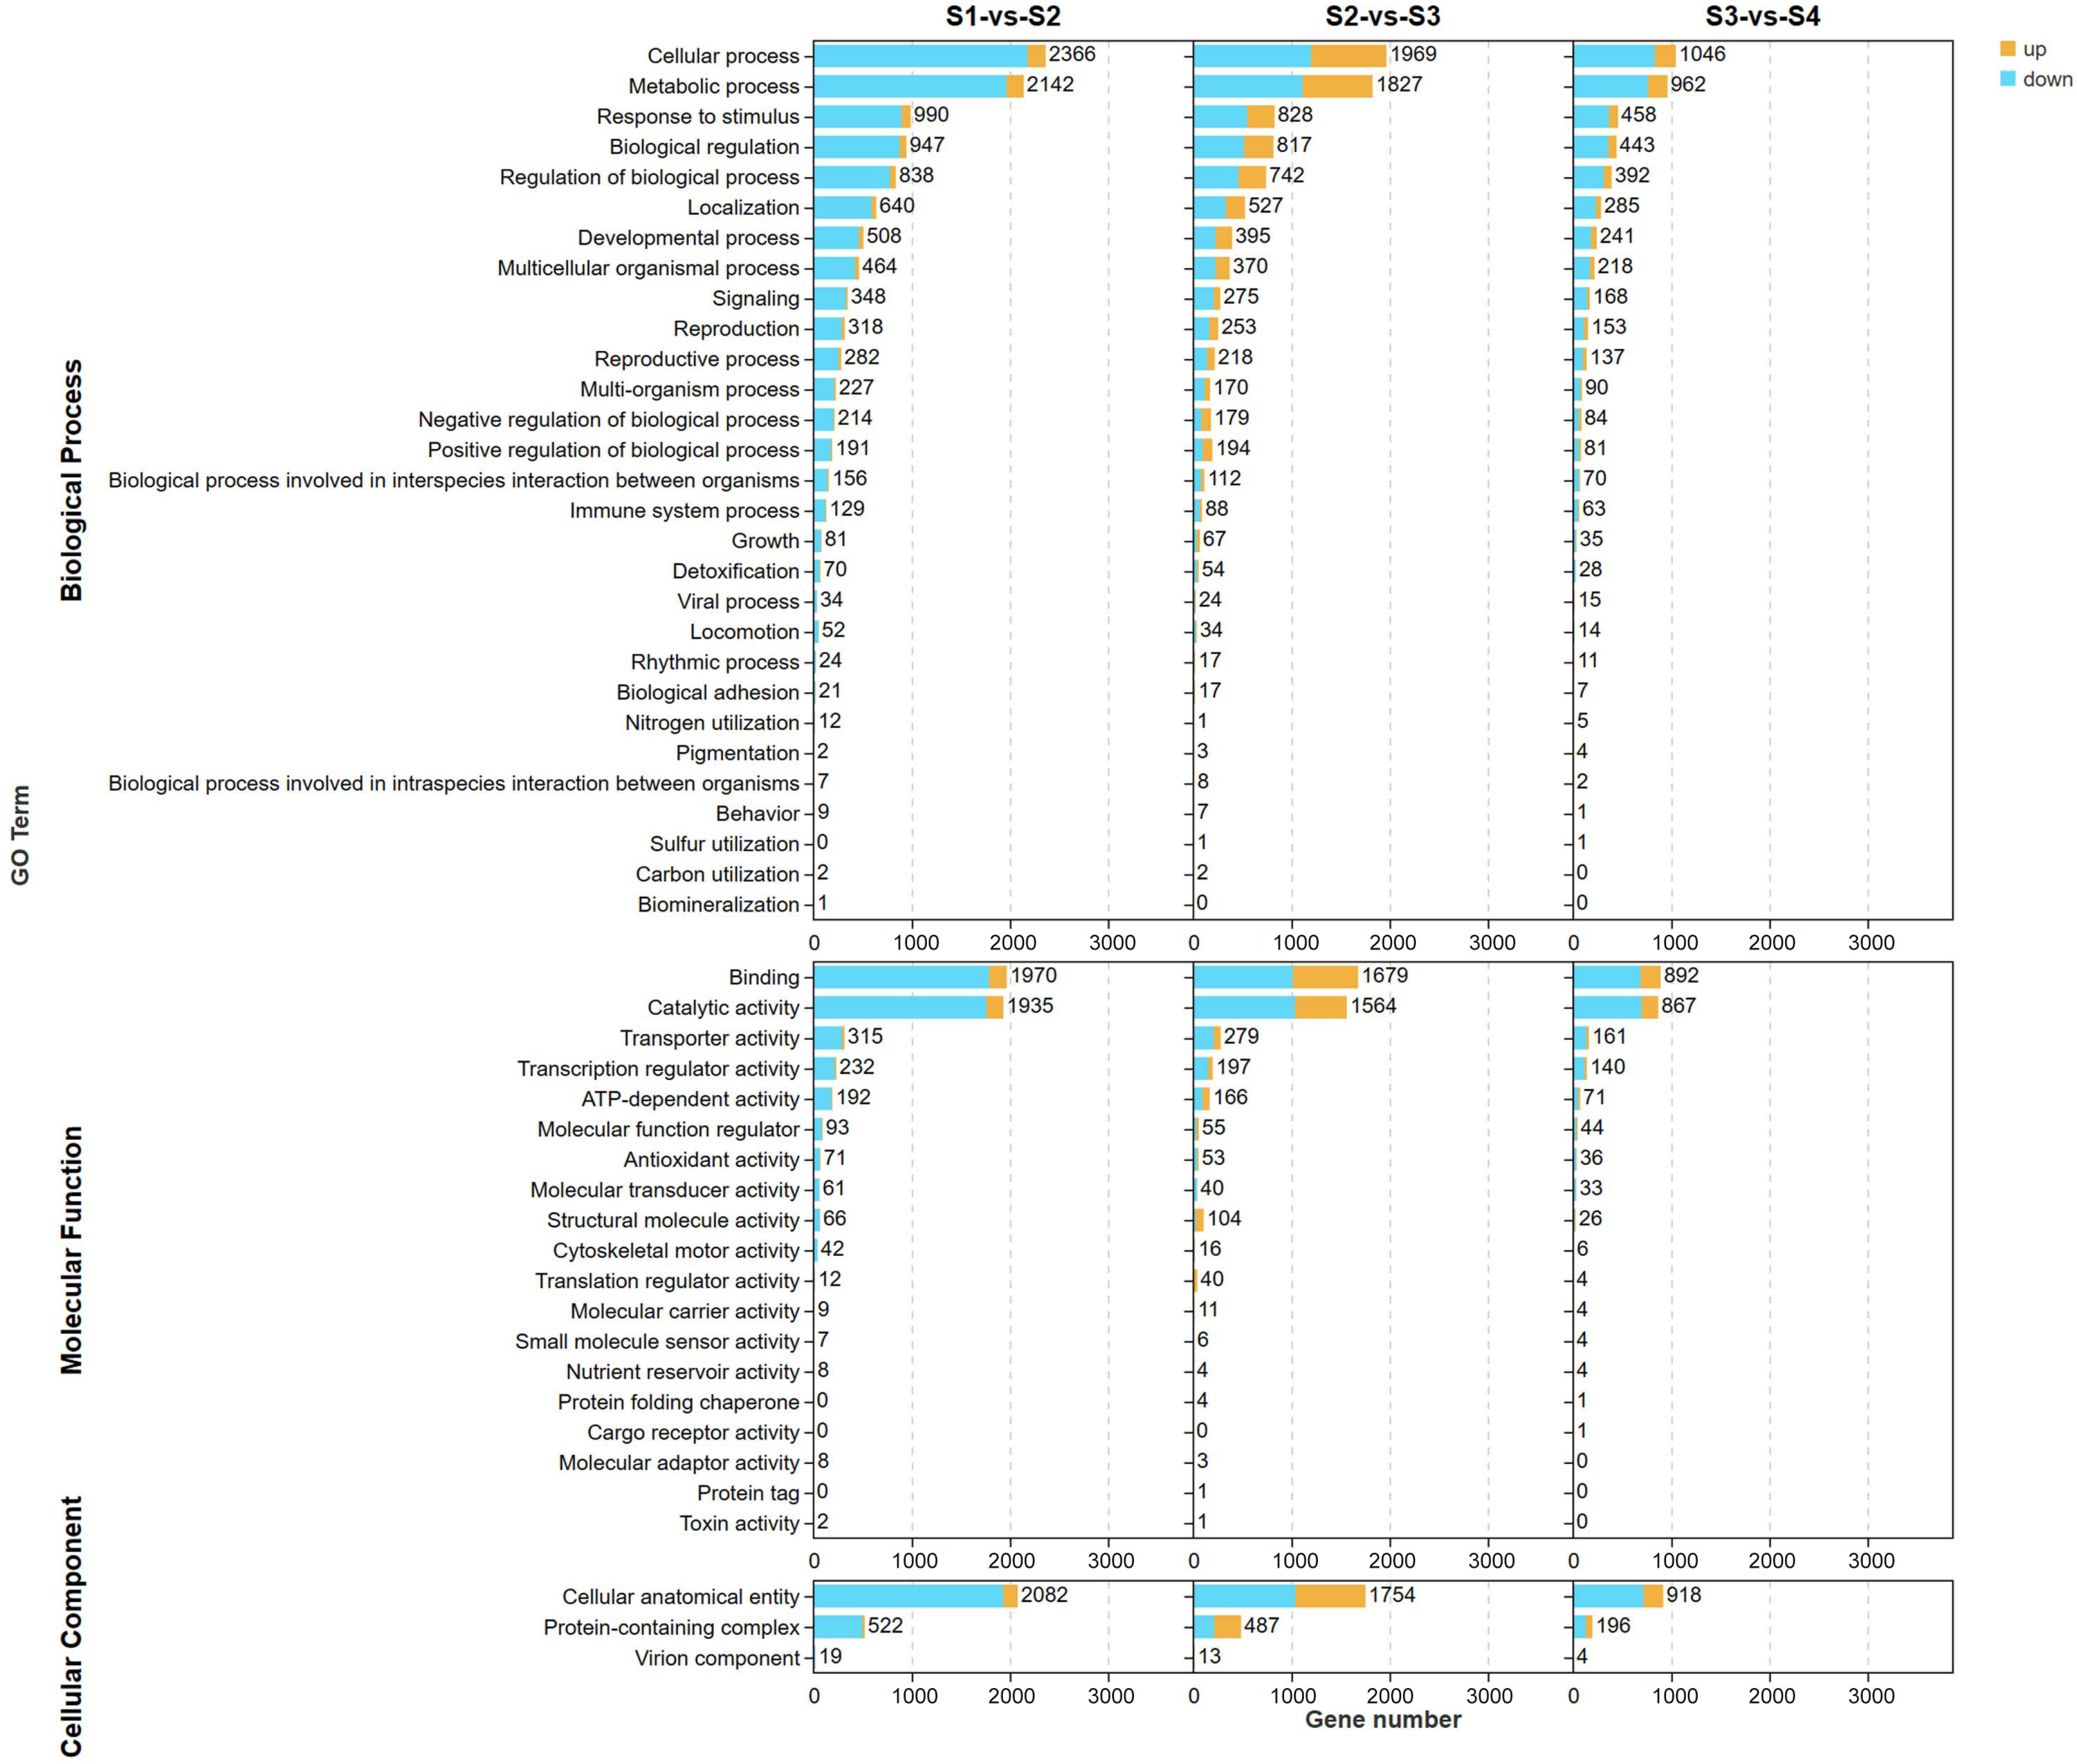
2.2.2. Gene Ontology (GO) and KEGG Analysis

We conducted GO and KEGG analyses to identify the functions of the DEGs. The GO analysis revealed that the most significantly enriched GO terms in the biological process category were “cellular process (GO:0009987)”, “metabolic process (GO:0008152)”, and “response to stimulus (GO:0050896)”; the most significantly enriched GO terms in the molecular function category were “binding (GO:0005488)” and “catalytic activity (GO:0003824)”; and the most significantly enriched GO terms in the cellular component category were “cellular anatomical entity (GO:0110165)” and “protein-containing complex (GO:0032991)” (Figure 6). According to the KEGG analysis, the three most significantly enriched pathways in the S1 vs. S2 comparison group were “Metabolic pathways” (ko01100), “Biosynthesis of secondary metabolites” (ko01110), and “Photosynthesis” (ko00195) (Figure 7a); the three most significantly enriched pathways in the S2 vs. S3 comparison group were “Ribosome biogenesis in eukaryotes” (ko03008), “Photosynthesis—antenna proteins” (ko00196), and “Phenylpropanoid biosynthesis” (ko00940) (Figure 7b); and the three most significantly enriched pathways in the S3 vs. S4 comparison group were “Biosynthesis of secondary metabolites” (ko01110), “Metabolic pathways” (ko01100), and “Phenylpropanoid biosynthesis” (ko00940) (Figure 7c). We also identified several relevant enriched pathways. We found that “Flavonoid biosynthesis” (ko00941) was significantly enriched in S2–S4 (Figure 7b,c), suggesting that the DEGs involved in this pathway might be related to the synthesis of flavonoids in hemp seeds. We also found that “MAPK signaling pathway—plant” (ko04016), “Fatty acid biosynthesis” (ko00061), and “Fatty acid metabolism” (ko01212) were significantly enriched from S3 to S4 (Figure 7c), suggesting that these pathways might be involved in the maturation of hemp seeds. Table S8 shows the detailed statistics of the transcriptome sequencing data from our study.

2.3. Correlation Analysis

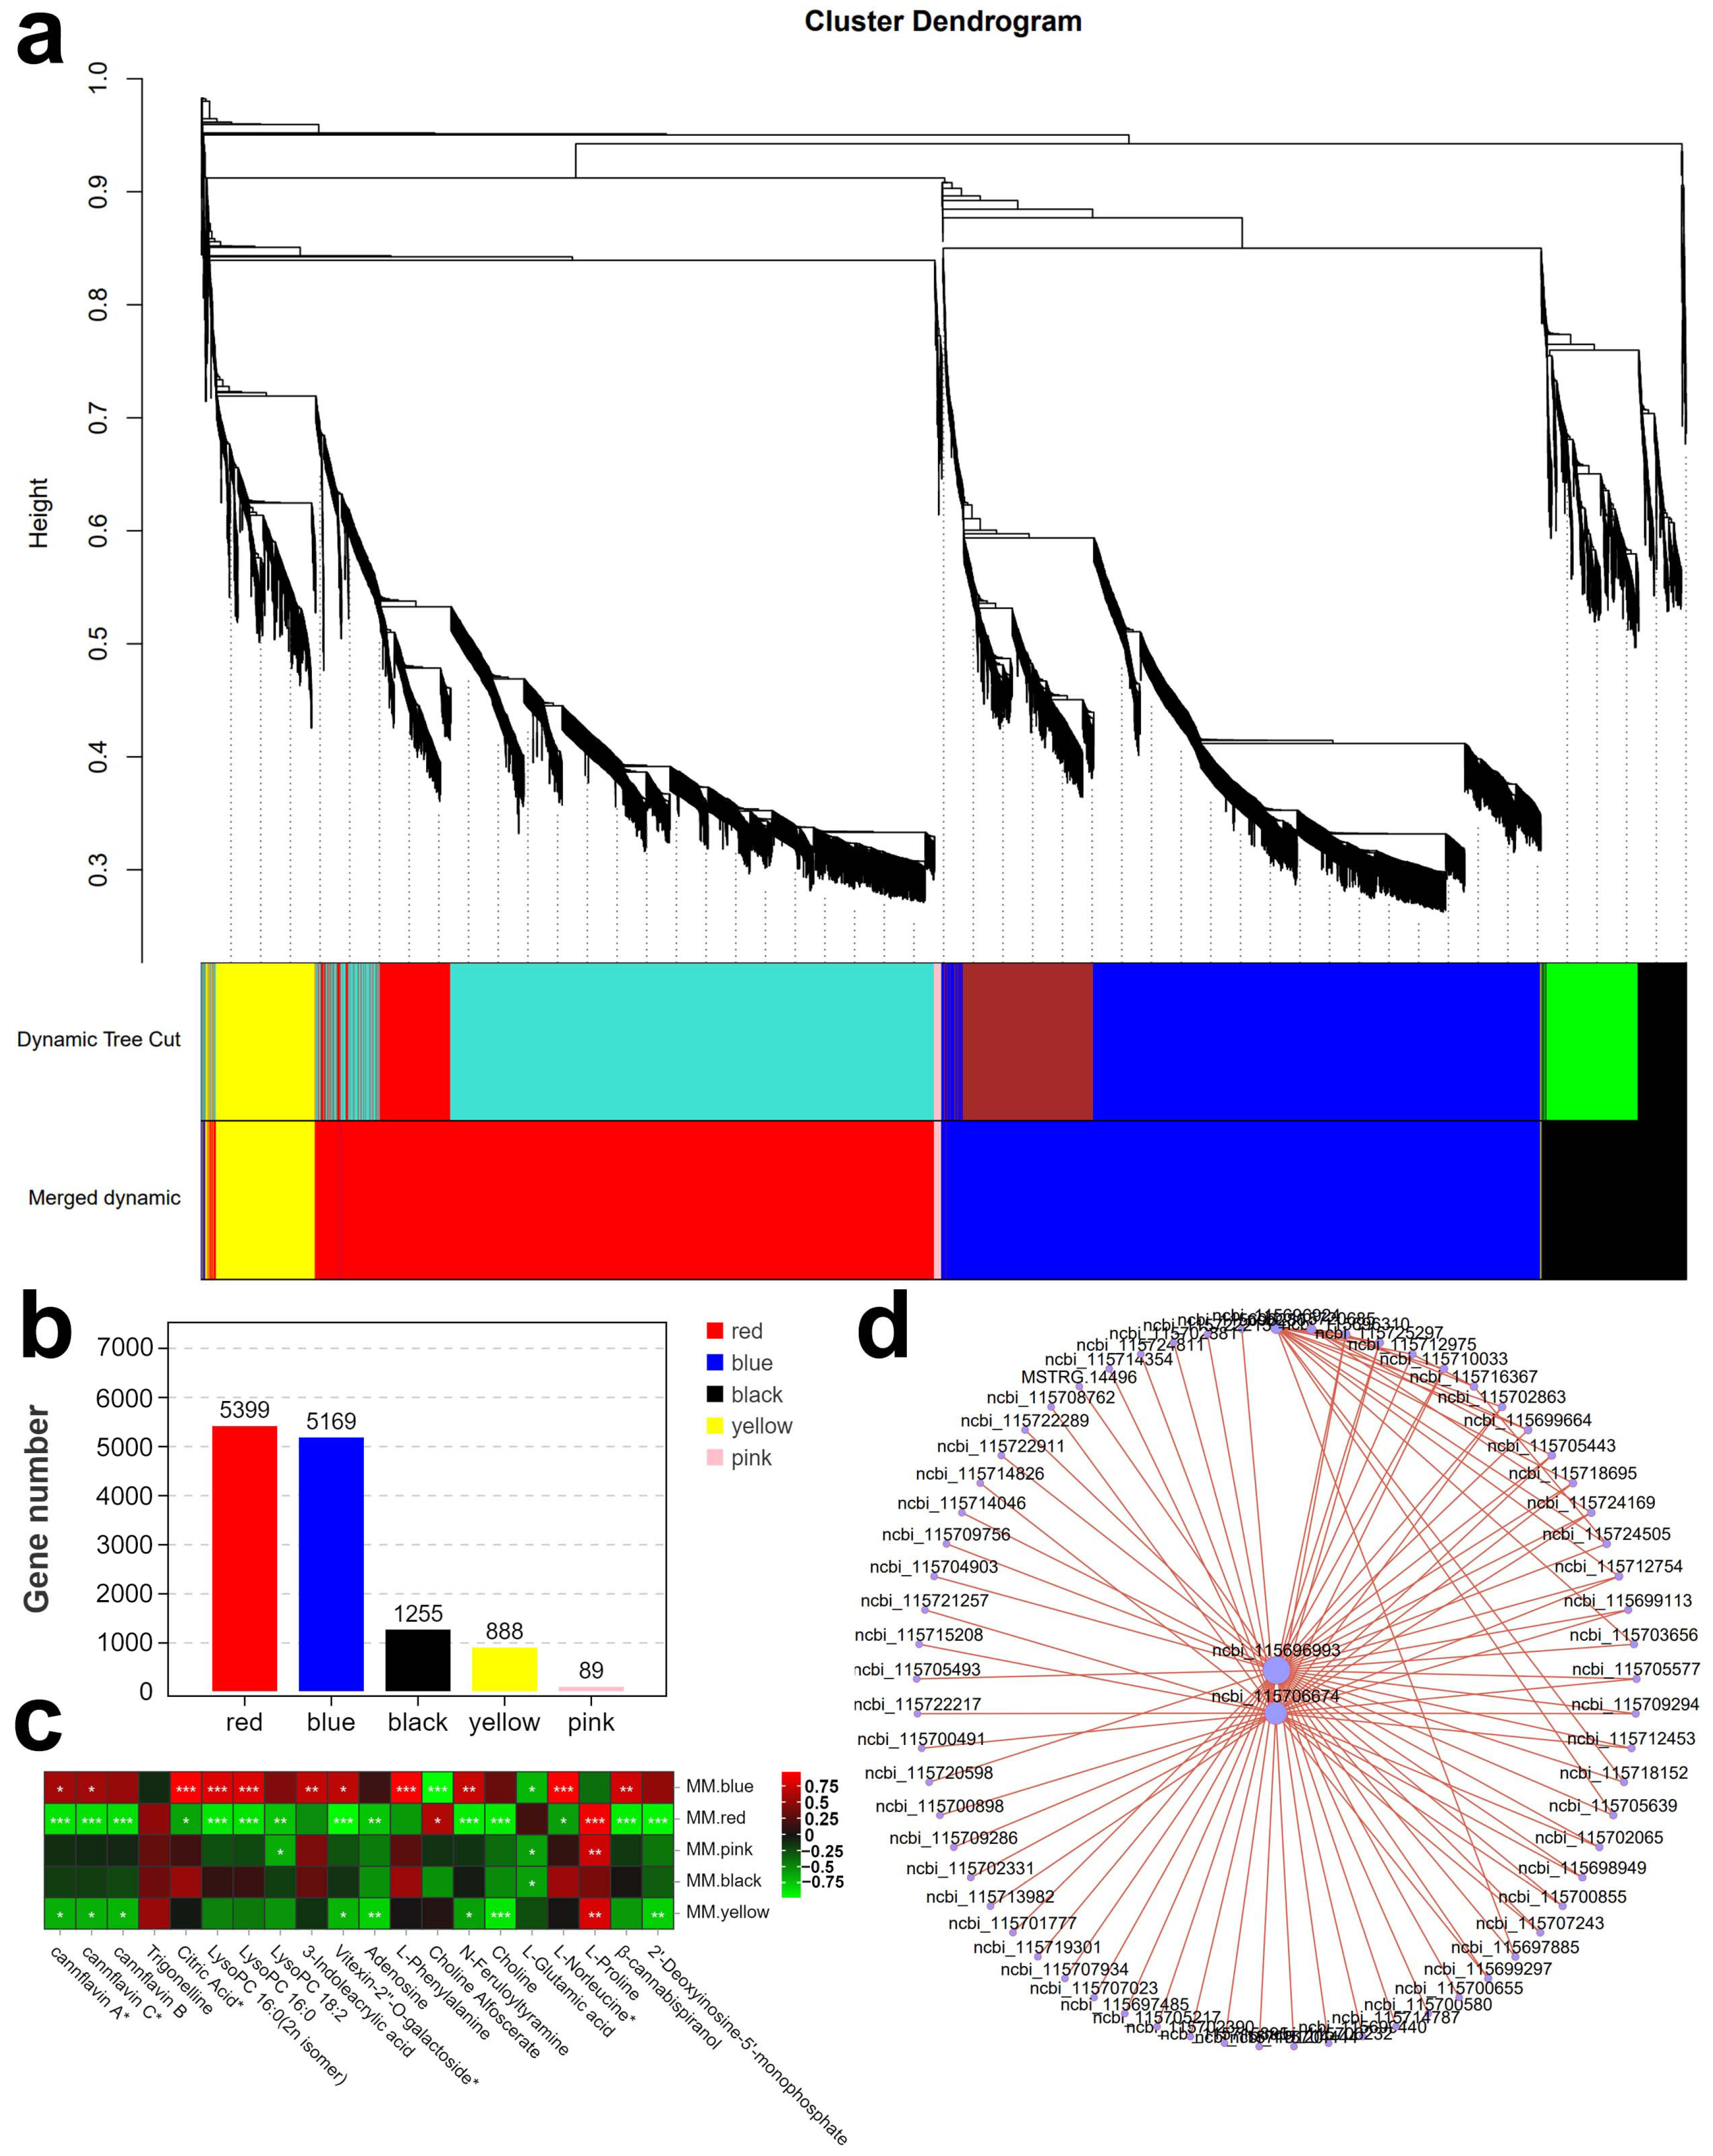
2.3.1. Weighted Gene Co-Expression Network Analysis (WGCNA)

We performed a WGCNA of the 20 most abundant metabolites from S1 to S4 to clarify the association between metabolite synthesis and DEGs in hemp seeds. We identified five DEG modules (Figure 8a), including the red (5399 DEGs), blue (5169 DEGs), black (1255 DEGs), yellow (888 DEGs), and pink (89 DEGs) modules (Figure 8b). Next, we conducted an association analysis of the 20 most abundant metabolites with DEGs in the five modules. We found that 11 of the 20 most abundant metabolites were significantly positively correlated with the blue module (Figure 8c). Next, we constructed an association network of the 100 most significant DEGs in the blue module (Figure 8d) and identified two DEGs at the central node, ncbi_115696993 and ncbi_115706674, which were significantly correlated with 131 and 84 DEGs, respectively. The gene ncbi_115696993 was related to “Photosynthesis—antenna proteins” (ko00196) according to the KEGG database; the gene ncbi_115706674 was related to “XP_030490249.1 thiol protease aleurain-like [Cannabis sativa]” according to the non-redundant protein database. These two genes might play a role in regulating the synthesis of metabolites in hemp seeds during the maturation process.

2.3.2. TF Genes Related to Metabolite Classes in Hemp Seeds Revealed by K-Means Clustering Analysis
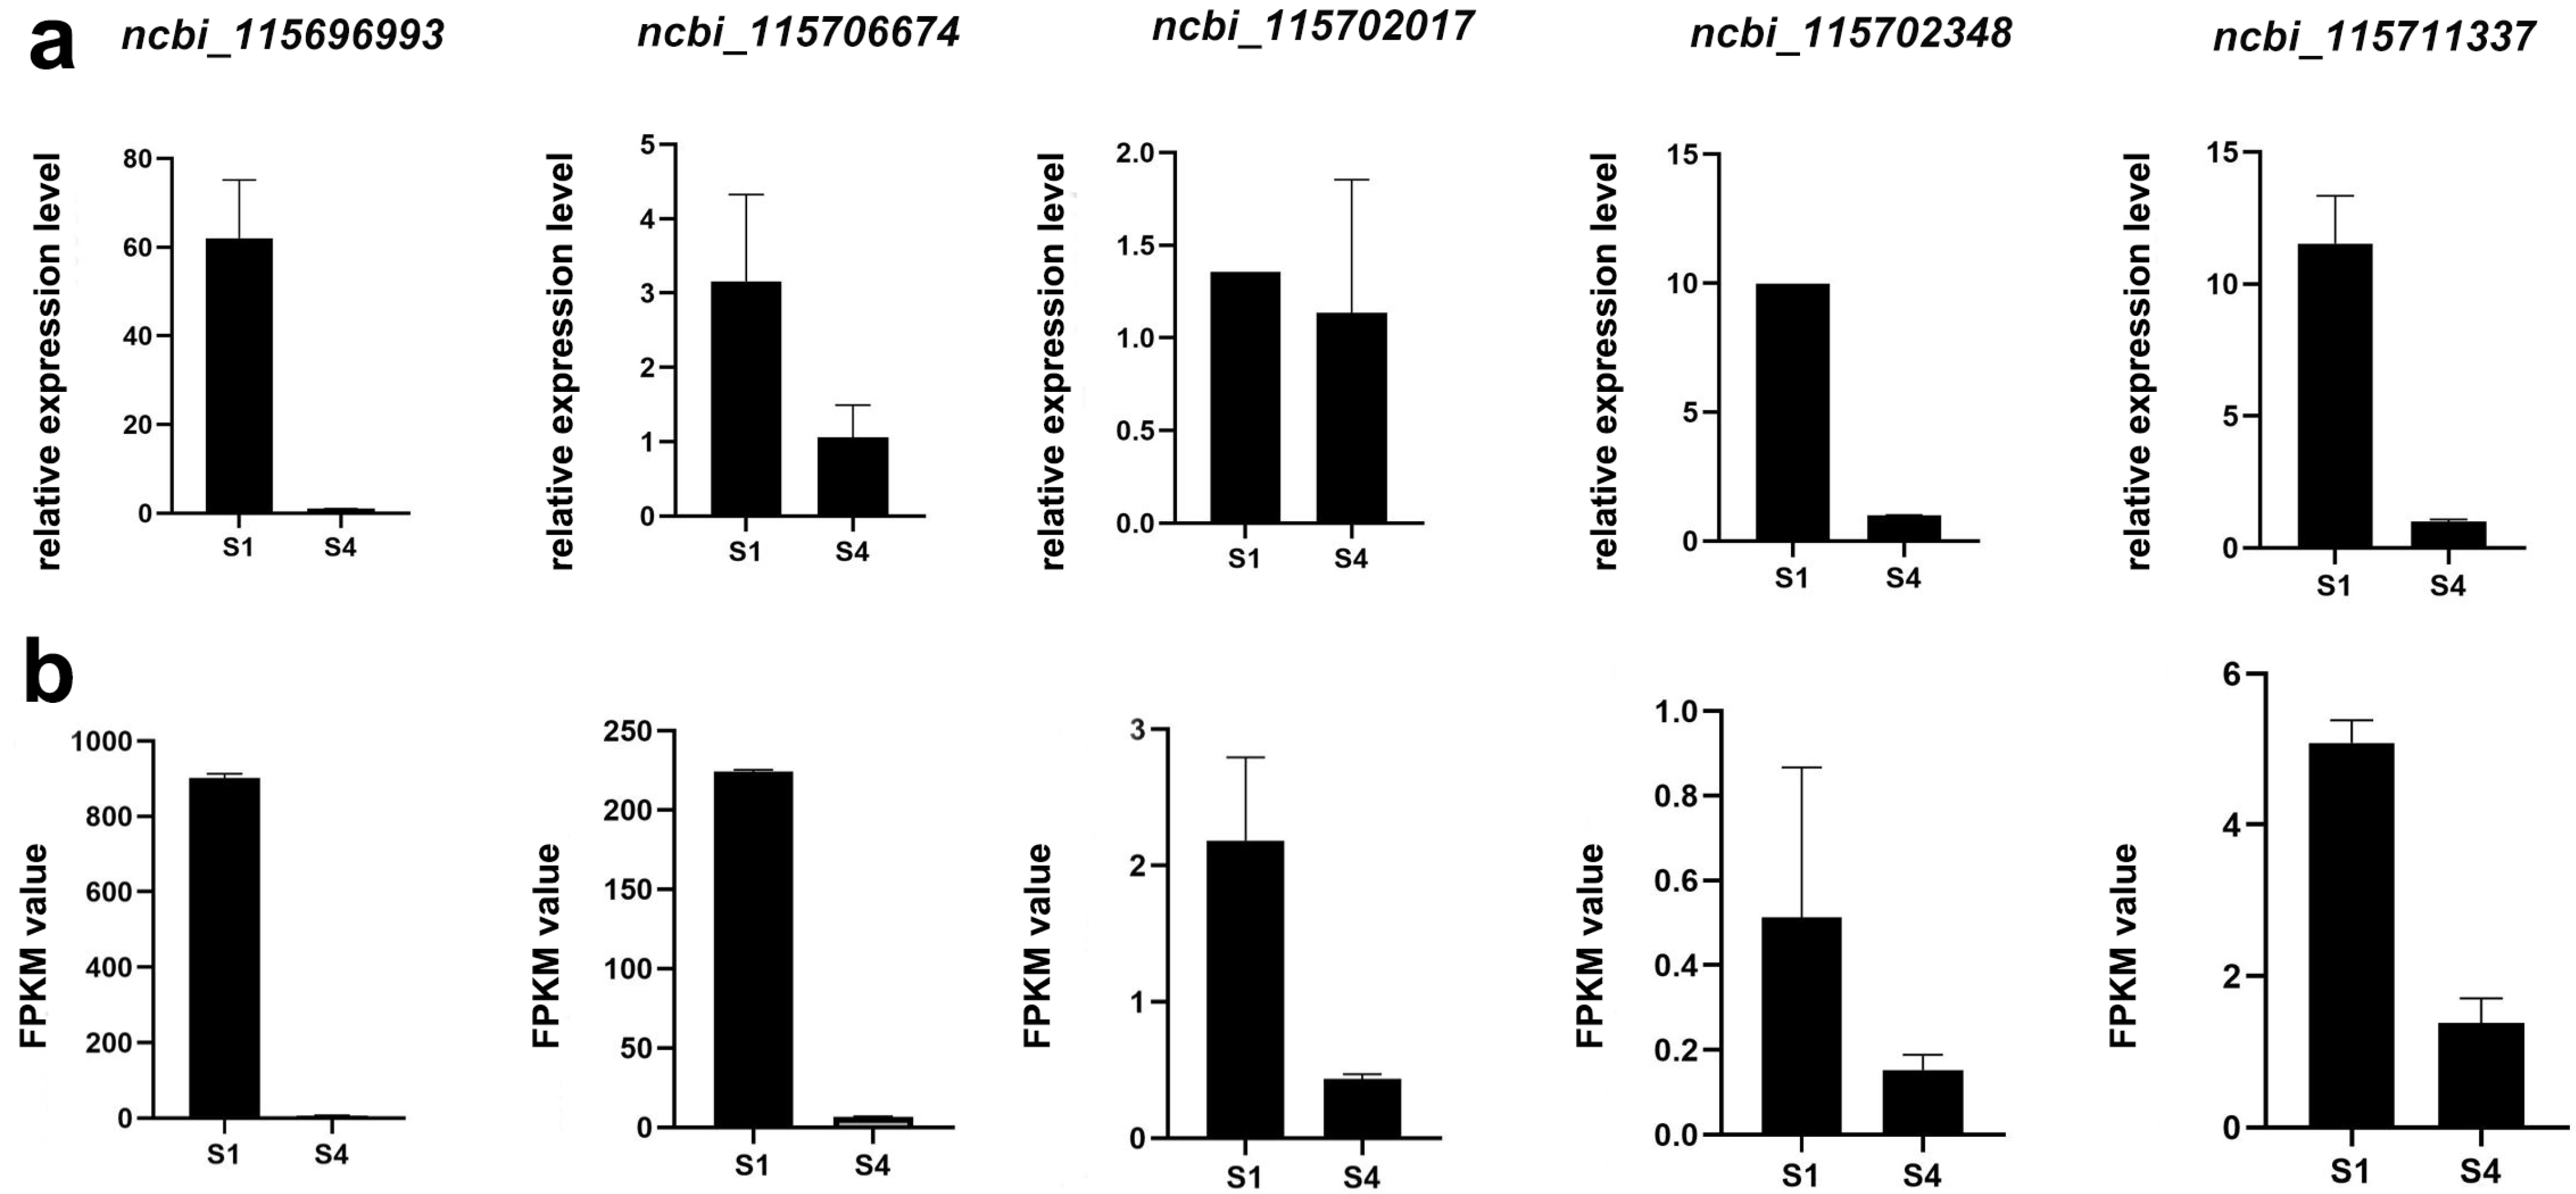
We identified the TFs associated with two classes of metabolites, revealed by K-means clustering analysis (Figure 3d), to identify the genes involved in regulating the maturation of hemp seeds. Pearson’s correlation coefficient analysis revealed two TF genes, ncbi_115718555 and ncbi_115712978, that were significantly related (p-value < 0.05) to metabolite class 1 (Table 1, Figure 3d, Table S5); there were 209 TF genes related to metabolite class 2, and the five most significant genes were ncbi_115711337, ncbi_115702017, ncbi_115698497, ncbi_115698755, and ncbi_115702348 (Table 1, Figure 3d, Table S5). The results of the correlation analysis of the TF genes are shown in Table S9. These TF genes play a role in regulating metabolite synthesis in hemp seeds.

2.4. qPCR Valid

The accuracy of the results of the correlation analysis of the transcriptome data was verified by conducting real time RT-qPCR (Figure 9) on five genes. Two genes, ncbi_115696993 and ncbi_115706674, were involved in “Photosynthesis—antenna proteins” and “XP_030490249.1 thiol protease aleurain-like [Cannabis sativa]” according to annotation of reference genome (Figure 9), and three genes, ncbi_115702017 (MYB), ncbi_115702348 (NAC) and ncbi_115711337 (GRAS), were belongs to TFs. The expression patterns of all five genes according to the RT-qPCR and transcriptome data were similar, which suggests that our transcriptome data were reliable. We provide primer sequences in Table S10.

3. Discussion

In this study, the advantages of integrating transcriptomics and metabolomics analyses are emphasized. While single omics sequencing data are prioritized, the combination of both omics can significantly enhance the information obtained from individual studies. Integrated omics analyses enable the mapping of metabolic pathways from gene expression to metabolite production, providing insights into the functional relationships between genes and metabolites. It is suggested that, in future research on pharmacological components, the use of multi-omics approaches, such as transcriptomics and metabolomics, would be more beneficial as they allows for the acquisition of a broader range of information that can be used to understand the complexities of biological systems and pave the way for innovative discoveries in pharmacology and functional genomics.
Hemp seeds are a traditional food source in the Bama region that have been consumed for hundreds of years by the local people, and previous studies have shown that the consumption of hemp seeds is associated with the high longevities of the local people [3,4,21,23,24]. In Bama, the local people typically crush the fresh seeds at different stages of maturity and add them to soups. In our study, we conducted a metabolomic and transcriptomic analysis of hemp seeds (harvest in Bama) at four stages of maturity and obtained several new findings.
Our metabolomic studies revealed that metabolites were more abundant in hemp seeds from the Bama region than in hemp seeds from other regions. A metabolomic analysis was recently conducted on seven hemp seed cultivars [5]; the results of this previous study provide a basis for comparison with the results of our study, given that the two studies were conducted using the same methodology. Hemp seeds from the Bama region are richer in flavonoid metabolites than hemp seeds from other regions, and high abundances of flavonoid metabolites were observed at each maturity stage in hemp seeds from the Bama region, including at S4, which was the maturity stage of the examined hemp seeds (Figure 2d). Flavonoids have been widely studied and have many beneficial biological activities, including anticancer, antidiabetic, antiviral, anti-heart disease, antimicrobial, antioxidant, and anti-Alzheimer activities; they have also been shown to promote the homeostasis of the intestinal flora [10,11,12,13,15]. A previous study reported that the high intake of flavonoids by the local people improves their physical health [14]. Our KEGG analysis of differentially accumulated metabolites and DEGs (Figure 4 and Figure 7) revealed that most metabolites and genes were significantly enriched in flavonoid metabolic pathways, and this was consistent with our finding that the hemp seeds from the Bama region are rich in flavonoid metabolites. Thus, the rich varieties and potentially high concentrations of flavonoid metabolites in hemp seeds from the Bama region, and the long-term consumption of these seeds by the local people, might contribute to their high longevity. However, because the results of our study were based on fresh samples, additional studies of the metabolites of dried hemp seeds from the Bama region are needed to confirm our findings. Similar studies of cooked and processed hemp seeds, such as soups containing hemp seeds and oil derived from hemp seeds, are also needed, given that these represent the final state of the hemp seeds prior to their ingestion by humans.
Hemp seeds from the Bama region were rich in several metabolites known to have human health benefits. Most of the 20 most abundant metabolites have been shown to have various health benefits (Figure 3a). The three most abundant metabolites in hemp seeds from the Bama region, cannflavin A, B, and C, as flavonoids, have been shown to have various health benefits, such as those mentioned above [26,27]. Trigonelline has been shown to have various biological activities, including anticancer and antidiabetic activities; it has also been shown to improve memory [28,29,30]. Citric acid is a food additive that is harmless to humans; it has various uses in the food industry and exhibits antibacterial and antiviral activities [31]. Vitexin shows various biological activities, including antioxidant, anticancer, and anti-inflammatory activities [32,33]. Choline is an essential nutrient for liver, muscle, and brain function, and both choline and choline alfoscerate have been shown to have anti-Alzheimer activity [9,34]. These findings suggest that hemp seeds from the Bama region provide various health benefits, and this might contribute to the good physical health of the local people. We found that the composition of metabolites differed substantially between S1 and S4 (Figure 3b,c), and transcriptome sequencing revealed the same pattern (Figure 5b); some of the most pronounced differences were observed in metabolites such as citric acid and choline, which were not detected in S4. By contrast, the composition of metabolites in S2 and S3 was similar. This indicates that hemp seeds at S2 and S3 might provide more health benefits when used as a food source. However, our findings regarding the main metabolites were not similar to those of Ning [5], and this might stem from differences in the culture environment and variety. Hemp from the Bama region is planted in a semi-natural environment because locals plant seeds on hillsides and let them grow until harvest.
We obtained a complete TF gene expression profile related to the metabolite synthesis (Table S9) of the hemp seeds during maturation, and this will aid in the molecular breeding and gene editing of hemp. The KEGG analysis revealed that DEGs in S3 and S4, which are the two final stages of the maturation process, were enriched in several pathways (Figure 7c). The “MAPK signaling pathway—plant (ko04016)” has been reported to be involved in the responses of plants to various types of biotic and abiotic stress [35]; DEGs involved in “Fatty acid biosynthesis (ko00061) and Fatty acid metabolism (ko01212)” could be further studied to enhance our understanding of the oil accumulation process in hemp seeds, given that hemp seed oil is an excellent cooking oil with various health benefits [16,17,18]. Transcriptome sequencing revealed that the concentration of metabolites in hemp seeds decreased during the maturation process, and this was reflected by the continuous decrease in the number of DEGs from S1 to S4 (Figure 5c,d). The same pattern was observed in the GO analysis, which provided insights into the intensities of different biological activities (Figure 6). The same patterns were also observed in our metabolomic analysis (Figure 3a), which indicates that the observed DEGs were highly correlated with the abundances of metabolites; this information aids in the identification of genes that might regulate important metabolites in hemp seeds. WGCNA revealed the gene modules associated with major metabolites and two node genes with high connectivity were identified using the co-expression networks (Figure 8). These two genes are not members of the same TF family; ncbi_115696993 was related to “antenna proteins,” whereas ncbi_115706674 was related to “thiol protease aleurain-like.” Antenna proteins (ncbi_115696993) regulate plant photosynthesis [36], and the function of ncbi_115706674 remains unclear. Additional studies are thus needed to clarify the functions of these two genes in regulating the synthesis of beneficial metabolites in hemp seeds; such studies will also aid in improvements in germplasm resources.
The diverse array of metabolites present in hemp seeds, including 233 flavonoids, 214 phenolic acids, and 43 lignans and coumarins, which are known for their antioxidant and anti-inflammatory properties, contain anti-cancer properties, contributing to overall health and well-being. The presence of 159 lipids in hemp seeds plays a crucial role in supporting cardiovascular health and providing essential fatty acids for various physiological functions [37]. Hemp seeds contain 118 amino acids and derivatives and 71 nucleotides and derivatives, which are essential for protein synthesis, as well as essential for DNA and RNA synthesis, muscle repair, cell signaling, and energy metabolism. With 100 alkaloids, hemp seeds may offer bioactive compounds with potential pharmacological effects on human health (Figure 2). The 100 organic acids found in hemp seeds contribute to metabolic processes and may have implications for digestive health and nutrient absorption. The 14 terpenoids, 13 tannins, and 166 other compounds have potential anti-inflammatory, antioxidant, neuroprotective effects, potential benefits for gut health, and other metabolites that may play diverse roles in promoting health and well-being. These metabolites offer antioxidant, anti-inflammatory, neuroprotective, and other health-promoting effects, potentially contributing to the longevity and well-being of individuals such as the Bama people.
Transcription factors (TFs) play a crucial role in orchestrating gene expression patterns and regulatory networks throughout the developmental stages of hemp seeds. Our study delves into the dynamic interplay between TFs and metabolite synthesis across different maturity stages, shedding light on the regulatory mechanisms that govern hemp seed development [37]. During the early stages of seed development, TFs regulate the expression of biosynthetic genes responsible for synthesizing key metabolites that are crucial for seed growth and development. TFs coordinate the expression of genes involved in lipid, protein, and carbohydrate metabolism to support seed development. We predicted the gene sets of 221 TF genes that regulate the synthesis of metabolites in hemp seeds according to k-means analysis (Table S9). This gene set can be used as a functional gene database to identify genes involved in regulating the synthesis of metabolites as well as their physical locations. TFs interact with hormonal signaling pathways to coordinate growth, development, and response to environmental cues during seed maturation. In short, the expression patterns of TFs vary across different maturity stages, reflecting the temporal regulation of metabolic pathways and seed development. Overall, by elucidating the role of transcription factors across different maturity stages in hemp seeds, we gain a comprehensive understanding of the regulatory mechanisms that govern seed development and metabolite synthesis.

4. Materials and Methods

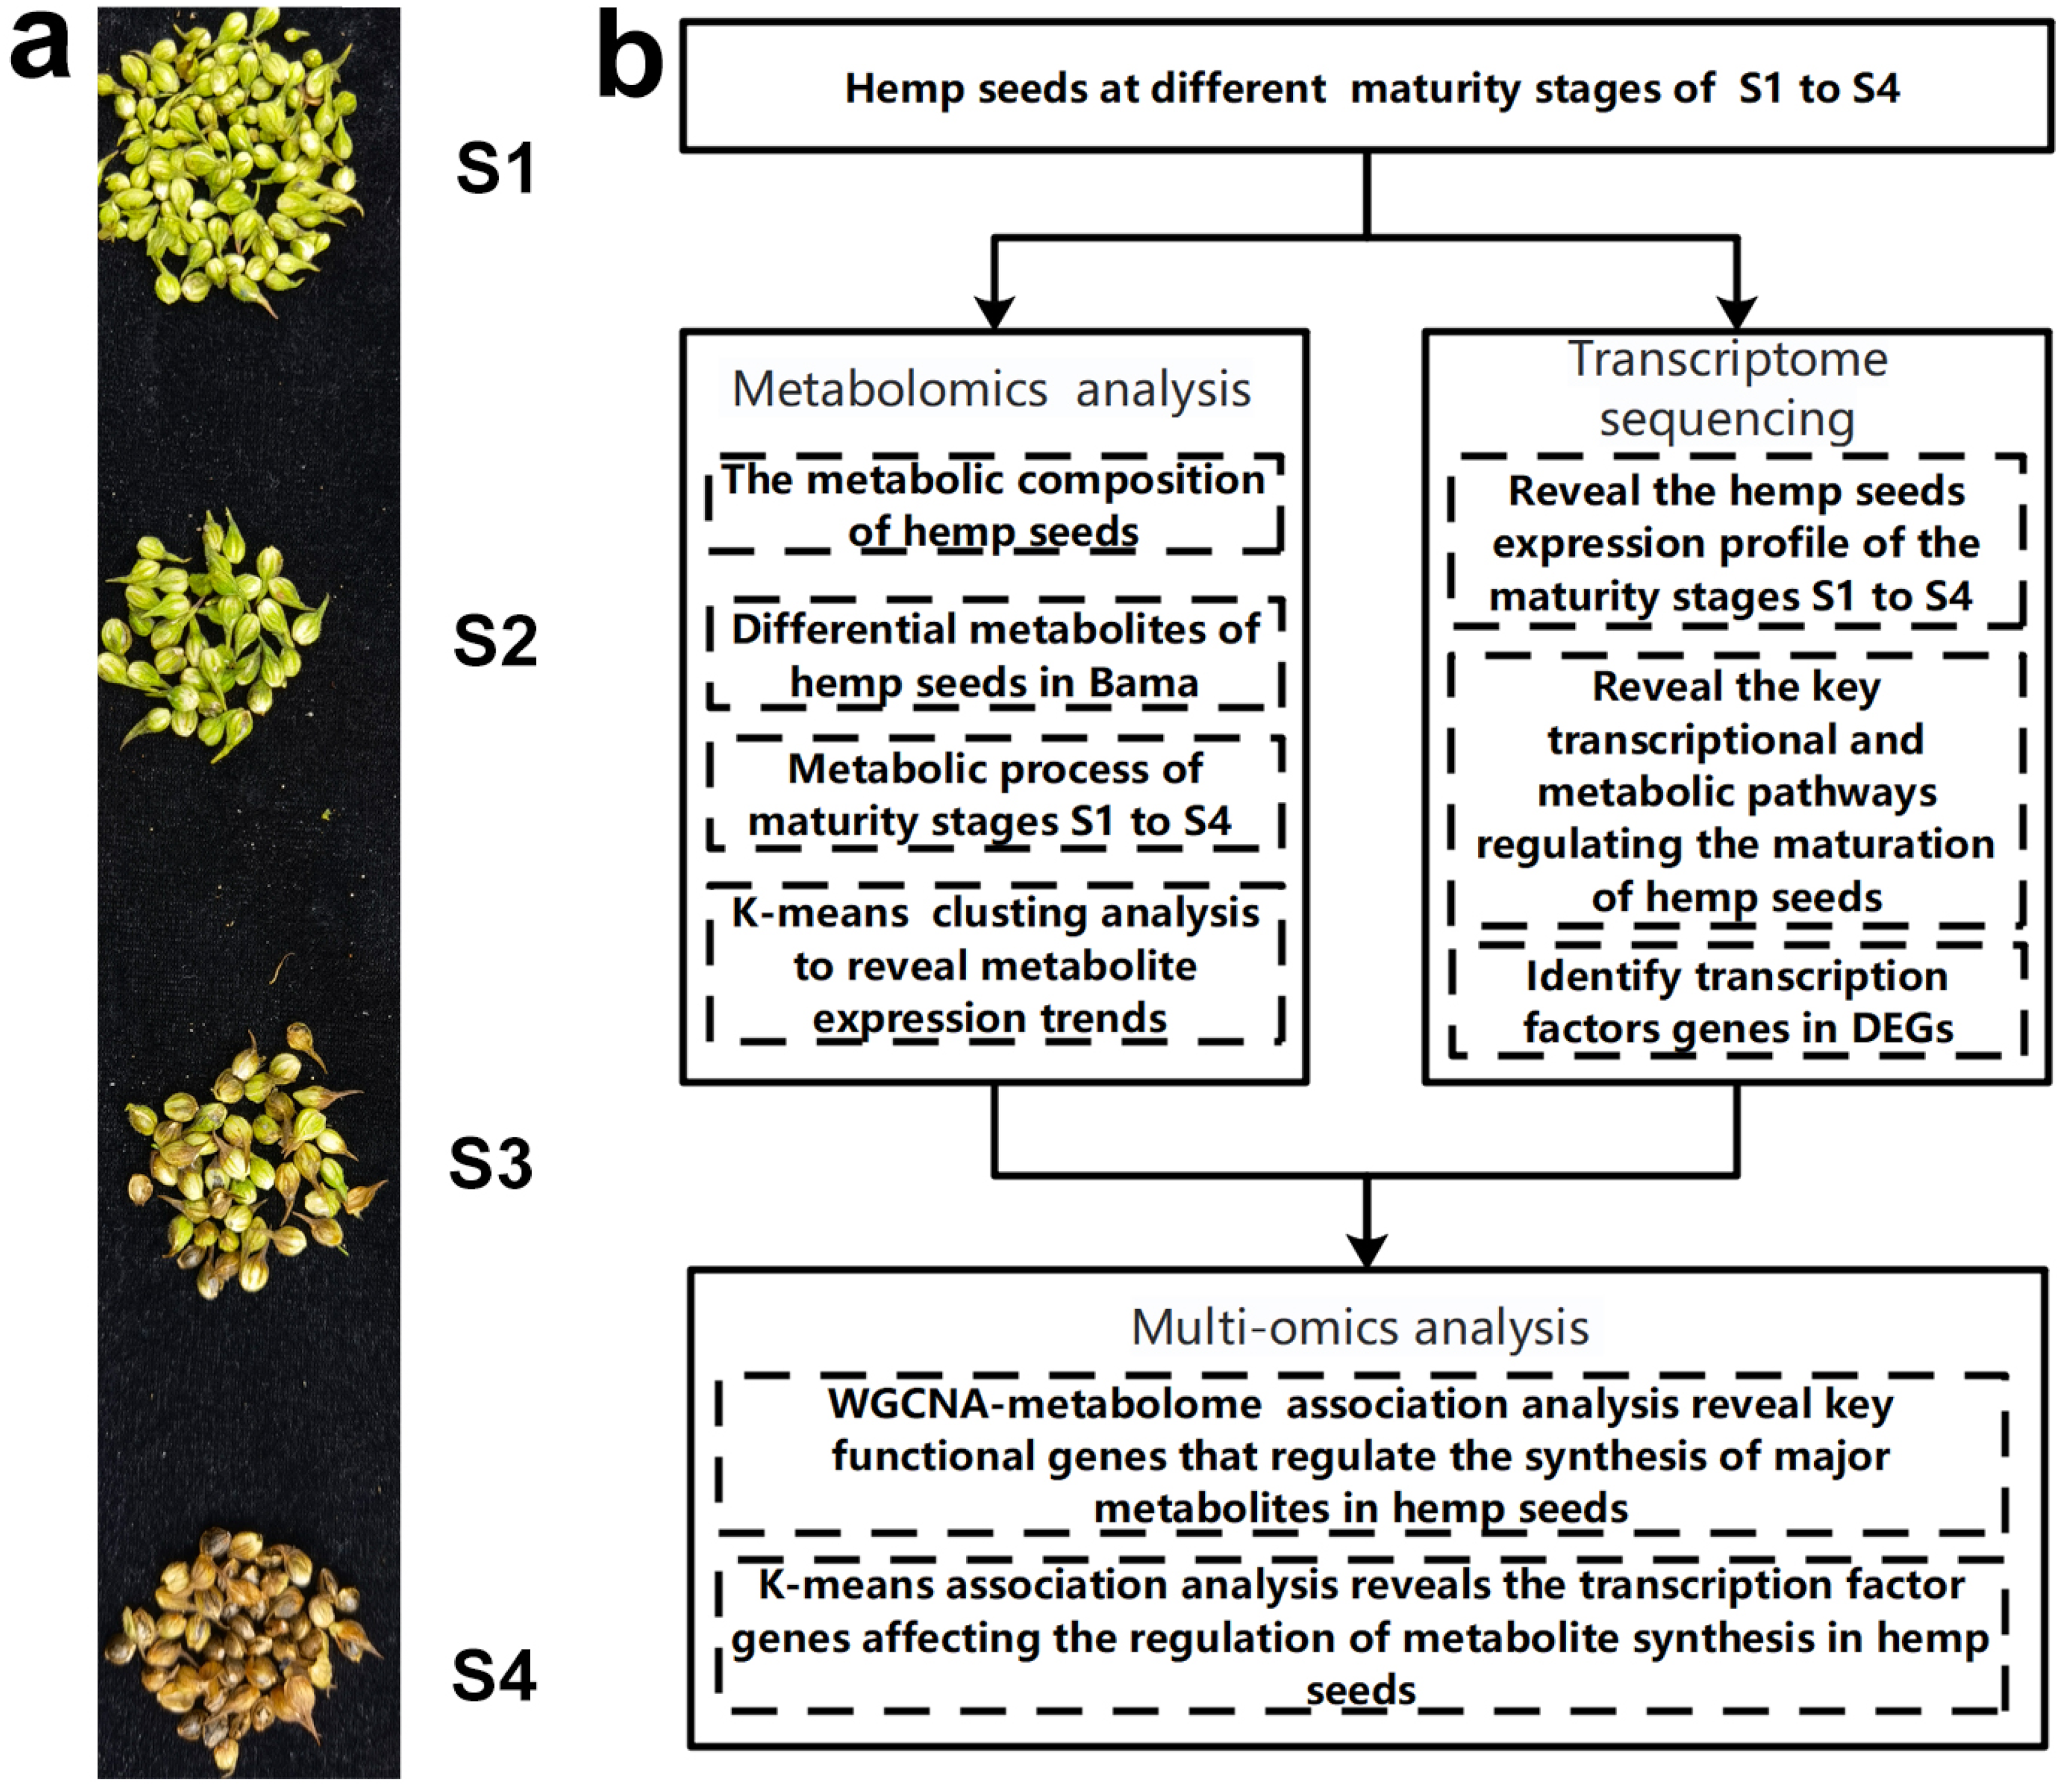
4.1. Sampling and Experimental Procedures

Hemp seeds were collected from Bama Yao Autonomous County, Hechi City, Guangxi, China (24°9′ N, 107°15′ E), in November 2021. The hemp seeds were collected on a wet hillside at an elevation of approximately 700 m. Seeds at different stages of maturity were collected from the same plant. Hemp seeds were collected from three plants, and seeds at different maturity stages were collected from each plant. The seeds were then divided into four stages according to their maturity level (Figure 1a). After the seeds were collected, they were frozen immediately in liquid nitrogen and then stored in a refrigerator at −80 °C. Samples were analyzed using several analytical approaches to characterize the composition of metabolites and the regulatory factors controlling the expression of genes involved in the synthesis of key metabolites in seeds during the maturation process.

4.2. Targeted Metabolome Analysis

We conducted a targeted metabolome analysis using ultra-high-performance liquid chromatography–electrospray ionization–tandem mass spectrometry (UHPLC–ESI–MS/MS) to characterize differences in the composition of metabolites in hemp seeds at different stages of maturity at Metware Biotechnology Co., Ltd. (Wuhan, China) using previously described methods [5,38]. The samples were freeze-dried for 48 h and ground into powder. Next, 70% aqueous methanol (0.6 mL) was used to extract approximately 100 mg of the powder, and a UHPLC–ESI–MS/MS system (UHPLC, Shim-pack UFLC Shimadzu CBM30A system, Kyoto, Japan; MS, Applied Biosystems 4500 Q TRAP, Framingham, MA, USA) was used to analyze the extract. Three biological replicates were performed for each tissue. Quality control samples comprising all the sample extracts were used to evaluate the accuracy of the measurements of each sample.
The self-built database MWDB (v2.0; Metware Biotechnology Co., Ltd., Wuhan, China) and publicly available databases, such as MassBank (http://www.massbank.jp; accessed on 8 January 2023), HMDB (Human Metabolome Database; http://www.hmdb.ca; accessed on 15 February 2023), and METLIN (http://metlin.scripps.edu/index.php; accessed on 23 March 2023), were used to qualitatively analyze the primary and secondary mass spectrometry data. Triple-quadrupole mass spectrometry in the multiple reaction monitoring mode was used to quantitatively analyze the metabolites. The mass spectrometry files were accessed, and the peaks were integrated and corrected using MultiQuant (v3.0.2) software. The relative content of each metabolite was indicated by the area of each chromatographic peak; the content of each metabolite in the different samples was determined after integrating and correcting the mass spectra. A comparison of the retention time and peak pattern of each metabolite was made to determine their abundances in the various samples.
Analyst 1.6.3 software (AB Sciex, Framingham, MA, USA) was used to process the raw data. The data were normalized and the variance in the data was decreased by log10-transforming the original abundances of the metabolites. The metabolite data were analyzed using principal component analysis (PCA), and cluster analysis in R (http://www.r-project.org/; accessed on 22 April 2023) via the procedures described in a previous study [39]. The following criteria were used to identify differentially accumulated metabolites among different tissue types (e.g., mycelia vs. cap): fold change ≥2 and ≤0.5. In addition, a Kyoto Encyclopedia of Genes and Genomes (KEGG) pathway analysis was conducted of the differentially accumulated metabolites. Significantly enriched pathways (p < 0.05) were identified using a hypergeometric test.

4.3. Transcriptome Sequencing

First, we ground and crushed the hemp seed samples that had been stored in liquid nitrogen, and each group (S1 to S4) underwent three repetitions. The TRIzol reagent (Invitrogen, Carlsbad, CA, USA) was used to extract total RNA from 0.1 g samples following the manufacturer’s protocol; sequencing was then conducted using an Illumina Novaseq 6000 system at Gene Denovo Biotechnology Co., Ltd. (Guangzhou, China).
Fastp (v0.18.0) software was used to filter the raw reads and obtain high-quality reads; raw reads were filtered by removing reads containing adapters, reads with more than 10% unknown nucleotides, and reads with more than 50% low-quality bases (Q-value ≤ 30) [40]. The high-quality reads were then aligned to the reference genome of HARVARD OEB (2019) (https://www.ncbi.nlm.nih.gov/data-hub/taxonomy/3483/; accessed on 3 July 2023). After an index of the reference genome was made, HISAT (v2.2.4) [41] with “-rna-strandness RF” and other default parameters was used to map paired-end clean reads to the reference genome. StringTie (v1.3.1) [42,43] was used to assemble the mapped reads of each sample. RSEM (v1.3.3) [44] software was used to calculate fragment per kilobase of transcript per million mapped reads (FPKM) values to quantify the expression of genes and variation in gene expression among comparison groups [44]. The differential expression of genes between groups was analyzed using the DESeq2 package (v1.36) [45]. Differentially expressed genes (DEGs) were identified using the following criteria: false discovery rate (FDR) less than 0.05 and absolute fold change greater than 2. TFs identification was performed according to the annotation reference genome. DEGs in the different comparison groups were compared using Venn analysis, which was conducted using the VennDiagram package (v1.6.16) in R [46].
Gene Ontology (GO) [47] and Kyoto Encyclopedia of Genes and Genomes (KEGG) [48] analyses were conducted on the DEGs. An FDR threshold of ≤0.05 was used to identify significant DEGs associated with specific GO terms and KEGG pathways relative to the genome background.

4.4. Weighted Gene Co-Expression Network Analysis (WGCNA)

The WGCNA (v1.47) package in R [49] was used to construct co-expression networks. After genes, from all detected DEGs, were filtered (FPKM > 5), co-expression modules were constructed according to the imported gene expression values in WGCNA. An automatic network construction, along with the function blockwiseModules, with default settings, was used to construct co-expression modules; however, the softpower was 8, TOMType was 100, and the minModuleSize was 50. Genes were clustered into five correlated modules. The correlation coefficients between samples were calculated using the module eigengenes to identify modules with metabolite enrichment. The WGCNA package in R was used to calculate the intramodular connectivity degree of each gene [49]. The module eigengenes and expression levels of the 20 most abundant metabolites were used to conduct a correlation analysis. Pearson’s correlation coefficients were calculated between each gene and trait in the most relevant modules (positive correlations and negative correlations) for the 20 most abundant metabolites, and this information was used to evaluate the significance of each gene. Cytoscape_3.3.0 software was used to visualize the networks [50].

4.5. Transcription Factor (TF) and K-Means Clustering Analysis of Metabolites

The metabolite classes obtained from the K-means clustering analysis were converted to percentage data. The relevant methods can be found in the reference of Duan [51]. The OmicShare tool (https://www.omicshare.com/tools; accessed on 16 July 2023) was then used to calculate and analyze Pearson’s correlation coefficients between all the TF genes and the percentage data in each metabolite class. The significance (p < 0.05) of the relationships between TF genes and each metabolite class was then evaluated.

4.6. Quantitative Polymerase Chain Reaction (qPCR)

The ZOMAN Biotechnology kit (ZOMANBIO; Beijing, China) was used to extract total RNA (according to the manufacturer’s instructions) from samples at the four maturity stages (S1, S2, S3, and S4); the iScript Cdna Synthesis Kit (Bio-Rad Laboratories, Inc., Hercules, CA, USA) was then used to reverse-transcribe the extracted RNA (2 μg of RNA with an OD260/OD280 of 1.9–2.0) to cdna. The method for quantitative polymerase chain reaction (qPCR) was referenced from Duan et al. [51]. The expression of five genes in the transcriptome data was validated using real-time RT-qPCR with SYBR Green Master Mix (Thermo Fisher Scientific, Waltham, MA, USA) and a QuantStudio™ Flex Real-Time PCR System; three technical replicates were performed for each sample. The RNA expression levels were normalized using the housekeeping gene EF1a; the 2−ΔΔCt equation was used to calculate fold changes in expression levels (RT-qPCR primer are represented in Table S10). The specificity of the primers for each gene was evaluated using melting curve analysis. Primer Premier 5 software was used to design RT-qPCR primers. The bar graph was plotted and calculated using GraphPad Prism software (Version 9.3.0).

5. Conclusions

To conclude, metabolomic analyses were conducted of hemp seeds from the Bama region at four maturity stages, revealing a total of 1231 metabolites across 11 classes. Notably, the metabolomic analyses showed that hemp seeds from the Bama region contain a greater number of flavonoid metabolites compared with those from different regions of China. Some of the metabolites with the greatest health benefits include cannflavin, trigonelline, citric acid, vitexin, choline alfoscerate, and choline, which may potentially contribute to the longevity of the Bama people. Furthermore, the transcriptomic and metabolomic analyses indicated a gradual decrease in gene expression and metabolite accumulation during seed maturation. Overall, the study provides valuable insights into the metabolic substances during seed maturation and identifies candidate genes that could be utilized for future genetic engineering to improve the exiting germplasm resources.
The identification of candidate genes associated with metabolite synthesis and regulation opens up avenues for future genetic engineering efforts aimed at enhancing the existing germplasm resources of hemp seeds. By leveraging the findings from this study, researchers and breeders can explore genetic manipulation strategies to further improve the nutritional quality and health benefits of hemp seeds, ultimately benefiting both the local community in the Bama region and broader agricultural practices.
In future, in the exploration of the health benefits associated with metabolites found in hemp seeds, it is essential to bridge the gap between identification and practical applications through in vitro and in vivo studies. By incorporating application studies, researchers can provide valuable insights into the potential therapeutic and functional properties of hemp seed metabolites. These application studies will not only validate the health-promoting potential of hemp seed metabolites but will also pave the way for the development of functional foods, nutraceuticals, and pharmaceuticals that harness the therapeutic properties of these natural compounds.

Supplementary Materials

The following supporting information can be downloaded at: https://www.mdpi.com/article/10.3390/agronomy14040787/s1. Table S1. Metabolite statistics of stage S1 to S4 of Bama hemp seeds. The relative quantitative according to peak area. Table S2. Differential metabolite statistics between S1 vs. S2. Table S3. Differential metabolite statistics between S2 vs. S3. Table S4. Differential metabolite statistics between S3 vs. S4. Table S5. Metabolite statistics for K-means clustering analysis. Table S6. Statistics of the transcriptome sequences from S1 to S4 stages. Table S7. Statistics of Transcription factor(TF) from DEGs in S1 to S4 growth stages. Table S8. Transcriptome sequencing statistics form maturity of S1 to S4 stages of Hemp seeds. Table S9. Statistics of metabolome K-means clusting analysis related TFs. Table S10. Primer sequences for qPCR.

Author Contributions

Conceptualization, L.W.; methodology, M.D., M.J.R. and L.W.; software, M.D.; formal analysis, L.W.; investigation, Q.L., M.D., F.Z., H.F., S.H., B.L., J.Z. and D.H.; data curation, M.D. and M.J.R.; writing—original draft preparation, M.D. and M.J.R.; writing—review and editing, L.W.; supervision, L.W.; project administration, L.W. and M.D.; funding acquisition, L.W. All authors have read and agreed to the published version of the manuscript.

Funding

This research was funded by the Project of Bama County for Talents in Science and Technology (No. 20210013). It was also supported by Science Technology and Innovation Commission of Shenzhen Municipality of China (ZDSYS20200811142605017), Innovation Program of Chinese Academy of Agricultural Sciences and the Elite Young Scientists Program of CAAS.

Data Availability Statement

The raw transcriptome sequencing dataset is available in the NCBI Sequence Read Archive PRJNA936273.

Acknowledgments

We thank Jintuan Shang, Dawen Ma, Sheng Chen, Yifeng Wei and Xiqin Wei for their help in the process of road-guiding and material collection for this study.

Conflicts of Interest

The authors declare no conflicts of interest.

References

  1. Small, E. Evolution and Classification of Cannabis sativa (Marijuana, Hemp) in Relation to Human Utilization. Bot. Rev. 2015, 81, 189–294. [Google Scholar] [CrossRef]
  2. Eržen, M.; Košir, I.J.; Ocvirk, M.; Kreft, S.; Čerenak, A. Metabolomic Analysis of Cannabinoid and Essential Oil Profiles in Different Hemp (Cannabis sativa L.) Phenotypes. Plants 2021, 10, 966. [Google Scholar] [CrossRef] [PubMed]
  3. Xu, Y.; Li, J.; Zhao, J.; Wang, W.; Griffin, J.; Li, Y.; Bean, S.; Tilley, M.; Wang, D. Hempseed as a nutritious and healthy human food or animal feed source: A review. Int. J. Food Sci. Technol. 2021, 56, 530–543. [Google Scholar] [CrossRef]
  4. Brand, E.J.; Zhao, Z. Cannabis in Chinese Medicine: Are Some Traditional Indications Referenced in Ancient Literature Related to Cannabinoids? Front. Pharmacol. 2017, 8, 108. [Google Scholar] [CrossRef] [PubMed]
  5. Ning, K.; Hou, C.; Wei, X.; Zhou, Y.; Zhang, S.; Chen, Y.; Yu, H.; Dong, L.; Chen, S. Metabolomics Analysis Revealed the Characteristic Metabolites of Hemp Seeds Varieties and Metabolites Responsible for Antioxidant Properties. Front. Plant Sci. 2022, 13, 904163. [Google Scholar] [CrossRef] [PubMed]
  6. Schluttenhofer, C.; Yuan, L. Challenges towards Revitalizing Hemp: A Multifaceted Crop. Trends Plant Sci. 2017, 22, 917–929. [Google Scholar] [CrossRef] [PubMed]
  7. House, J.D.; Neufeld, J.; Leson, G. Evaluating the Quality of Protein from Hemp Seed (Cannabis sativa L.) Products through the use of the Protein Digestibility-Corrected Amino Acid Score Method. J. Agric. Food Chem. 2010, 58, 11801–11807. [Google Scholar] [CrossRef] [PubMed]
  8. Rashid, A.; Ali, V.; Khajuria, M.; Faiz, S.; Gairola, S.; Vyas, D. GC-MS based metabolomic approach to understand nutraceutical potential of Cannabis seeds from two different environments. Food Chem. 2021, 339, 128076. [Google Scholar] [CrossRef] [PubMed]
  9. Rao, M.J.; Feng, B.; Ahmad, M.H.; Tahir, M.; Aslam, M.Z.; Khalid, M.F.; Hussain, S.; Zhong, R.; Ali, Q.; Xu, Q.; et al. LC-MS/MS-based metabolomics approach identified novel antioxidant flavonoids associated with drought tolerance in citrus species. Front. Plant Sci. 2023, 14, 1150854. [Google Scholar] [CrossRef] [PubMed]
  10. Perez-Vizcaino, F.; Fraga, C.G. Research trends in flavonoids and health. Arch. Biochem. Biophys. 2018, 646, 107–112. [Google Scholar] [CrossRef] [PubMed]
  11. Rao, M.J.; Duan, M.; Yang, M.; Fan, H.; Shen, S.; Hu, L.; Wang, L. Novel insights into anthocyanin metabolism and molecular characterization of associated genes in sugarcane rinds using the metabolome and transcriptome. Int. J. Mol. Sci. 2022, 23, 338. [Google Scholar] [CrossRef] [PubMed]
  12. Lu, M.F.; Xiao, Z.T.; Zhang, H.Y. Where do health benefits of flavonoids come from? Insights from flavonoid targets and their evolutionary history. Biochem. Biophys. Res. Commun. 2013, 434, 701–704. [Google Scholar] [CrossRef] [PubMed]
  13. Chen, A.Y.; Chen, Y.C. A review of the dietary flavonoid, kaempferol on human health and cancer chemoprevention. Food Chem. 2013, 138, 2099–2107. [Google Scholar] [CrossRef] [PubMed]
  14. Hardcastle, A.C.; Aucott, L.; Reid, D.M.; Macdonald, H.M. Associations between dietary flavonoid intakes and bone health in a scottish population. J. Bone Miner. Res. 2011, 26, 941–947. [Google Scholar] [CrossRef] [PubMed]
  15. Yao, L.H.; Jiang, Y.M.; Shi, J.; Tomás-Barberán, F.A.; Datta, N.; Singanusong, R.; Chen, S.S. Flavonoids in Food and Their Health Benefits. Plant Foods Hum. Nutr. 2004, 59, 113–122. [Google Scholar] [CrossRef] [PubMed]
  16. Gómez Candela, C.; Bermejo López, L.M.; Loria Kohen, V. Importance of a balanced omega 6/omega 3 ratio for the maintenance of health: Nutritional recommendations. Nutr. Hosp. 2011, 26, 323–329. [Google Scholar] [CrossRef] [PubMed]
  17. Simopoulos, A.P. The Importance of the Omega-6/Omega-3 Fatty Acid Ratio in Cardiovascular Disease and Other Chronic Diseases. Exp. Biol. Med. 2008, 233, 674–688. [Google Scholar] [CrossRef] [PubMed]
  18. Majewski, M.; Jurgoński, A. The Effect of Hemp (Cannabis sativa L.) Seeds and Hemp Seed Oil on Vascular Dysfunction in Obese Male Zucker Rats. Nutrients 2021, 13, 2575. [Google Scholar] [CrossRef] [PubMed]
  19. Yan, X.; He, S. The co-evolution of therapeutic landscape and health tourism in bama longevity villages, China: An actor-network perspective. Health Place 2020, 66, 102448. [Google Scholar] [CrossRef] [PubMed]
  20. Huang, L.; Xu, H. Therapeutic landscapes and longevity: Wellness tourism in Bama. Soc. Sci. Med. 2018, 197, 24–32. [Google Scholar] [CrossRef]
  21. Ren, M.; Li, H.; Fu, Z.; Li, Q. Centenarian-Sourced Lactobacillus casei Combined with Dietary Fiber Complex Ameliorates Brain and Gut Function in Aged Mice. Nutrients 2022, 14, 324. [Google Scholar] [CrossRef] [PubMed]
  22. Ye, S.; Ma, L.; Zhang, R.; Liu, F.; Jiang, P.; Xu, J.; Cao, H.; Du, X.; Lin, F.; Cheng, L.; et al. Plasma proteomic and autoantibody profiles reveal the proteomic characteristics involved in longevity families in Bama, China. Clin. Proteom. 2019, 16, 22. [Google Scholar] [CrossRef] [PubMed]
  23. Pan, Y.; Wang, F.; Sun, D.W.; Li, Q. Intestinal Lactobacillus community structure and its correlation with diet of Southern Chinese elderly subjects. J. Microbiol. 2016, 54, 594–601. [Google Scholar] [CrossRef] [PubMed]
  24. Wang, F.; Yu, T.; Huang, G.; Cai, D.; Liang, X.; Su, H.; Zhu, Z.; Li, D.; Yang, Y.; Shen, P.; et al. Gut Microbiota Community and Its Assembly Associated with Age and Diet in Chinese Centenarians. J. Microbiol. Biotechnol. 2015, 25, 1195–1204. [Google Scholar] [CrossRef] [PubMed]
  25. Cai, J.; Chen, S.; Yu, G.; Zou, Y.; Lu, H.; Wei, Y.; Tang, J.; Long, B.; Tang, X.; Yu, D.; et al. Comparations of major and trace elements in soil, water and residents’ hair between longevity and non-longevity areas in Bama, China. Int. J. Environ. Health Res. 2021, 31, 581–594. [Google Scholar] [CrossRef] [PubMed]
  26. Erridge, S.; Mangal, N.; Salazar, O.; Pacchetti, B.; Sodergren, M.H. Cannflavins—From plant to patient: A scoping review. Fitoterapia 2020, 146, 104712. [Google Scholar] [CrossRef] [PubMed]
  27. Rea, K.A.; Casaretto, J.A.; Al-Abdul-Wahid, M.S.; Sukumaran, A.; Geddes-McAlister, J.; Rothstein, S.J.; Akhtar, T.A. Biosynthesis of cannflavins A and B from Cannabis sativa L. Phytochemistry 2019, 164, 162–171. [Google Scholar] [CrossRef] [PubMed]
  28. Rao, M.J.; Duan, M.; Wei, X.; Zuo, H.; Ma, L.; Tahir ul Qamar, M.; Li, M.; Han, S.; Hu, L.; Wang, L. LC-MS/MS-based metabolomics approach revealed novel phytocompounds from sugarcane rind having promising pharmacological value. J. Sci. Food Agric. 2022, 102, 32–42. [Google Scholar] [CrossRef] [PubMed]
  29. Ashihara, H.; Ludwig, I.A.; Katahira, R.; Yokota, T.; Fujimura, T.; Crozier, A. Trigonelline and related nicotinic acid metabolites: Occurrence, biosynthesis, taxonomic considerations, and their roles in planta and in human health. Phytochem. Rev. 2015, 14, 765–798. [Google Scholar] [CrossRef]
  30. Zhou, J.; Chan, L.; Zhou, S. Trigonelline: A Plant Alkaloid with Therapeutic Potential for Diabetes and Central Nervous System Disease. Curr. Med. Chem. 2012, 19, 3523–3531. [Google Scholar] [CrossRef] [PubMed]
  31. Ciriminna, R.; Meneguzzo, F.; Delisi, R.; Pagliaro, M. Citric acid: Emerging applications of key biotechnology industrial product. Chem. Cent. J. 2017, 11, 22. [Google Scholar] [CrossRef] [PubMed]
  32. Babaei, F.; Moafizad, A.; Darvishvand, Z.; Mirzababaei, M.; Hosseinzadeh, H.; Nassiri-Asl, M. Review of the effects of vitexin in oxidative stress-related diseases. Food Sci. Nutr. 2020, 8, 2569–2580. [Google Scholar] [CrossRef] [PubMed]
  33. He, M.; Min, J.-W.; Kong, W.-L.; He, X.-H.; Li, J.-X.; Peng, B.-W. A review on the pharmacological effects of vitexin and isovitexin. Fitoterapia 2016, 115, 74–85. [Google Scholar] [CrossRef] [PubMed]
  34. Catanesi, M.; d’Angelo, M.; Antonosante, A.; Castelli, V.; Alfonsetti, M.; Benedetti, E.; Desideri, G.; Ferri, C.; Cimini, A. Neuroprotective potential of choline alfoscerate against β-amyloid injury: Involvement of neurotrophic signals. Cell Biol. Int. 2020, 44, 1734–1744. [Google Scholar] [CrossRef] [PubMed]
  35. Liu, Y.; He, C. A review of redox signaling and the control of MAP kinase pathway in plants. Redox Biol. 2017, 11, 192–204. [Google Scholar] [CrossRef] [PubMed]
  36. Girolomoni, L.; Ferrante, P.; Berteotti, S.; Giuliano, G.; Bassi, R.; Ballottari, M. The function of LHCBM4/6/8 antenna proteins in Chlamydomonas reinhardtii. J. Exp. Bot. 2017, 68, 627–641. [Google Scholar] [CrossRef]
  37. Rao, M.J.; Tahir ul Qamar, M.; Wang, D.; Ali, Q.; Ma, L.; Han, S.; Duan, M.; Hu, L.; Wang, L. A high-throughput lipidomics and transcriptomic approach reveals novel compounds from sugarcane linked with promising therapeutic potential against COVID-19. Front. Nutr. 2022, 9, 988249. [Google Scholar] [CrossRef] [PubMed]
  38. Rao, M.J.; Duan, M.; Wang, J.; Han, S.; Ma, L.; Mo, X.; Li, M.; Hu, L.; Wang, L. Transcriptomic and Widely Targeted Metabolomic Approach Identified Diverse Group of Bioactive Compounds, Antiradical Activities, and Their Associated Genes in Six Sugarcane Varieties. Antioxidants 2022, 11, 1319. [Google Scholar] [CrossRef] [PubMed]
  39. Li, W.; Wen, L.; Chen, Z.; Zhang, Z.; Pang, X.; Deng, Z.; Liu, T.; Guo, Y. Study on metabolic variation in whole grains of four proso millet varieties reveals metabolites important for antioxidant properties and quality traits. Food Chem. 2021, 357, 129791. [Google Scholar] [CrossRef] [PubMed]
  40. Chen, S.; Zhou, Y.; Chen, Y.; Gu, J. fastp: An ultra-fast all-in-one FASTQ preprocessor. Bioinformatics 2018, 34, i884–i890. [Google Scholar] [CrossRef] [PubMed]
  41. Kim, D.; Langmead, B.; Salzberg, S.L. HISAT: A fast spliced aligner with low memory requirements. Nat. Methods 2015, 12, 357–360. [Google Scholar] [CrossRef] [PubMed]
  42. Pertea, M.; Pertea, G.M.; Antonescu, C.M.; Chang, T.C.; Mendell, J.T.; Salzberg, S.L. StringTie enables improved reconstruction of a transcriptome from RNA-seq reads. Nat. Biotechnol. 2015, 33, 290–295. [Google Scholar] [CrossRef] [PubMed]
  43. Pertea, M.; Kim, D.; Pertea, G.M.; Leek, J.T.; Salzberg, S.L. Transcript-level expression analysis of RNA-seq experiments with HISAT, StringTie and Ballgown. Nat. Protoc. 2016, 11, 1650–1667. [Google Scholar] [CrossRef] [PubMed]
  44. Li, B.; Dewey, C.N. RSEM: Accurate transcript quantification from RNA-Seq data with or without a reference genome. BMC Bioinform. 2011, 12, 323. [Google Scholar] [CrossRef] [PubMed]
  45. Love, M.I.; Huber, W.; Anders, S. Moderated estimation of fold change and dispersion for RNA-seq data with DESeq2. Genome Biol. 2014, 15, 550. [Google Scholar] [CrossRef] [PubMed]
  46. Chen, H.; Boutros, P.C. VennDiagram: A package for the generation of highly-customizable Venn and Euler diagrams in R. BMC Bioinform. 2011, 12, 35. [Google Scholar] [CrossRef] [PubMed]
  47. Consortium, G.O. The Gene Ontology resource: Enriching a GOld mine. Nucleic Acids Res. 2021, 49, D325–d334. [Google Scholar] [CrossRef] [PubMed]
  48. Kanehisa, M.; Goto, S. KEGG: Kyoto encyclopedia of genes and genomes. Nucleic Acids Res. 2000, 28, 27–30. [Google Scholar] [CrossRef] [PubMed]
  49. Langfelder, P.; Horvath, S. WGCNA: An R package for weighted correlation network analysis. BMC Bioinform. 2008, 9, 559. [Google Scholar] [CrossRef] [PubMed]
  50. Shannon, P.; Markiel, A.; Ozier, O.; Baliga, N.S.; Wang, J.T.; Ramage, D.; Amin, N.; Schwikowski, B.; Ideker, T. Cytoscape: A software environment for integrated models of biomolecular interaction networks. Genome Res. 2003, 13, 2498–2504. [Google Scholar] [CrossRef]
  51. Miller, J.R.; Andre, R. Quantitative polymerase chain reaction. Br. J. Hosp. Med. 2014, 75, 188–192. [Google Scholar] [CrossRef]
Figure 1. Schematic diagram of the experimental procedures used to clarify variation in the composition of metabolites and the regulatory factors controlling the expression of genes involved in the synthesis of key metabolites during the maturation of hemp seeds from the Bama region. (a) Samples of hemp seeds from the Bama region at the four maturity stages (S1, S2, S3, and S4). (b) Design of the experimental procedures.
Agronomy 14 00787 g001
Figure 2. Composition of metabolites in hemp seeds at different stages of maturity. (a) Clustering heat map of all metabolites. Each column corresponds to a sample, and each row corresponds to a metabolite. The colored bar on the right indicates the abundance of metabolites. Red and green indicate up-regulated and down-regulated metabolites, respectively. (b) PCA plot. PC1 corresponds to the first principal component, and PC2 corresponds to the second principal component. The percentage indicates the amount of variation in the dataset, explained by the principal component. Each sample corresponds to a dot, and samples in the same color are from the same group. (c) Heat map of Pearson’s correlation coefficients. The longitudinal and diagonal lines show the sample names, and different colors indicate differences in the magnitude of the Pearson’s correlation coefficients; the key is shown on the right side. (d) Numbers of different types of metabolites in all samples at all growth stages, at S4 only, and in the seven varieties from a previous study [5]. The horizontal axis indicates the different types of metabolites, and the vertical axis indicates the number of metabolites. Different groups are shown in different colors.
Agronomy 14 00787 g002
Figure 3. Differentially accumulated metabolites in hemp seeds during the maturation process. (a) The 20 most abundant differentially accumulated metabolites from S1 to S4. The horizontal axis indicates peak area units, and the vertical axis indicates differentially accumulated metabolites. (b) Volcano map of the differentially accumulated metabolites in the S1 vs. S2, S2 vs. S3, and S3 vs. S4 comparison groups. Each point in the volcano plot corresponds to a metabolite; green indicates down-regulated metabolites, red indicates up-regulated metabolites, and gray indicates detected metabolites that were not differentially accumulated. The horizontal axis indicates the log10-value of the difference in the abundance of metabolites between comparison groups (log2FC); the vertical axis indicates the level of significance (−log10 p-value); the size of the dots indicates the VIP value. (c) Venn diagram showing differentially accumulated metabolites among comparison groups. (d) K-means clustering analysis of metabolites from S1 to S4. The horizontal axis indicates the sample groups, the vertical axis indicates the standardized relative metabolite content, and the class indicates the number of metabolite classes with the same pattern from S1 to S4. “*” stands isoform.
Agronomy 14 00787 g003
Figure 4. Results of a KEGG analysis of the differentially accumulated metabolites in different comparison groups during the maturation of hemp seeds. (a) Results for the S1 vs. S2 comparison group, (b) results for the S2 vs. S3 comparison group, and (c) results for the S3 vs. S4 comparison group. Each bubble in the plots indicates a metabolic pathway; the horizontal axis and the size of the bubbles indicate the magnitude of the effect. Larger bubbles indicate the enrichment of a greater number of metabolites; the color of the bubbles indicates the magnitude of the p-values, with darker colors corresponding to higher degrees of enrichment.
Agronomy 14 00787 g004
Figure 5. Transcriptomic analysis of hemp seeds at different maturity stages. (a) Results of the PCA of transcriptomic data from S1 to S4. The horizontal axis corresponds to PC1, and the vertical axis corresponds to PC2. (b) Venn diagram showing the differentially accumulated metabolites in the different growth stages. (c) DEGs in each comparison group. The horizontal axis shows the different comparison groups, and the vertical axis corresponds to the number of DEGs. (d) Venn analysis showing differentially accumulated metabolites in the different comparison groups. (e) Transcription factor gene family statistics. The horizontal axis represents the type of transcription factor and the vertical axis represents the number of gene families.
Agronomy 14 00787 g005
Figure 6. Results of a GO analysis of the DEGs in different comparison groups. The different colors of each bar correspond to the number of up-regulated and down-regulated DEGs in the comparison groups. The horizontal axis indicates the number of genes, and the vertical axis indicates the different categories.
Agronomy 14 00787 g006
Figure 7. Results of a KEGG analysis of the DEGs in different comparison groups. (a) S1 vs. S2 comparison group. (b) S2 vs. S3 comparison group. (c) S3 vs. S4 comparison group. Different pathways and their p-values, including the number of up-regulated and down-regulated DEGs and the degree of enrichment, are mapped in the figure. The 20 most significantly enriched pathways (i.e., pathways with the smallest p-values) were mapped for each comparison group in descending order according to their Q-values, as shown on the right. In the figure, the vertical axis is −log10(Q-value) and the horizontal axis is the proportion of the difference between the number of up-regulated DEGs and the number of down-regulated DEGs among all DEGs. Pathways highlighted in different colors indicate the different KEGG classifications (legend shown in the lower left of each graph).
Agronomy 14 00787 g007
Figure 8. WGCNA of the 20 most abundant metabolites in hemp seeds from S1 to S4. (a) Cluster dendrogram of DEGs in hemp seeds from S1 to S4. The dendrogram is oriented from top to bottom. Dynamic tree cut algorithm: modules divided according to the clustering results; merged dynamic algorithm: modules divided according to module similarity, wherein modules with similar expression patterns are merged. Height refers to the degree to which modules are related to each other. Vertical distance indicates the correlation between two nodes (between DEGs), and the horizontal distance is meaningless. (b) Number of DEGs in each module. Each color indicates a module type, the horizontal axis shows the module names, and the vertical axis shows the number of DEGs in the module. (c) Analysis of the association between the 20 most abundant metabolites and the five module types. The horizontal axis shows the 20 most abundant metabolites, and the vertical axis shows the five DEG modules. Heat map showing the R-values from Pearson’s correlation coefficient analysis. In the heat map, positive correlations are in red, and negative correlations are in green; the darkness of the color indicates the magnitude of the R-value, with darker colors indicating higher R-values. T-tests were conducted to evaluate the significance of differences between groups. “*”: p-value < 0.05; “**”: p-value < 0.01; “***”: p-value < 0.001; others: p-value > 0.05. (d) Gene regulatory network showing the relationships among the 100 most significant DEGs in the blue module. Each point in the network corresponds to a gene, and each line indicates a regulatory relationship between genes. Larger nodes indicate greater gene connectivity.
Agronomy 14 00787 g008
Figure 9. RT-qPCR validation of five genes identified from the transcriptome analysis. (a) RT-qPCR analysis of the five genes, showing the relative expression level. The horizontal axis shows the tissues, and the vertical axis shows the relative expression level values. (b) Transcriptome sequencing results of the five genes. The horizontal axis shows the tissues, and the vertical axis shows the expression levels (fragment per kilobase of transcript per million mapped reads). The bars indicate the standard deviation values.
Agronomy 14 00787 g009
Table 1. TF genes related to the metabolite classes revealed by K-means clustering analysis.
Gene IDClassp-ValueTF FamilyNR Description
ncbi_11571855510.016DofXP_030503214.1 dof zinc finger protein DOF2.4 [Cannabis sativa]
ncbi_11571297810.049TALEXP_030497288.1 BEL1-like homeodomain protein 2 isoform X1 [Cannabis sativa]
ncbi_1157113372<0.001GRASXP_030495535.1 scarecrow-like protein 3 [Cannabis sativa]
ncbi_1157020172<0.001MYBXP_030485339.1 transcription factor MYB62 [Cannabis sativa]
ncbi_11569849720.001MYBXP_030481432.1 transcription factor MYB30-like [Cannabis sativa]
ncbi_11569875520.001NACXP_030481781.1 NAC domain-containing protein 83 [Cannabis sativa]
ncbi_11570234820.001NACXP_030485672.1 NAC domain-containing protein 30 [Cannabis sativa]
Disclaimer/Publisher’s Note: The statements, opinions and data contained in all publications are solely those of the individual author(s) and contributor(s) and not of MDPI and/or the editor(s). MDPI and/or the editor(s) disclaim responsibility for any injury to people or property resulting from any ideas, methods, instructions or products referred to in the content.

