
Trade-Off and Synergy Mechanism of Agricultural Water Resource Spatial Allocation in Monsoon Climate Areas Based on Machine Learning: A Case Study of Reservoir Layout Optimization in Shandong Province, China

 ,
,
Abstract
:1. Introduction
2. Materials and Methods
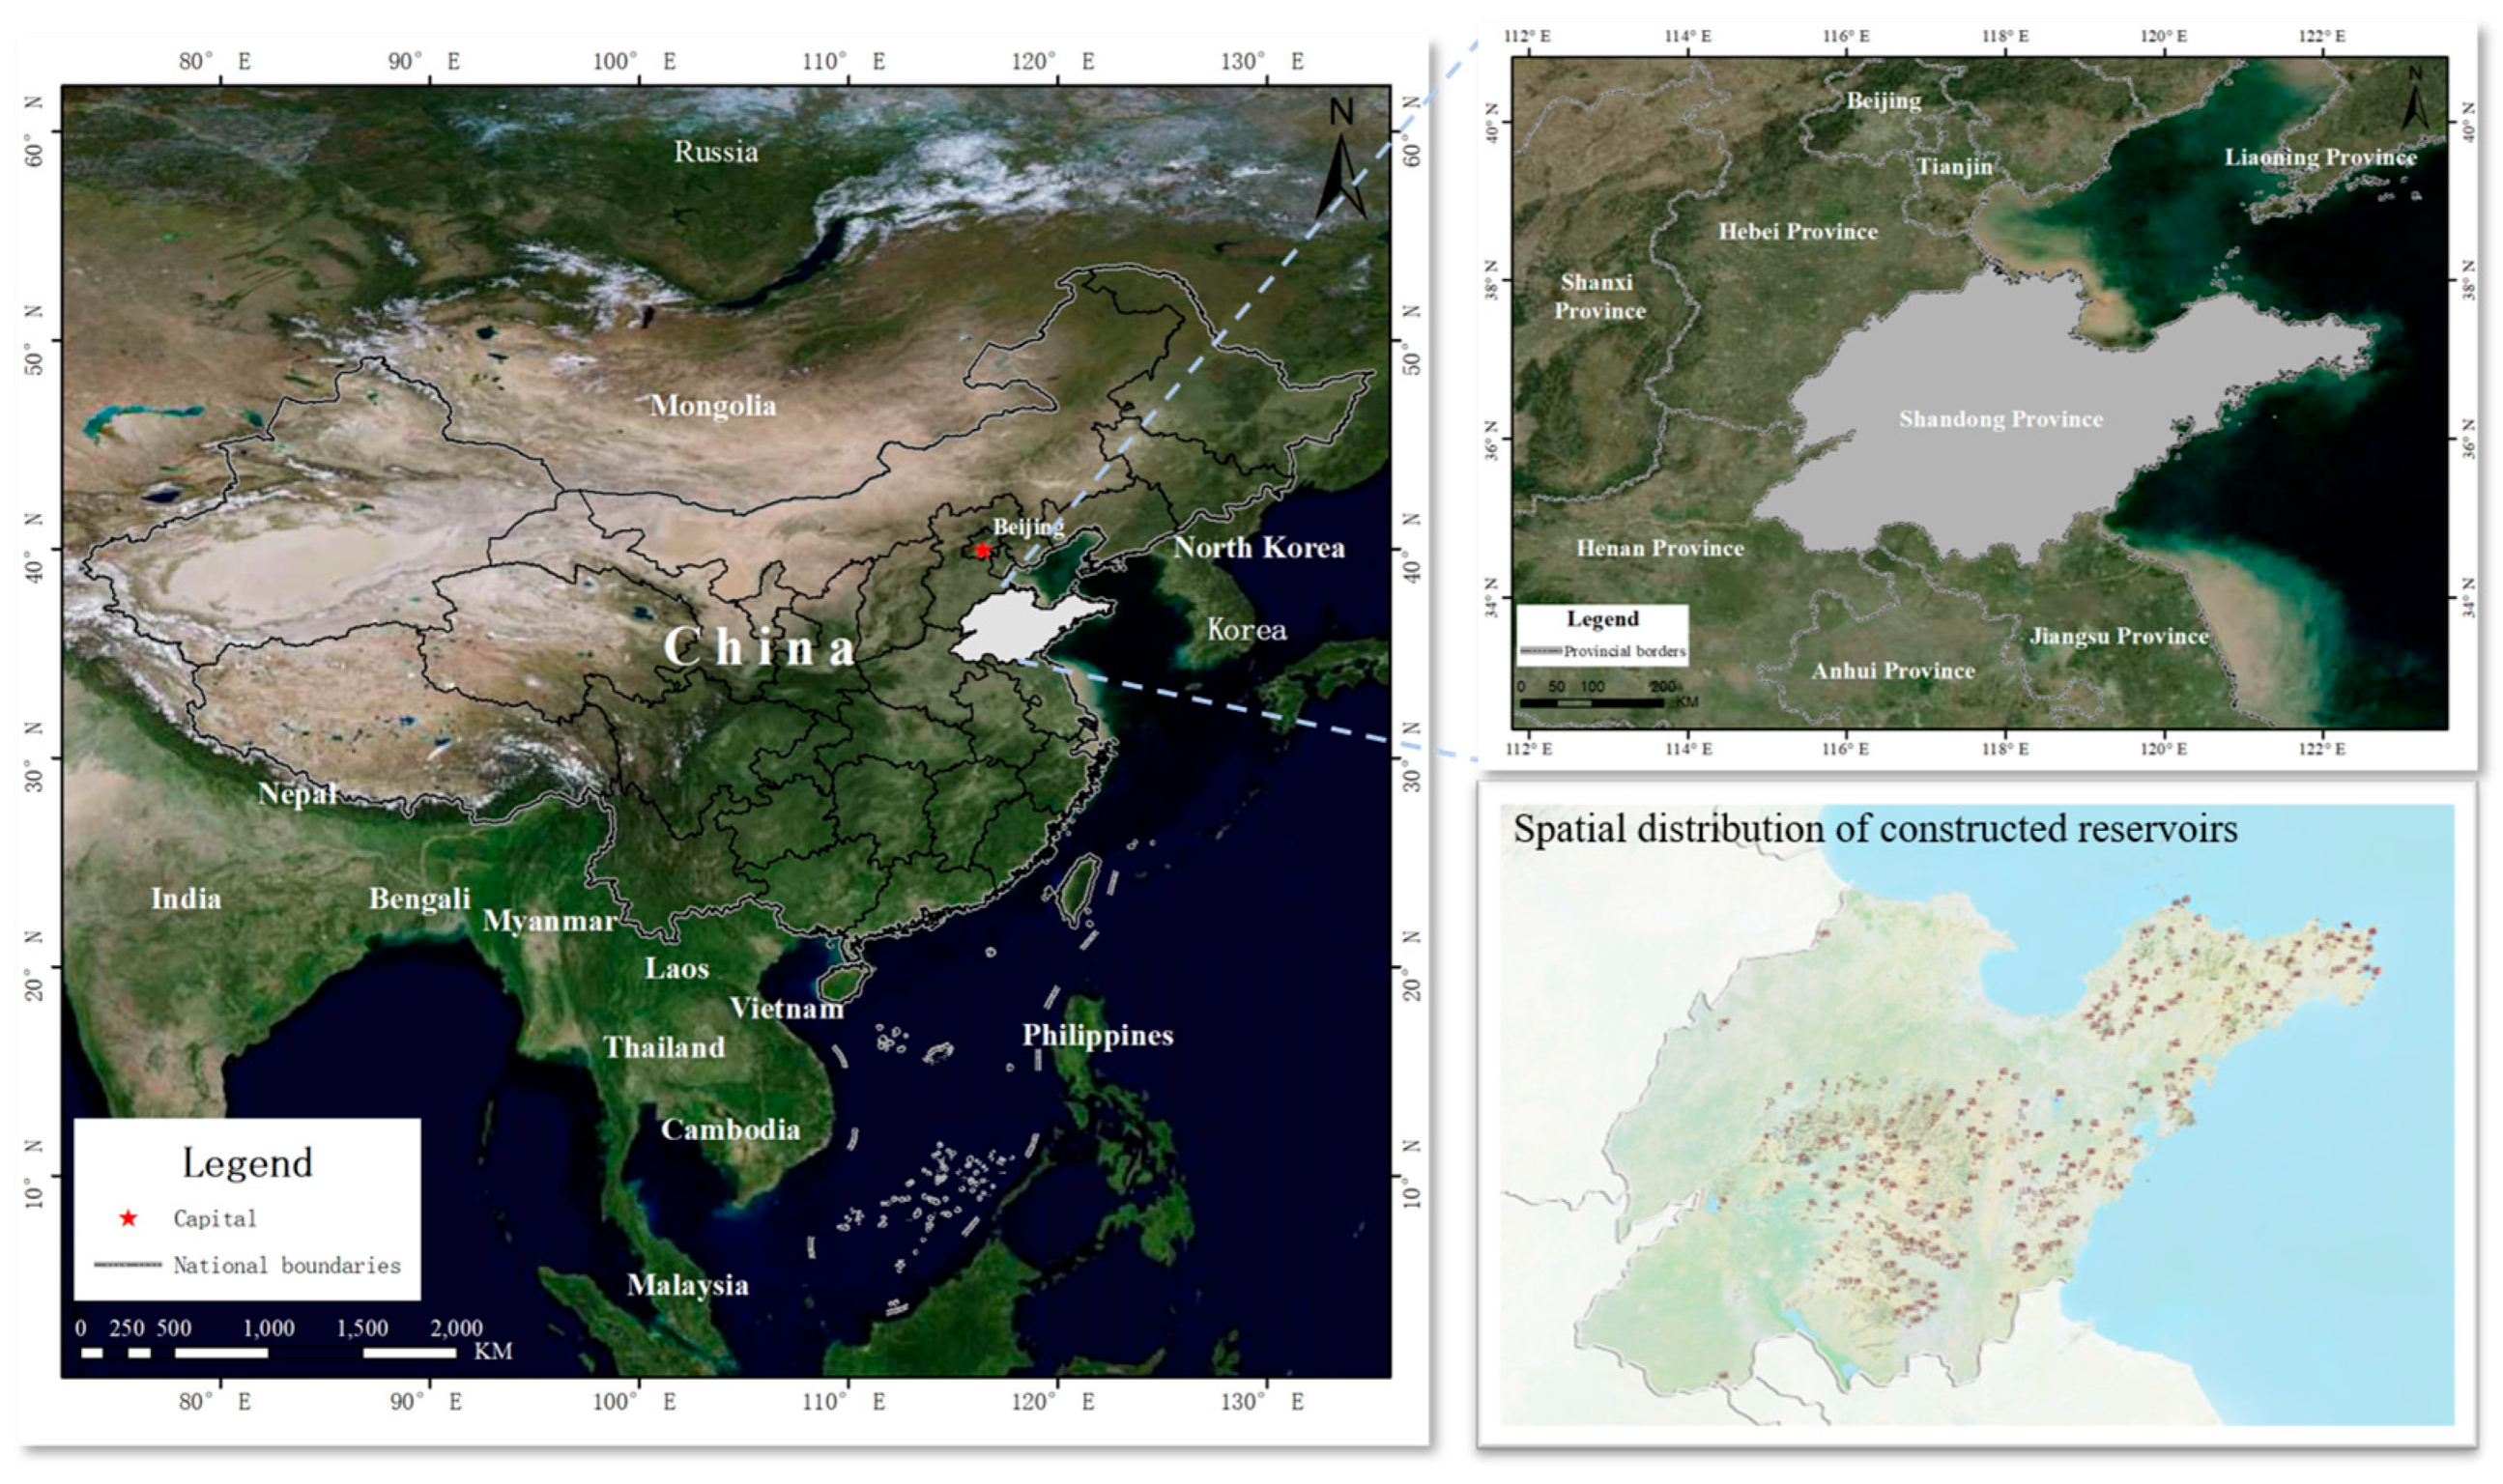
2.1. Study Area
2.2. Data Sources and Processing
2.2.1. Determination of Data Coordinate Points
2.2.2. Data and Processing of Factors Influencing Suitability Degree
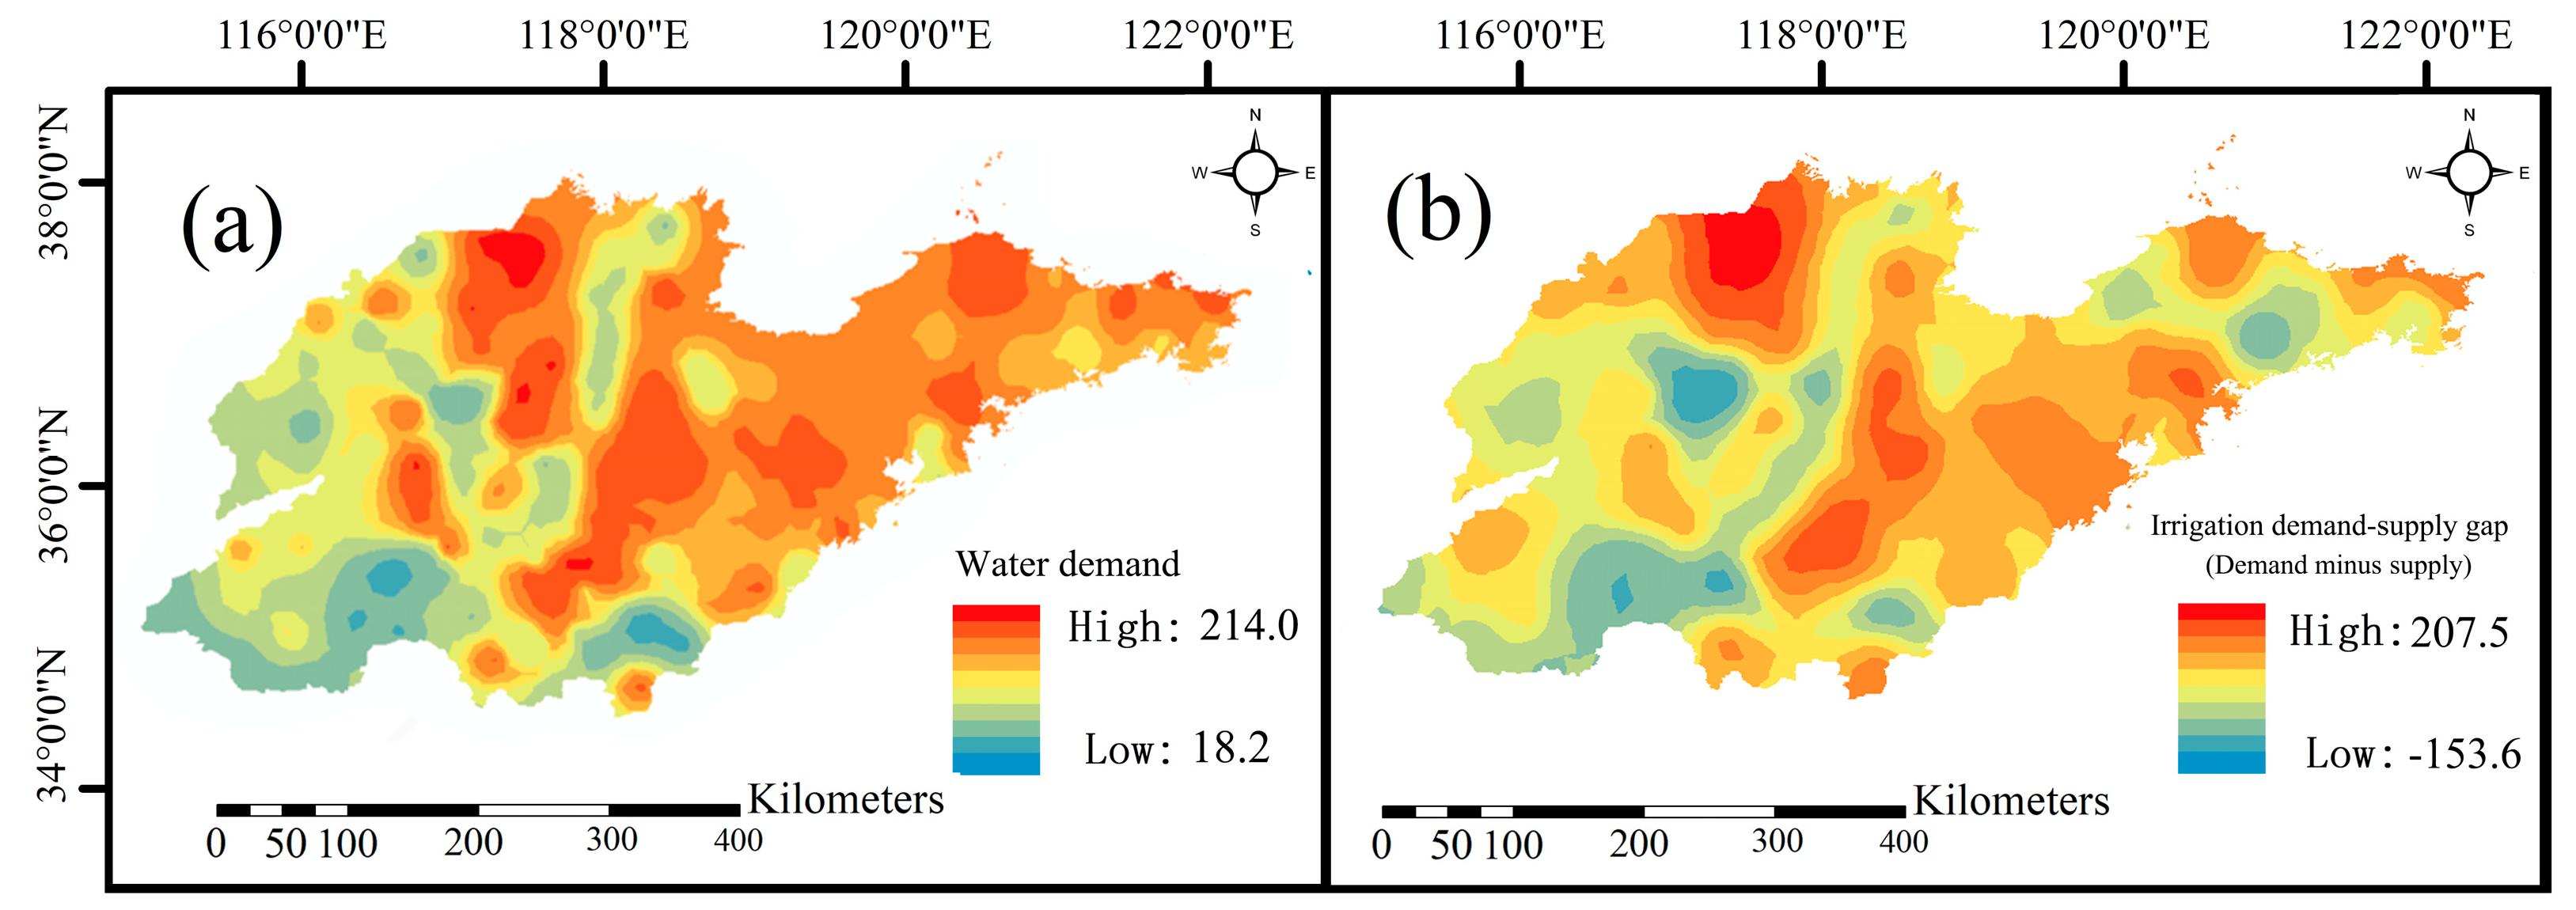
2.2.3. Data and Processing of Influencing Factors of Demand Degree
- Source of data

| Influencing Factors | Data Source |
|---|---|
| original regulating storage capacity | For the regulating storage capacity of the existing reservoirs adjacent to the coordinate points within the irrigation area, the geographical information data of the reservoirs comes from the team’s statistical collection, and the data on the regulating storage capacity comes from the introduction reports of the reservoirs. |
| irrigation area | For the area of the irrigation district where the coordinate point is located, the data comes from the Shandong Province Irrigation District Directory. |
| annual average precipitation at the coordinate point P | Data comes from the spatial distribution map of precipitation in Shandong Province. |
| Potential evapotranspiration | Data sources refer to Zhao Shen’s study on the spatiotemporal variation of evapotranspiration and potential evapotranspiration in Shandong Province [16]. |
| distribution coefficient α | Data comes from the proportion of agricultural water allocation to total water demand in various cities of Shandong Province. |
- 2.
- Data processing
2.2.4. Predictor Variables Data and Processing
- Data Sources
- 2.
- Data Processing
2.3. Research Methods
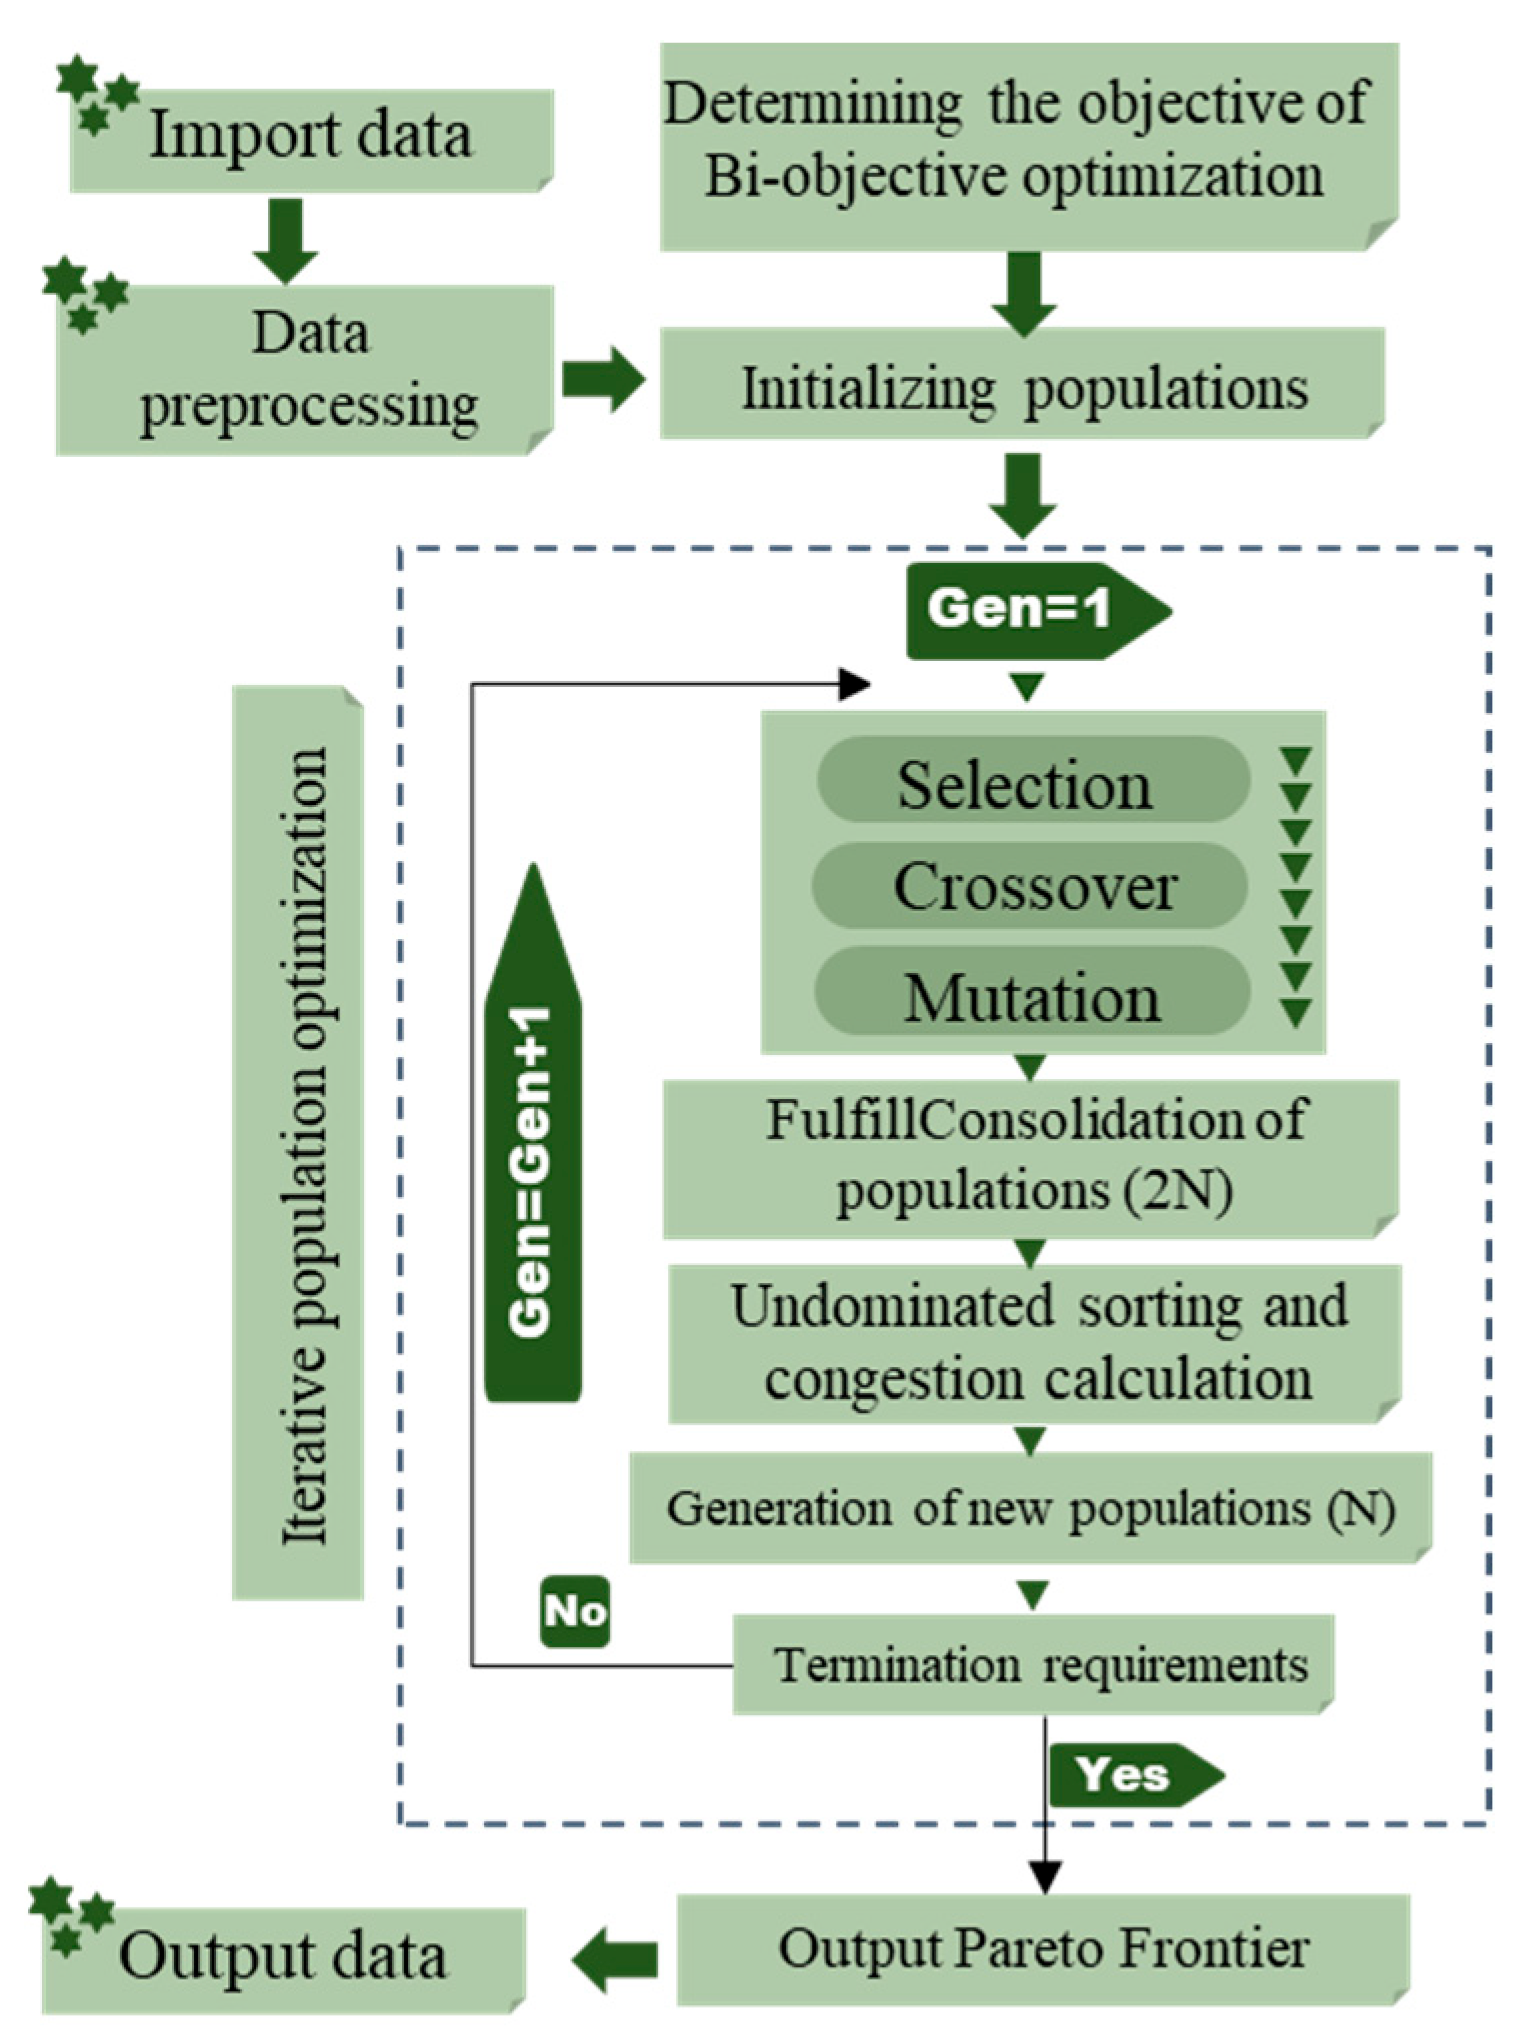
2.3.1. Research Process
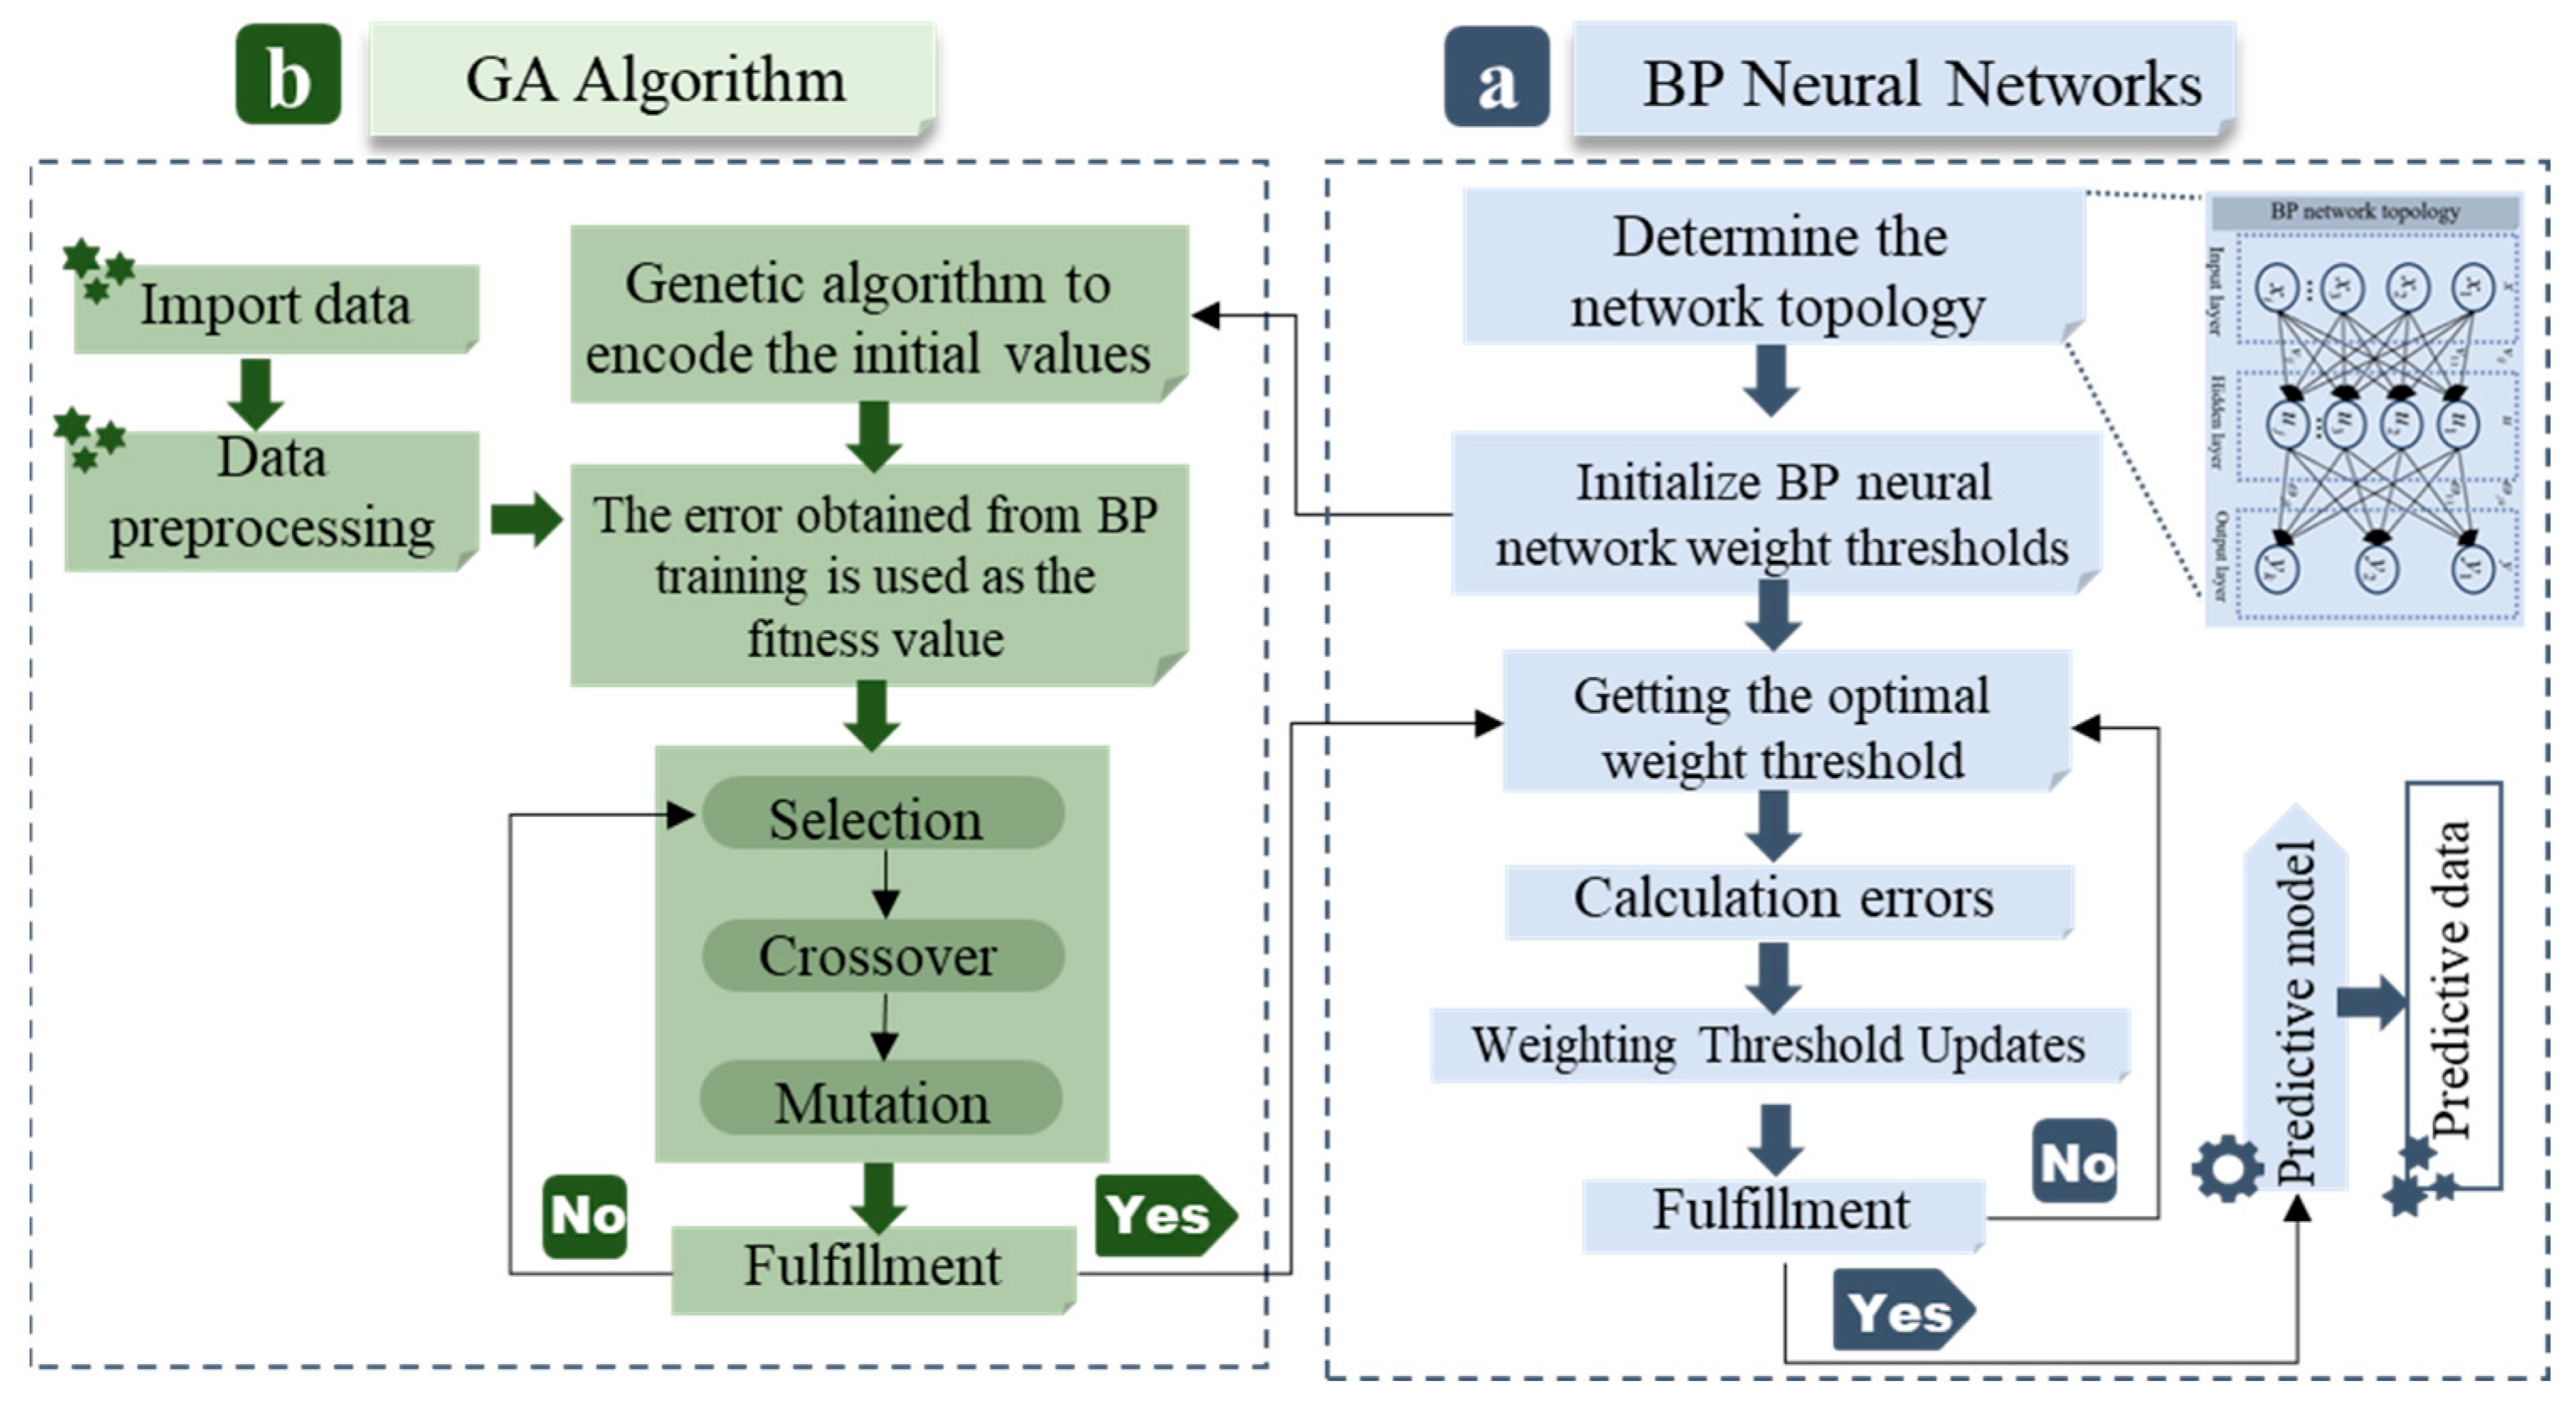
2.3.2. GA_BP Neural Network Model
2.3.3. GA_Bi-Objective Optimization Model
2.3.4. Error Analysis
3. Results
3.1. GA_BP Analysis of Neural Network Model Results
3.1.1. Prediction Results for the Independent Variable to Be Selected
3.1.2. Correlation Analysis of Independent Variables to Be Selected
3.2. GA-Bi-Objective Optimization Model and Result Analysis
3.2.1. Construction of Bi-Objective Optimization Function
- Suitability Objective Function :
- 2.
- Demand Degree Objective Function :
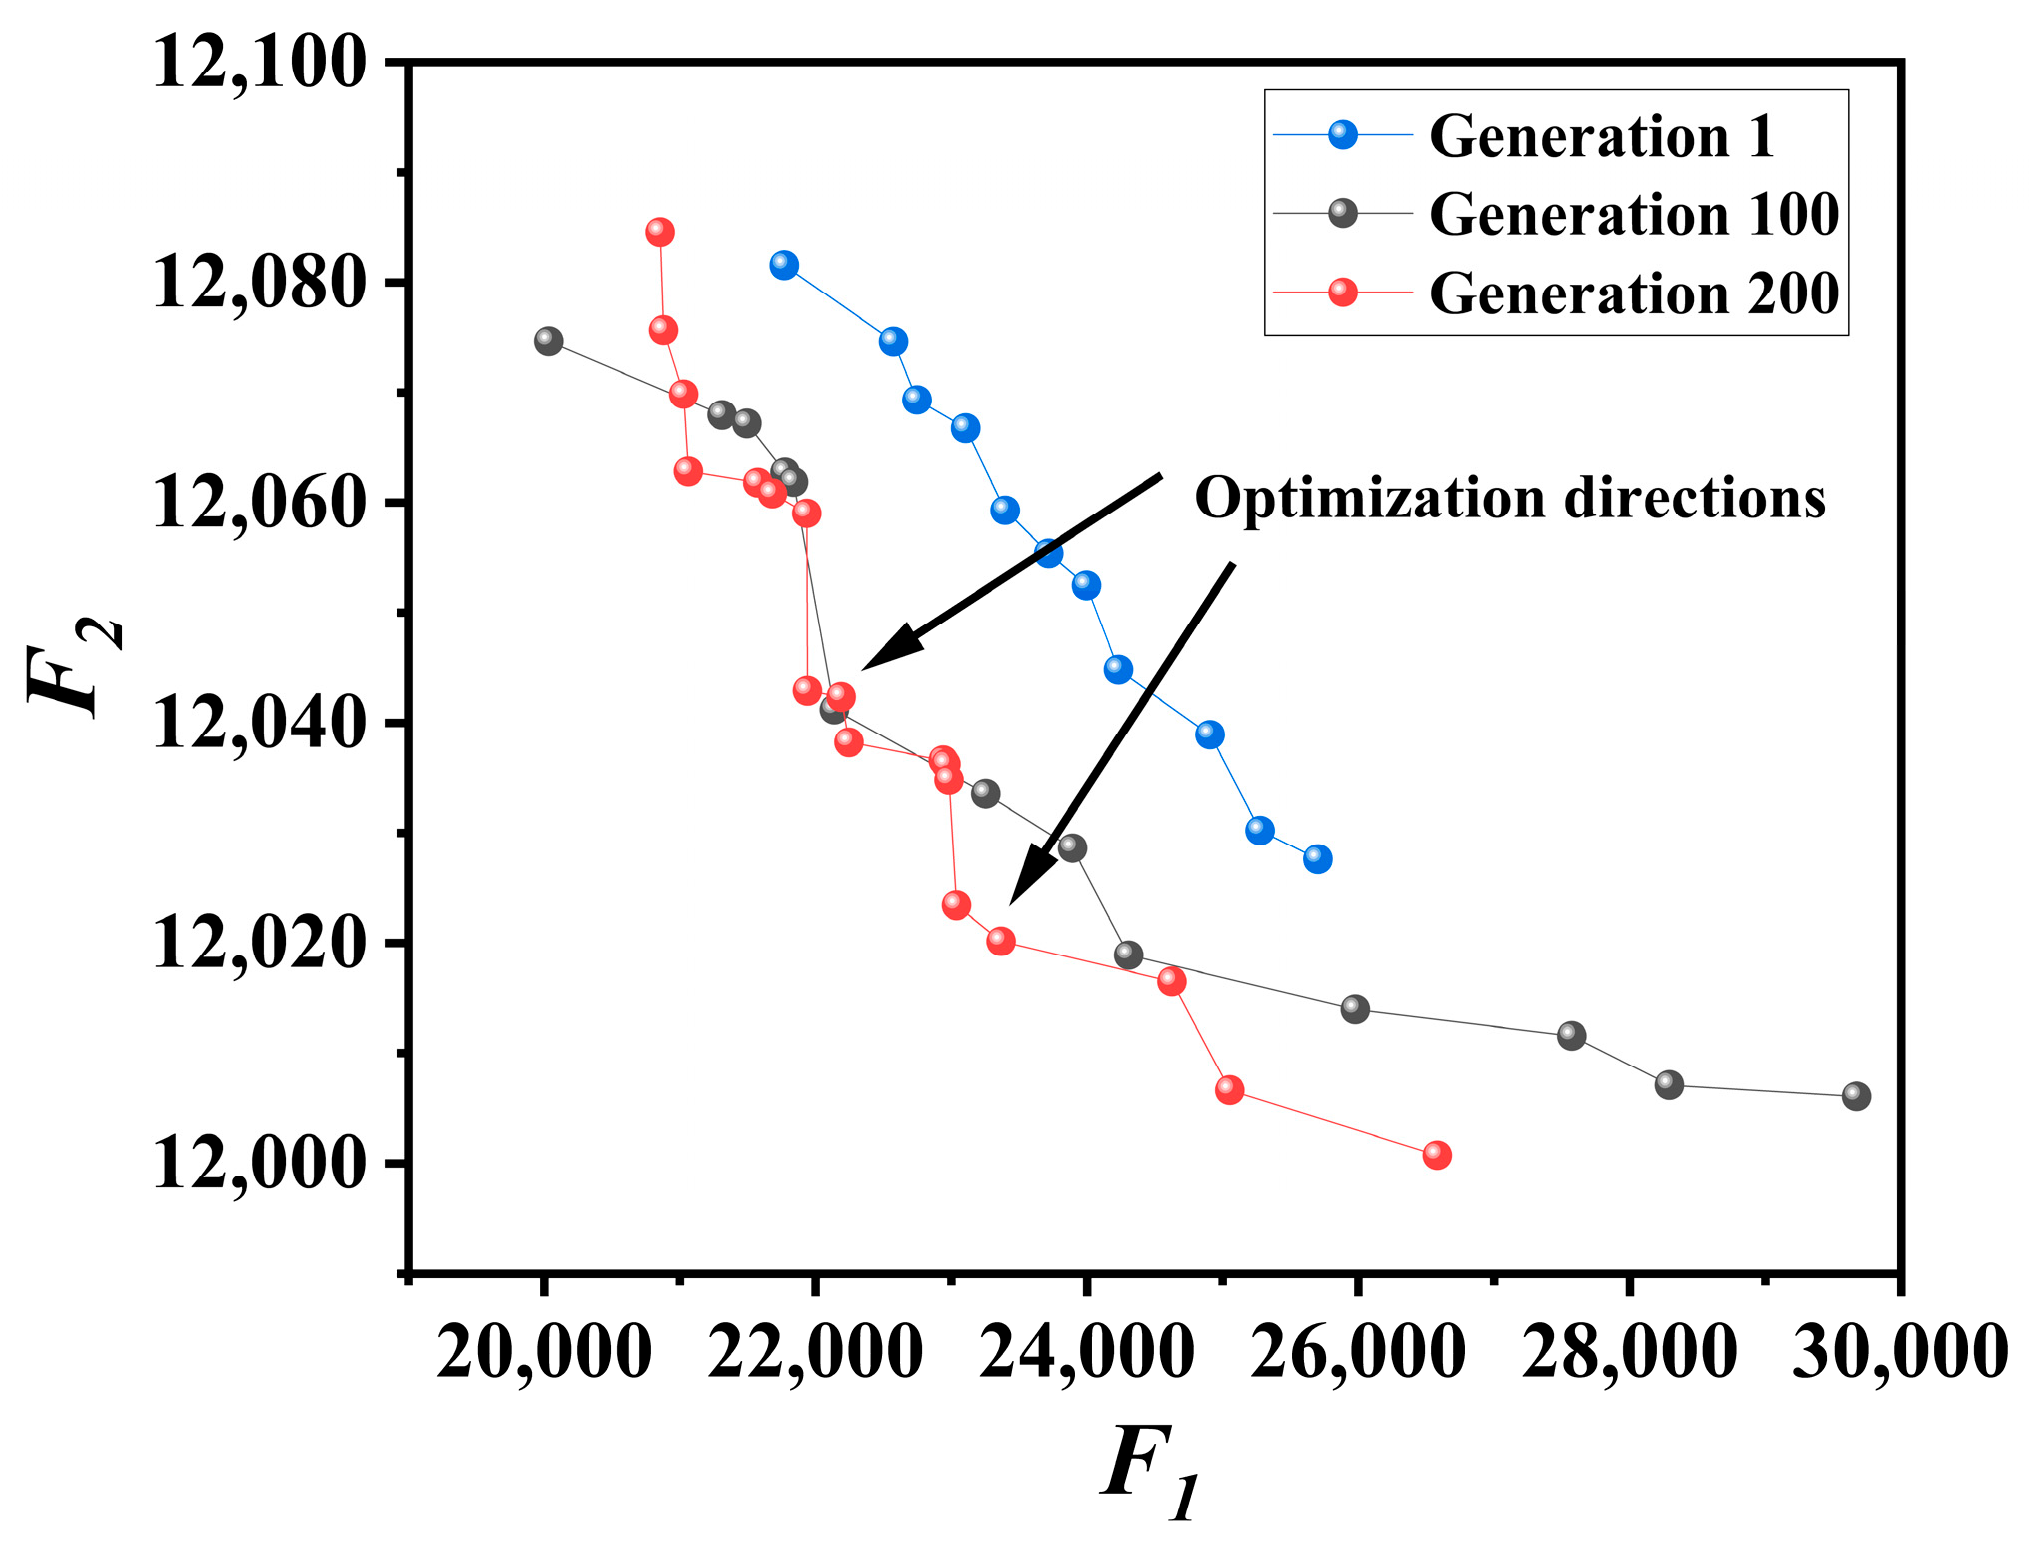
3.2.2. Analysis of Bi-Objective Optimization Results
3.2.3. Testing the Effectiveness of the Dual-Objective Optimization Model
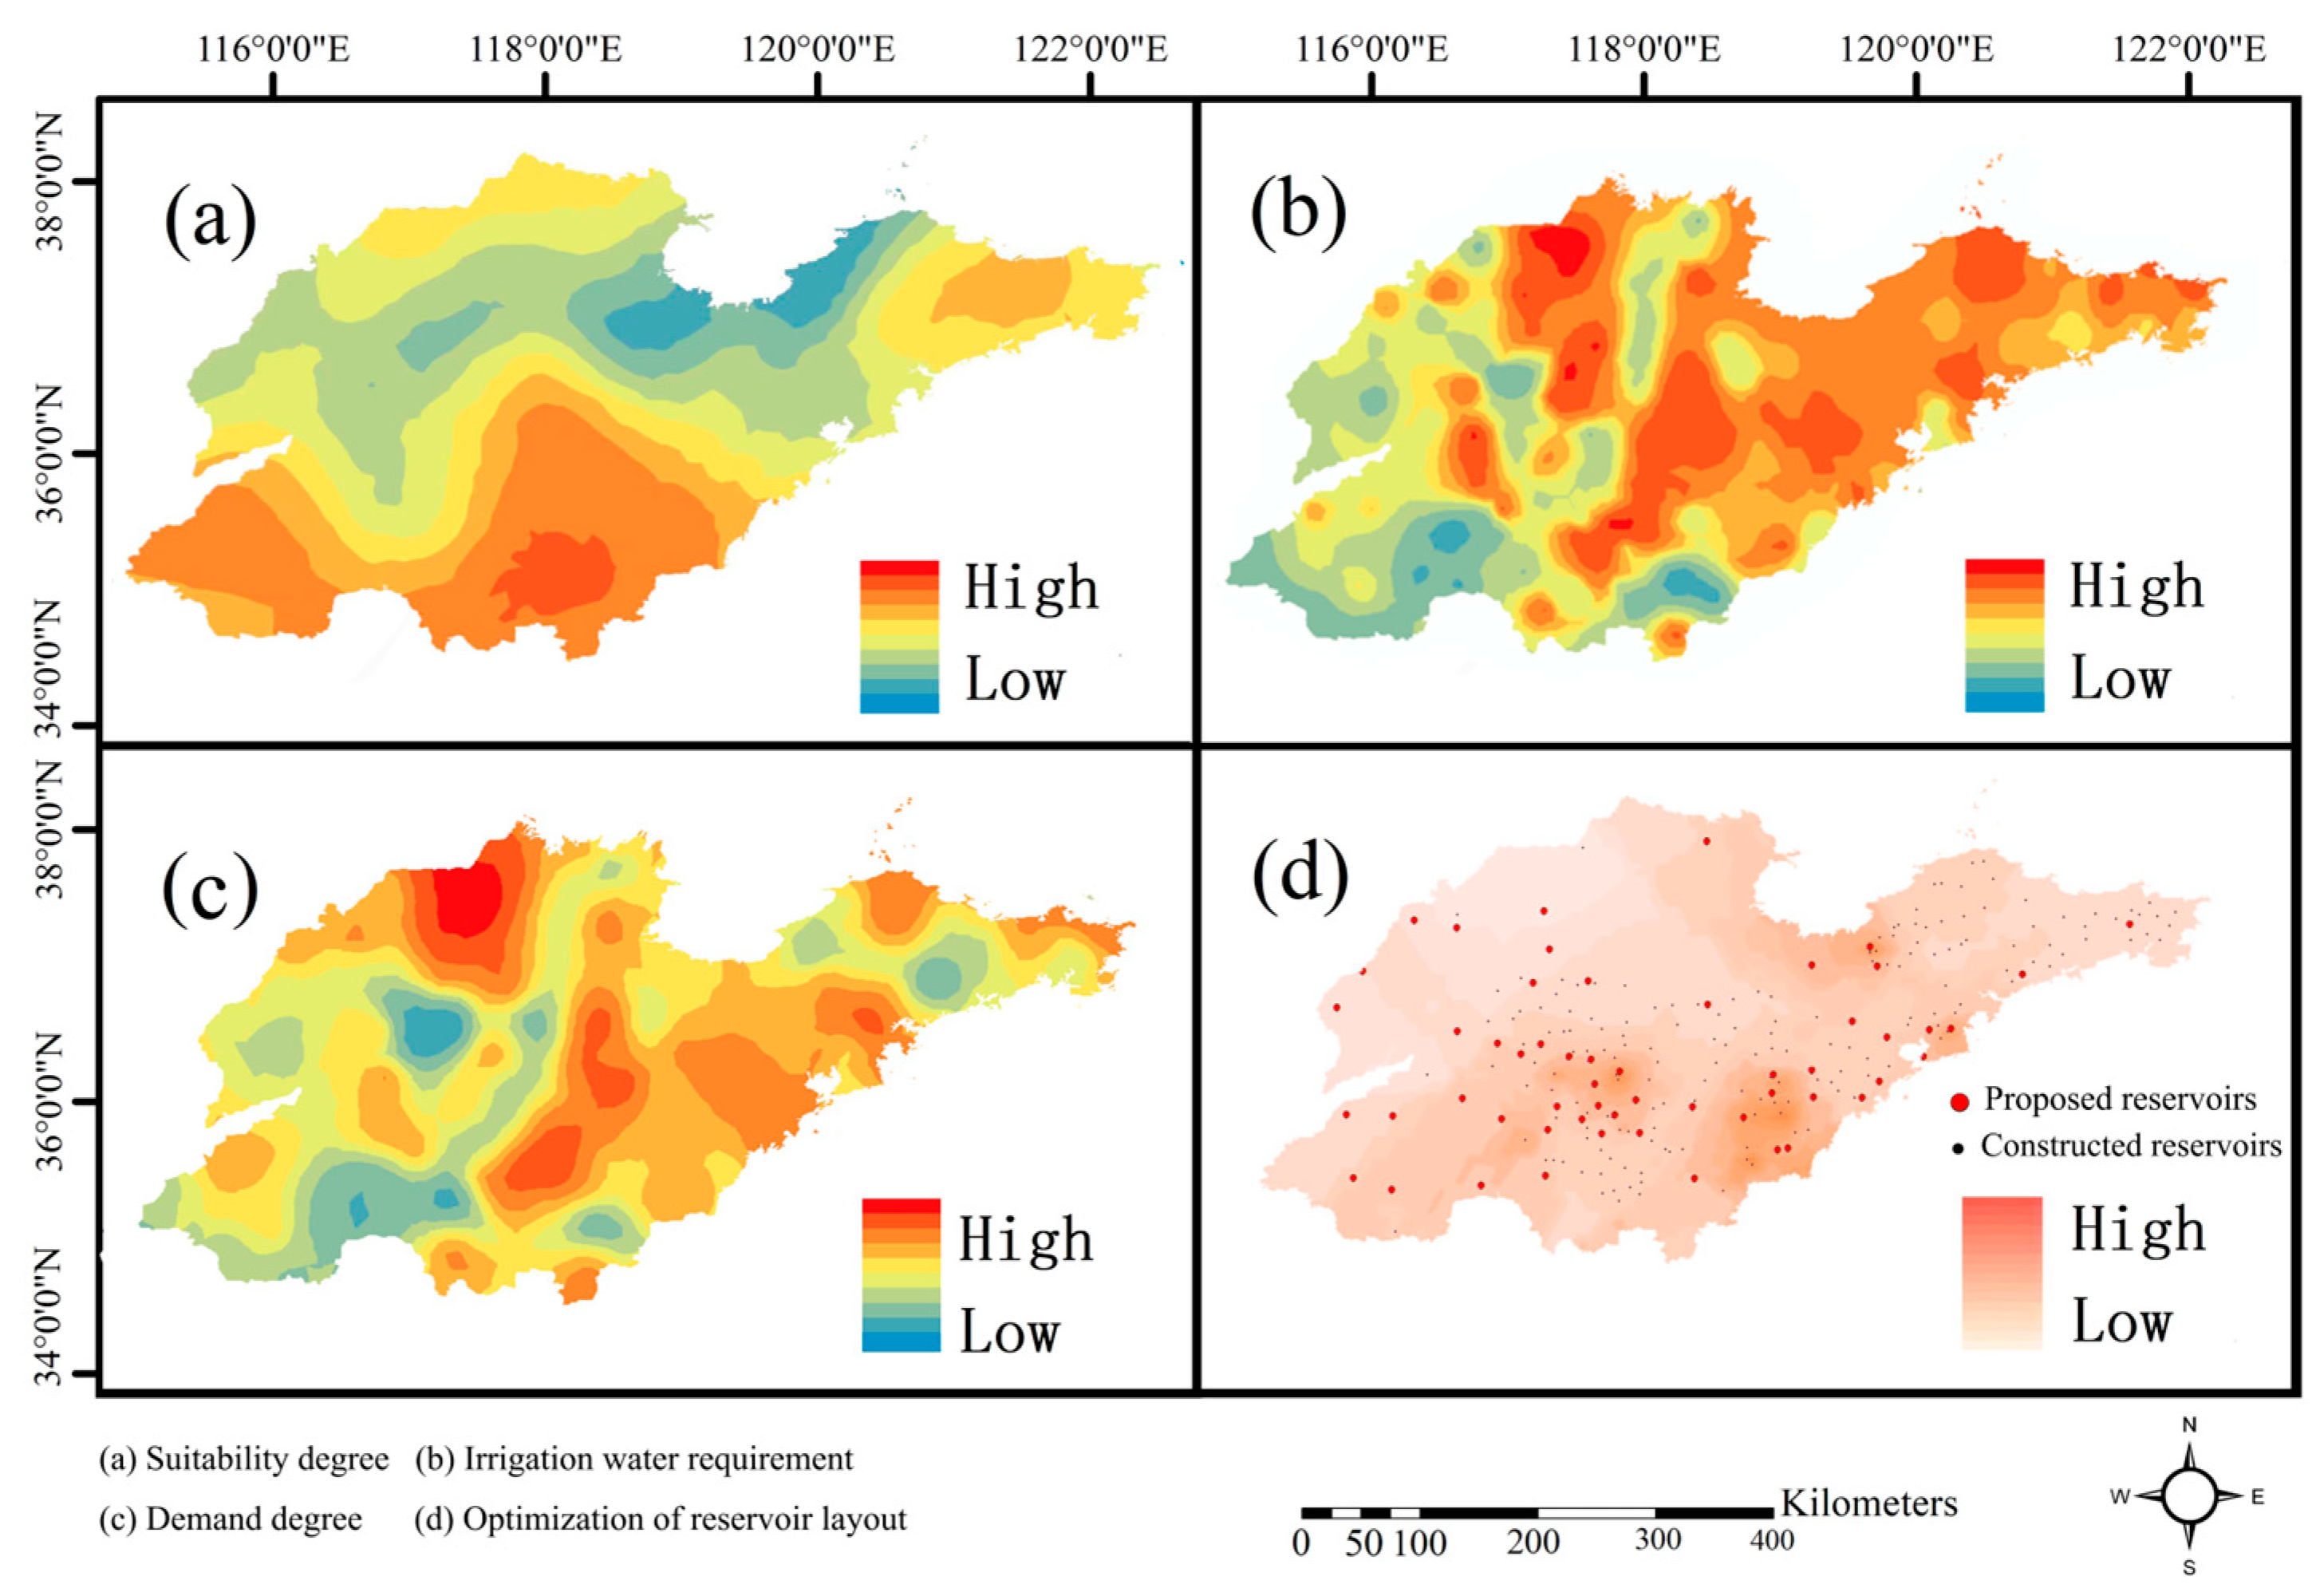
3.3. Optimization Analysis of Spatial Layout for Reservoir Site Selection
4. Discussion
5. Conclusions
Author Contributions
Funding
Data Availability Statement
Acknowledgments
Conflicts of Interest
Appendix A
| 1 | water resources | Distance\River Level | Level 5 | Level 4 | Level 3 | Level 2 | Level 1 | ||
| >2000 | 1 | 1 | 1 | 1 | 1 | ||||
| 1500~2000 | 1 | 2 | 3 | 4 | 5 | ||||
| 1000~1500 | 2 | 3 | 4 | 5 | 6 | ||||
| 500~1000 | 3 | 4 | 5 | 6 | 7 | ||||
| 0~500 | 5 | 6 | 7 | 8 | 9 | ||||
| 2 | Precipitation | (A1) | |||||||
| (A2) | |||||||||
| —Conversion fraction of precipitation; i = 1, 2, 3, …, 329 —Are the maximum and minimum values of the assignment interval for the conversion score, and the assignment interval is [1,9]; —Averages; this is the average precipitation in Shandong Province; —Standard deviation; this is the standard deviation of precipitation in Shandong Province; —The standard score of precipitation is the score obtained after data accuracy, is the maximum and minimum values of the standard score. Here are the maximum and minimum values of the standard score of precipitation in Shandong Province; —Precipitation at coordinate points. | |||||||||
| 3 | Temperature | The method of assigning values is the same as that for precipitation. | |||||||
| 4 | Evaporation | The method of assigning values is the same as that for precipitation. | |||||||
| 5 | Geological hazards | Seismic Intensity | Score | ||||||
| Six-degree | 9 | ||||||||
| Seven-degree | 7 | ||||||||
| Eight-degree (0.2 g) | 5 | ||||||||
| Eight-degree (0.3 g) | 3 | ||||||||
| Nine-degree | 1 | ||||||||
| 6 | Stratigraphic lithology | Rock Type\Water-Richness | Extremely Low Water Richness | Very Low Water Richness | Moderate Water Richness | High Water Richness | Extremely High Water Richness | ||
| unconsolidated porous rocks | 1.0~1.4 | 1.4~1.8 | 1.8~2.2 | 2.2~2.6 | 2.6~3.0 | ||||
| Fractured and porous fine-grained rocks | 3.0~3.4 | 3.4~3.8 | 3.8~4.2 | 4.2~4.6 | 4.6~5.0 | ||||
| Fractured and karstified carbonate rocks | 5.0~5.4 | 5.4~5.8 | 5.8~6.2 | 6.2~6.6 | 6.6~7.0 | ||||
| Fracture-hosted igneous rocks | 7.0~7.4 | 7.4~7.8 | 7.8~8.2 | 8.2~8.6 | 8.6~9.0 | ||||
| 7 | Hydrogeology | Water quality\Abundance of underground water resources | V | VI | III | II | I | ||
| Class I | 9 | 8 | 7 | 6 | 5 | ||||
| Class II | 8 | 7 | 6 | 5 | 4 | ||||
| Class III | 7 | 6 | 5 | 4 | 3 | ||||
| Class IV | 6 | 5 | 4 | 3 | 2 | ||||
| Class V | 5 | 4 | 3 | 2 | 1 | ||||
| 8 | Socio-economic | The method of assigning values is the same as that for precipitation. | |||||||
| 9 | Land terrain type | Land/Terrain | Mountainous | Hilly | Plain | ||||
| Water areas | 9 | 7 | 5 | ||||||
| Grassland and woodland | 7 | 5 | 3 | ||||||
| Agricultural land | 5 | 3 | 1 | ||||||
| Tideland, Gobi, etc. | 3 | 1 | 1 | ||||||
| Urban land | 1 | 1 | 1 | ||||||
| 10 | Ecologically sensitive areas | Distance from ecologically sensitive areas | Score | ||||||
| ≥2000 | 9 | ||||||||
| 1501~2000 | 7 | ||||||||
| 1001~1500 | 5 | ||||||||
| 501~1000 | 3 | ||||||||
| 0~500 | 1 | ||||||||
Appendix B
- (1)
- GA_BP algorithm main function: (xunhuan_GA_BP_other1)https://kdocs.cn/l/cftWYHbiB8Uw (accessed on 22 August 2024)
- (2)
- Fitness function: (fitness1)https://kdocs.cn/l/ceoeK7BVtS9V (accessed on 22 August 2024)
- (3)
- The select function (select)https://kdocs.cn/l/chEyjic8T8Sa (accessed on 22 August 2024)
- (4)
- The crossover function: (Cross)https://kdocs.cn/l/cbpOA5vZUPAO (accessed on 22 August 2024)
- (5)
- The variational function: (Mutation)https://kdocs.cn/l/cfBjNq2Q9jL1 (accessed on 22 August 2024)
Appendix C
- (1)
- GA_Bi-objective optimization function: (GA_Bi_objective)https://kdocs.cn/l/ccquscpr04GC (accessed on 22 August 2024)
References
- Masson-Delmotte, V.; Zhai, P.; Pirani, A.; Connors, S.L.; Péan, C.; Berger, S.; Caud, N.; Chen, Y.; Goldfarb, L.; Gomis, M. Climate Change 2021: The Physical Science Basis. Contribution of Working Group I to the Sixth Assessment Report of the Intergovernmental Panel on Climate Change; Cambridge University Press: Cambridge, UK, 2021; Volume 2, p. 2391. [Google Scholar]
- Zhou, T.; Chen, Z.; Chen, X.; Zuo, M.; Jiang, J.; Hu, S. Interpreting IPCC AR6: Future global climate based on projection under scenarios and on near-term information. Adv. Clim. Change Res. 2021, 17, 652. [Google Scholar]
- Lynn, J.; Peeva, N. Communications in the IPCC’s Sixth Assessment Report cycle. Clim. Change 2021, 169, 10. [Google Scholar] [CrossRef]
- Bo-Tao, Z.; Jin, Q. Changes of weather and climate extremes in the IPCC AR6. Adv. Clim. Change Res. 2021, 17, 713. [Google Scholar]
- Baban, S.M.; Wan-Yusof, K. Modelling optimum sites for locating reservoirs in tropical environments. Water Resour. Manag. 2003, 17, 1–17. [Google Scholar] [CrossRef]
- Tsiko, R.G.; Haile, T.S. Integrating geographical information systems, fuzzy logic and analytical hierarchy process in modelling optimum sites for locating water reservoirs. A case study of the Debub District in Eritrea. Water 2011, 3, 254–290. [Google Scholar] [CrossRef]
- Doost, Z.H.; Yaseen, Z.M. Allocation of reservoirs sites for runoff management towards sustainable water resources: Case study of Harirud River Basin, Afghanistan. J. Hydrol. 2024, 634, 131042. [Google Scholar] [CrossRef]
- Thakur, D.A.; Mohanty, M.P.; Mishra, A.; Karmakar, S. Quantifying flood risks during monsoon and post-monsoon seasons: An integrated framework for resource-constrained coastal regions. J. Hydrol. 2024, 630, 130683. [Google Scholar] [CrossRef]
- Wei, R.C.; Ya, L.S.; Ouyang, Q.; Long, Q.B.; Fan, M.F. Study on the spatial matching relationship between reservoirs and drought situation in Hunan Province. J. Water Resour. Water Eng. 2021, 32, 8. [Google Scholar]
- Rather, M.A.; Meraj, G.; Farooq, M.; Shiekh, B.A.; Kumar, P.; Kanga, S.; Singh, S.K.; Sahu, N.; Tiwari, S.P. Identifying the Potential Dam Sites to Avert the Risk of Catastrophic Floods in the Jhelum Basin, Kashmir, NW Himalaya, India. Remote Sens. 2022, 14, 1538. [Google Scholar] [CrossRef]
- Randle, T.J.; Morris, G.L.; Tullos, D.D.; Weirich, F.H.; Kondolf, G.M.; Moriasi, D.N.; Annandale, G.W.; Fripp, J.; Minear, J.T.; Wegner, D.L. Sustaining United States reservoir storage capacity: Need for a new paradigm. J. Hydrol. 2021, 602, 126686. [Google Scholar] [CrossRef]
- Wisser, D.; Frolking, S.; Hagen, S.; Bierkens, M.F.P. Beyond peak reservoir storage? A global estimate of declining water storage capacity in large reservoirs. Water Resour. Res. 2013, 49, 5732–5739. [Google Scholar] [CrossRef]
- Ran, L.; Lu, X.X. Delineation of reservoirs using remote sensing and their storage estimate: An example of the Yellow River basin, China. Hydrol. Process. 2012, 26, 1215–1229. [Google Scholar] [CrossRef]
- Wu, J.C. A probabilistic algorithm to regulate irrigation variable water supply for total storage capacity once in many years. J. Water Resour. 1986, 10. [Google Scholar]
- Peng, F.; Wang, N.; Wei, X. Study on optimal scheduling of complex joint water supply for multiple reservoirs based on improved particle swarm algorithm. J. Water Resour. Water Eng. 2022, 33, 143–148+155. [Google Scholar]
- Zhao, S.; Chen, S. Spatial and temporal variation of evapotranspiration and potential evapotranspiration in Shandong Province based on station and MOD16 data. Prog. Geosci. 2017, 36, 8. [Google Scholar] [CrossRef]
- Pang, A.P.; Yi, Y.J.; Li, C.H. Evaluation of Agricultural water security based on ecological water demand security—A case study of the Yellow River Irrigation District in Shandong Province. Ecol. Lett. 2021, 41, 14. [Google Scholar] [CrossRef]
- Peng, Y.; Yu, F.; Zhang, M.; Qi, H.; Xu, J. Rural refuse collection site selection method based on improved continuous genetic algorithm. Comput. Appl. 2023, 43, 302–306. [Google Scholar]
- Wang, Y.; Tian, Y.Z.; Cao, Y. Dam Siting: A Review. Water 2021, 13, 2080. [Google Scholar] [CrossRef]
- Lashkaripour, G.R.; Ghafoori, M. The engineering geology of the Tabarak Abad Dam. Eng. Geol. 2002, 66, 233–239. [Google Scholar] [CrossRef]
- Rajabi, A.M.; Khodaparast, M.; Edalat, A. Investigation of the geological and geotechnical characteristics of the Tanguyeh dam site in southeastern Iran. Bull. Eng. Geol. Environ. 2015, 74, 861–872. [Google Scholar] [CrossRef]
- Kanik, M.; Ersoy, H. Evaluation of the engineering geological investigation of the Ayvali dam site (NE Turkey). Arab. J. Geosci. 2019, 12, 89. [Google Scholar] [CrossRef]
- Ibrahim, M.H.J.; Venktes, J.; Abed Ali, A. The Detailed Survey for Site Selection for the Construction of a Dam Using Remote Sensing and Geographic Information System in Iraq. Int. J. Sci. Eng. Technol. Res. 2013, 2, 1001–1004. [Google Scholar]
- Ebrahimi, J.; Moradi, H.R.; Chezgi, J. Prioritizing suitable locations for underground dam construction in south-east of Bushehr Province. Environ. Earth Sci. 2021, 80, 680. [Google Scholar] [CrossRef]
- Hamidifar, H.; Yaghoubi, F.; Rowinski, P.M. Using multi-criteria decision-making methods in prioritizing structural flood control solutions: A case study from Iran. J. Flood Risk Manag. 2024, 17, e12991. [Google Scholar] [CrossRef]
- Nzotcha, U.; Kenfack, J.; Manjia, M.B. Integrated multi-criteria decision making methodology for pumped hydro-energy storage plant site selection from a sustainable development perspective with an application. Renew. Sustain. Energy Rev. 2019, 112, 930–947. [Google Scholar] [CrossRef]
- Xue, X.; Yao, J.; Cao, J. County “14th Five-Year Plan” Water Safety and Security Planning Ideas and Countermeasures Study. Water Resour. Tech. Superv. 2022, 3, 82–84+137. [Google Scholar]
- Gu, S. Systematic grasp and effective implementation of the “14th Five-Year Plan” for water security and safety planning. China Water Resour. 2022, 3, 8–9+15. [Google Scholar]
- Shandong Provincial People’s Government. Shandong Provincial People’s Government on the issuance of Shandong Province “14th Five-Year Plan” water conservancy development plan notice (Lu Zhengzi [2021] No. 157); Shandong Provincial People’s Government: Jinan, China, 2021; 23.
- Al-Ruzouq, R.; Shanableh, A.; Yilmaz, A.G.; Idris, A.; Mukherjee, S.; Khalil, M.A.; Gibril, M.B.A. Dam Site Suitability Mapping and Analysis Using an Integrated GIS and Machine Learning Approach. Water 2019, 11, 1880. [Google Scholar] [CrossRef]
- Jiao, Y.T.; Li, Z.K.; Ge, W.; Jing, L.H.; Wu, M.M.; Wang, T.; Sun, H.Q.; Wang, J.Y.; Zhang, X.Y.; van Gelder, P. A study on siting of emergency shelters for dam failure floods considering population distribution and weather effects. Sci. Total Environ. 2024, 914, 169901. [Google Scholar] [CrossRef]
- Choi, J.R.; Sung, J.H.; Kang, D.H.; Choo, K.S.; Kim, B.S. A Study on the Priority Selection Method for Underground Dam Installation Considering Humanities and Social Factors Using Fuzzy Analytic Hierarchy Process in Korea. Water 2023, 15, 3296. [Google Scholar] [CrossRef]
- Hwang, J.; Kumar, H.; Ruhi, A.; Sankarasubramanian, A.; Devineni, N. Quantifying Dam-Induced Fluctuations in Streamflow Frequencies Across the Colorado River Basin. Water Resour. Res. 2021, 57, e2021WR029753. [Google Scholar] [CrossRef]
- Li, X.H.; Zhang, Q.; Hu, Q.; Zhang, D.; Ye, X.C. Lake flooding sensitivity to the relative timing of peak flows between upstream and downstream waterways: A case study of Poyang Lake, China. Hydrol. Process. 2017, 31, 4217–4228. [Google Scholar] [CrossRef]
- China Planning Press Co., Ltd. Seismic Design Code for Hydraulic Buildings, China Planning Press Co., Ltd.: Beijing, China, 2001.
- China Architecture & Building Press. National Standard of the People’s Republic of China: Classification Standard for Earthquake-Resistant Defense of Construction Projects; China Architecture & Building Press: Beijing, China, 2008. [Google Scholar]
- GB 3838-2002; Environmental Quality Standards for Surface Water. Ministry of Environmental Protection of the People’s Republic of China: Beijing, China, 2002.
- Shandong Provincial Department of Environmental Protection. Shandong Province Ecological Protection Red Line Plan 2016–2020; Shandong Provincial Department of Environmental Protection: Jinan, China, 2016. [Google Scholar]
- Smith, M. CROPWAT: A Computer Program for Irrigation Planning and Management; Food & Agriculture Org.: Rome, Italy, 1992. [Google Scholar]
- Brunner, M.I. Reservoir regulation affects droughts and floods at local and regional scales. Environ. Res. Lett. 2021, 16, 124016. [Google Scholar] [CrossRef]
- Nunes, A.D.; Pruski, F. Improving the determination of reservoir capacities for drought control. Stoch. Environ. Res. Risk Assess. 2015, 29, 183–191. [Google Scholar] [CrossRef]
- Shan, B.; Guo, P.; Zhang, F.; Guo, S. Multi-objective optimization model solving method based on genetic algorithm and scheme optimization. J. China Agric. Univ. 2019, 24, 157–165. [Google Scholar]
- Noorollahi, Y.; Senani, A.G.; Fadaei, A.; Simaee, M.; Moltames, R. A framework for GIS-based site selection and technical potential evaluation of PV solar farm using Fuzzy-Boolean logic and AHP multi-criteria decision-making approach. Renew. Energy 2022, 186, 89–104. [Google Scholar] [CrossRef]
- Al Garni, H.Z.; Awasthi, A. Solar PV power plant site selection using a GIS-AHP based approach with application in Saudi Arabia. Appl. Energy 2017, 206, 1225–1240. [Google Scholar] [CrossRef]
- Bojer, A.K.; Bekalo, D.J.; Debelee, T.G.; Nadarajah, S.; Al-Quraishi, A.M.F. Rainwater Harvesting Site Selection for Drought-Prone Areas in Somali and Borena Zones, Oromia Regional State, Ethiopia: A Geospatial and Multi-Criteria Decision Analysis. Water 2024, 16, 1789. [Google Scholar] [CrossRef]
- Macchiaroli, M.; Dolores, L.; De Mare, G. Multicriteria Decision Making and Water Infrastructure: An Application of the Analytic Hierarchy Process for a Sustainable Ranking of Investments. Appl. Sci. 2023, 13, 8284. [Google Scholar] [CrossRef]


| Influencing Factors | Data Source | Data Processing |
|---|---|---|
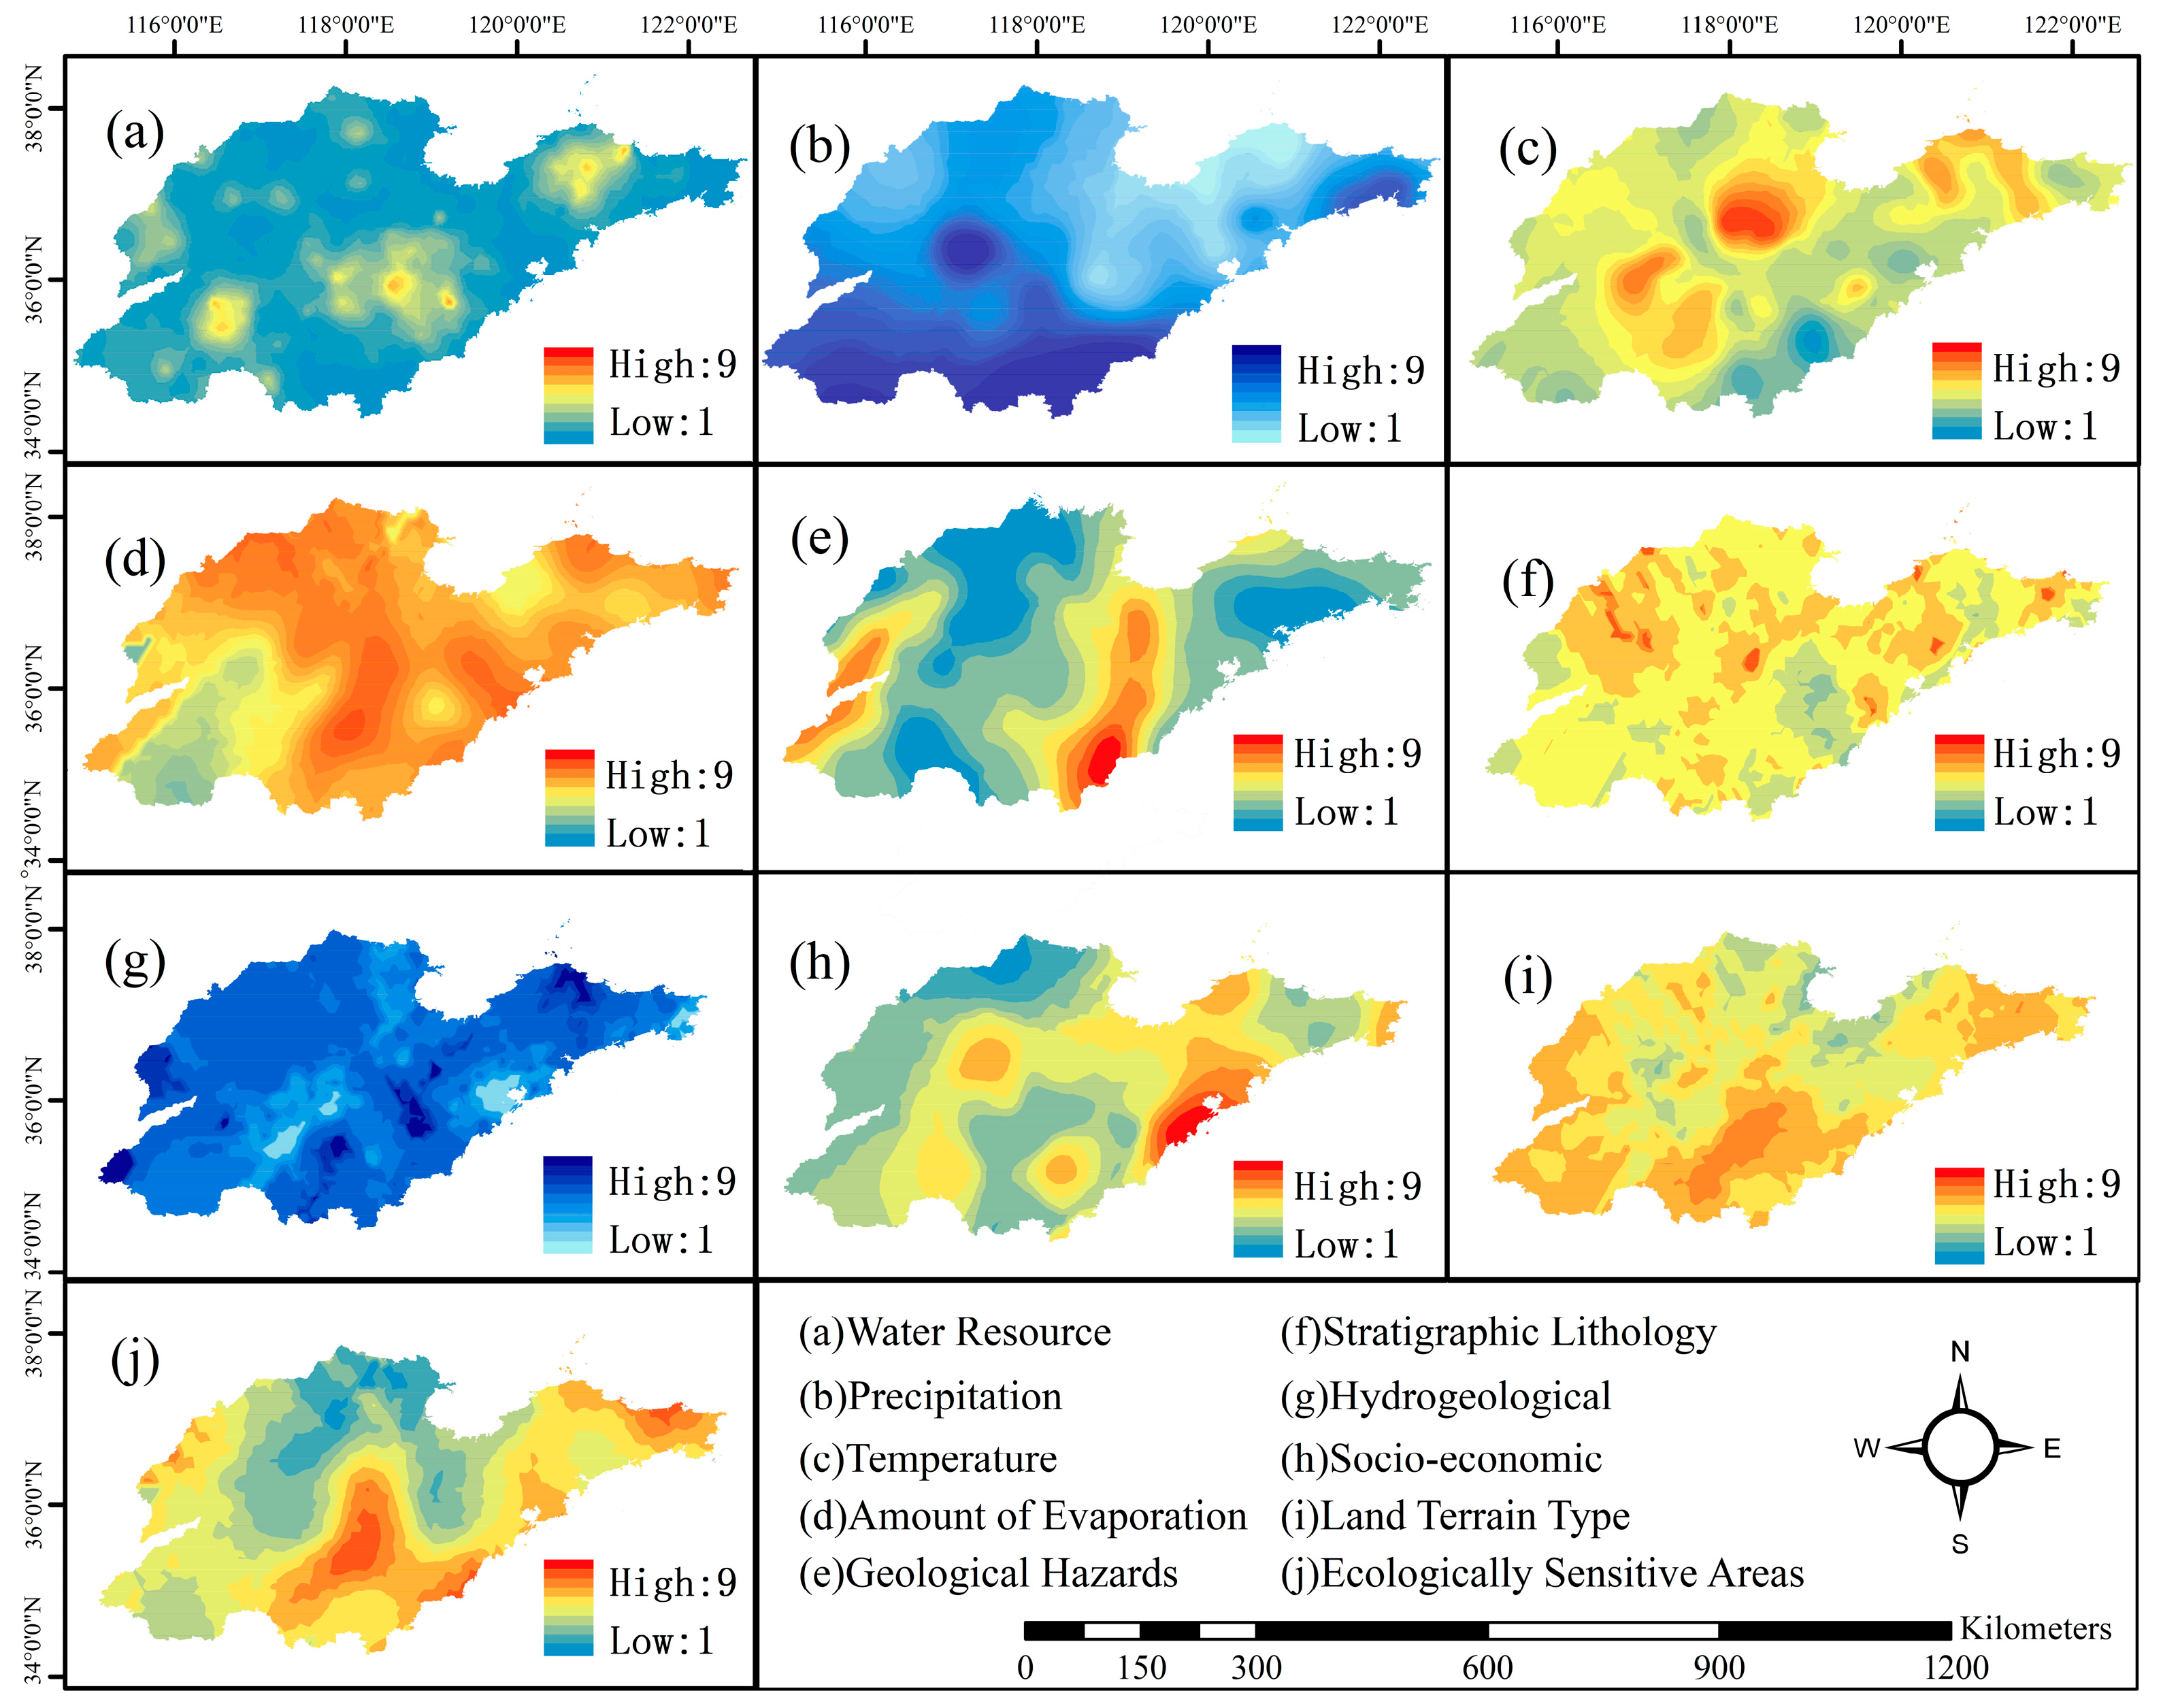
| water resource | Data comes from the vector map of the river basin water system data across China. | Water resources are an important factor influencing the site selection of reservoirs, and the factors of water sources include the basin area upstream of the dam site, the average flow over time, and the peak flow [33,34]. Research has found that the main factor affecting the storage capacity of large and medium-sized reservoirs is the flow of the river flowing into the reservoir. In addition, to facilitate the statistical management of rivers, China has established a set of river grading standards. The hydrological information such as the size of the river flow can be reflected through the river grade; the distance from the river can be used to judge the cost and necessity of building a reservoir. Therefore, this paper uses the river grade and the distance from the river to reflect the richness of the water source. |
| precipitation | Data comes from the annual precipitation distribution map of Shandong Province. | The values are assigned based on the standardized and transformed rainfall amounts of the coordinate points obtained from the annual precipitation distribution map of Shandong Province, with the assignment scores ranging from 1 to 9. |
| temperature | Data comes from the annual average temperature distribution map of Shandong Province. | Based on the annual average temperature distribution map of Shandong Province, the temperature values obtained for the coordinate points are standardized and transformed to obtain transformation scores, with the scoring range being [1,9]. The scoring method is the same as that for precipitation. |
| evaporation | Data comes from the evapotranspiration distribution map of Shandong Province. | Based on the evapotranspiration distribution map of Shandong Province, the values of evaporation obtained for the coordinate points are standardized and converted to obtain transformation scores, with the scoring range being [1,9]. The scoring method is the same as that used for precipitation. |
| geological hazards | Data comes from the seismic intensity distribution map of Shandong Province. | Based on the research in engineering hydrogeology by Wang Xue et al. [34,35,36,37,38], using the grading standards of seismic intensity [35,36], the intensity of geological disasters is analyzed to assess the impact of geological disasters on the suitability of reservoir construction. The coordinate points within Shandong Province are assigned values, where 0.2 g and 0.3 g represent the seismic acceleration, and g represents the acceleration due to gravity. |
| stratigraphic lithology | Data comes from the stratigraphic lithology distribution map of Shandong Province. | Based on the types of rock layers and the intensity of water richness displayed in the spatial distribution map of water-rich rock types in Shandong Province, the valuation of rock lithology is evenly divided. |
| hydrogeology | Data comes from the distribution map of groundwater resources in Shandong Province and the “Surface Water Quality Standards” [37]. | Based on the distribution map of groundwater resources in Shandong Province, the richness of groundwater sources is divided into five grades according to the classification standards in the map, with reference to the grading standards of groundwater water richness and the depth of groundwater burial for valuation. According to the degree of pollution of groundwater sources in Shandong Province, the water quality is divided into five categories following the water environmental quality grades defined in the “Surface Water Quality Standards” [37]. |
| socio-economic | Data comes from the GDP data of various counties in Shandong Province that were publicly disclosed in the 2021 Shandong Provincial Government Report. | Based on the GDP data of various counties in Shandong Province from the Shandong Provincial Government Report, standardized valuation is conducted for 329 points, with a valuation range of [1,9]. The valuation method is the same as that for precipitation. |
| Land terrain type | Data comes from the land use map and topographic map of Shandong Province. | To reduce the potential flood risks of reservoir construction on land use, relocation, farmland, and urban and rural settlements, minimize the destruction to the natural environment and ecology, ensure agricultural irrigation, and reduce the impact on economic development, this study assigns values to the types of land and terrain based on the land use map and topographic map of Shandong Province. |
| ecologically sensitive area | Data comes from the “Shandong Province Ecological Protection Red Line Planning” [38]. | In accordance with the “Shandong Province Ecological Protection Red Line Planning” [38], the spatial distribution locations of ecological protection areas are determined, and the distance between the planned reservoir sites and ecologically sensitive areas is planned to reduce the impact of reservoir construction on ecologically sensitive areas. This study assigns values to the research coordinate points based on their distance from ecologically sensitive areas. |
| Independent Variable to be Selected | Interpretation | Source of Data |
|---|---|---|
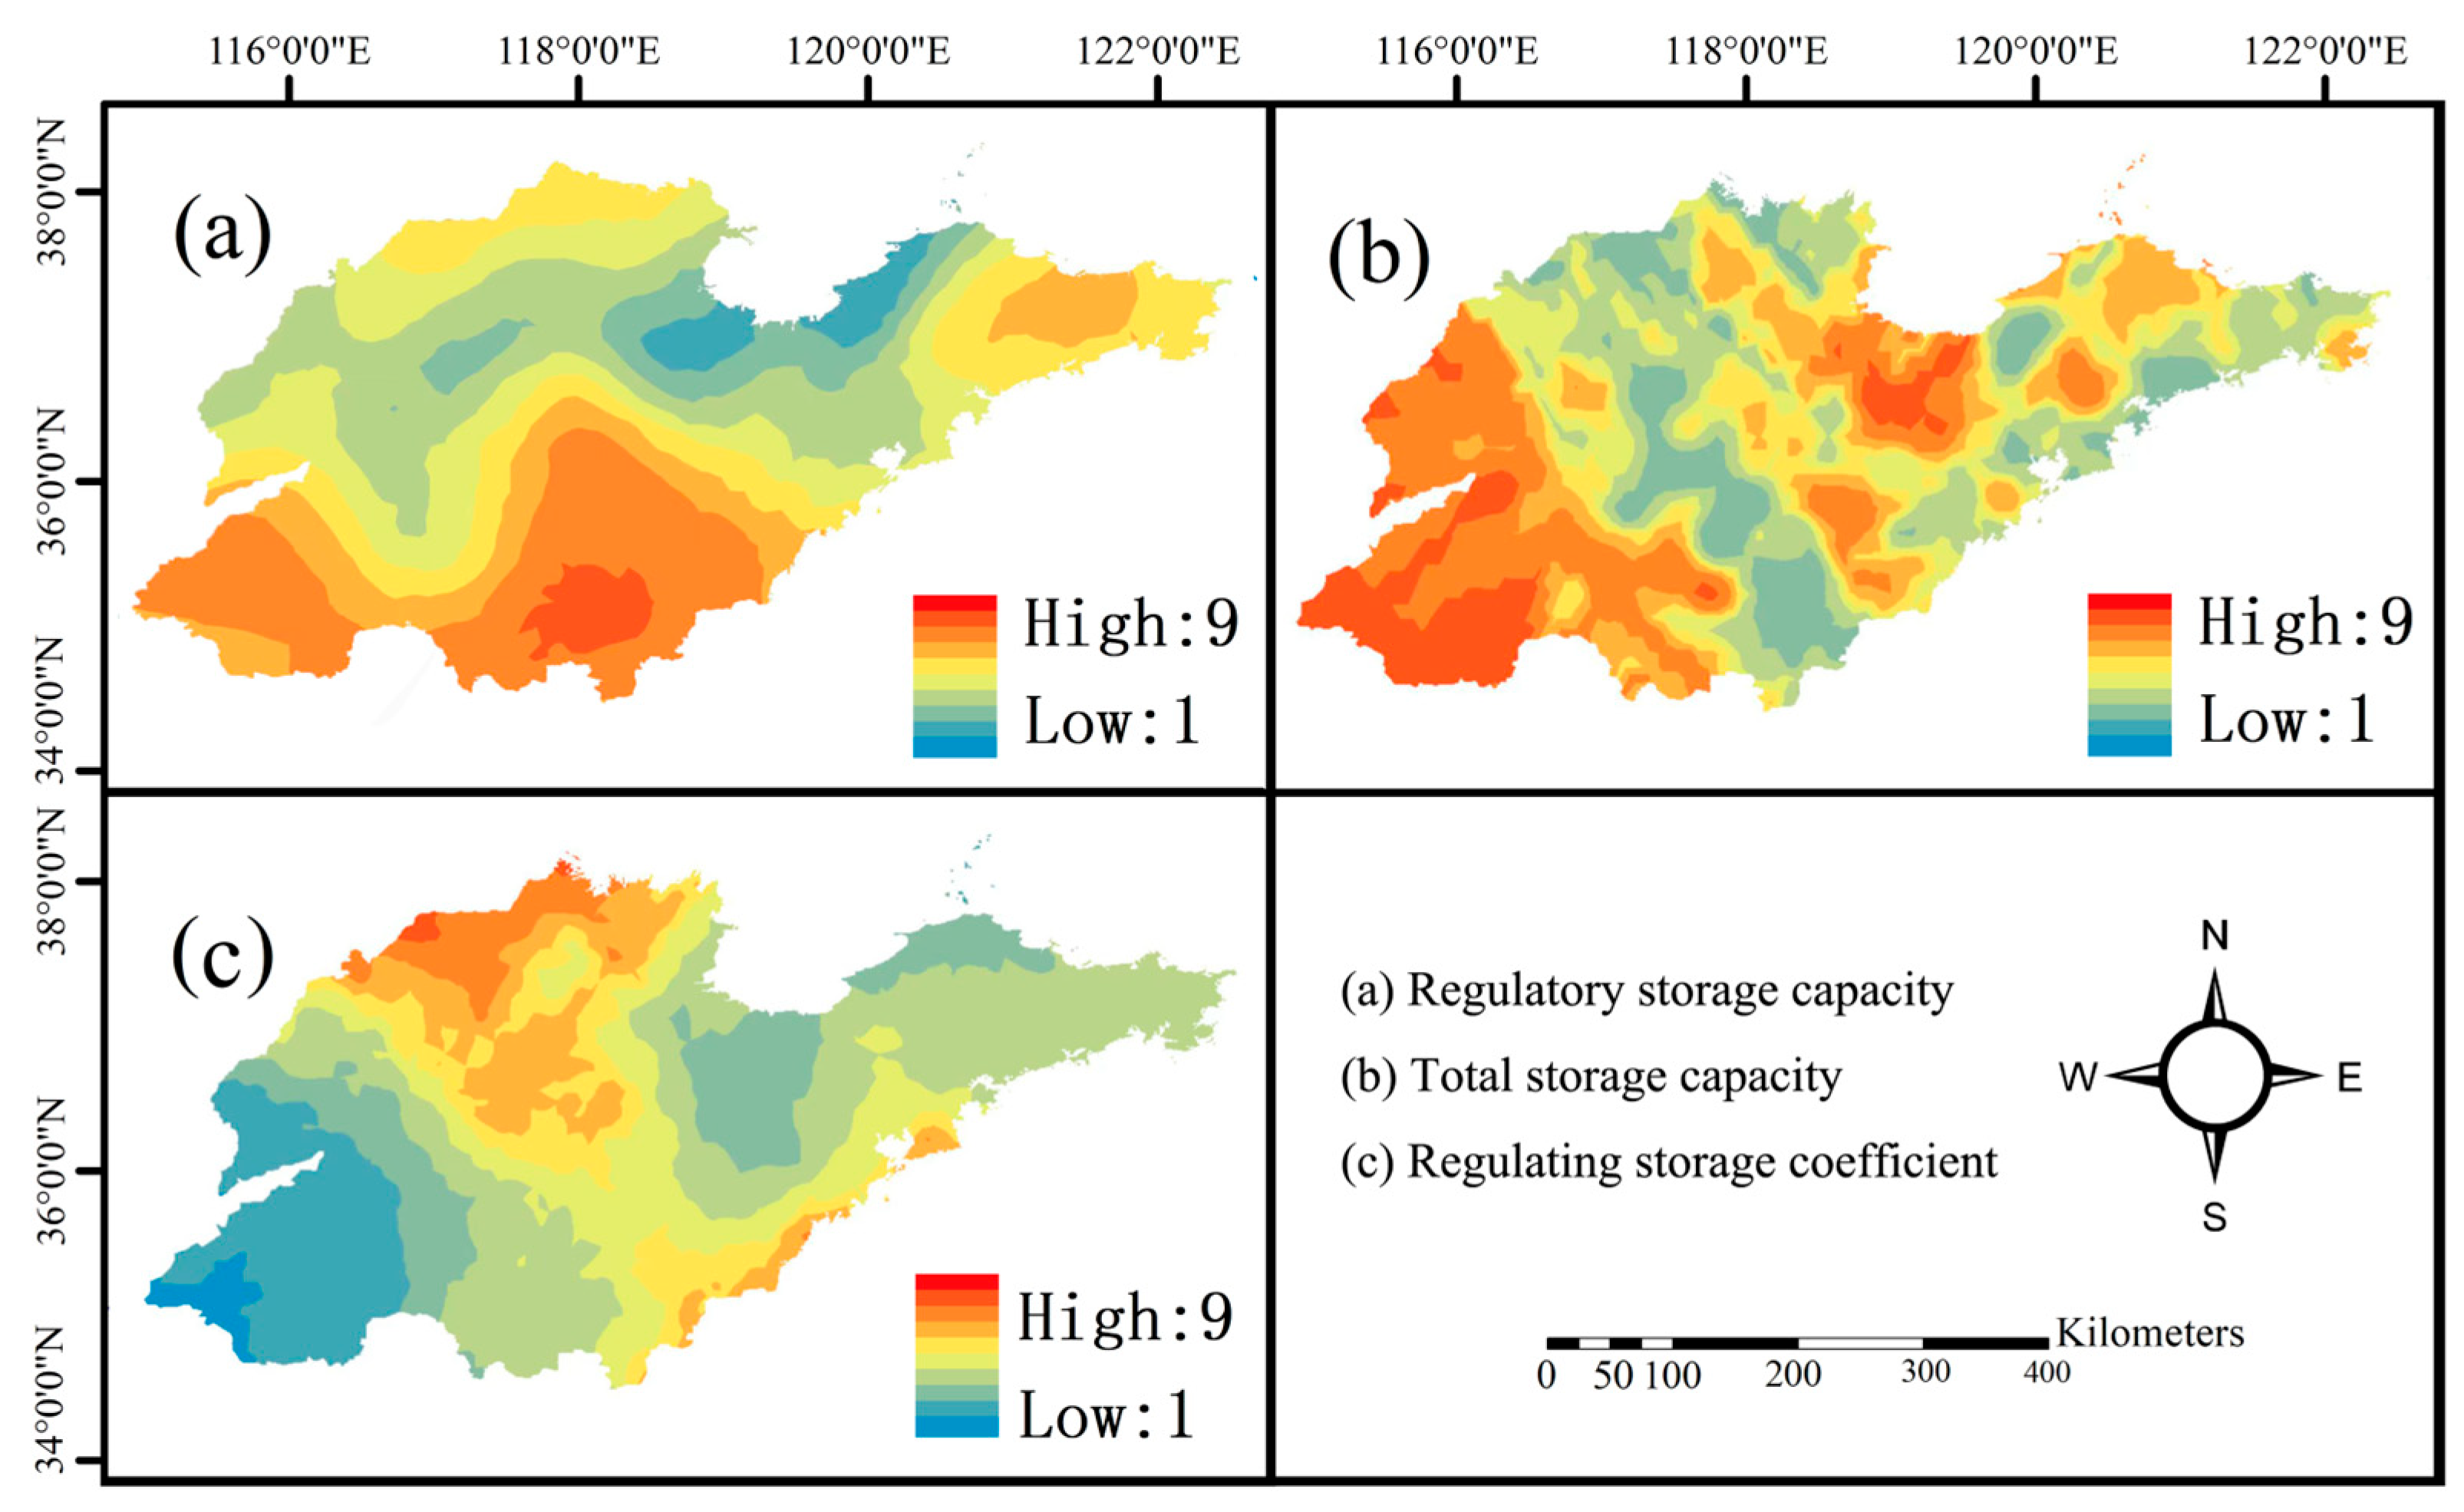
| Adjustment of storage capacity | Adjustment of storage capacity (also known as regulating storage capacity) is the volume of the reservoir between the normal storage level and the dead level. Used to regulate runoff and provide water supply to reservoirs. Natural runoff is redistributed for use by regulating the capacity of the regulating reservoir in accordance with water demand requirements. | Reservoir regulation capacity data for the study coordinate points were obtained from local reservoir reports. |
| Total capacity | Total reservoir capacity is the volume of the reservoir below the calibrated flood level. It is the sum of dead storage capacity, regulating storage capacity and flood control storage capacity, and is called total storage capacity. It is the total size of the reservoir construction. | Total reservoir capacity data for the study coordinate points were obtained from local reservoir reports. |
| Reservoir capacity factor (β) | Reservoir capacity factor (also known as regulating storage coefficient) is a measure of the ability of an artificially constructed water storage project (reservoir) to regulate the amount of water coming from the rain catchment area above the dam site, which is the ratio of the regulating capacity to the average amount of water coming from the reservoir over a number of years. | Reservoir capacity coefficient data for the study coordinate points were obtained from local reservoir reports. |
| Parameter | Value |
|---|---|
| Number of input neurons | 10 |
| Number of neurons in hidden layer | 8 |
| Number of output neurons | 1 |
| Total number of evolutionary iterations | 1000 |
| Population size | 100 |
| Crossover probability | 0.5 |
| Variation probability | 0.1 |
| Train set | 80% |
| Test set | 20% |
| Parameters | Value |
|---|---|
| Number of independent variables | 329 |
| Constraints on independent variables | |
| Population size | 100 |
| Maximum number of iterations | 200 |
| Pareto set proportion | 0.45 |
| Crossover ratio | 0.75 |
| Crossover function | crossoverheuristic |
| Variation function | mutationadaptfeasible |
| Category\Standard | RMSE | R |
|---|---|---|
| Adjustment of storage capacity | 0.10~0.14 | 0.65~0.94 |
| Total capacity | 0.19~0.25 | 0.23~0.61 |
| Reservoir capacity factor | 0.58~0.65 | 0.18~0.51 |
Disclaimer/Publisher’s Note: The statements, opinions and data contained in all publications are solely those of the individual author(s) and contributor(s) and not of MDPI and/or the editor(s). MDPI and/or the editor(s) disclaim responsibility for any injury to people or property resulting from any ideas, methods, instructions or products referred to in the content. |
© 2024 by the authors. Licensee MDPI, Basel, Switzerland. This article is an open access article distributed under the terms and conditions of the Creative Commons Attribution (CC BY) license (https://creativecommons.org/licenses/by/4.0/).
Share and Cite
Zou, M.; Xie, D.; Xu, L.; Dai, K.; Liang, S.; Guo, M.; Qin, X.; Zhao, W. Trade-Off and Synergy Mechanism of Agricultural Water Resource Spatial Allocation in Monsoon Climate Areas Based on Machine Learning: A Case Study of Reservoir Layout Optimization in Shandong Province, China. Agronomy 2024, 14, 1902. https://doi.org/10.3390/agronomy14091902
Zou M, Xie D, Xu L, Dai K, Liang S, Guo M, Qin X, Zhao W. Trade-Off and Synergy Mechanism of Agricultural Water Resource Spatial Allocation in Monsoon Climate Areas Based on Machine Learning: A Case Study of Reservoir Layout Optimization in Shandong Province, China. Agronomy. 2024; 14(9):1902. https://doi.org/10.3390/agronomy14091902
Chicago/Turabian StyleZou, Mingyu, Danfeng Xie, Liwen Xu, Ke Dai, Shuang Liang, Mengdie Guo, Xushuai Qin, and Weijun Zhao. 2024. "Trade-Off and Synergy Mechanism of Agricultural Water Resource Spatial Allocation in Monsoon Climate Areas Based on Machine Learning: A Case Study of Reservoir Layout Optimization in Shandong Province, China" Agronomy 14, no. 9: 1902. https://doi.org/10.3390/agronomy14091902