Article

Agronomic Behavior of Peanut (Arachis hypogaea L.) Cultivars under Three Planting Densities in the Northeast of Peru

by
Manuel Oliva-Cruz
*,
Jorge Ricardo Cabañas-López
,
Miguel A. Altamirano-Tantalean
,
Lily Juarez-Contreras
and
Carmen N. Vigo
Instituto de Investigación para el Desarrollo Sustentable de Ceja de Selva (INDES-CES), Universidad Nacional Toribio Rodríguez de Mendoza de Amazonas, 342 Higos Urco, Chachapoyas 01001, Peru
*
Author to whom correspondence should be addressed.
Agronomy 2024, 14(9), 1905; https://doi.org/10.3390/agronomy14091905
Submission received: 22 July 2024 / Revised: 23 August 2024 / Accepted: 24 August 2024 / Published: 26 August 2024
(This article belongs to the Section Innovative Cropping Systems)

Abstract

:
Factors such as the selection of cultivars and the planted density affect the development and yield of peanuts (Arachis hypogaea L.). This study’s objective was to evaluate peanut cultivars’ agronomic behavior under three planting densities in the northeast of Peru. The design used was randomized complete blocks (DBCAs) with a bifactorial arrangement 4A × 3B (factor A, peanut cultivars; factor B, planting densities), forming 12 treatments with three replications per block. The results revealed that T3 (Huayabamba cultivar + density of 30 × 50 cm) stood out, presenting the most favorable means in the number of pods (16 pods), number of seeds per pod (five seeds), height at 90 days (22.7 cm), and yield (1850 kg/ha). Empty pods did not show significant differences between treatments. T8 (Chivita cultivar + density of 20 × 50 cm) indicated the highest number of branches (six branches); in the weight of 100 seeds, the Rojo Tarapoto cultivar was the most encouraging, adapting optimally to the three densities. In addition, T7 (chivita cultivar + density of 10 × 50 cm) showed the shortest days at flowering and harvest, with 64 and 134 days. The study showed that T3 was the most efficient in pod and seed production, making it crucial to optimizing peanut yield.

1. Introduction

The peanut (Arachis hypogaea L.) is an oilseed of great importance in the industrial and agricultural sectors worldwide [1]. It contains a high concentration of energy, with significant amounts of protein, vitamins, fiber, and minerals. They are consumed worldwide due to their accessibility and economic cost compared to other nuts [2]. Consumption of peanuts helps to reduce the risk of cardiovascular diseases, gallstones, and diabetes [2,3,4]. In addition, it prevents obesity by moderating postprandial appetite, suppressing hunger, and increasing satiety levels after ingestion [5,6]. In 2022, Asia accounted for 58.4% of the 54 million tons of world production; Mainland China accounts for more than 57% of Asia’s production, establishing itself as the main producing country with 18.2 million tons; South America, Argentina, Brazil, Bolivia, Paraguay, and Peru are positioned as the five countries with the highest production of shelled peanuts [7]. Peru obtained 5619 tons of production, while Ecuador, Colombia, and France were the main importers of shelled peanut kernels, generating 3407 thousand dollars of free on board value [8].
Groundnut yield is influenced by the genetic potential of the cultivar chosen and the agronomic management practices applied [9]. The proper selection of genotypes with adaptability, as well as pest and disease resistance, is an alternative to increase these yields [10]. However, groundnut production faces multiple challenges, which restrict the potential of its genotypes; water stress, nutrient insufficiency, temperature extremes, planting density, and biotic factors contribute to yield decline [11]. Planting density is a crucial agronomic element that plays a significant role in crop growth, development, and productivity [12]. When planting density is low, resources such as water, light, and nutrients are more accessible, resulting in less competition among plants; as planting density increases, competition for resources intensifies [13], and as a consequence, plant development, organic matter levels, percentage of organic carbon, available nitrogen (N), effective iron (Fe), and bulk density decrease [14].
Detailed analysis of the characteristics of pods produced by groundnut cultivars are essential to identify the potential of different genotypes; these data are crucial not only for germplasm development and evaluation, but also to determine the cultivars most adapted to the specific conditions of an area [15]. A better understanding of the differences between genotypes and how these are reflected in their yield potential is a valuable tool for selection processes, thus facilitating future yield improvement [16]. Proper cultivar selection, precise sowing timing, and length of the growing season are critical factors that significantly influence plant development, yield, and grain quality [17]. The amount of heat accumulated during the vegetative period has a relationship with the sowing density, turning it a factor that determines the growth phases of the plant and defines the total duration of the cycle [18]. On the other hand, prolonging the grain filling period can markedly increase crop yield by allowing the kernels to accumulate more nutrients and develop more efficiently; however, a longer growing cycle can reduce groundnut yield, because adverse environmental conditions increase pod loss [19,20].
Numerous studies have documented the effects of planting density on peanut growth and yield. Research in Poland and Ghana has shown that higher densities can improve plant height and pod and seed yield, while studies in Nigeria have indicated that high planting density can significantly increase yield by as much as 40% [21,22,23]. In addition, the selection of adaptable and resistant genotypes has been identified as a key strategy to maximize yield under different agronomic conditions [5,6]. However, most of this research has been conducted in different geographical and climatic contexts, using cultivars different from those found in northeastern Peru, a region with unique agroecological conditions that may influence the yield of peanut genotypes.
Despite advances in the understanding of factors influencing peanut yield, there is a significant gap in research related to local cultivars in northeastern Peru. This region presents particular environmental characteristics that could affect the interaction between planting density and local genotypes, which influence yield. To date, there has been no comprehensive analysis assessing how these variables interact in this specific context, underscoring the need for studies that address this issue. This study set out to fill this research gap, providing data that will not only optimize local cultivation practices, but also contribute up-to-date information on the behavior of yield parameters. The point of innovation of this research lies in its focus on local genotypes and the adaptation of planting densities to the specific conditions of the region, offering new perspectives on the adaptation and optimization of peanut cultivation in underexploited contexts. The objective of this research was to evaluate the agronomic yield of peanut (Arachis hypogaea L.) cultivars under three planting densities in northeastern Peru.

2. Materials and Methods

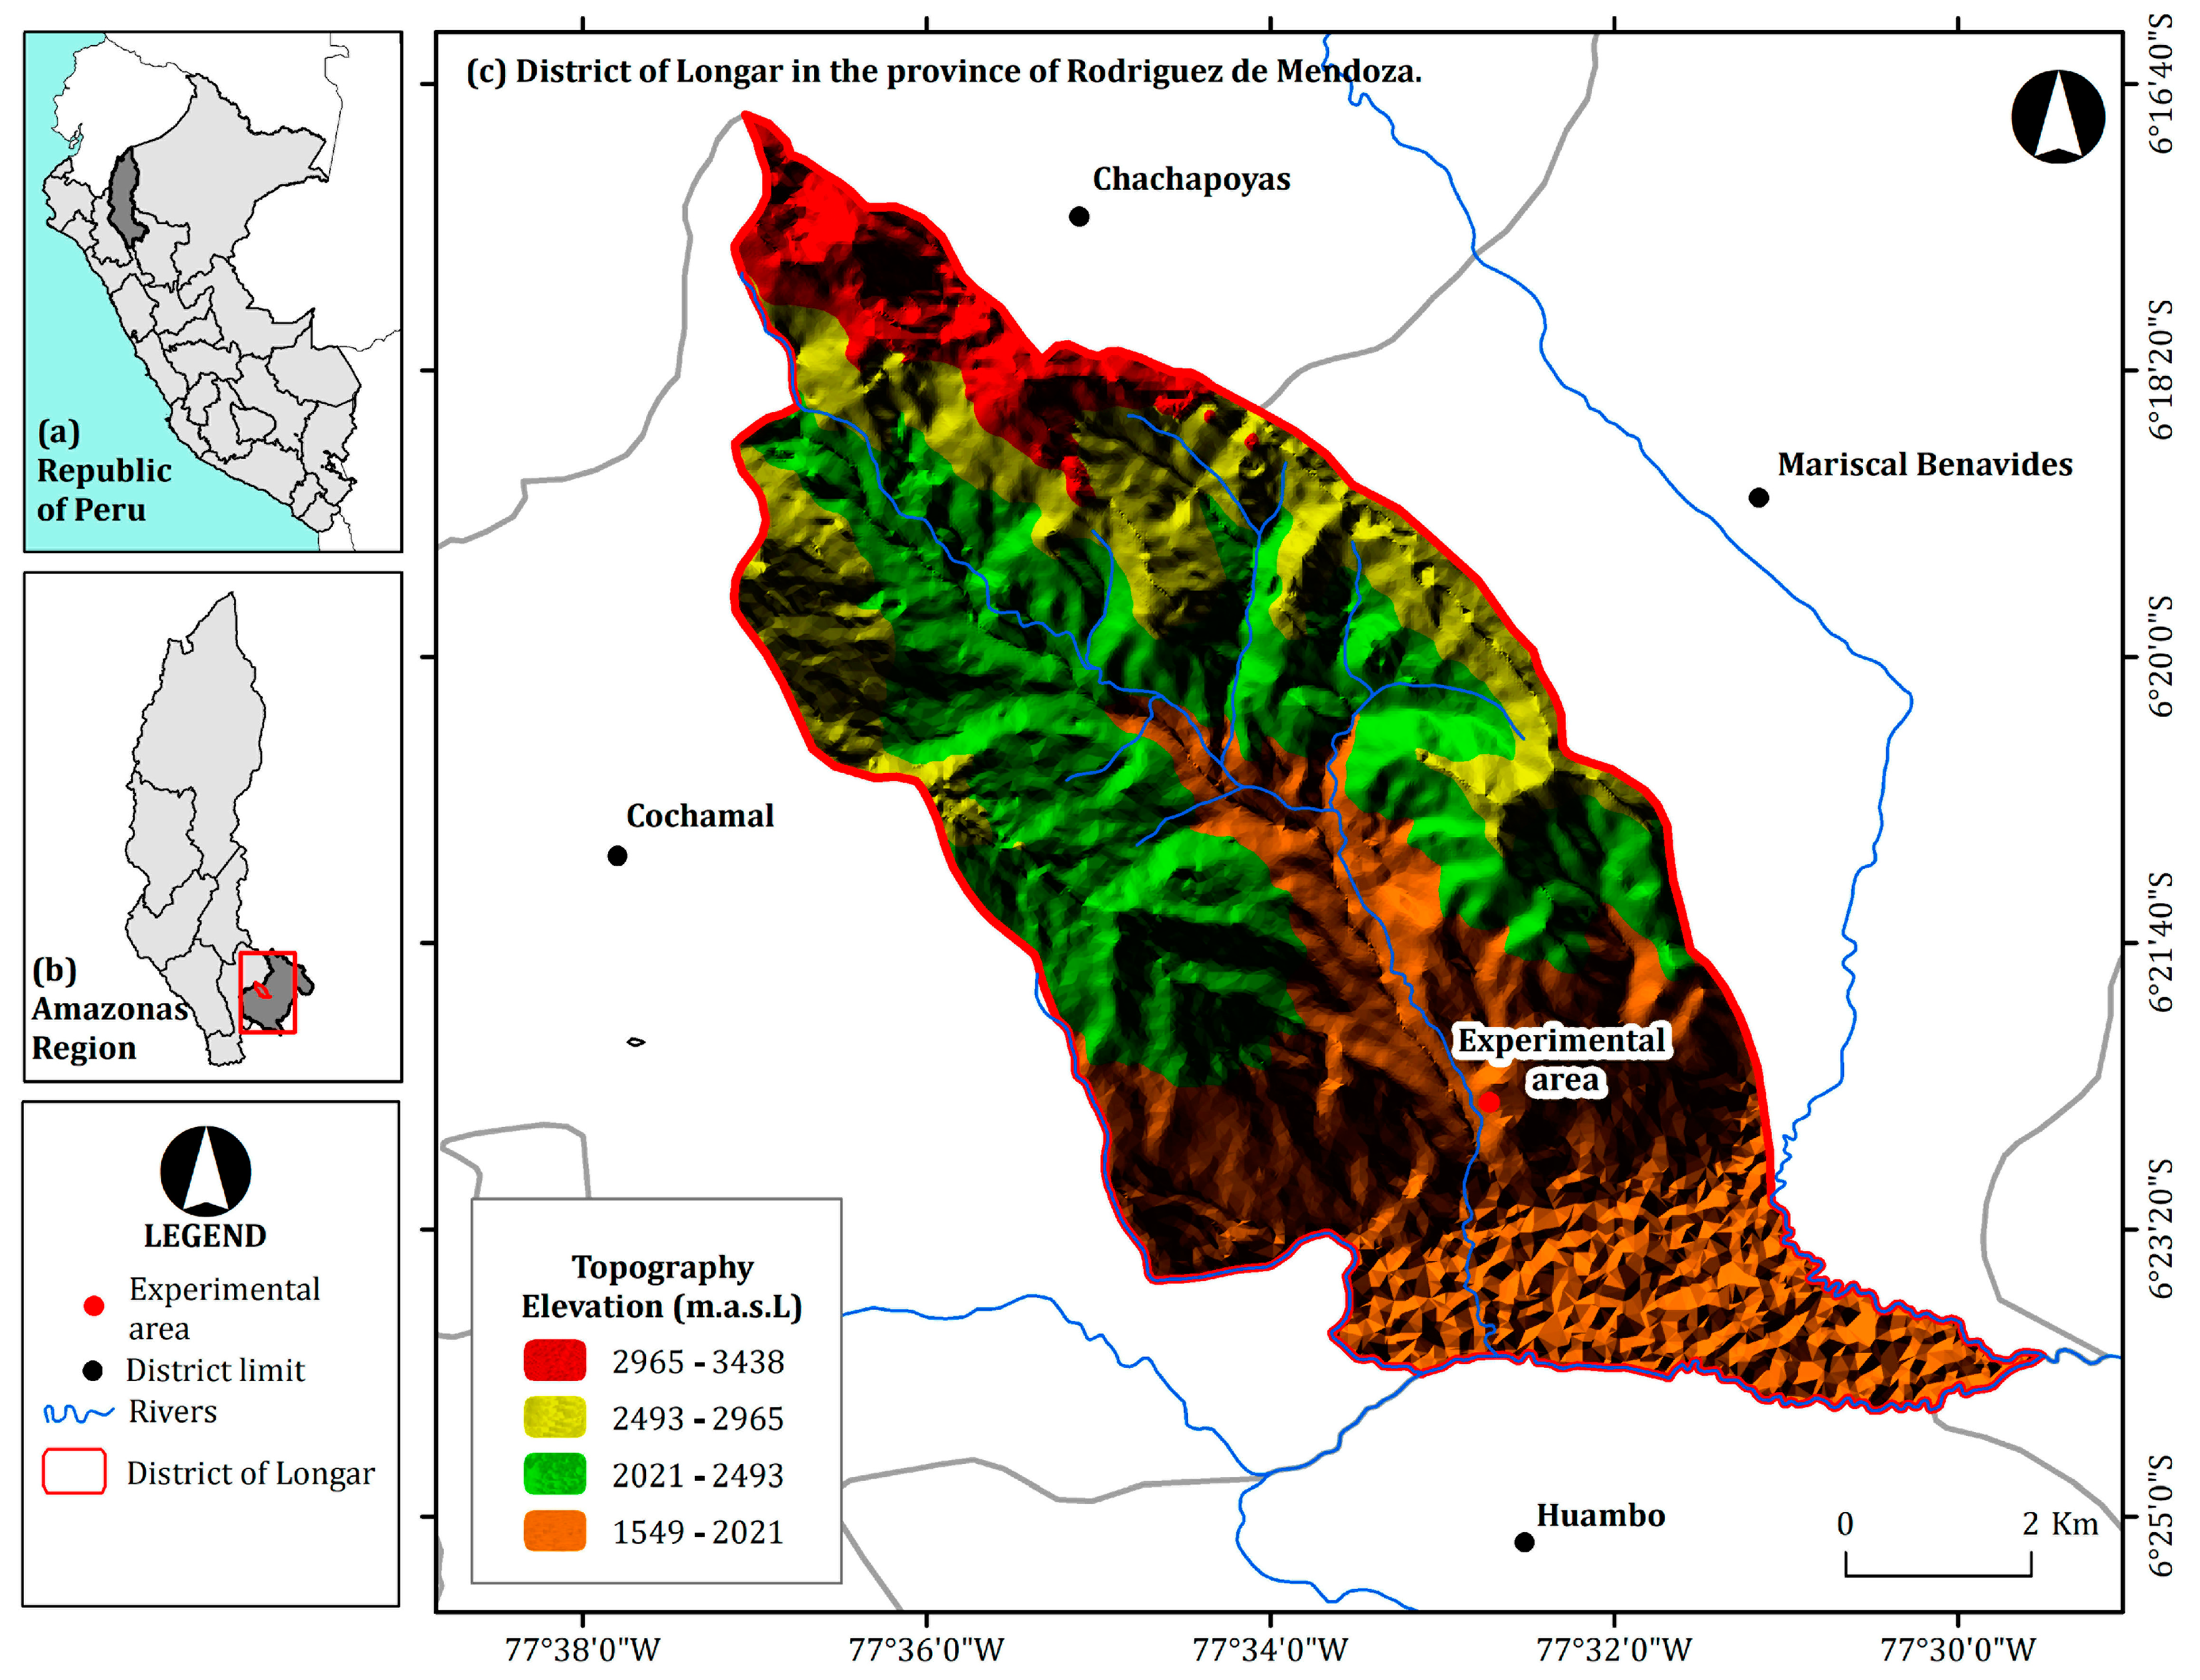
2.1. Area of Research

The present research work was carried out in the district of Longar, province of Rodríguez de Mendoza, department of Amazonas (Figure 1); the research area is located at an altitude of 1600 m.a.s.l. with the following coordinates: latitude south 6°23′8″ and longitude west 77°32′46″, with minimum and maximum temperatures of 9 and 26 °C.

2.2. Preparation of Genetic Material

Seeds were obtained from farmers in Longar district, which were collected in previous seasons in the same season. They were selected and dried to avoid the presence of fungi and other harmful organisms. These cultivars were selected for their resistance to Phytophthora infestans and for being relevant in the local market. In addition, they are short cycle (140–150 days to harvest) and are well adapted to altitudes of 1600 m.a.s.l., minimum and maximum temperatures ranging from 10 °C to 25 °C, average annual relative humidity of 79%, and average annual rainfall of 0.8 mm/day, which are the same characteristics of the area where the research was carried out. Each cultivar showed different percentages of gemination: Huayabamba (88.9%), Rojo Tarapoto (86.6%), Rojo Bola (79.2%), and Chivita (56.6%). The cultivars originate from Peru and have certain different morphological characteristics [24], as shown in Table 1.

2.3. Soil Physicochemical Characteristics

An area of 154 m2 (22 m × 7 m) with a total effective area of 47.52 m2 was selected for the installation of the Arachis hypogaea L. crop; the physicochemical characteristics of the soil were determined 15 days before planting; soil subsamples were collected from 5 different points and extracted with a shovel at a depth of 30 cm following a zigzag path; the subsamples were homogenized until a 1 kg sample was obtained after using the quartering method [25]. It was then coded and analyzed according to the methodology of Bazan [26] at the Soil and Water Research Laboratory (LABISAG) accredited by the National Institute of Quality, Ministry of Production under NTP-ISO/IEC 17025: 2017 [27] of the National University Toribio Rodriguez de Mendoza of Amazonas.
The soil sample presented physicochemical characteristics, detailing both physical and chemical aspects. Physically, the textural class of the soil was sandy loam. As for the chemical components, the pH was 5.84 and the electrical conductivity was 0.2 dS/m. Organic matter constituted 4.33%, with a nitrogen content of 0.22% and carbon 2.51%. Phosphorus levels were 1.19 ppm and potassium 292.4 ppm. Cation exchange capacity indicated 25.6 meq/100g. In addition, potassium as a positive cation was 0.72 meq/100 g, bivalent calcium and magnesium were 19.99 meq/100 g and 2.15 meq/100 g, and sodium as a positive cation was 0.17 meq/100 g.

2.4. Installation of the Crop

The preparation of the land began with the elimination of weeds; then, the soil was ploughed to a depth of approximately 25 cm, and a harrow pass was made and with a raffia, wherein the demonstrative plots were traced. Once the seeds of the peanut cultivars were obtained, they were separated into containers according to each cultivar, and a systemic fungicide (Emesto Prime, Bayer, México, México) was applied to each of them, with a dose of 0.06 L per 100 kg of seed—based on the product’s technical data sheet.
The sowing was carried out on 16 October 2020 after the adequate preparation of the land and the respective layouts of the demonstration plots; the seeds of the peanut cultivars were sown based on the densities described in the treatments (Table 2) for which holes were made, and one seed was placed per stroke (per hole). Then, the holes were covered with soil from the same field in order to prevent the seeds from being extracted by birds or rodents.

2.5. Cultivation Work

Fertilization was via foliar [28] and was done only once throughout crop development to ensure that plants have only the basic nutrients to develop uniformly, controlling the fertilization variable to avoid interference from the effects on planting densities and cultivars; this ensures that any observed differences in crop yields can be attributed primarily to the interaction of planting density factors and cultivars. Fertilization was carried out 60 days after planting with a foliar fertilizer (Multi-Frut, FARMAGRO S.A., Lima, Perú.) composed mainly of phosphorus (P) and potassium (K). A dose of 100 cc in 20 L of water was applied with the help of a manual knapsack.
Irrigation was managed under a dryland system, i.e., it only received water from rainfall due to the constant rainfall and the type of soil favorable for the development of this crop.
For phytosanitary control, a contact fungicide (Dithane NT, Corteva Agriscience Argentina S. R. L., Buenos Aires, Argentina.) was applied at 30 g in 20 L of water using a manual knapsack to combat leaf spots (Phytophthora infestans). Weed control was also carried out continuously throughout the crop cycle.

2.6. Variables Evaluated

For the evaluation of each variable, 6 plants were taken at random from each experimental unit. Plant height was measured from the base of the plant to the apex, expressed in (cm) at 60 and 90 days after planting. The number of branches per plant was evaluated 90 days after planting. In addition, the number of pods, seeds per plant, and the number of empty pods were counted. For the phenological calendar, the days elapsed from sowing to 50% flowering were recorded, and for harvesting, plants were evaluated when they showed a brown color. Also, 100 seeds per treatment were weighed in grams to determine their weight. Finally, the yield per hectare was estimated from the total weight of pods per treatment.

2.7. Description of Treatments

The treatments were composed of the interaction of the combination of peanut cultivars and planting densities under field conditions, as shown in Table 2.

2.8. Experimental Design

The design used was a randomized complete block design (RCBD) with a 4A × 3B bifactorial arrangement (factor A, peanut cultivars; factor B, planting densities). It formed 12 plots with three replications per block, giving a total of 36 experimental units. Each experimental unit was 1.32 m2 (1.10 m × 1.20 m), and the distances between units were 70 cm.

2.9. Data Analysis

The data obtained for the variables evaluated were subjected to a normality test (Shapiro–Wilks) and homogeneity of variances (Bartlett). Data that presented a normal distribution and homogeneity were subjected to a 2-way ANOVA and Duncan’s multiple comparison test (p ≤ 0.05). On the contrary, data that did not present a normal distribution were worked with the Kruskal–Wallis nonparametric test. The data were analyzed with the R statistical program version 4.3.2 for Windows.

3. Results

3.1. Height of Plant and Phenological Calendar

The results showed that there were no significant differences at the level of planting densities (10 × 50 cm, 20 × 50 cm, 30 × 50 cm) in any of the parameters measured. However, there were notable differences at the cultivar level. The Huayabamba cultivar stood out with the highest values in all evaluations for plant height at 60 (15.94 cm) and 90 days (21.76 cm), with the longest days to until flowering (91 days) and harvest (182 days), while the lowest values were obtained for the Chivita cultivar, with plant height at 60 and 90 days of 13.31 and 14.07 cm, and days to until flowering and harvest of 65 and 133 days, being the earliest of all cultivars. At the treatment level, for plant height at 60 and 90 days after planting, differences were observed between treatments, where the least favorable height was observed in the interaction of the Chavita cultivar with the three planting densities (T7, T8, and T9). In the evaluation of the phenological calendar, the longest days to flowering and harvest were presented by the cultivar Huayabamba in the three planting densities (T1, T2, and T3); however, the shortest days were presented by the cultivar Chavita (T7, T8, and T9) (Table 3).

3.2. Yield Variables

As shown in Table 4, at the density level, there were no significant differences for the variables number of branches, number of seeds/pods, empty pods, and weight of 100 seeds; but in the number of pods, the planting density of 30 × 50 cm reached the highest values with 12.68 pods, being statistically different from the densities of 10 × 50 cm and 20 × 50 cm.
At the cultivar level, there were no significant differences in the variable of empty pods; but for the variables of number of branches, number of seeds/pods, weight of 100 seeds, and number of pods, the Huayabamba cultivar had a significant influence and obtained the best values in the evaluations.
At the treatment level, the Huayabamba cultivar with the three planting densities (T1, T2, and T3) showed the highest number of branches, but it did not differ statistically from the treatments of the Chivita cultivar with the densities 20 × 50 cm and 30 × 50 cm (T8 and T9) upon comparing the best averages: T8 was superior to T3 by 11.48% in the number of branches. On the contrary, T3 (cultivar Huayabamba + 30 × 50 cm density) presented a favorable average regarding the number of pods (16 pods) compared to the other treatments. The highest average in terms of the number of seeds per pod (five pods) was revealed in the Huayabamba cultivar in the three planting densities (T1, T2, and T3); all these treatments, however, were not statistically different from the Rojo Tarapoto cultivar in the three planting densities (T4, T5, and T6). In addition, there were no significant differences in the number of empty pods. The most promising 100-seed weight was shown by the cultivar Rojo Tarapoto subjected to three levels of densities represented by T4, T5, and T6, with 119.8, 119.2, and 118.6 g.
Table 5 shows that density levels had a significant effect, where the planting density of 30 × 50 was the most favorable in relation to the yield variable. Th cultivars levels did not have a significant influence on peanut yields.
In relation to the treatments, the yield variable’s most favorable mean was acquired of T3 (Huayabamba cultivar + density of 30 × 50 cm) with 1850 kg/ha. The lowest yield values were reached with T7 (Chivita cultivar + density of 10 × 50 cm) with 620 kg/ha.

4. Discussion

Our research revealed significant variations in the evaluated variables over time, providing valuable insights into yield responses in relation to planting density and cultivars under specific regional conditions. These findings will lay a solid foundation for future research. The Huayabamba cultivar, planted at low density (30 × 50 cm), showed superior performance in most of the analyzed variables, suggesting that the optimal response of some cultivars could be influenced by their drought resistance, as each responds uniquely to water stress by activating specific adaptation mechanisms [29].
Although this study did not focus on water stress, as a rainfed irrigation system was used, our findings may guide future research. A cultivar with outstanding genetic characteristics notably impacts its growth and development, which are reflected in greater plant height, which facilitates agricultural tasks such as harvesting and increases productive capacity [30,31]. For example, Iddrisu et al. [32] obtained favorable results with a 30 × 15 cm density, reaching maximum heights of 21.1 cm at 56 days with the Yenyawoso cultivar. Similarly, Nwokwu et al. [33] reported that higher planting density increases the height of peanut plants, regardless of the variety. In contrast, our results indicate that planting density did not significantly affect plant height, although the Chivita cultivar showed the shortest height at 90 days under different planting densities (T7, T8, and T9).
A reduction in days to flowering and harvest was observed with high planting density (10 × 50 cm) in combination with the Chivita cultivar. Previous studies have shown that optimal planting density can shorten the phenological cycle, although this depends on the cultivar and its genetic characteristics [34]. Days to flowering can vary among genotypes, which are affected by factors such as water availability and temperature, with the most adaptable genotypes responding better under adverse conditions [35]. Early-maturing cultivars under short photoperiods tend to flower more quickly [36,37,38,39]. Days to harvest also vary depending on the planting date, with possible delays of up to 21 days, which are influenced by the genetic characteristics of the cultivar and its productive potential [40]. These findings are relevant for optimizing agricultural practices in regions with similar conditions, suggesting that the combination of high planting density with specific genotypes such as Chivita may be recommended to accelerate the crop cycle.
At the treatment level, our results underscore the importance of the interaction between planting density and cultivar to optimize yield and other agronomic variables. In particular, the Huayabamba cultivar showed superior yield at low density (30 × 50 cm, T3), suggesting efficient capture and use of sunlight and contributing to higher yields [41]. Studies indicate that the number of branches is linked to planting density, where high density can reduce the number and diameter of branches and the number of nodes through results obtained under gravity irrigation [42,43]. In our study, using rainfed irrigation, we observed that low planting density produced more branches, especially in T3, while T10 (red ball + 10 × 50 cm) with high density showed fewer branches and lower yield. Dapaah et al. [44] noted that greater branch development can favor production by increasing the plant’s photosynthetic capacity, although this also depends on the cultivar and environmental conditions [45,46]. Other studies have shown that low planting density increases the number of branches, reaching approximately 10.25 per plant [33,47]. In our case, planting density did not significantly influence the number of branches, but it did affect the number of pods, with 30 × 50 cm density standing out and the Huayabamba cultivar showing the best results in these variables.
The number of pods and seeds per pod in treatment T3 was notably higher. Yousif and Hussain [48] found that variations in the number of pods per plant in different peanut cultivars were mainly due to their genetic inheritance. In contrast, Chen et al. [49] determined that low density positively influences the number of pods, although the number of seeds and yield showed an inversely proportional relationship. However, in our study, the number of seeds per pod and yield showed a directly proportional relationship.
In studies by Al-Shammari and Jaburi [50], evaluating fava bean (Vicia faba L.) cultivars under foliar fertilization with Zinc at low planting density, a greater number of pods and seeds per pod was observed, while plants grown at high density were superior in height and total yield. These findings align with ours, where the interaction between the Huayabamba cultivar and low planting density (T3) showed a direct relationship with the number of pods and seeds per pod without decreases in these variables. Similar research in semi-arid tropical areas with dry seasons, using a 30 × 10 cm density, also reported good results in the number of pods and yield [51,52]. In subtropical Australia, two peanut cultivars planted at different planting densities under irrigation from stored soil water showed an increase in the number of pods per m2 with low density (40,000 plants/ha) [53]. In our study, planting density (30 × 50 cm) and the Huayabamba cultivar influenced the number of pods, while yield was more related to planting density. An advantage of low density is the reduction of abiotic stress, thus improving yield, so combining low planting density with an appropriate planting date is recommended to optimize results [54].
While high planting density can increase yields, this may decrease the number of pods, weight of 100 pods, and weight of 100 seeds [55]. In research conducted in Syria, it was observed that low planting density increased the weight of 100 seeds and the number of seeds per plant in two Arachis hypogaea cultivars [56]. In the Cañete Valley, Peru, the Tarapoto cultivar showed the best yields with 2,516 kg/ha at a density of 30 × 85 cm, while the cultivars Colec I-95/50 (98.72 g) and Boliviano (86.55 g) stood out in the weight of 100 seeds [57]. According to our results, the weight of 100 seeds was not significantly influenced by densities, but the 30 × 50 cm density affected yield. The Huayabamba cultivar notably influenced the weight of 100 seeds and the number of pods. In terms of yield, the Huayabamba cultivar, planted at low density (30 × 50 cm), obtained the best results despite not achieving the highest weight of 100 seeds; other yield variables were not affected by this planting density. Additionally, the agronomic behavior of the plant can be modified with adequate temperatures; high planting density may decrease yields due to increased abiotic stress caused by the absorption of photosynthetically active radiation (PAR) [36,39].

5. Conclusions

The results revealed that planting densities and peanut cultivars had a significant impact; a low density (30 × 50 cm) with the Huayabamba cultivar presented higher averages in most of the variables evaluated compared to the other treatments. The cultivar Chivita with a medium density (20 × 50 cm) registered the highest number of branches; in the weight of 100 seeds, the cultivar Rojo Tarapoto was the most promising, adapting optimally to the three density levels, where its high density (10 × 50 cm) sowing showed shorter days to flowering and harvest. Each cultivar’s genetic potential influenced these results regarding resistance to different stresses.
These findings suggest that cultivar selection and planting density are key strategies for optimizing groundnut crop yield. However, more comprehensive studies in different seasons and locations are needed to validate and extend these initial results. The implementation of these practices could improve the efficiency and economic sustainability of peanut cultivation, increasing competitiveness in various markets and benefiting producers.

Author Contributions

M.O.-C.: Conceptualization, resources, project administration, writing—original draft; J.R.C.-L.: Conceptualization, Investigation, writing—original draft; M.A.A.-T.: Methodology, data curation, writing—original draft; L.J.-C.: Investigation, formal analysis, writing—original draft; C.N.V.: Methodology, validation, writing—review and editing. All authors have read and agreed to the published version of the manuscript.

Funding

The authors are grateful for the funding provided to the projects SNIP N° 352650 “Creación del Centro de Investigación Forestal y Agrosilvopastoril de la Universidad Nacional Toribio Rodríguez de Mendoza, Región Amazonas”—CEINFOR—and SNIP N° 312252 “Creación del Servicio de un Laboratorio de Fisiología y Biotecnología Vegetal de la Universidad Nacional Toribio Rodríguez de Mendoza, región Amazonas”—FISIOBVEG. In addition, they thank the Vice Rectorate of Research of the National University Toribio Rodríguez de Mendoza of Amazonas.

Data Availability Statement

The original contributions presented in the study are included in the article; further inquiries can be directed to the corresponding author.

Conflicts of Interest

The authors declare that they have no conflicts of interest.

References

  1. Archer, P. Chapter 9—Overview of the Peanut Industry Supply Chain. In Peanuts, 1st ed.; Elsevier: Amsterdam, The Netherlands, 2016; pp. 253–266. [Google Scholar] [CrossRef]
  2. Bonku, R.; Yu, J. Health aspects of peanuts as an outcome of its chemical composition. Food Sci. Hum. Wellness 2020, 9, 21–30. [Google Scholar] [CrossRef]
  3. Lovejoy, J.C. The impact of nuts on diabetes and diabetes risk. Curr. Diab. Rep. 2005, 5, 379–384. [Google Scholar] [CrossRef] [PubMed]
  4. Luu, H.N.; Blot, W.J.; Xiang, Y.-B.; Cai, H.; Hargreaves, M.K.; Li, H.; Yang, G.; Signorello, L.; Gao, Y.-T.; Zheng, W.; et al. Prospective Evaluation of the Association of Nut/Peanut Consumption With Total and Cause-Specific Mortality. JAMA Intern. Med. 2015, 175, 755. [Google Scholar] [CrossRef]
  5. Kirkmeyer, S.; Mattes, R. Effects of food attributes on hunger and food intake. Int. J. Obes. 2000, 24, 1167–1175. [Google Scholar] [CrossRef] [PubMed]
  6. Tan, S.Y.; Mattes, R.D. Appetitive, dietary and health effects of almonds consumed with meals or as snacks: A randomized, controlled trial. Eur. J. Clin. Nutr. 2013, 67, 1205–1214. [Google Scholar] [CrossRef]
  7. FAOSTAT. Crops and Livestock Products. Available online: https://www.fao.org/faostat/en/#data/QCL/visualize (accessed on 25 April 2024).
  8. MIDAGRI (Ministerio de Desarrollo Agrario y Riego). Exportaciones Totales. Available online: https://app.powerbi.com/view?r=eyJrIjoiZThmNGM3NmEtNTFmYy00MDQyLWIwNWQtMjBlYjFiNzdkNjk2IiwidCI6IjdmMDg0NjI3LTdmNDAtNDg3OS04OTE3LTk0Yjg2ZmQzNWYzZiJ9 (accessed on 25 April 2024).
  9. Sagvekar, V.V.; Waghmode, B.D.; Kamble, A.S.; Mahadkar, U.V. Optimization of Groundnut (Arachis hopogaea L.) Production Technologies under Various Resource Constraints in Konkan Region. Int. J. Curr. Microbiol. Appl. Sci. 2017, 6, 1498–1503. [Google Scholar] [CrossRef]
  10. Kishlyan, N.V.; Bemova, V.D.; Matveeva, T.V.; Gavrilova, V.A. Biological peculiarities and cultivation of groundnut (a review). Proc. Appl. Bot. Genet. Breed. 2020, 181, 119–127. [Google Scholar] [CrossRef]
  11. Sadras, V.O.; Villalobos, F.J.; Fereres, E. Limitations to Crop Productivity. In Principles of Agronomy for Sustainable Agriculture; Villalobos, F.J., Fereres, E., Eds.; Springer International Publishing: Cham, Switzerland, 2016; pp. 205–213. [Google Scholar] [CrossRef]
  12. Asik, B.B.; Uzun, A.; Acikgöz, E. Seeding rate and cultivar impacts on nutrient uptake of field pea under fertile soil condition. Chil. J. Agric. Res. 2020, 80, 11–20. [Google Scholar] [CrossRef]
  13. Siqueira, P.L.D.O.F.; Silva, P.S.L.E.; Silva, K.E.F.; Oliveira, V.R.D.; Dantas, I.M.; Oliveira, F.H.T.D. Soil fertility beneath the crown of tree species submitted to planting densities. Rev. Bras. Eng. Agríc. E Ambient. 2014, 18, 914–919. [Google Scholar] [CrossRef]
  14. Duan, A.; Lei, J.; Hu, X.; Zhang, J.; Du, H.; Zhang, X.; Guo, W.; Sun, J. Effects of Planting Density on Soil Bulk Density, pH and Nutrients of Unthinned Chinese Fir Mature Stands in South Subtropical Region of China. Forests 2019, 10, 351. [Google Scholar] [CrossRef]
  15. Nautiyal, P.C.; Ravindra, V.; Rathnakumar, A.L.; Ajay, B.C.; Zala, P.V. Genetic variations in photosynthetic rate, pod yield and yield components in Spanish groundnut cultivars during three cropping seasons. Field Crops Res. 2012, 125, 83–91. [Google Scholar] [CrossRef]
  16. Haro, R.J.; Baldessari, J.; Otegui, M.E. Genetic improvement of peanut in Argentina between 1948 and 2004: Seed yield and its components. Field Crops Res. 2013, 149, 76–83. [Google Scholar] [CrossRef]
  17. Caliskan, S.; Caliskan, M.E.; Arslan, M.; Arioglu, H. Effects of sowing date and growth duration on growth and yield of groundnut in a Mediterranean-type environment in Turkey. Field Crops Res. 2008, 105, 131–140. [Google Scholar] [CrossRef]
  18. Ketring, D.L.; Wheless, T.G. Thermal Time Requirements for Phenological Development of Peanut. Agron. J. 1989, 81, 910–917. [Google Scholar] [CrossRef]
  19. Williams, J.H. The implications and applications of resource capture concepts to crop improvement by plant breeding. Agric. For. Meteorol. 2000, 104, 49–58. [Google Scholar] [CrossRef]
  20. Egli, D.B. Seed- Fill Duration and Yield of Grain Crops. Adv. Agron. 2004, 83, 243–279. [Google Scholar] [CrossRef]
  21. Helios, W.; Jama-Rodzeńska, A.; Serafin-Andrzejewska, M.; Kotecki, A.; Kozak, M.; Zarzycki, P.; Kuchar, L. Depth and Sowing Rate as Factors Affecting the Development, Plant Density, Height and Yielding for Two Faba Bean (Vicia faba L. Var. Minor) Cultivars. Agriculture 2021, 11, 820. [Google Scholar] [CrossRef]
  22. Dapaah, H. Growth and Yield Performance of Groundnuts (Arachis hypogaea L.) in Response to Plant Density. Int. J. Plant Soil Sci. 2014, 3, 1069–1082. [Google Scholar] [CrossRef] [PubMed]
  23. Ajeigbe, H.A.; Kamara, A.Y.; Kunihya, A.; Inuwa, A.H.; Adinoyi, A. Response of Groundnut to Plant Density and Phosphorous Application in the Sudan Savanna Zone of Nigeria. Int. J. Biosci. 2016, 16, 291–302. [Google Scholar]
  24. Krapovičkas, A.; Vanni, R.O.; Pietrarelli, J.R.; Simpson, C.E. Las razas de maní de Perú. Bonplandia 2013, 22, 19–90. [Google Scholar] [CrossRef]
  25. Mendoza Reynanldo, E.A. Guía Técnica para Muestreo de Suelos. Available online: https://repositorio.una.edu.ni/3613/1/P33M539.pdf (accessed on 20 May 2024).
  26. Bazán Tapia, R. Manual de Procedimientos de los Análisis de Suelos y Agua con Fines de Riego. Available online: https://repositorio.inia.gob.pe/bitstream/20.500.12955/504/1/Bazan-Manual_de_procedimientos_de_los.pdf (accessed on 20 May 2024).
  27. INACAL. Norma Técnica Peruana NTP-ISO/IEC 17025:2017. Requisitos Generales para la Competencia de los Laboratorios de Ensayo y Calibración. Available online: https://transparencia.produce.gob.pe/images/stories/Repositorio/transparencia/proyectos-de-inversion/niveles-de-servicio/2021/ITP/NC/NTP_ISO_IEC_17025_2017.pdf (accessed on 20 May 2024).
  28. Kannan, S. Foliar Fertilization for Sustainable Crop Production. In Genetic Engineering, Biofertilisation, Soil Quality and Organic Farming; Lichtfouse, E., Ed.; Sustainable Agriculture Reviews; Springer: Dordrecht, The Netherlands, 2010; Volume 4, pp. 371–402. [Google Scholar] [CrossRef]
  29. Santos, D.Y.A.C.; Ferreira, M.J.P.; Matos, T.M.; Sala-Carvalho, W.R.; Anselmo-Moreira, F.; Roma, L.P.; Carvalho, J.C.S.; Peña-Hidalgo, M.; French, K.; Waterman, M.J.; et al. UV-B and Drought Stress Influenced Growth and Cellular Compounds of Two Cultivars of Phaseolus vulgaris L. (Fabaceae). Photochem. Photobiol. 2021, 97, 166–179. [Google Scholar] [CrossRef]
  30. Holbrook, C.C.; Burow, M.D.; Chen, C.Y.; Pandey, M.K.; Liu, L.; Chagoya, J.C.; Chu, Y.; Ozias-Akins, P. Chapter 4—Recent Advances in Peanut Breeding and Genetics. In Peanuts; Elsevier: Amsterdam, The Netherlands, 2016; pp. 111–145. [Google Scholar] [CrossRef]
  31. Maas, A.L.; Anderson, W.F.; Quesenberry, K.H. Genetic Variability of Cultivated Rhizoma Peanut. Crop Sci. 2010, 50, 1908–1914. [Google Scholar] [CrossRef]
  32. Iddrisu, A.; Adjei, E.; Asomaning, S.K.; Santo, K.G.; Isaac, A.P.; Danson-Anokye, A. Effect of Variety and Plant Spacing on Growth and Yield of Groundnuts (Arachis hypogaea L.). Agric. Sci. 2024, 15, 54–70. [Google Scholar] [CrossRef]
  33. Nwokwu, G.N.; Agbedo Odoh, I.L.; Ngozi, E.P. Growth and Yield Response of Groundnut (Arachis hypogaea L.) Varieties to Plant Density. J. Agric. Stud. 2020, 8, 633. [Google Scholar] [CrossRef]
  34. Li, X.; Zuo, Q.; Chang, H.; Bai, G.; Kuai, J.; Zhou, G. Higher density planting benefits mechanical harvesting of rapeseed in the Yangtze River Basin of China. Field Crops Res. 2018, 218, 97–105. [Google Scholar] [CrossRef]
  35. Craufurd, P.Q.; Wheeler, T.R.; Ellis, R.H.; Summerfield, R.J.; Vara Prasad, P.V. Escape and tolerance to high temperature at flowering in groundnut (Arachis hypogaea L.). J. Agric. Sci. 2000, 135, 371–378. [Google Scholar] [CrossRef]
  36. Bagnall, D.J.; King, R.W. Response of peanut (Arachis hypogaea) to temperature, photoperiod and irradiance 1. Effect on flowering. Field Crops Res. 1991, 26, 263–277. [Google Scholar] [CrossRef]
  37. Villalobos, F.J.; Sadras, V.O.; Fereres, E. Plant Density and Competition. In Principles of Agronomy for Sustainable Agriculture; Villalobos, F.J., Fereres, E., Eds.; Springer International Publishing: Cham, Switzerland, 2016; pp. 159–168. [Google Scholar] [CrossRef]
  38. Mai, W.; Xue, X.; Azeem, A. Plant Density Differentially Influences Seed Weightin Different Portions of the Raceme of Castor. Pol. J. Environ. Stud. 2023, 32, 3247–3254. [Google Scholar] [CrossRef]
  39. Ortega, R.G.; Gutierrez, M.; Cavero, J. Plant Density Influences Marketable Yield of Directly Seeded ‘Piquillo’ Pimiento Pepper. HortScience 2004, 39, 1584–1587. [Google Scholar] [CrossRef]
  40. Arioglu, H.; Bakal, H.; Gulluoglu, L.; Onat, B.; Kurt, C. The effect of harvesting dates on some agronomic and quality characteristics of peanut (Arachis hypogaea L.) varieties grown as a main crop in mediterranean region (Turkey). Turk. J. Field Crops 2018, 23, 27–37. [Google Scholar] [CrossRef]
  41. Wang, Z.; Zhao, X.; Wu, P.; Gao, Y.; Yang, Q.; Shen, Y. Border row effects on light interception in wheat/maize strip intercropping systems. Field Crops Res. 2017, 214, 1–13. [Google Scholar] [CrossRef]
  42. Wang, C.-S.; Tang, C.; Hein, S.; Guo, J.-J.; Zhao, Z.-G.; Zeng, J. Branch Development of Five-Year-Old Betula Alnoides Plantations in Response to Planting Density. Forests 2018, 9, 42. [Google Scholar] [CrossRef]
  43. Wang, C.; Zhao, Z.; Hein, S.; Zeng, J.; Schuler, J.; Guo, J.; Guo, W.; Zeng, J. Effect of Planting Density on Knot Attributes and Branch Occlusion of Betula Alnoides under Natural Pruning in Southern China. Forests 2015, 6, 1343–1361. [Google Scholar] [CrossRef]
  44. Dapaah, H.K.; Mohammed, I.; Awuah, R.T. Phenological Development and Yield of Three Groundnut Varieties as Influenced by Plant Density in a Forest-Savanna Transition Zone. Int. J. Agric. Res. 2014, 9, 87–98. [Google Scholar] [CrossRef]
  45. Khan, N.; Han, Y.; Xing, F.; Feng, L.; Wang, Z.; Wang, G.; Yang, B.; Fan, Z.; Lei, Y.; Xiong, S.; et al. Plant Density Influences Reproductive Growth, Lint Yield and Boll Spatial Distribution of Cotton. Agronomy 2019, 10, 14. [Google Scholar] [CrossRef]
  46. Xu, C.; Li, R.; Song, W.; Wu, T.; Sun, S.; Hu, S.; Han, T.; Wu, C. Responses of Branch Number and Yield Component of Soybean Cultivars Tested in Different Planting Densities. Agriculture 2021, 11, 69. [Google Scholar] [CrossRef]
  47. Yilmaz, M.; Jordan, D.L. Effect of plant density on yield and quality of peanut (Arachis hypogaea L.) cultivars. Turk. J. Field Crops 2022, 27, 217–223. [Google Scholar] [CrossRef]
  48. Yousif, D.P.; Hussain, A. Effect of genotype and plant density on growth characteristics, and yield of Peanut (Arachis hypogaea L.) in Central Region of Iraq. Agric. Res. Technol. Open Access J. 2019, 19, 1–6. [Google Scholar]
  49. Chen, T.; Zhang, J.; Wang, X.; Zeng, R.; Chen, Y.; Zhang, H.; Wan, S.; Zhang, L. Monoseeding Increases Peanut (Arachis hypogaea L.) Yield by Regulating Shade-Avoidance Responses and Population Density. Plants 2021, 10, 2405. [Google Scholar] [CrossRef] [PubMed]
  50. Abd Al-Shammari, A.M.; Jaburi, S.B. Effect of Foliar Fertilization with Zinc and Plant Density on Some Characteristics of Vegetative Growth and Yield of Two Cultivars of Faba Bean Vicia faba L. IOP Conf. Ser. Earth Environ. Sci. 2022, 1060, 012053. [Google Scholar] [CrossRef]
  51. Desmae, H.; Sako, D.; Konate, D. Optimum Plant Density for Increased Groundnut Pod Yield and Economic Benefits in the Semi-Arid Tropics of West Africa. Agronomy 2022, 12, 1474. [Google Scholar] [CrossRef]
  52. Alam, A.M.; Sarker, M.A.R.; Hossain, M.A.; Islam, M.M.; Haque, M.S.; Hussain, M. Yield and Quality of Groundnut (Arachis hypogaea L.) as Affected by Hill Density and Number of Plants per Hill. J. Agron. 2002, 1, 74–76. [Google Scholar] [CrossRef]
  53. Wright, G.; Bell, M. Plant population studies on peanut (Arachis hypogaea L.) in subtropical Australia. 3. Growth and water use during a terminal drought stress. Aust. J. Exp. Agric. 1992, 32, 197. [Google Scholar] [CrossRef]
  54. Liu, C.; Xu, Y.; Zhao, J.; Nie, J.; Jiang, Y.; Shang, M.; Zang, H.; Yang, Y.; Brown, R.W.; Zeng, Z. Optimizing sowing date and plant density improve peanut yield by mitigating heat and chilling stress. Agron. J. 2023, 115, 2521–2532. [Google Scholar] [CrossRef]
  55. Minh, T.X.; Thanh, N.C.; Thin, T.H.; Tieng, N.T.; Giang, N.T.H. Effects of Plant Density and Row Spacing on Yield and Yield Components of Peanut (Arachis hypogaea L.) on the Coastal Sandy Land Area in Nghe an Province, Vietnam. Indian J. Agric. Res. 2021, 55, 468–472. [Google Scholar] [CrossRef]
  56. Mohammad, Y.; Zaineh, R.; Zalikha, M. Effect of Plant Densities on some Productivity Characteristics ofTwo Varieties of Arachis hypogaea L. (Sory1 and Sory2) in Syrian Coast. Ishreen Univ. J. Res. Sci. Stud.-Biol. Sci. Ser. 2023, 42, 35–48. [Google Scholar]
  57. Herreros Llamccaya, S.A. Evaluación y Adaptación de Cinco Cultivares de Maní (Arachis hypogaea) en el Valle de Cañete. Universidad Nacional José Faustino Sánchez Carrión. Perú. Available online: https://repositorio.unjfsc.edu.pe/bitstream/handle/20.500.14067/8109/Tesis%20de%20Mani%202022%20-%20SARA%20HERREROS.pdf?sequence=1&isAllowed=y (accessed on 19 July 2024).
Figure 1. Geographical location of the experimental plot.
Agronomy 14 01905 g001
Table 1. Morphological characteristics of cultivars.
CultivarsName in the CatalogGrowth CharacteristicsPod Characteristics
ChivitaCriollo Blanco de CasmaSemirastrera2–3 pale grains.
Rojo TarapotoColorado TarapotoSemirastreraPods up to 4.30 cm, 3 grains, colored integument.
HuayabambaMorado HuayabambaLarge ErectaPods large, up to 5 cm, 3 grains, dark purplish, almost black.
Rojo BolaRojo giganteErecta compactBoxes rounded, without beak, 2 grains, colored tegument.
Table 2. Classification of treatments in relation to the 4A × 3B factorial arrangement (factor A, peanut cultivars; factor B, planting densities).
TreatmentsPeanut Cultivars (Arachis hypogaea L.)Density
T1Huayabamba10 × 50 cm
T2Huayabamba20 × 50 cm
T3Huayabamba30 × 50 cm
T4Rojo Tarapoto10 × 50 cm
T5Rojo Tarapoto20 × 50 cm
T6Rojo Tarapoto30 × 50 cm
T7Chivita10 × 50 cm
T8Chivita20 × 50 cm
T9Chivita30 × 50 cm
T10Rojo Bola10 × 50 cm
T11Rojo Bola20 × 50 cm
T12Rojo Bola30 × 50 cm
Table 3. Effects of densities and cultivars on growth and development variables. (mean ± standard deviation).
FactorsPlant Height after 60 Days (cm) 1Plant Height after 90 Days (cm) 1Days to Flowering 1Days to Harvest 2
Densities
10 × 50 cm15.2 ± 1.5 ns19.6 ± 3.5 ns77.5 ± 11.4 ns159.0 ± 18.5 ns
20 × 50 cm15.4 ± 1.3 ns19.1 ± 3.8 ns78.1 ± 9.9 ns159.8 ± 19.1 ns
30 × 50 cm14.6 ± 2.2 ns19.2 ± 4.5 ns78.7 ± 10.3 ns159.4 ± 19.1 ns
Cultivars
Huayabamba15.9 ± 1.2 a21.7 ± 2.5 a91.2 ± 1.3 a182.2 ± 1.0 a
Rojo Tarapoto15.5 ± 0.8 a19.7 ± 2.3 a83.8 ± 2.2 b168.7 ± 0.8 b
Chivita13.3 ± 2.0 b14.0 ± 2.5 b65.4 ± 1.9 d133.6 ± 1.1 d
Rojo Bola15.6 ± 1.3 a21.7 ± 1.9 a72.1 ± 1.5 c153.1 ± 1.1 c
Treatments
T115.9 ± 0.4 a21.5 ± 1.7 a92.3 ± 0.5 a181.0 ± 0.0 b
T216.1 ± 0.6 a21.1 ± 3.1 a90.3 ± 0.5 a183.0 ± 1.0 a
T315.8 ± 2.2 a22.7 ± 3.3 a91.0 ± 2.0 a182.6 ± 0.5 ab
T415.6 ± 0.7 a20.2 ± 0.5 a83.0 ± 1.7 b168.6 ± 1.1 c
T515.1 ± 0.4 a20.1 ± 2.9 a83.6 ± 3.0 b169.0 ± 1.0 c
T615.9 ± 1.3 a18.9 ± 3.2 ab85.0 ± 2.0 b168.6 ± 0.5 c
T713.8 ± 1.7 ab14.4 ± 2.3 bc64.0 ± 1.0 d133.6 ± 0.5 e
T814.2 ± 2.2 ab14.6 ± 3.8 bc66.3 ± 2.8 d133.6 ± 1.5 e
T911.9 ± 2.1 b13.2 ± 1.9 c66.0 ± 1.0 d133.6 ± 1.5 e
T1015.7 ± 2.1 a22.3 ± 2.0 a71.0 ± 1.0 c153.0 ± 1.0 d
T1116.3 ± 0.4 a20.8 ± 2.5 a72.3 ± 1.1 c153.6 ± 1.5 d
T1214.8 ± 0.4 a22.1 ± 1.5 a73.0 ± 2.0 c152.6 ± 1.1 d
1 Variables with a normal distribution and different letters in the vertical direction indicate significant differences at the 5% level according to the Duncan test. 2 Nonparametric variables; letters in the vertical direction indicate significant differences at the 5% level according to the Kruskal–Wallis test. ns = not significant.
Table 4. Effect of sowing densities and cultivars on yield variables.
FactorsNumber of Branches 2Number of Pods 1Number of Seeds/Pod 1Empty Pods 2Weight 100 Seeds (g) 2
Densities
10 × 50 cm4.7 ± 0.5 ns5.1 ± 1.8 c4.1 ± 1.1 ns0.7 ± 0.2 ns100.0 ± 22.9 ns
20 × 50 cm5.0 ± 0.8 ns8.6 ± 1.7 b4.2 ± 1.2 ns0.5 ± 0.3 ns99.0 ± 21.3 ns
30 × 50 cm4.7 ± 0.8 ns12.6 ± 2.5 a4.1 ± 1.1 ns0.5 ± 0.3 ns98.4 ± 22.3 ns
Cultivars
Huayabamba5.1 ± 0.3 a11.5 ± 3.8 a5.3 ± 0.7 a0.7 ± 0.3 ns101.1 ± 1.4 c
Rojo Tarapoto4.5 ± 0.4 b9.3 ± 3.2 b4.6 ± 0.3 b0.7 ± 0.2 ns119.2 ± 0.7 a
Chivita5.4 ± 0.8 a6.5 ± 2.9 d2.7 ± 0.6 d0.5 ± 0.2 ns64.2 ± 1.7 d
Rojo Bola4.1 ± 0.3 c8.0 ± 3.2 c3.9 ± 0.7 c0.4 ± 0.3 ns112.1 ± 3.2 b
Treatments
T15.1 ± 0.1 abc7.4 ± 0.1 e5.4 ± 0.1 a0.7 ± 0.0 ns102.6 ± 0.6 ef
T24.9 ± 0.2 abcd11.0 ± 0.7 c5.2 ± 0.8 ab0.7 ± 0.4 ns100.3 ± 1.4 f
T35.4 ± 0.3 ab16.0 ± 0.4 a5.2 ± 1.0 ab0.6 ± 0.5 ns100.3 ± 0.4 f
T44.5 ± 0.2 cde5.8 ± 0.8 f4.6 ± 0.1 abc1.0 ± 0.0 ns119.8 ± 0.3 a
T54.8 ± 0.5 bcd8.8 ± 0.6 d4.9 ± 0.3 abc0.5 ± 0.2 ns119.2 ± 0.5 ab
T64.3 ± 0.0 de13.1 ± 0.4 b4.3 ± 0.2 abc0.6 ± 0.1 ns118.6 ± 0.6 bc
T75.0 ± 0.6 abcd2.9 ± 0.6 h2.6 ± 0.2 e0.6 ± 0.1 ns63.7 ± 1.1 g
T86.1 ± 0.2 a7.1 ± 0.4 e2.8 ± 0.7 de0.5 ± 0.2 ns65.6 ± 2.1 g
T95.2 ± 1.0 abcd9.6 ± 0.2 d2.7 ± 0.8 de0.5 ± 0.2 ns63.2 ± 1.1 g
T104.3 ± 0.5 de4.5 ± 0.2 g3.7 ± 0.6 cde0.5 ± 0.3 ns113.9 ± 5.4 bcd
T114.1 ± 0.2 e7.7 ± 0.8 e3.9 ± 0.7 cd0.4 ± 0.3 ns110.7 ± 1.1 de
T124.0 ± 0.3 e11.8 ± 0.4 c4.1 ± 0.8 bc0.5 ± 0.3 ns111.6 ± 1.1 cd
1 Variables with a normal distribution and different letters in the vertical direction indicate significant differences at the 5% leve, according to the Duncan test. 2 Nonparametric variables: letters in the vertical direction indicate significant differences at the 5% level according to the Kruskal–Wallis test. ns = not significant.
Table 5. Effect of planting density and cultivar on peanut yield.
FactorsYield (Kg/ha) 2
Densities
10 × 50 cm752.8 ± 184.6 c
20 × 50 cm1150.7 ± 123.1 b
30 × 50 cm1583.3 ± 231.7 a
Cultivars
Huayabamba1408.0 ± 350.2 ns
Rojo Tarapoto1192.1 ± 455.0 ns
Chivita961.5 ± 284.1 ns
Rojo Bola1087.5 ± 358.0 ns
Treatments
T11057.0 ± 6.0 gh
T21317.0 ± 8.0 cd
T31850.0 ± 12.4 a
T4671.3 ± 3.2 ij
T51183.0 ± 7.0 ef
T61722.0 ± 6.2 ab
T7620.0 ± 5.2 k
T8992.0 ± 5.2 hi
T91272.6 ± 35.2 de
T10663.0 ± 7.0 jk
T111111.0 ± 2.6 fg
T121488.6 ± 8.1 bc
2 Nonparametric variables: letters in the vertical direction indicate significant differences at the 5% level according to the Kruskal–Wallis test. ns = not significant.
Disclaimer/Publisher’s Note: The statements, opinions and data contained in all publications are solely those of the individual author(s) and contributor(s) and not of MDPI and/or the editor(s). MDPI and/or the editor(s) disclaim responsibility for any injury to people or property resulting from any ideas, methods, instructions or products referred to in the content.

