Article

Evaluating the Impacts of Fertilization and Rainfall on Multi-Form Phosphorus Losses from Agricultural Fields: A Case Study on the North China Plain

1
Key Laboratory of Agricultural Soil and Water Engineering in Arid and Semiarid Areas, College of Water Resources and Architectural Engineering, Ministry of Education, Northwest A&F University, Yangling 712100, China
2
State Key Laboratory of Simulation and Regulation of Water Cycle in River Basin, China Institute of Water Resources and Hydropower Research, Beijing 100038, China
3
Department of Water Ecology and Environment, China Institute of Water Resources and Hydropower Research, Beijing 100038, China
4
School of Water Conservancy and Hydroelectric Power, Hebei University of Engineering, Handan 056009, China
*
Authors to whom correspondence should be addressed.
Agronomy 2024, 14(9), 1922; https://doi.org/10.3390/agronomy14091922
Submission received: 19 June 2024 / Revised: 11 August 2024 / Accepted: 22 August 2024 / Published: 27 August 2024
(This article belongs to the Section Agroecology Innovation: Achieving System Resilience)

Abstract

:
Excessive fertilizer application increases the risk of eutrophication and agricultural non-point source pollution (ANPS) in rivers near farmland. However, the processes and mechanisms of runoff and phosphorus losses, particularly in the interflow, under various fertilizer treatments and rainfall scenarios are not well understood. This study used orthogonal experimental methods to investigate the combined effects of fertilization schemes and rainfall intensity on multi-form phosphorus runoff losses and to establish statistical relationships and regression models between phosphorus losses and environmental factors in surface runoff and interflow. The results indicated that (1) the optimized fertilization scheme, compared with conventional fertilization, enhanced pak choi (Brassica rapa) growth while reducing phosphorus runoff losses. By reducing phosphorus fertilization by 35.7%, total phosphorus losses decreased by 29.3%, 34.2%, and 29.8% under light, moderate, and heavy rainfall, respectively. (2) Different fertilizer applications and rainfall intensities had varying effects on phosphorus losses through different pathways. Fertilizer application was the primary factor affecting phosphorus losses in surface runoff, while rainfall intensity mainly influenced phosphorus losses through interflow. (3) Surface runoff was the dominant pathway for phosphorus losses from farmland (>92.0%), with particulate phosphorus (>89.4%) being the predominant form. However, under high-intensity and long-duration rainfall, interflow became a significant pathway for phosphorus losses. This study highlights the importance of optimized fertilization in reducing phosphorus losses and improving fertilizer efficiency in agricultural fields. The findings will help develop strategies to mitigate ANPS and soil nutrient losses in the North China Plain.

1. Introduction

Agricultural non-point source pollution (ANPS), caused by the uncontrolled discharge of contaminants from agricultural activities, is a significant environmental concern, affecting 30–50% of the world’s topsoil [1,2]. Phosphorus is an essential and irreplaceable nutrient in vegetable production, but its global use is excessive [3]. However, farmers typically apply more fertilizer than recommended to achieve high yields, resulting in large amounts of nitrogen and phosphorus accumulating in the soil, reducing nutrient use efficiency and soil quality [4]. Excessive amounts of unused phosphate fertilizers are carried by rain and agricultural irrigation into deeper soil layers, rivers, lakes, and bays, leading to groundwater contamination, river eutrophication, and algal blooms [5]. ANPS contributes to approximately 50% of the phosphorus pollution in surface water in countries such as the Netherlands, Denmark, and the United States, with developing countries facing more severe challenges [6]. Agriculture has surpassed industry as China’s leading water pollution source [7].
Vegetable production relies heavily on fertilizer inputs and represents an intensive form of crop production [8]. With the increasing global population, the demand for vegetables has risen significantly. In 2020, China’s total vegetable cultivation area reached 21.5 million hectares, a 239% increase compared to 1990 [9]. As a result, agricultural phosphorus fertilizer use in China increased by 208% (2015) compared to 1980, reaching 8.43 million tons [9] and accounting for 20.4% of the world’s total [10]. Phosphorus P2O5 application in China is three times higher than the global average (Table 1), resulting in low phosphorus fertilizer utilization rates of 10–25% in agriculturally intensive areas [11,12]. Phosphorus is a non-renewable resource with uneven distribution and limited reserves worldwide [4]. Therefore, improving the efficiency of phosphorus use in vegetable cultivation is crucial for reducing ANPS and ensuring future fertilizer production.
The two forms of phosphorus found in soils are particulate phosphorus (PP) and dissolved phosphorus (DP), with PP more prevalent and readily immobilized within surface soil particles [13]. Although soils hold vast phosphorus reserves, often exceeding plant needs by thousands of times, only a tiny soluble portion is accessible for uptake [14]. Various factors affect phosphorus losses from cropland, including meteorology [15], geographical factors [16], soil conditions [17], and field management [18]. Among these factors, rainfall intensity and kinetic energy play a crucial role in overland flow and nutrient losses in runoff, with rain splash typically initiating particle losses [19]. Pionke et al. [20] reported that 90% of phosphorus losses in the Chesapeake watershed occurred during a few storm events, despite accounting for only 10% of the total annual rainfall. The North China Plain (NCP) has the most extensive vegetable cultivation and the highest degree of agricultural intensification in China [21]. While the total annual rainfall in this region is relatively small, over 70% occurs in summer, characterized by short durations and high intensities. These conditions lead to significant erosion of loose farmland soil, making the NCP a region with severe agricultural phosphorus pollution [22]. Zhao et al. [23] estimated that the plains accounted for about 80% of the total phosphorus (TP) emissions to rivers in the Haihe Basin, with 2 t km−2 as the highest phosphorus emission intensity. While many studies have investigated nutrient runoff losses in the humid regions of central and southern China, fewer studies have focused on the NCP [22]. Due to significant regional differences, findings from studies conducted in other regions cannot be applied directly to the NCP [18]. Therefore, it is crucial to examine phosphorus inputs and runoff losses from vegetable fields under different rainfall intensities and assess the contribution of short-duration, high-intensity rainfall to ANPS in the NCP.
Our study aimed to quantify the impact of varying rainfall intensities and fertilization strategies on phosphorus losses from representative NCP farmland through simulated rainfall experiments and an orthogonal design. Specifically, we sought to (1) characterize the generation of surface runoff and interflow under various rainfall intensities; (2) analyze the responses of different phosphorus forms (TP, DP, PP) in surface runoff and interflow to environmental factors; (3) establish quantitative relationships between phosphorus losses and driving factors; and (4) evaluate the effectiveness of optimized fertilization strategies on crop growth and phosphorus use efficiency. This research provides valuable insights for mitigating soil nutrient losses and controlling ANPS in the NCP.

2. Materials and Methods

2.1. Study Area

The simulated rainfall experiment took place in an intelligent greenhouse at Hebei University of Engineering, Handan, Hebei Province, China (Figure 1a, 36°35′ N, 114°29′ E). Handan has a monsoon-influenced semi-arid continental climate, with an average minimum temperature of −4.3 °C in January and an average maximum temperature of 32.3 °C in July (Figure 1c). The region experiences uneven spatial and temporal precipitation, averaging 548.9 mm annually (Figure 1b), with 70–80% occurring during the flood season (from June to September). The maximum rainfall intensity in the last two decades was 123 mm h−1. The cultivated land, primarily located in the eastern plain of Handan, consists of aqui-cinnamon soil, classified as cambisols in the FAO World Reference Base for Soil Resources [22]. Table 2 provides the basic characteristics of the studied soil.

2.2. Orthogonal Experimental Design

The experiment included pak choi planting and simulated rainfall experiments, which were conducted from June to November 2019. Soil samples were collected from vegetable farmland in eastern Handan, which had been cultivated for nearly a decade. These samples were thoroughly mixed in the laboratory to ensure consistent soil conditions throughout the experiment. The soil was air-dried, sieved, and layered according to its field capacity, preserving the original soil structure during placement in the trough. The experiment utilized a surface runoff and interflow monitoring setup consisting of a soil trough and a catchment diversion channel. The trough bottom was perforated evenly and covered with permeable gauze to prevent water accumulation and maintain natural soil permeability. The soil trough was set at a 5° slope, the minimum required to produce stable runoff [22]. Surface runoff and interflow samples were taken from the soil surface and at a depth of 30 cm, respectively. Pak choi was sown in the troughs according to the local farming practices of Handan. The experiment included three fertilizer application rates (CK: control check, CF: conventional fertilization, OF: optimized fertilization) and three rainfall intensities (LR: light rain, MR: moderate rain, HR: heavy rain), applied in an orthogonal design (Table 3), with three replicates per treatment. Based on historical rainfall data and frequency distributions for Handan, the simulated rainfall intensities were set at 50, 70, and 90 mm h−1. The actual intensities measured by rain gauges were 54 (LR), 75 (MR), and 99 mm h−1 (HR), with a rainfall duration of 60 min.

2.3. Sample Collection and Analysis

The initial runoff start time was recorded once runoff began. Water samples were collected every 3 min during the first 15 min and then every 5 min until the runoff ended. Rainwater samples were collected as controls. All water and plant samples were immediately transported to the laboratory and stored at 4 °C, with water samples promptly analyzed for total phosphorus (TP) and dissolved phosphorus (DP) concentrations. The TP concentration was measured using the ammonium molybdate spectrophotometric method, with acidic persulphate digestion used to convert all forms of phosphorus in the unfiltered samples to PO4. To determine the DP concentration, runoff samples were first filtered through a 10 μm filter paper, and then, the same method as TP determination was applied. The PP concentration was determined by subtracting DP from TP [24]. Each sample was analyzed in triplicate to ensure accuracy and reduce random error.

2.4. Data Statistics

Data processing and statistical analyses were conducted using IBM SPSS 27 (IBM Corporation, Armonk, NY, USA). Pearson’s correlation analysis was chosen based on the assumption of normality in our data distribution, which was confirmed through exploratory data analysis. Additionally, one-way ANOVA was employed to compare group means, and regression models were used to analyze the relationships between dependent and independent variables. Graphs were created using Origin 2024 (OriginLab Corporation, Northampton, MA, USA) and Affinity Designer 2.5 (Serif Limited, Nottingham, UK). To comprehensively assess phosphorus loss forms and pathways, we introduced the phosphorus runoff loss coefficient (PLC), which quantifies the proportion of total phosphorus (DP or PP) applied to agricultural fields that is lost via runoff (surface runoff or interflow) to water bodies. This metric allows for the determination of phosphorus fertilizer use efficiency and the magnitude of loss for each treatment. The calculation formula is as follows:
PLC = PL PL 0 PU × 100 %
where PL is the phosphorus loss (mg); PL0 is the phosphorus loss (mg) in the non-fertilizer trough; and PU is the phosphorus use (mg).

3. Results

3.1. Runoff Characteristics at Varying Rainfall Intensities

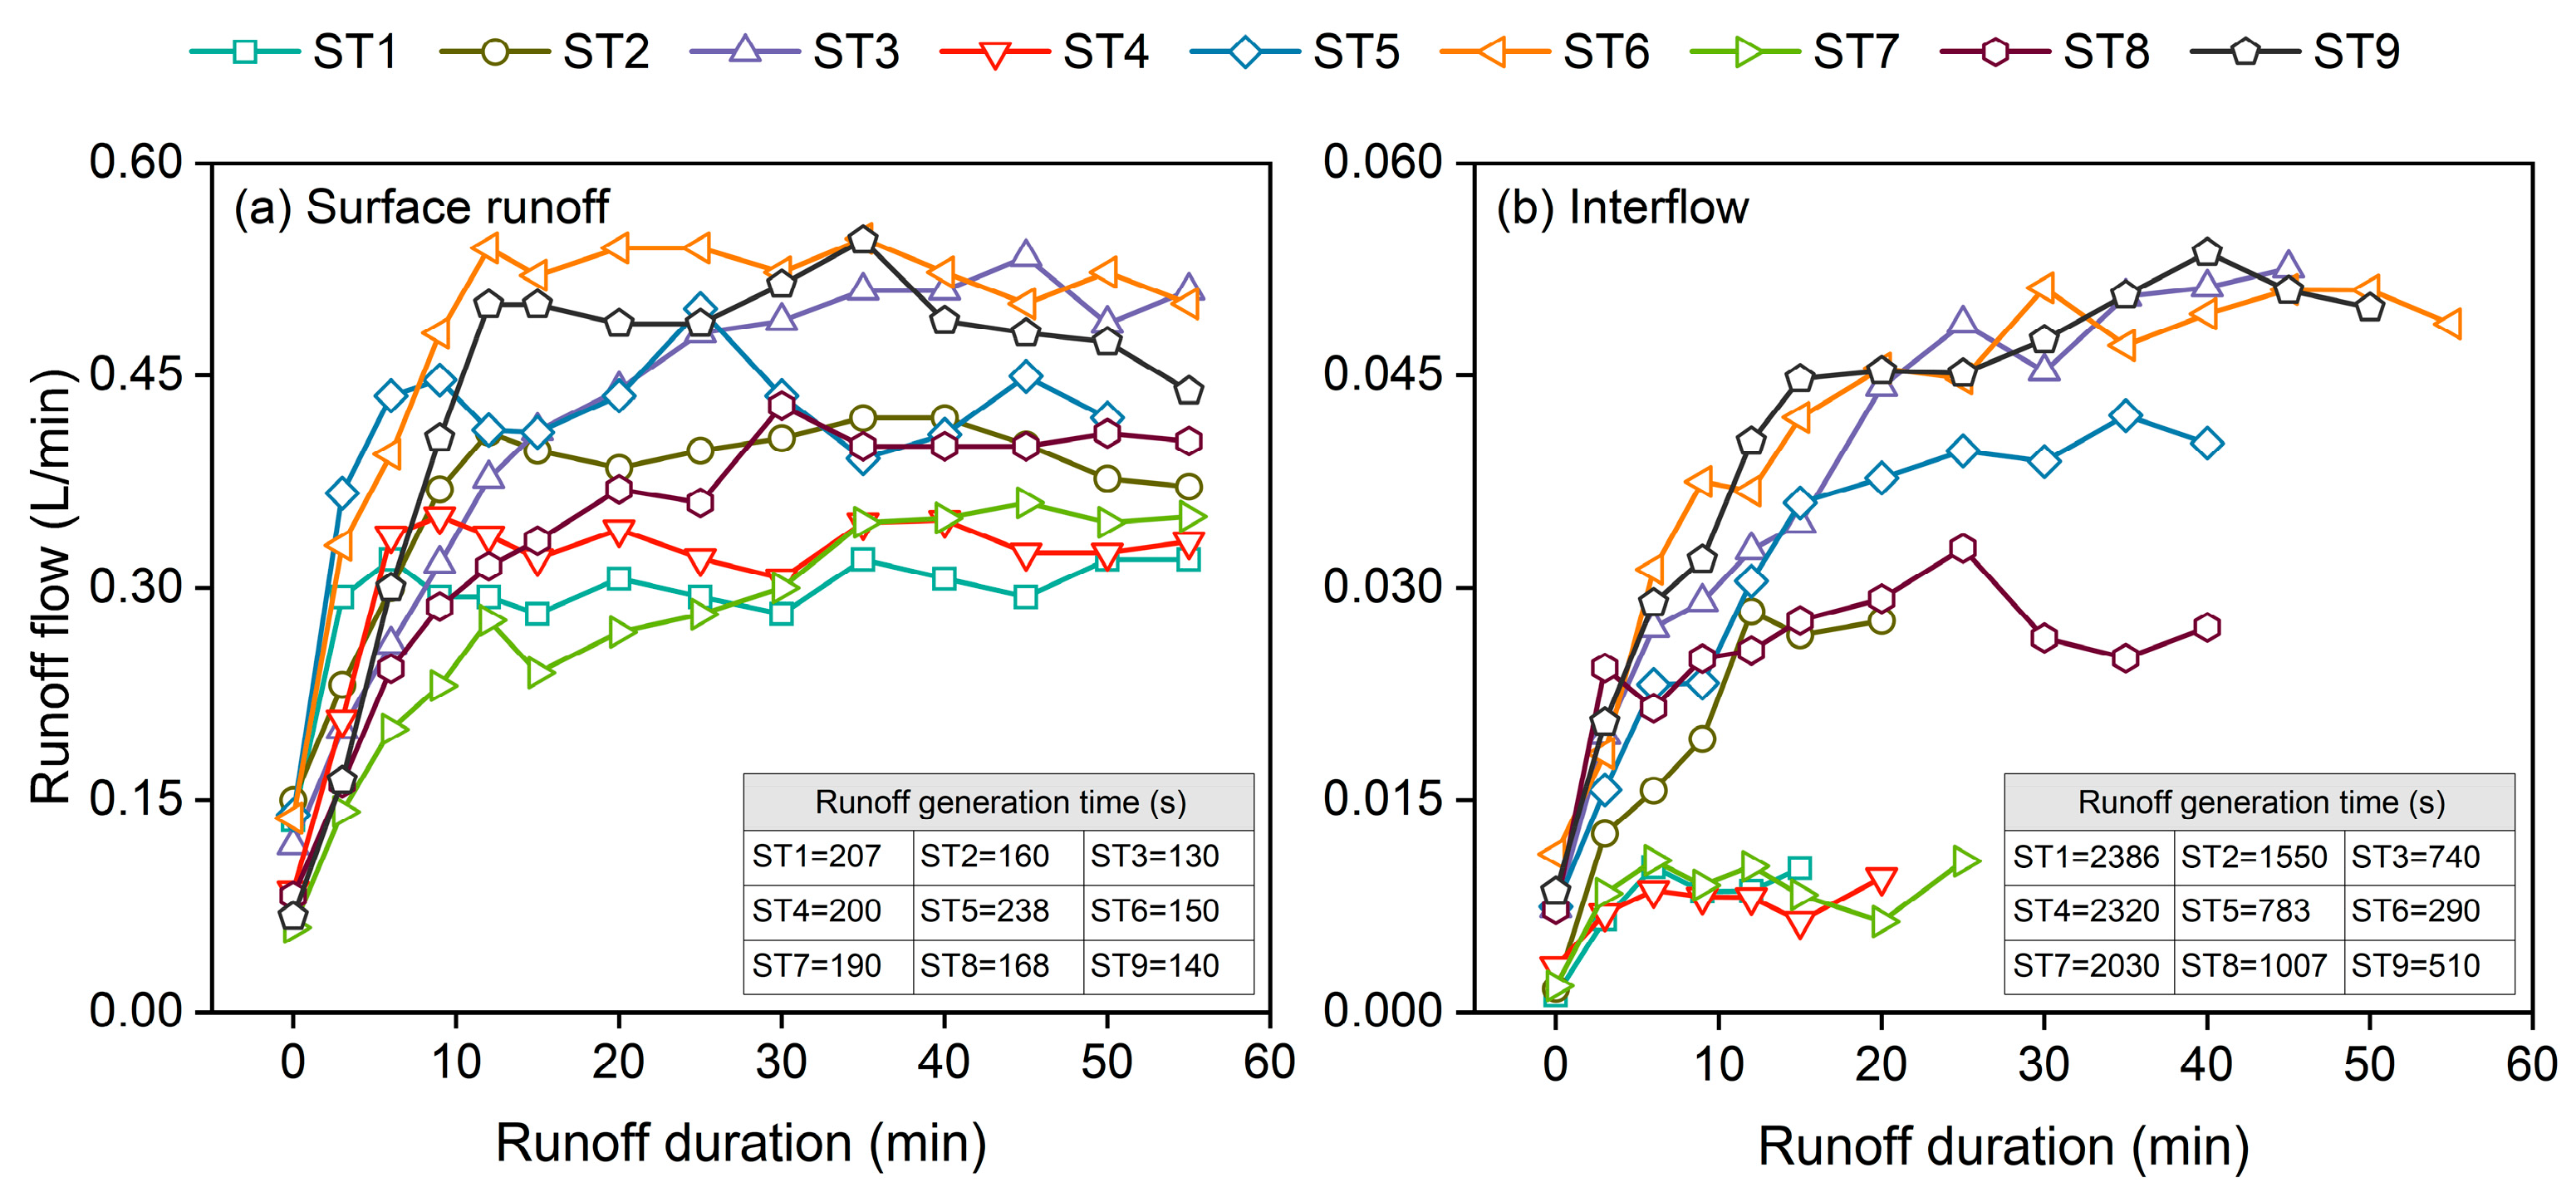
Runoff generation time and cumulative runoff volume of interflow were more sensitive to rainfall intensity than surface runoff (Figure 2). Surface runoff had a short generation time, with mean values of 199, 189, and 140 s for light, moderate, and heavy rainfall, respectively. Surface runoff initiation occurred within 4 min for all rainfall intensities. The mean runoff generation times of interflow for light, moderate, and heavy rainfall were significantly different (p < 0.05), with values of 2262, 1136, and 536 s, respectively. Surface runoff stopped immediately after the rain stopped, while interflow was affected by the soil’s water storage capacity, resulting in a delay but ceasing within 5 min. Surface runoff was the dominant flow from the vegetable field, with interflow accounting for a small proportion of total runoff. The highest proportion of surface runoff was recorded in ST1 (99.2%) and the lowest in ST9 (91.9%). The proportion of interflow positively correlated with rainfall intensity, comprising 1.1%, 4.5%, and 7.8% of the total runoff for light, moderate, and heavy rainfall, respectively. Surface runoff increased by approximately 10.6% for each 10 mm h−1 increase in rainfall intensity—a relatively constant increment. In contrast, interflow runoff increased by 443% as rainfall intensity increased from 54 to 75 mm h−1. Pearson’s correlation analysis revealed a highly significant positive correlation between cumulative runoff and rainfall intensity for both surface runoff and interflow (p < 0.01).

3.2. Phosphorus Loss Dynamics through Different Pathways

3.2.1. Surface Runoff Phosphorus Loss

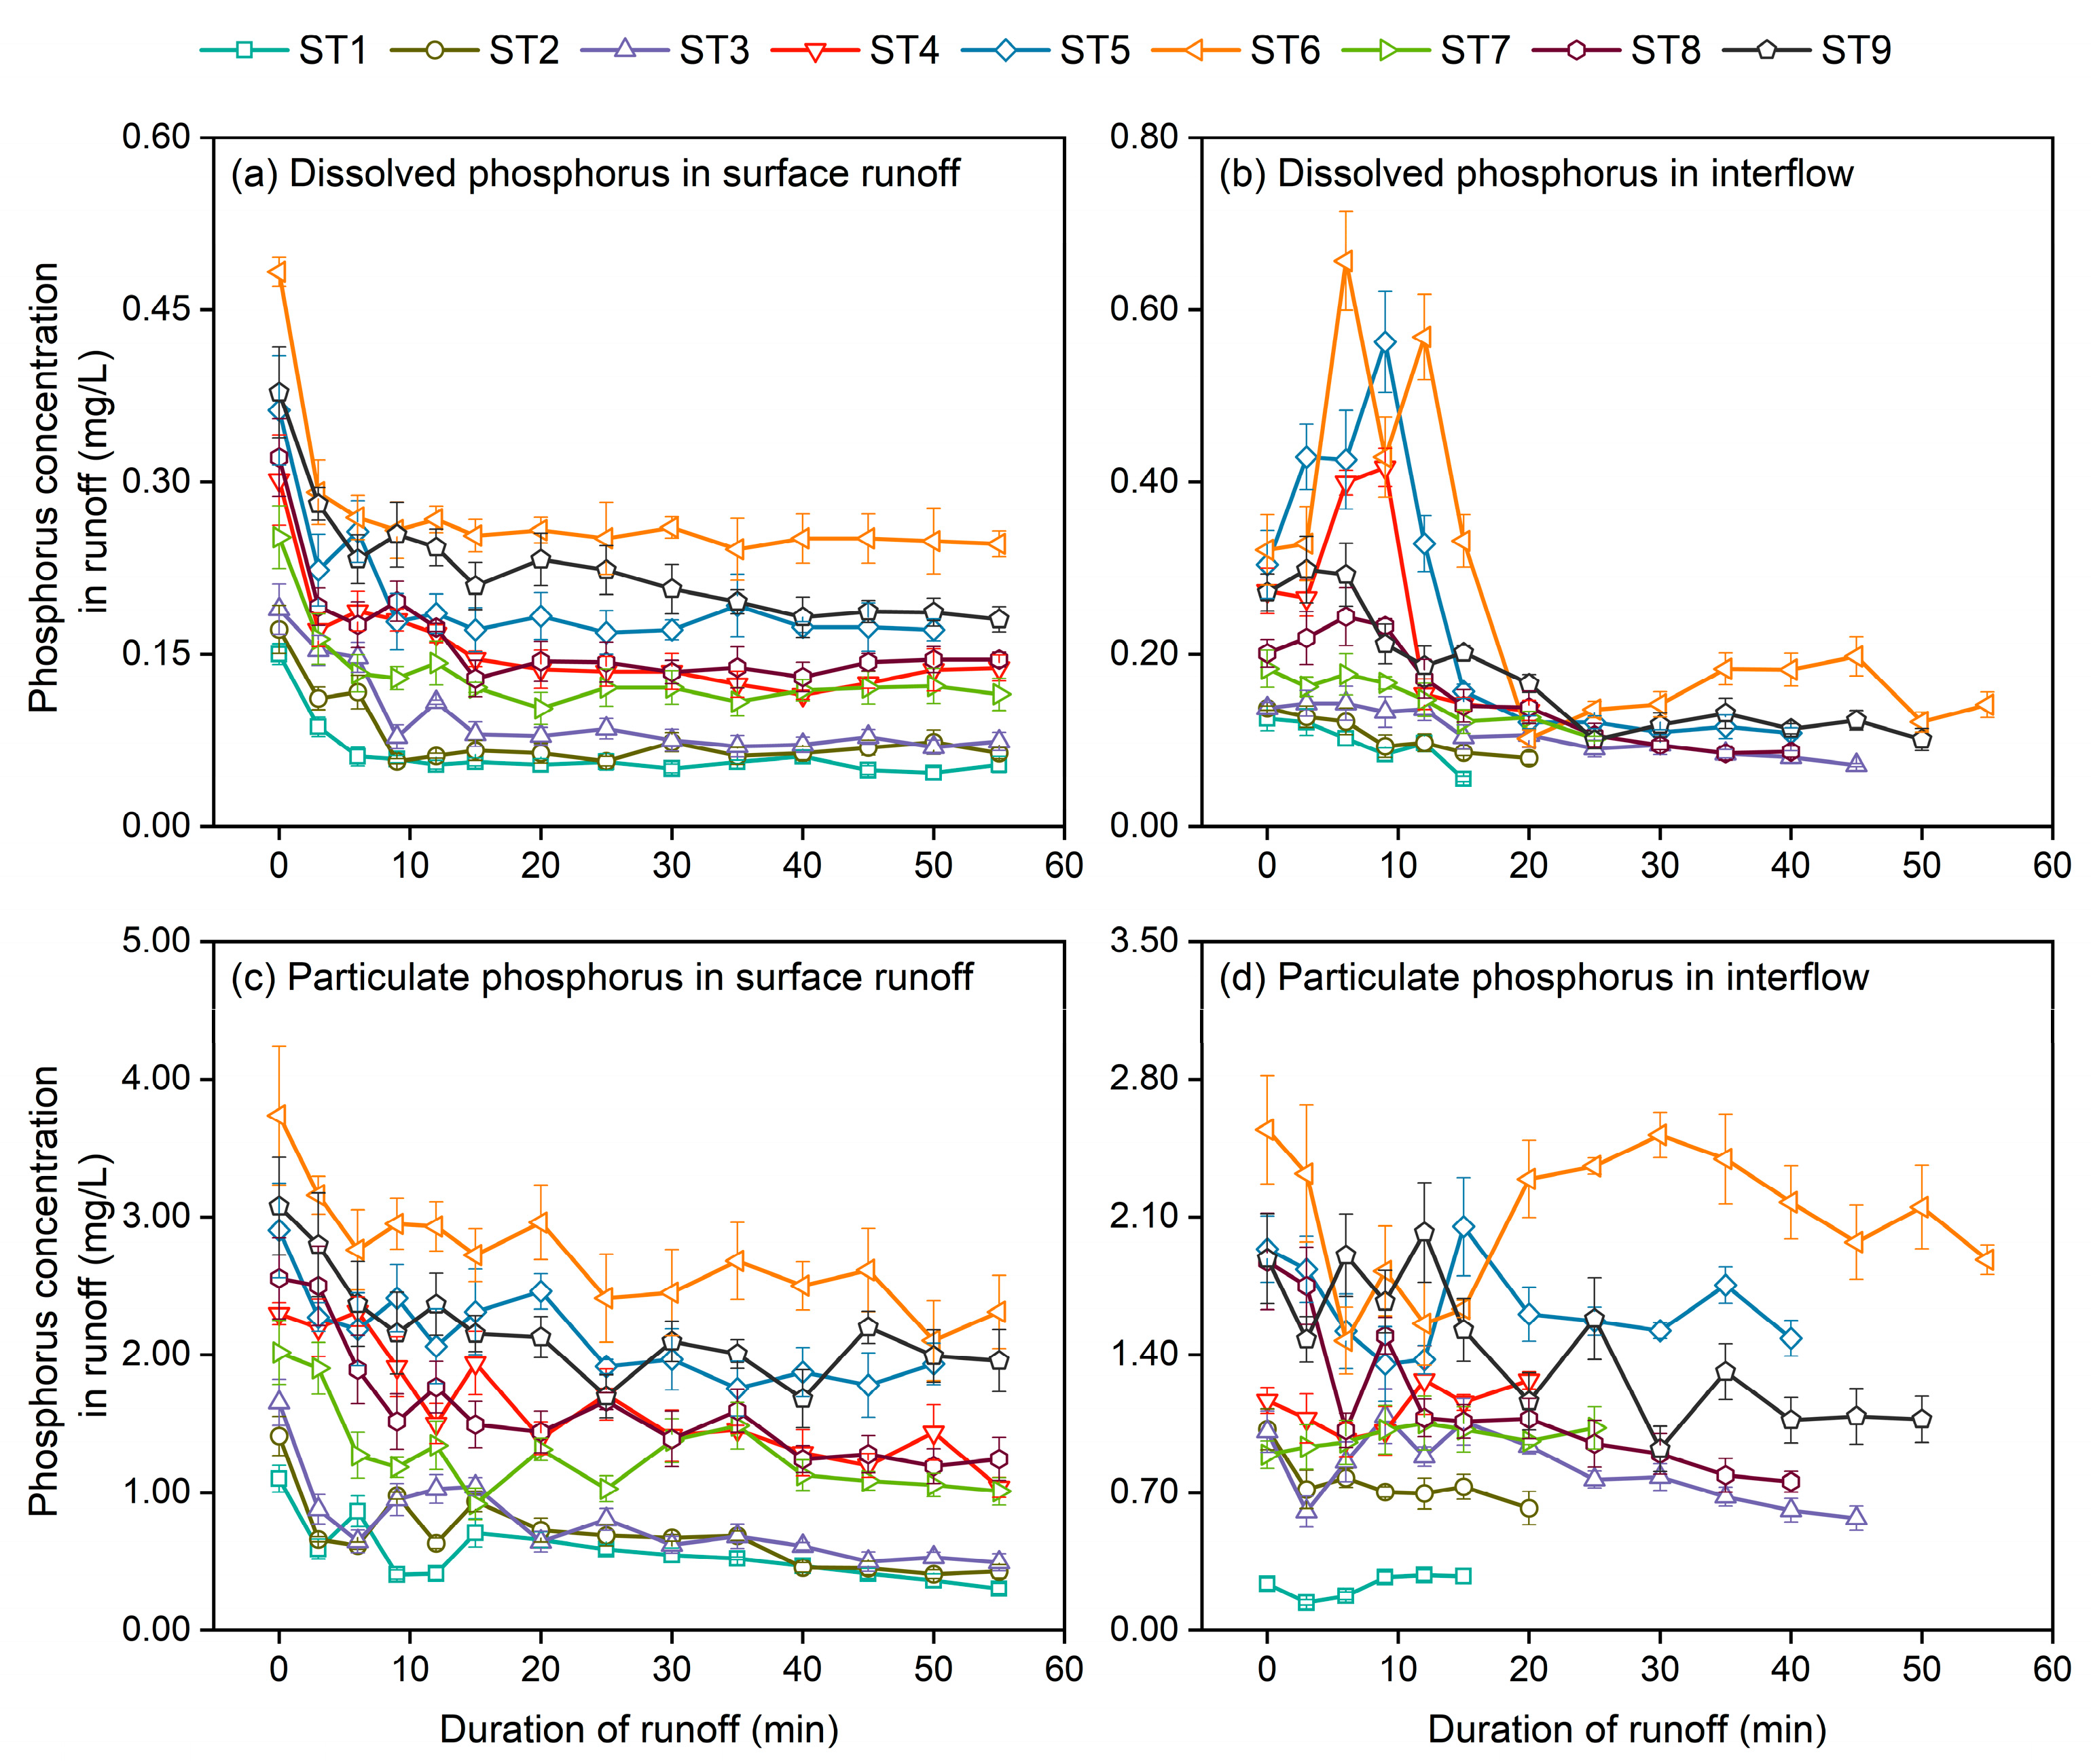
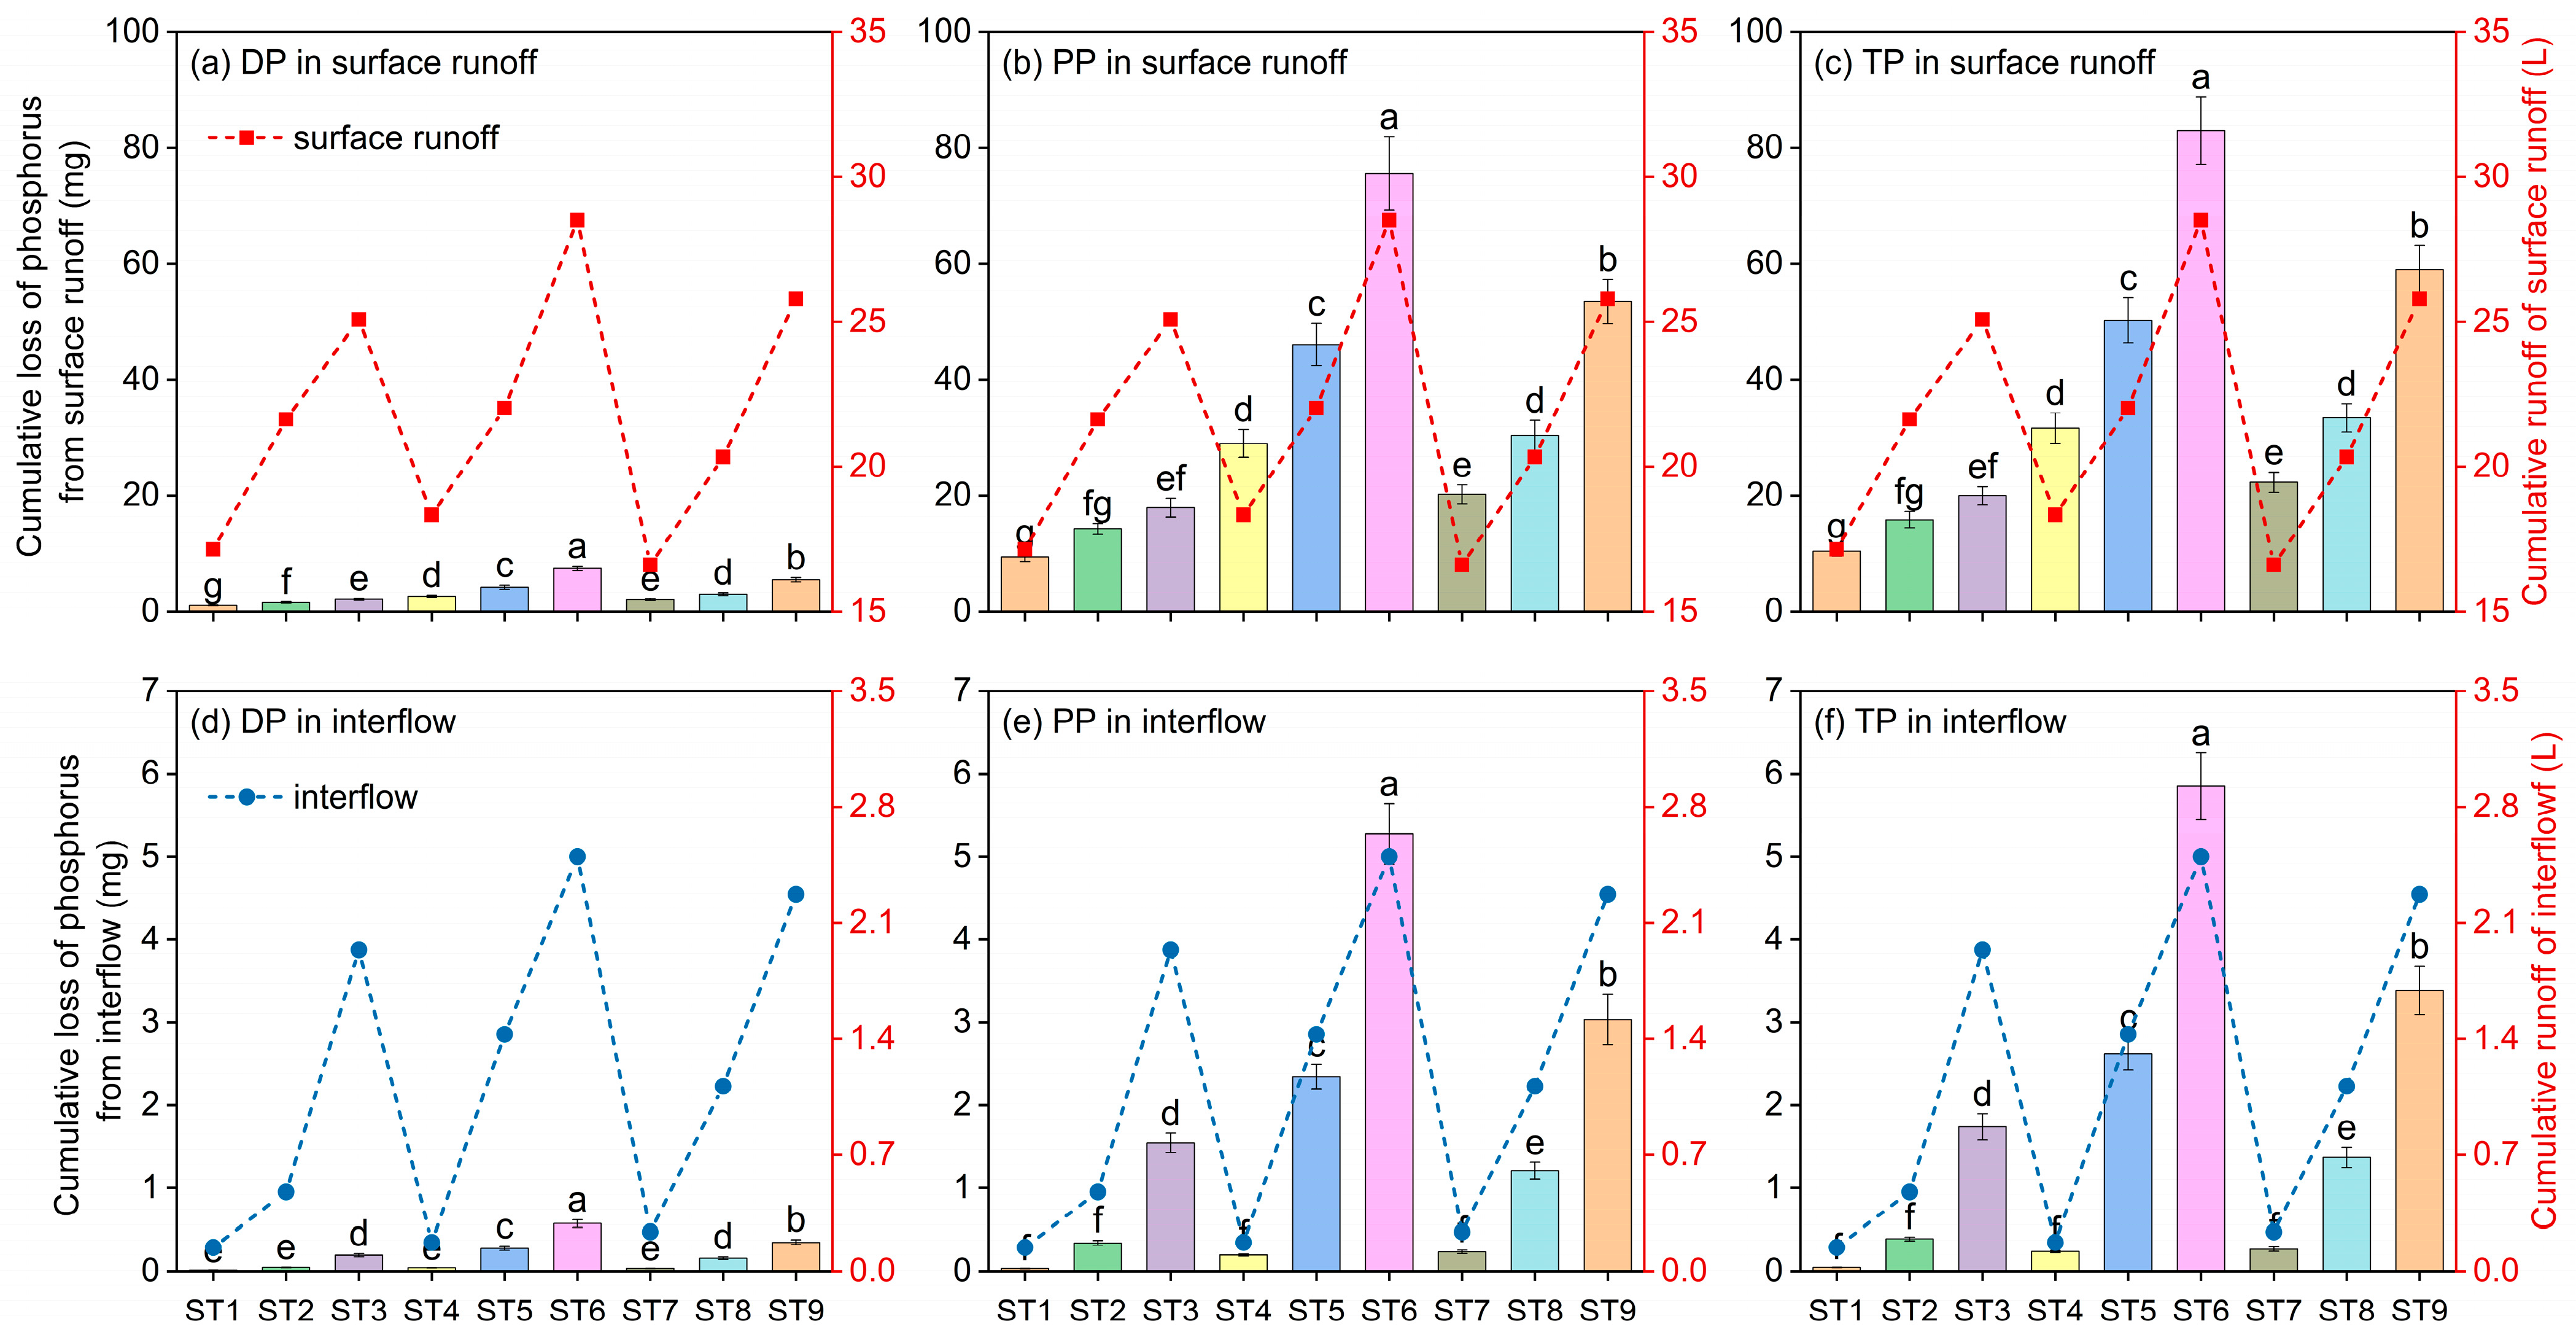
Based on the concentration of different forms of phosphorus and the runoff volume (Figure 3), cumulative phosphorus losses were calculated (Figure 4). Surface runoff was the primary pathway for TP losses, with initial concentrations ranging from 1.25 mg L−1 (ST1) to 4.22 mg L−1 (ST6). For all fertilization schemes, TP concentrations in surface runoff decreased rapidly during the first 20 min, stabilizing thereafter. The order of TP concentrations after stabilization was CHR > CMR > CLR. One-way ANOVA results indicated significant differences (p < 0.05) in TP losses among the fertilization schemes. Under heavy rainfall, the stable TP concentration in the CF group was 2.69 mg L−1, 1.26 times higher than the OF group and 3.95 times higher than the CK group. The maximum TP losses in surface runoff were 82.99 mg L−1 (ST6), and the minimum was 10.44 mg L−1 (ST1). TP losses in surface runoff under the same rainfall intensity largely depended on fertilization application, with the CF group 1.42 times (light rain), 1.50 times (moderate rain), and 1.41 times (heavy rain) higher than the OF group. Surface runoff phosphorus losses were mainly encountered in the PP form, accounting for 90.7% on average. During rainfall events, PP concentrations increased with rainfall intensity, mirroring the trend observed for TP. This resulted in a corresponding increase in accumulated PP losses as rainfall intensity grew. The highest initial PP concentration in surface runoff was 3.74 mg L−1 (ST6), 7.74 times higher than DP (ST6). The proportion of DP in surface runoff was low (<10%), and DP losses positively correlated with fertilizer application (R2 > 0.95). Under the same rainfall intensity, DP losses in the CF and OF groups increased by 160.5–252.6% and 95.4–160.4%, respectively, compared to the CK group.

3.2.2. Interflow Phosphorus Loss

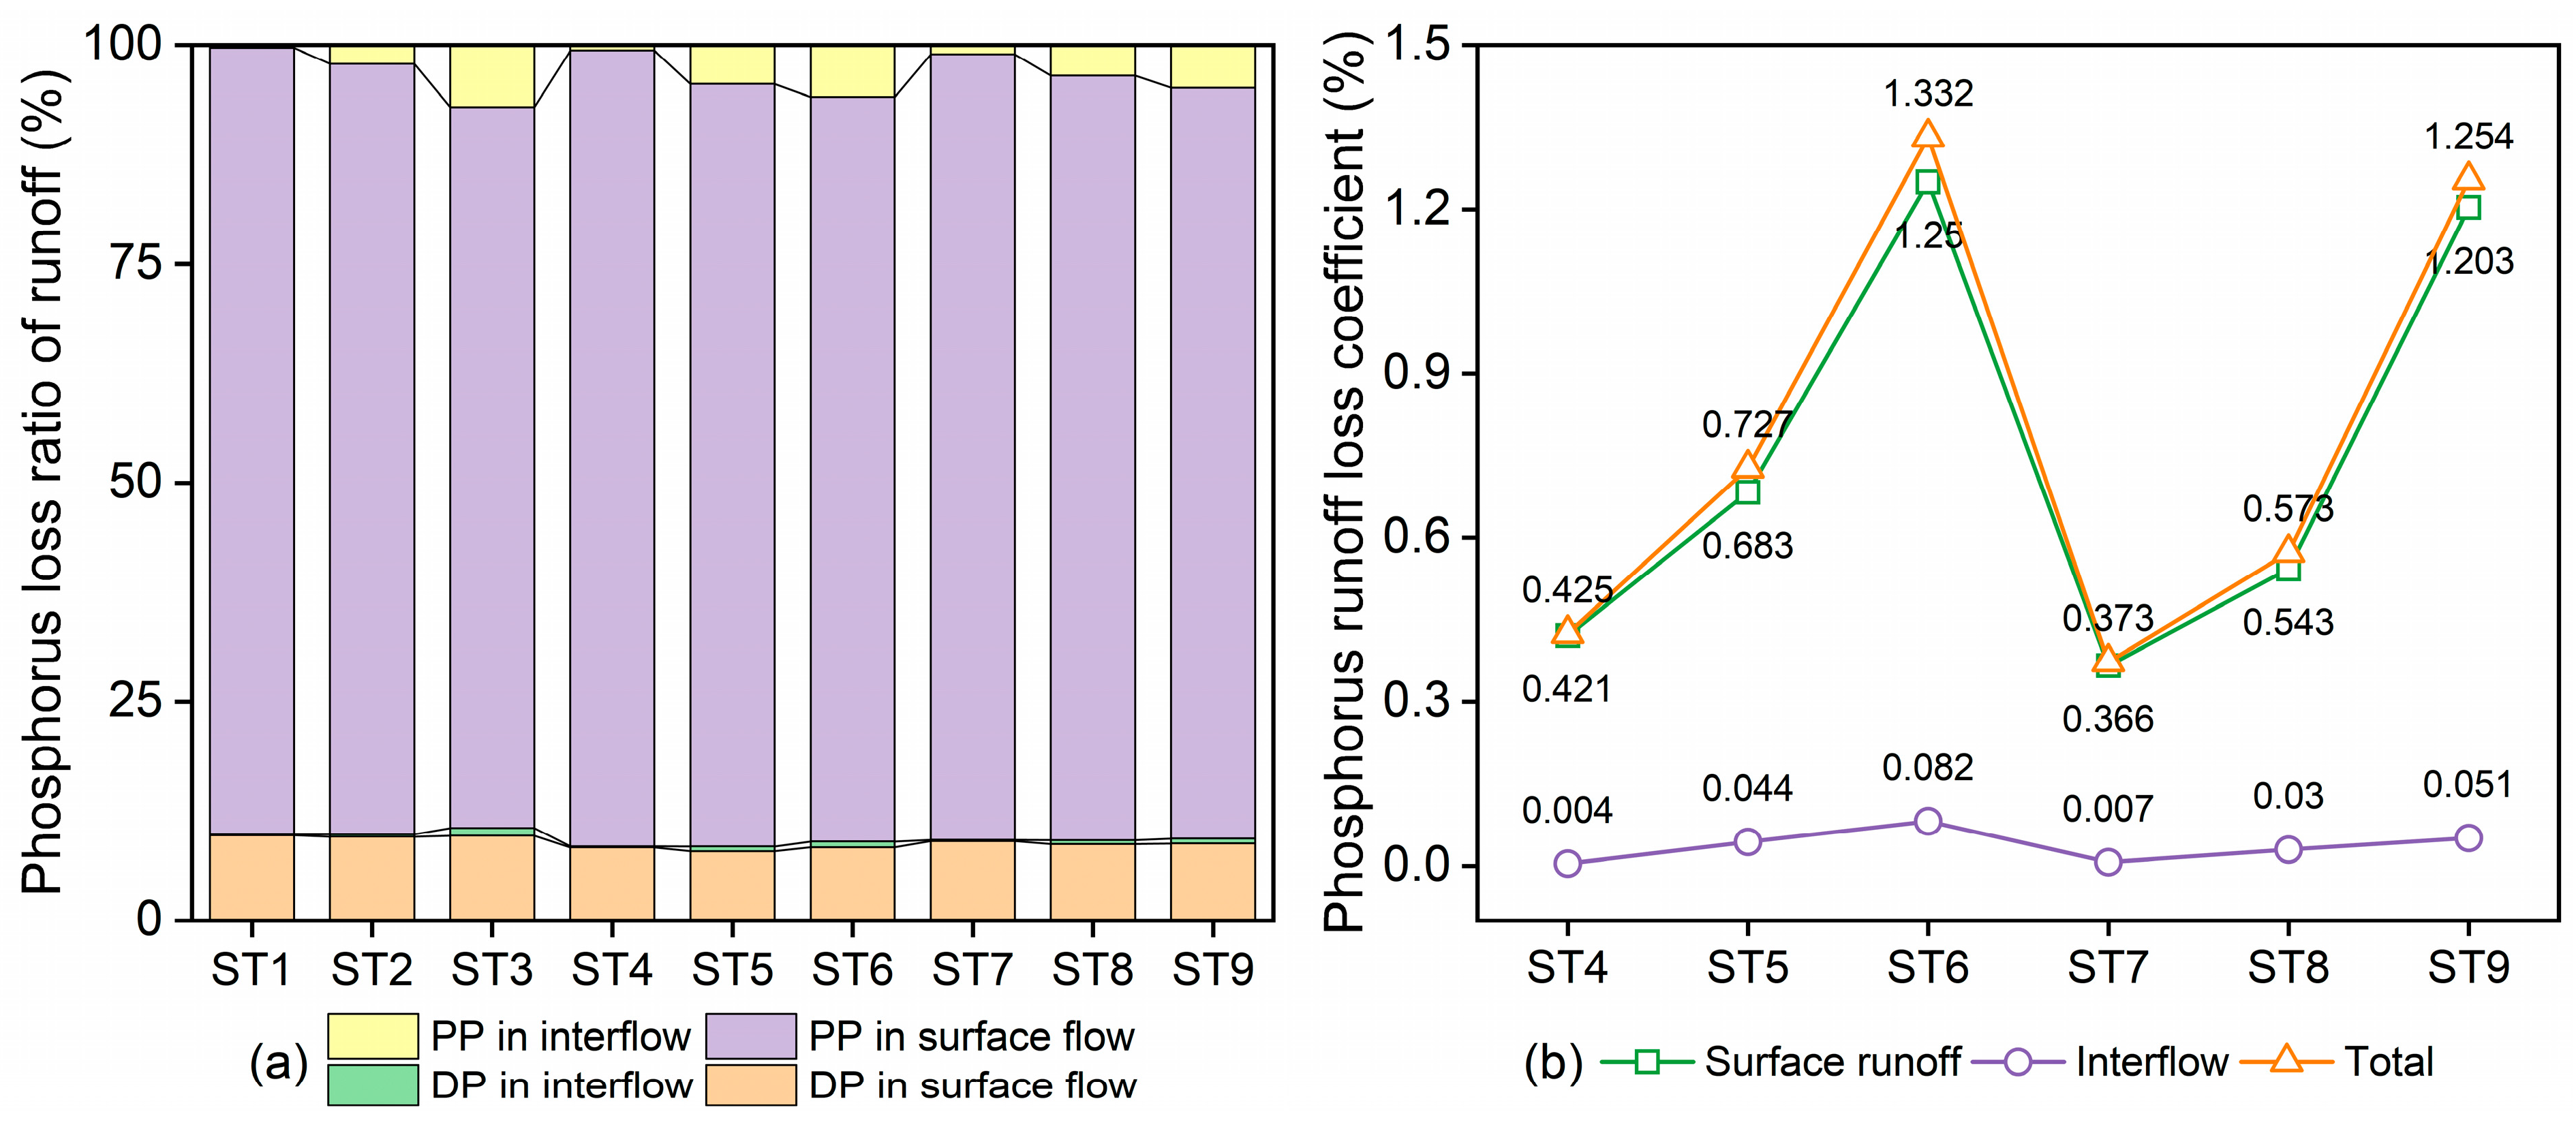
Unlike surface runoff, TP concentrations in interflow showed no specific trend under different fertilization schemes and rainfall intensities. One-way ANOVA results indicated significant differences (p < 0.05) in the TP concentration series under different rainfall intensities. The maximum mean TP concentration was 2.35 mg L−1 (ST6), while the minimum was 0.33 mg L−1 (ST1). Interflow TP losses were much lower than surface runoff, with a maximum of 5.85 mg (ST6) and a minimum of 0.05 mg (ST1). The impact of rainfall intensity on interflow TP losses was more pronounced than surface runoff. When rainfall intensity increased from 54 to 99 mm h−1, interflow TP losses in the CF and OF groups increased by 2582% and 1,198%, respectively. The PLC of TP in interflow ranged from 0.37% (ST7) to 1.33% (ST6). The OF group generally had a higher PLC than the CF group, and the surface runoff PLC far exceeded the interflow PLC. Additionally, PLC positively correlated with rainfall intensity. When rainfall intensity increased from 54 to 99 mm h−1, the average PLC of surface runoff and interflow increased by 0.83% and 0.06%, respectively. Interflow phosphorus losses were mainly encountered in the PP form, with PP losses 2.42–9.22 times higher than DP losses under the same conditions. Reducing phosphorus fertilizer application significantly decreased PP losses in interflow, with a 48.5% reduction at a rainfall intensity of 75 mm h−1 (Figure 5).

3.3. Effects of Environmental Factors on Phosphorus Losses

3.3.1. Correlating Environmental Factors with Phosphorus Loss

Table 4 presents the correlation analysis results between various forms of phosphorus losses and their influencing factors. For surface runoff, fertilizer application and runoff volume were significantly associated with phosphorus losses (p < 0.05), being the main environmental factors. Fertilizer application had a more pronounced effect on PP losses, while runoff volume had a greater effect on DP losses. For interflow, cumulative phosphorus losses were significantly correlated with rainfall intensity (p < 0.05) and highly significantly correlated with runoff (p < 0.01). The correlation coefficients between environmental factors and phosphorus losses were DP > TP > PP, indicating that DP was the most sensitive to external factors, followed by TP, and PP was the least sensitive.

3.3.2. Regression Analysis of Phosphorus Loss and Environmental Factors

Table 5 presents the regression models for phosphorus losses and influencing factors (fertilizer application and rainfall amounts). The correlation coefficients of the regression models for DP, PP, and TP in surface runoff were 0.879, 0.886, and 0.885, respectively, indicating that fertilizer application and rainfall explained more than 87% of the variation in phosphorus losses from surface runoff. The correlation coefficients for DP, PP, and TP in interflow were 0.870, 0.843, and 0.846, respectively, indicating that these factors explained more than 84% of the variation in phosphorus losses from interflow. All models passed the overall F-test, indicating their validity and that at least one factor (rainfall, fertilizer application, or runoff) was significantly related to phosphorus losses. The model variance results showed that the phosphorus values corresponding to the F-statistic were significantly lower than 0.01, indicating that the overall regression model for phosphorus in surface runoff and interflow was highly significant. Thus, a linear equation can accurately describe the combined effect of environmental factors on cumulative phosphorus losses in surface runoff and interflow.

3.4. Impact of Optimized Fertilization on Pak Choi Growth

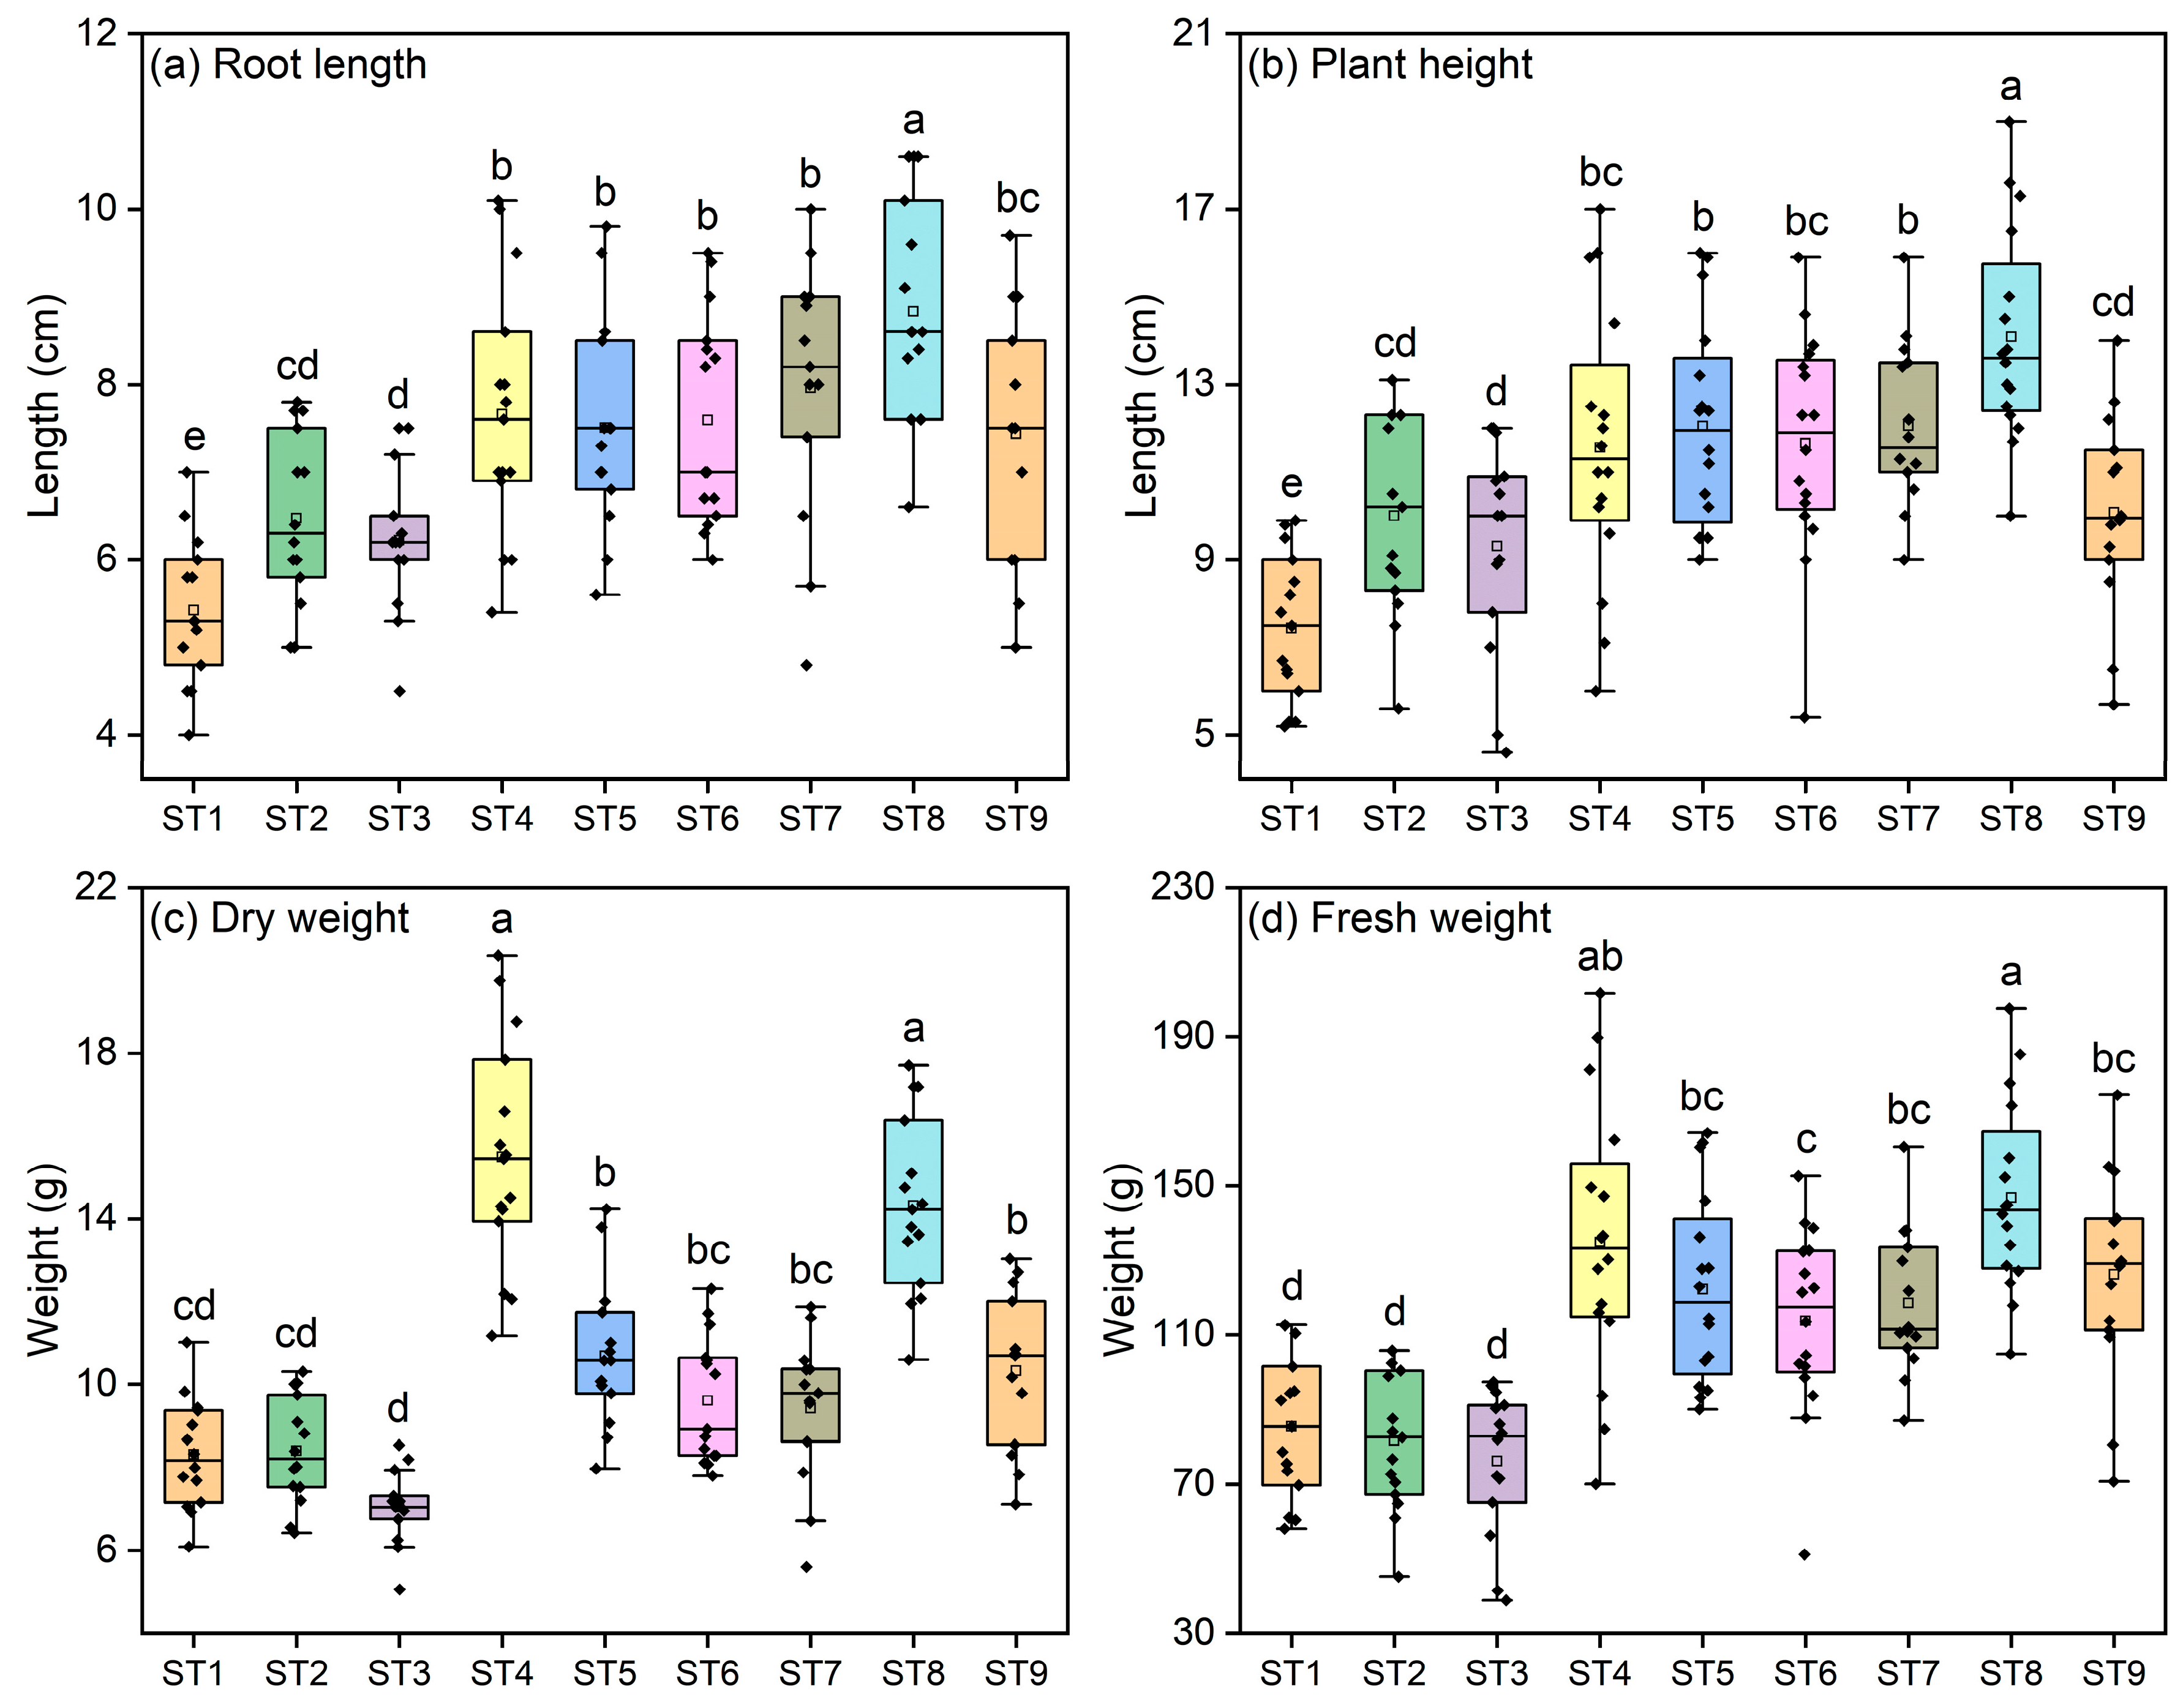
Pak choi growth significantly improved in the fertilization groups (CF and OF) compared to the CK group. The mean root lengths were 6.07, 7.57, and 8.04 cm in the CK, CF, and OF groups, respectively. The shortest mean root length was in ST1 (5.43 cm), and the longest was in ST8 (8.86 cm). The CK group had a median root length of 6.00 cm, increasing by 25.0% and 37.5% in the CF and OF groups, respectively. The mean plant heights were 8.92, 11.76, and 12.07 cm in the CK, CF, and OF groups, respectively, with distributions consistent with root length. The CF group had a median height close to the mean (Figure 6) and better data dispersion than the OF group. Fertilization increased fresh biomass weights by 52.4–60.9% and dry biomass weights by 42.1–49.0%. The LSD test (p < 0.05) showed that chemical fertilizer application significantly improved pak choi growth characteristics; however, there were no significant differences between the CF and OF groups, indicating that increasing the amount of chemical fertilizer did not further improve yield.

4. Discussion

4.1. Role of Optimized Fertilization in Phosphorus Loss Reduction

Since various environmental factors affect phosphorus losses in agricultural fields [13], we used the orthogonal experimental method incorporating three fertilizer application schemes (CK, CF, OF) and three rainfall intensities (54, 75, 99 mm h−1), avoiding interference from other variables by increasing the number of simulated scenarios [25]. We quantified the response of different forms of phosphorus losses in surface runoff and interflow to environmental factors based on integrated analyses (one-way ANOVA, Pearson’s correlation analysis, and regression models). The results of the study indicated that optimizing fertilizer application plays a crucial role in reducing phosphorus losses and ensuring the normal growth of pak choi in farmland. The main component of soil phosphorus nutrient losses was PP adsorbed on sediment surfaces and transported into surface runoff (Figure 5). Optimized fertilizer application significantly reduced phosphorus concentrations and losses in farmland runoff. Plants did not readily absorb PP in the soil, becoming a major contributor to the eutrophic pollution of water bodies [26]. Reductions in soil phosphorus losses are attributed primarily to reductions in sediment and PP content [27]. In our experiment, reducing phosphorus fertilizer application by 35.7% decreased TP losses by 29.3%, 34.2%, and 29.8% under light, moderate, and heavy rainfall scenarios, respectively (Figure 4). Optimizing fertilizer application is a simple and effective way to reduce surface source pollution by controlling the source of phosphorus in agricultural production [4]. Through Pearson’s correlation analysis and regression models (Table 4 and Table 5), we established a significant linear correlation between fertilizer application and phosphorus losses (p < 0.05), indicating that the quantity of fertilizer used is the primary factor affecting phosphorus losses from agricultural land. This finding is consistent with Liu et al. [28], who reported a 33% reduction in phosphorus losses from surface runoff in vegetable fields with a 50% reduction in fertilizer phosphorus application. Similarly, Badrzadeh et al. [29] reported that phosphate leaching into the river decreased by 8.35% with a 50% reduction in phosphate fertilizer use. Therefore, decreasing fertilizer application reduces phosphorus losses and the corresponding pollution load in rivers around farmland [30].
We found that the CF group did not significantly improve the morphology or yield of pak choi when higher amounts of fertilizer were applied. Excessive fertilizer application decreased pak choi yield by 5.3% (average) and increased phosphorus losses by 41.4% (light rain), 52.0% (moderate rain), and 42.5% (heavy rain), respectively (Figure 4 and Figure 6). The finding indicated a threshold for the growth-promoting effect of chemical fertilizers on plant growth [31], with reduced phosphorus utilization and increased phosphorus loss when fertilizer applications exceed recommended levels [32]. These results suggest that it is possible to optimize phosphorus fertilizer use to reduce environmental impacts without compromising crop productivity. This optimization is critical for sustainable agriculture, particularly in regions like the NCP, where excessive fertilizer use has led to significant environmental degradation [21]. Existing research indicates a trend in the NCP of increasing ANPS without corresponding increases in crop yield [33]. Yu et al. [34] found that chemical fertilizers were no longer the dominant factor influencing crop yield in the NCP after 2010. Zhang et al. [35] reported that excessive fertilizer use and inappropriate tillage techniques are the main causes of TP pollution in rivers. By adjusting fertilizer application rates based on specific field conditions, it is possible to minimize phosphorus losses while maintaining, or even increasing, crop yields. Our research emphasizes that by determining appropriate fertilization rates and management practices, a balance can be achieved between agricultural productivity and environmental sustainability. This approach not only benefits the environment but also offers economic advantages to farmers by reducing input costs.

4.2. Mechanisms of Phosphorus Loss with Rainfall Intensity

Rainfall intensity determined the runoff and sedimentation processes in agricultural field systems, influencing soil phosphorus loss characteristics. Using artificial rainfall experiments, some researchers have demonstrated differences in the pathways and forms of phosphorus loss from rainfall under different rainfall intensities and soil characteristics [36]. In our study, surface runoff was the main pathway of phosphorus loss from vegetable fields (>92.0%), and PP was the dominant form of phosphorus loss (>89.4%) (Figure 5), consistent with others [37]. Soil surface erosion during rainfall has a much higher intensity than subsurface soil erosion [38]. Deng et al. [39] showed that sand production from surface runoff mainly depends on rainfall intensity (r > 0.857), while interflow is influenced more by slope (r > 0.568). Bai et al. [40] reported that more than 48.5% of phosphorus was lost as sediment, while Wang et al. [41] showed that more than 90% of TP in runoff was lost through suspended particles. In our experiment, PP concentrations in surface runoff peaked at the beginning of runoff generation in all treatments (Figure 3), consistent with the ‘first flush effect’ observed in urban stormwater runoff [42]. This initial high concentration can be attributed to the disruption of loose soil aggregates by rain droplets, leading to the transfer of PP adsorbed on soil particles into the runoff [43]. This was confirmed in our experimental sampling phase, where the initial runoff had a high sediment particle content, and the water samples were more turbid, which indirectly indicated sediment loss, with runoff being the main pathway for phosphorus loss [40].
We also found that increasing fertilizer application increased the percentage of phosphorus losses in the interflow, but the effect was much smaller than the effect of rainfall intensity. As rainfall intensity rose from 54 to 99 mm h−1, phosphorus losses from interflow increased to 4.2% (OF) and 5.8% (CF), respectively (Figure 5). This indicates a marginal impact of rainfall intensity on phosphorus losses from interflow [22]. With higher rainfall intensity and duration, interflow became more important for phosphorus losses. Identifying these rainfall intensity thresholds would offer valuable insights for future agricultural management and control of ANPS.

4.3. Uncertainties and Aspects for Improvement

Several uncertainties and aspects of our study could be improved in future research. First, the small volume of soil used in our study limited the soil’s water storage capacity and led to interflow ceasing within 5 min in all treatments (Figure 2). Sun et al. [44] reported that interflow continued for more than 30 min after rainfall stopped in actual farmland. The summer rainfall in the NCP is mostly short-duration and high-intensity rainfall [45], and the runoff generation process in the farmland changes from infiltration-excess runoff at the beginning to saturation-excess runoff, and the proportion of interflow gradually increases [46]. Therefore, experiments using larger scale soil systems or actual farm plots would better simulate the interflow process and contribute to understanding the impact of interflow on phosphorus losses. Second, our simulated rainfall experiments had stable rainfall intensity. In contrast, actual rainfall events often have varying intensities [47], which would affect the potential energy of raindrops and the scouring effect on the soil, resulting in greater variation in phosphorus losses, especially for surface runoff [48]. Future research could consider simulating rainfall events with varying intensity to capture this range in variation. Third, our experiment had more than 7% interflow PP losses at a rainfall intensity of 99 mm h−1 (Figure 5), and PP concentrations remained high when interflow stopped (Figure 3). With the high frequency of summer rainfall events in the NCP, there is a risk that phosphorus remaining in the deep soil layer will be lost through interflow during the next rainfall [45,49]. This indicates that the hysteretic interflow phosphorus losses caused by the soil water storage regulation capacity are a non-negligible component in north China farmland and crucial for controlling ANSP loss pathways [50].
Our research demonstrated the importance of optimizing phosphorus fertilizer application rates in minimizing phosphorus losses; however, relying solely on this approach may not fully address the challenge of low phosphorus use efficiency [51,52,53]. To tackle these issues, it is essential to explore alternative methods of soil fertilization and crop nutrition. The current studies suggest that the integration of organic fertilizers can improve soil structure and microbial activity, thereby enhancing phosphorus availability and crop uptake [54]. Additionally, slow-release fertilizers and soil amendments, such as biochar, can provide a more stable phosphorus supply and reduce the risk of phosphorus losses [55]. Biological agents, such as mycorrhizal fungi, which expand the root system and promote phosphorus mobilization, also show potential in enhancing phosphorus absorption [56,57]. Therefore, future research could focus on combining optimized fertilizer application rates with organic amendments and biological solutions. This would help improve phosphorus use efficiency, reduce environmental impacts, and better manage ANSP for sustainable nutrient management.

5. Conclusions

Our study underscores the critical importance of fertilizer application and rainfall in mitigating phosphorus losses from agricultural fields. Surface runoff was identified as the primary pathway for phosphorus losses (>92.0%), with particulate phosphorus being the predominant form (>89.4%). Optimized fertilization practices effectively reduced TP concentrations and losses in runoff. Specifically, reducing phosphorus fertilizer application by 35.7% led to a decrease in TP losses by 29.3%, 34.2%, and 29.8% under light, moderate, and heavy rainfall, respectively. The regression analysis further confirmed that fertilizer application and rainfall explained more than 87% of the variation in phosphorus losses from surface runoff and over 84% from interflow, validating the significance of these factors in controlling phosphorus losses. Our research highlights that excessive fertilizer application did not enhance pak choi yield but significantly increased phosphorus losses. While rainfall intensity had a limited effect on phosphorus losses from surface runoff, interflow became increasingly significant under high-intensity, long-duration rainfall scenarios. In conclusion, optimizing fertilizer application is a viable strategy for controlling phosphorus losses from agricultural fields and promoting sustainable agricultural development.

Author Contributions

All authors contributed to the conception and design of the study. The experimental design and preparation were carried out by R.G., B.M. and Y.L. (Yi Li). Sample collection and chemical analysis were performed by R.G., C.Z., Z.W. and Y.Z. The first draft of the manuscript was written by R.G. and Y.L. (Yu Liu), while L.W. read and revised the manuscript. All authors have read and agreed to the published version of the manuscript.

Funding

This research was jointly supported by the Comprehensive Safety Monitoring System of the Three Gorges Project, Reservoir Operation and Management Fund (No. 2136703); the Follow-up Work of the Three Gorges Project, Intelligent Management Research for Ecological Environment Protection of the Xiaojiang River Basin in the Three Gorges Reservoir Area (No. 2136902); the National Key Research and Development Program of China (No. 2022YDF1900401); the Key Research and Development Program of Xinjiang (No. 2022B02020-2); and NYHXGG project (No. 2023AA303).

Data Availability Statement

The original contributions presented in the study are included in the article, further inquiries can be directed to the corresponding authors.

Acknowledgments

We would like to thank the editors and the anonymous reviewers for their appreciated work, helpful suggestions, and comments.

Conflicts of Interest

The authors declare no conflicts of interest.

References

  1. Wang, J.; Chen, J.; Jin, Z.; Guo, J.; Yang, H.; Zeng, Y.; Liu, Y. Simultaneous removal of phosphate and ammonium nitrogen from agricultural runoff by amending soil in lakeside zone of Karst area, Southern China. Agric. Ecosyst. Environ. 2020, 289, 106745. [Google Scholar] [CrossRef]
  2. Lassaletta, L.; Billen, G.; Grizzetti, B.; Anglade, J.; Garnier, J. 50 year trends in nitrogen use efficiency of world cropping systems: The relationship between yield and nitrogen input to cropland. Environ. Res. Lett. 2014, 9, 105011. [Google Scholar] [CrossRef]
  3. FAO. Inorganic Fertilizers 1990–2020; FAO STAT Analytical Brief 47; FAO: Rome, Italy, 2022. [Google Scholar]
  4. Bindraban, P.S.; Dimkpa, C.O.; Pandey, R. Exploring phosphorus fertilizers and fertilization strategies for improved human and environmental health. Biol. Fertil. Soils 2020, 56, 299–317. [Google Scholar] [CrossRef]
  5. Wang, Y.; Liang, J.; Yang, J.; Ma, X.; Li, X.; Wu, J.; Yang, G.; Ren, G.; Feng, Y. Analysis of the environmental behavior of farmers for non-point source pollution control and management: An integration of the theory of planned behavior and the protection motivation theory. J. Environ. Manag. 2019, 237, 15–23. [Google Scholar] [CrossRef] [PubMed]
  6. Wu, Y.; Liu, J.; Shen, R.; Fu, B. Mitigation of nonpoint source pollution in rural areas: From control to synergies of multi ecosystem services. Sci. Total Environ. 2017, 607–608, 1376–1380. [Google Scholar] [CrossRef]
  7. Ministry of Environmental Protection of China; National Bureau of Statistics of China; Ministry of Agriculture of China. Bulletin on the First National Census on Pollution Sources of China; Ministry of Ecology and Environment of the People’s Republic of China: Beijing, China, 2010.
  8. Abraham, B.; Araya, H.; Berhe, T.; Edwards, S.; Gujja, B.; Khadka, R.B.; Koma, Y.S.; Sen, D.; Sharif, A.; Styger, E.; et al. The system of crop intensification: Reports from the field on improving agricultural production, food security, and resilience to climate change for multiple crops. Agric. Food Secur. 2014, 3, 4. [Google Scholar] [CrossRef]
  9. National Bureau of Statistics of China. China Statistical Yearbook-2021; China Statistics Press: Beijing, China, 2021.
  10. FAO. World Food and Agriculture—Statistical Yearbook 2021; FAO: Rome, Italy, 2021. [Google Scholar]
  11. Cui, Z.; Zhang, F.; Chen, X.; Miao, Y.; Li, J.; Shi, L.; Xu, J.; Ye, Y.; Liu, C.; Yang, Z.; et al. On-farm evaluation of an in-season nitrogen management strategy based on soil Nmin test. Field Crops Res. 2008, 105, 48–55. [Google Scholar] [CrossRef]
  12. Qiu, L.; Zhu, J.; Pan, Y.; Wu, S.; Dang, Y.; Xu, B.; Yang, H. The positive impacts of landscape fragmentation on the diversification of agricultural production in Zhejiang Province, China. J. Cleaner Prod. 2020, 251, 119722. [Google Scholar] [CrossRef]
  13. Bayad, M.; Chau, H.W.; Trolove, S.; Moir, J.; Condron, L.; El Gharous, M. Surface runoff and losses of phosphorus from hydrophobic pastoral soils. Agric. Ecosyst. Environ. 2022, 324, 107690. [Google Scholar] [CrossRef]
  14. Sohrt, J.; Lang, F.; Weiler, M. Quantifying components of the phosphorus cycle in temperate forests. WIREs Water 2017, 4, e1243. [Google Scholar] [CrossRef]
  15. Lucas, E.; Kennedy, B.; Roswall, T.; Burgis, C.; Toor, G.S. Climate Change Effects on Phosphorus Loss from Agricultural Land to Water: A Review. Curr. Pollut. Rep. 2023, 9, 623–645. [Google Scholar] [CrossRef]
  16. Habibiandehkordi, R.; Reid, D.K.; Goel, P.K.; Biswas, A. Phosphorus loss assessment tools: A review of underlying concepts and applicability in cold climates. Environ. Sci. Pollut. Res. 2020, 27, 3794–3802. [Google Scholar] [CrossRef] [PubMed]
  17. Van der Bom, F.J.T.; Kopittke, P.M.; Raymond, N.S.; Sekine, R.; Lombi, E.; Mueller, C.W.; Doolette, C.L. Methods for assessing laterally-resolved distribution, speciation and bioavailability of phosphorus in soils. Rev. Environ. Sci. Biotechnol. 2022, 21, 53–74. [Google Scholar] [CrossRef]
  18. Walton, C.R.; Zak, D.; Audet, J.; Petersen, R.J.; Lange, J.; Oehmke, C.; Wichtmann, W.; Kreyling, J.; Grygoruk, M.; Jabłońska, E.; et al. Wetland buffer zones for nitrogen and phosphorus retention: Impacts of soil type, hydrology and vegetation. Sci. Total Environ. 2020, 727, 138709. [Google Scholar] [CrossRef]
  19. Serrano-Muela, M.P.; Nadal-Romero, E.; Lana-Renault, N.; González-Hidalgo, J.C.; López-Moreno, J.I.; Beguería, S.; Sanjuan, Y.; García-Ruiz, J.M. An Exceptional Rainfall Event in the Central Western Pyrenees: Spatial Patterns in Discharge and Impact. Land Degrad. Dev. 2015, 26, 249–262. [Google Scholar] [CrossRef]
  20. Pionke, H.B.; Gburek, W.J.; Sharpley, A.N. Critical source area controls on water quality in an agricultural watershed located in the Chesapeake Basin. Ecol. Eng. 2000, 14, 325–335. [Google Scholar] [CrossRef]
  21. Yu, H.; Adu-Gyamfi, J.; Oshunsanya, S.O.; Chappell, A.; Liu, W.; Zheng, Y.; Xue, T.; Heng, L. Novel sediment source fingerprinting quantifying erosion-induced total nitrogen and total phosphorus outputs from an intensive agricultural catchment, North China. Int. Soil Water Conserv. Res. 2023, 11, 494–506. [Google Scholar] [CrossRef]
  22. Ma, B.; Guan, R.; Liu, L.; Huang, Z.; Qi, S.; Xi, Z.; Zhao, Y.; Song, S.; Yang, H. Nitrogen Loss in Vegetable Field under the Simulated Rainfall Experiments in Hebei, China. Water 2021, 13, 552. [Google Scholar] [CrossRef]
  23. Zhao, Z.; Qin, W.; Bai, Z.; Ma, L. Agricultural nitrogen and phosphorus emissions to water and their mitigation options in the Haihe Basin, China. Agric. Water Manag. 2019, 212, 262–272. [Google Scholar] [CrossRef]
  24. Chen, Z.; Yang, L.; Jiang, Z.; Li, C.; Hu, X.; Pang, L.; Li, S.; Sun, H. Runoff-driven nitrogen and phosphorus dynamics of substrate material for rocky slope eco-engineering. Ecol. Eng. 2013, 51, 123–132. [Google Scholar] [CrossRef]
  25. Zeng, S.-C.; Chen, B.-G.; Jiang, C.-A.; Wu, Q.-T. Impact of fertilization on chestnut growth, N and P concentrations in runoff water on degraded slope land in South China. J. Environ. Sci. 2007, 19, 827–833. [Google Scholar] [CrossRef]
  26. Dhillon, J.; Torres, G.; Driver, E.; Figueiredo, B.; Raun, W.R. World Phosphorus Use Efficiency in Cereal Crops. Agron. J. 2017, 109, 1670–1677. [Google Scholar] [CrossRef]
  27. Bah, H.; Zhou, M.; Ren, X.; Hu, L.; Dong, Z.; Zhu, B. Effects of organic amendment applications on nitrogen and phosphorus losses from sloping cropland in the upper Yangtze River. Agric. Ecosyst. Environ. 2020, 302, 107086. [Google Scholar] [CrossRef]
  28. Liu, J.; Liao, W.; Zhang, Z.; Zhang, H.; WANG, X.; Meng, M. Effect of Phopshate Fertilizer and Manure on Crop Yield, Soil P Accumulation, and the Environmental Risk Assessment. Agric. Sci. China 2007, 6, 1107–1114. [Google Scholar] [CrossRef]
  29. Badrzadeh, N.; Samani, J.M.V.; Mazaheri, M.; Kuriqi, A. Evaluation of management practices on agricultural nonpoint source pollution discharges into the rivers under climate change effects. Sci. Total Environ. 2022, 838, 156643. [Google Scholar] [CrossRef]
  30. Xue, L.; Hou, P.; Zhang, Z.; Shen, M.; Liu, F.; Yang, L. Application of systematic strategy for agricultural non-point source pollution control in Yangtze River basin, China. Agric. Ecosyst. Environ. 2020, 304, 107148. [Google Scholar] [CrossRef]
  31. Tian, S.; Xu, Y.; Wang, Q.; Zhang, Y.; Yuan, X.; Ma, Q.; Feng, X.; Ma, H.; Liu, J.; Liu, C.; et al. The effect of optimizing chemical fertilizers consumption structure to promote environmental protection, crop yield and reduce greenhouse gases emission in China. Sci. Total Environ. 2023, 857, 159349. [Google Scholar] [CrossRef]
  32. Chowdhury, R.B.; Moore, G.A.; Weatherley, A.J.; Arora, M. Key sustainability challenges for the global phosphorus resource, their implications for global food security, and options for mitigation. J. Cleaner Prod. 2017, 140, 945–963. [Google Scholar] [CrossRef]
  33. Luo, X.; Kou, C.; Wang, Q. Optimal Fertilizer Application Reduced Nitrogen Leaching and Maintained High Yield in Wheat-Maize Cropping System in North China. Plants 2022, 11, 1963. [Google Scholar] [CrossRef]
  34. Yu, W.; Yue, Y.; Wang, F. The spatial-temporal coupling pattern of grain yield and fertilization in the North China plain. Agric. Syst. 2022, 196, 103330. [Google Scholar] [CrossRef]
  35. Zhang, B.; Cui, B.; Zhang, S.; Wu, Q.; Yao, L. Source apportionment of nitrogen and phosphorus from non-point source pollution in Nansi Lake Basin, China. Environ. Sci. Pollut. Res. 2018, 25, 19101–19113. [Google Scholar] [CrossRef] [PubMed]
  36. Valbuena-Parralejo, N.; Fenton, O.; Tuohy, P.; Williams, M.; Lanigan, G.J.; Humphreys, J. Phosphorus and nitrogen losses from temperate permanent grassland on clay-loam soil after the installation of artificial mole and gravel mole drainage. Sci. Total Environ. 2019, 659, 1428–1436. [Google Scholar] [CrossRef] [PubMed]
  37. Ross, C.A.; Moslenko, L.L.; Biagi, K.M.; Oswald, C.J.; Wellen, C.C.; Thomas, J.L.; Raby, M.; Sorichetti, R.J. Total and dissolved phosphorus losses from agricultural headwater streams during extreme runoff events. Sci. Total Environ. 2022, 848, 157736. [Google Scholar] [CrossRef]
  38. Dou, C.; Xia, J.; Wang, Y.; Cai, W.; Zeng, Z.; Zhu, X.; Cheng, Y. Spatial variations of soil phosphorus in bars of a mountainous river. Sci. Total Environ. 2020, 741, 140478. [Google Scholar] [CrossRef]
  39. Deng, L.; Zhang, L.; Fan, X.; Sun, T.; Fei, K.; Ni, L. Effects of rainfall intensity and slope gradient on runoff and sediment yield from hillslopes with weathered granite. Environ. Sci. Pollut. Res. 2019, 26, 32559–32573. [Google Scholar] [CrossRef]
  40. Bai, L.; Shi, P.; Li, Z.; Li, P.; Zhao, Z.; Dong, J.; Cui, L. Effects of vegetation patterns on soil nitrogen and phosphorus losses on the slope-gully system of the Loess Plateau. J. Environ. Manag. 2022, 324, 116288. [Google Scholar] [CrossRef]
  41. Wang, W.; Liang, T.; Wang, L.; Liu, Y.; Wang, Y.; Zhang, C. The effects of fertilizer applications on runoff loss of phosphorus. Environ. Earth Sci. 2013, 68, 1313–1319. [Google Scholar] [CrossRef]
  42. Buffleben, M.S.; Zayeed, K.; Kimbrough, D.; Stenstrom, M.K.; Suffet, I.H. Evaluation of urban non-point source runoff of hazardous metals entering Santa Monica Bay, California. Wat. Sci. Tech. 2002, 45, 263–268. [Google Scholar] [CrossRef]
  43. Zhang, R.; Li, M.; Yuan, X.; Pan, Z. Influence of rainfall intensity and slope on suspended solids and phosphorus losses in runoff. Environ. Sci. Pollut. Res. 2019, 26, 33963–33975. [Google Scholar] [CrossRef]
  44. Sun, C.W.; Luan, Q.H.; Qin, T.L.; Man, Z.H.; Niu, Y.Z. Influence of slope on runoff process in typical soil unit, North China. IOP Conf. Ser. Earth Environ. Sci. 2019, 344, 12057. [Google Scholar] [CrossRef]
  45. Bi, W.; Weng, B.; Yuan, Z.; Yang, Y.; Xu, T.; Yan, D.; Ma, J. Evolution of Drought-Flood Abrupt Alternation and Its Impacts on Surface Water Quality from 2020 to 2050 in the Luanhe River Basin. Int. J. Environ. Res. Public Health 2019, 16, 691. [Google Scholar] [CrossRef]
  46. Han, S.; Xu, D.; Wang, S. Runoff formation from experimental plot, field, to small catchment scales in agricultural North Huaihe River Plain, China. Hydrol. Earth Syst. Sci. 2012, 16, 3115–3125. [Google Scholar] [CrossRef]
  47. Shu, W.; Tian, Y.; Gao, B.; Zhao, P. Design and Calibration of An Artificial Rainfall Simulator. Bull. Soil Water Conserv. 2015, 35, 120–123. [Google Scholar]
  48. Wang, R.; Cai, C.; Zhang, J.; Sun, S.; Zhang, H. Study on phosphorus loss and influencing factors in the water source area. Int. Soil Water Conserv. Res. 2022, 10, 324–334. [Google Scholar] [CrossRef]
  49. Wang, S.; Feng, X.; Wang, Y.; Zheng, Z.; Li, T.; He, S.; Zhang, X.; Yu, H.; Huang, H.; Liu, T.; et al. Characteristics of nitrogen loss in sloping farmland with purple soil in southwestern China during maize (Zea mays L.) growth stages. CATENA 2019, 182, 104169. [Google Scholar] [CrossRef]
  50. Wang, T.; Zhu, B.; Zhou, M.; Hu, L.; Jiang, S.; Wang, Z. Nutrient loss from slope cropland to water in the riparian zone of the Three Gorges Reservoir: Process, pathway, and flux. Agric. Ecosyst. Environ. 2020, 302, 107108. [Google Scholar] [CrossRef]
  51. Mengel, K. Agronomic measures for better utilization of soil and fertilizer phosphates. Eur. J. Agron. 1997, 7, 221–233. [Google Scholar] [CrossRef]
  52. Nkebiwe, P.M.; Weinmann, M.; Bar-Tal, A.; Müller, T. Fertilizer placement to improve crop nutrient acquisition and yield: A review and meta-analysis. Field Crops Res. 2016, 196, 389–401. [Google Scholar] [CrossRef]
  53. Osman, A.I.; Zhang, Y.; Lai, Z.Y.; Rashwan, A.K.; Farghali, M.; Ahmed, A.A.; Liu, Y.; Fang, B.; Chen, Z.; Al-Fatesh, A.; et al. Machine learning and computational chemistry to improve biochar fertilizers: A review. Environ. Chem. Lett. 2023, 21, 3159–3244. [Google Scholar] [CrossRef]
  54. Menezes-Blackburn, D.; Giles, C.; Darch, T.; George, T.S.; Blackwell, M.; Stutter, M.; Shand, C.; Lumsdon, D.; Cooper, P.; Wendler, R.; et al. Opportunities for mobilizing recalcitrant phosphorus from agricultural soils: A review. Plant Soil 2018, 427, 5–16. [Google Scholar] [CrossRef]
  55. Li, H.; Li, Y.; Xu, Y.; Lu, X. Biochar phosphorus fertilizer effects on soil phosphorus availability. Chemosphere 2020, 244, 125471. [Google Scholar] [CrossRef] [PubMed]
  56. Wang, G.; Jin, Z.; George, T.S.; Feng, G.; Zhang, L. Arbuscular mycorrhizal fungi enhance plant phosphorus uptake through stimulating hyphosphere soil microbiome functional profiles for phosphorus turnover. New Phytol. 2023, 238, 2578–2593. [Google Scholar] [CrossRef] [PubMed]
  57. Nopphakat, K.; Runsaeng, P.; Klinnawee, L. Acaulospora as the Dominant Arbuscular Mycorrhizal Fungi in Organic Lowland Rice Paddies Improves Phosphorus Availability in Soils. Sustainability 2022, 14, 31. [Google Scholar] [CrossRef]
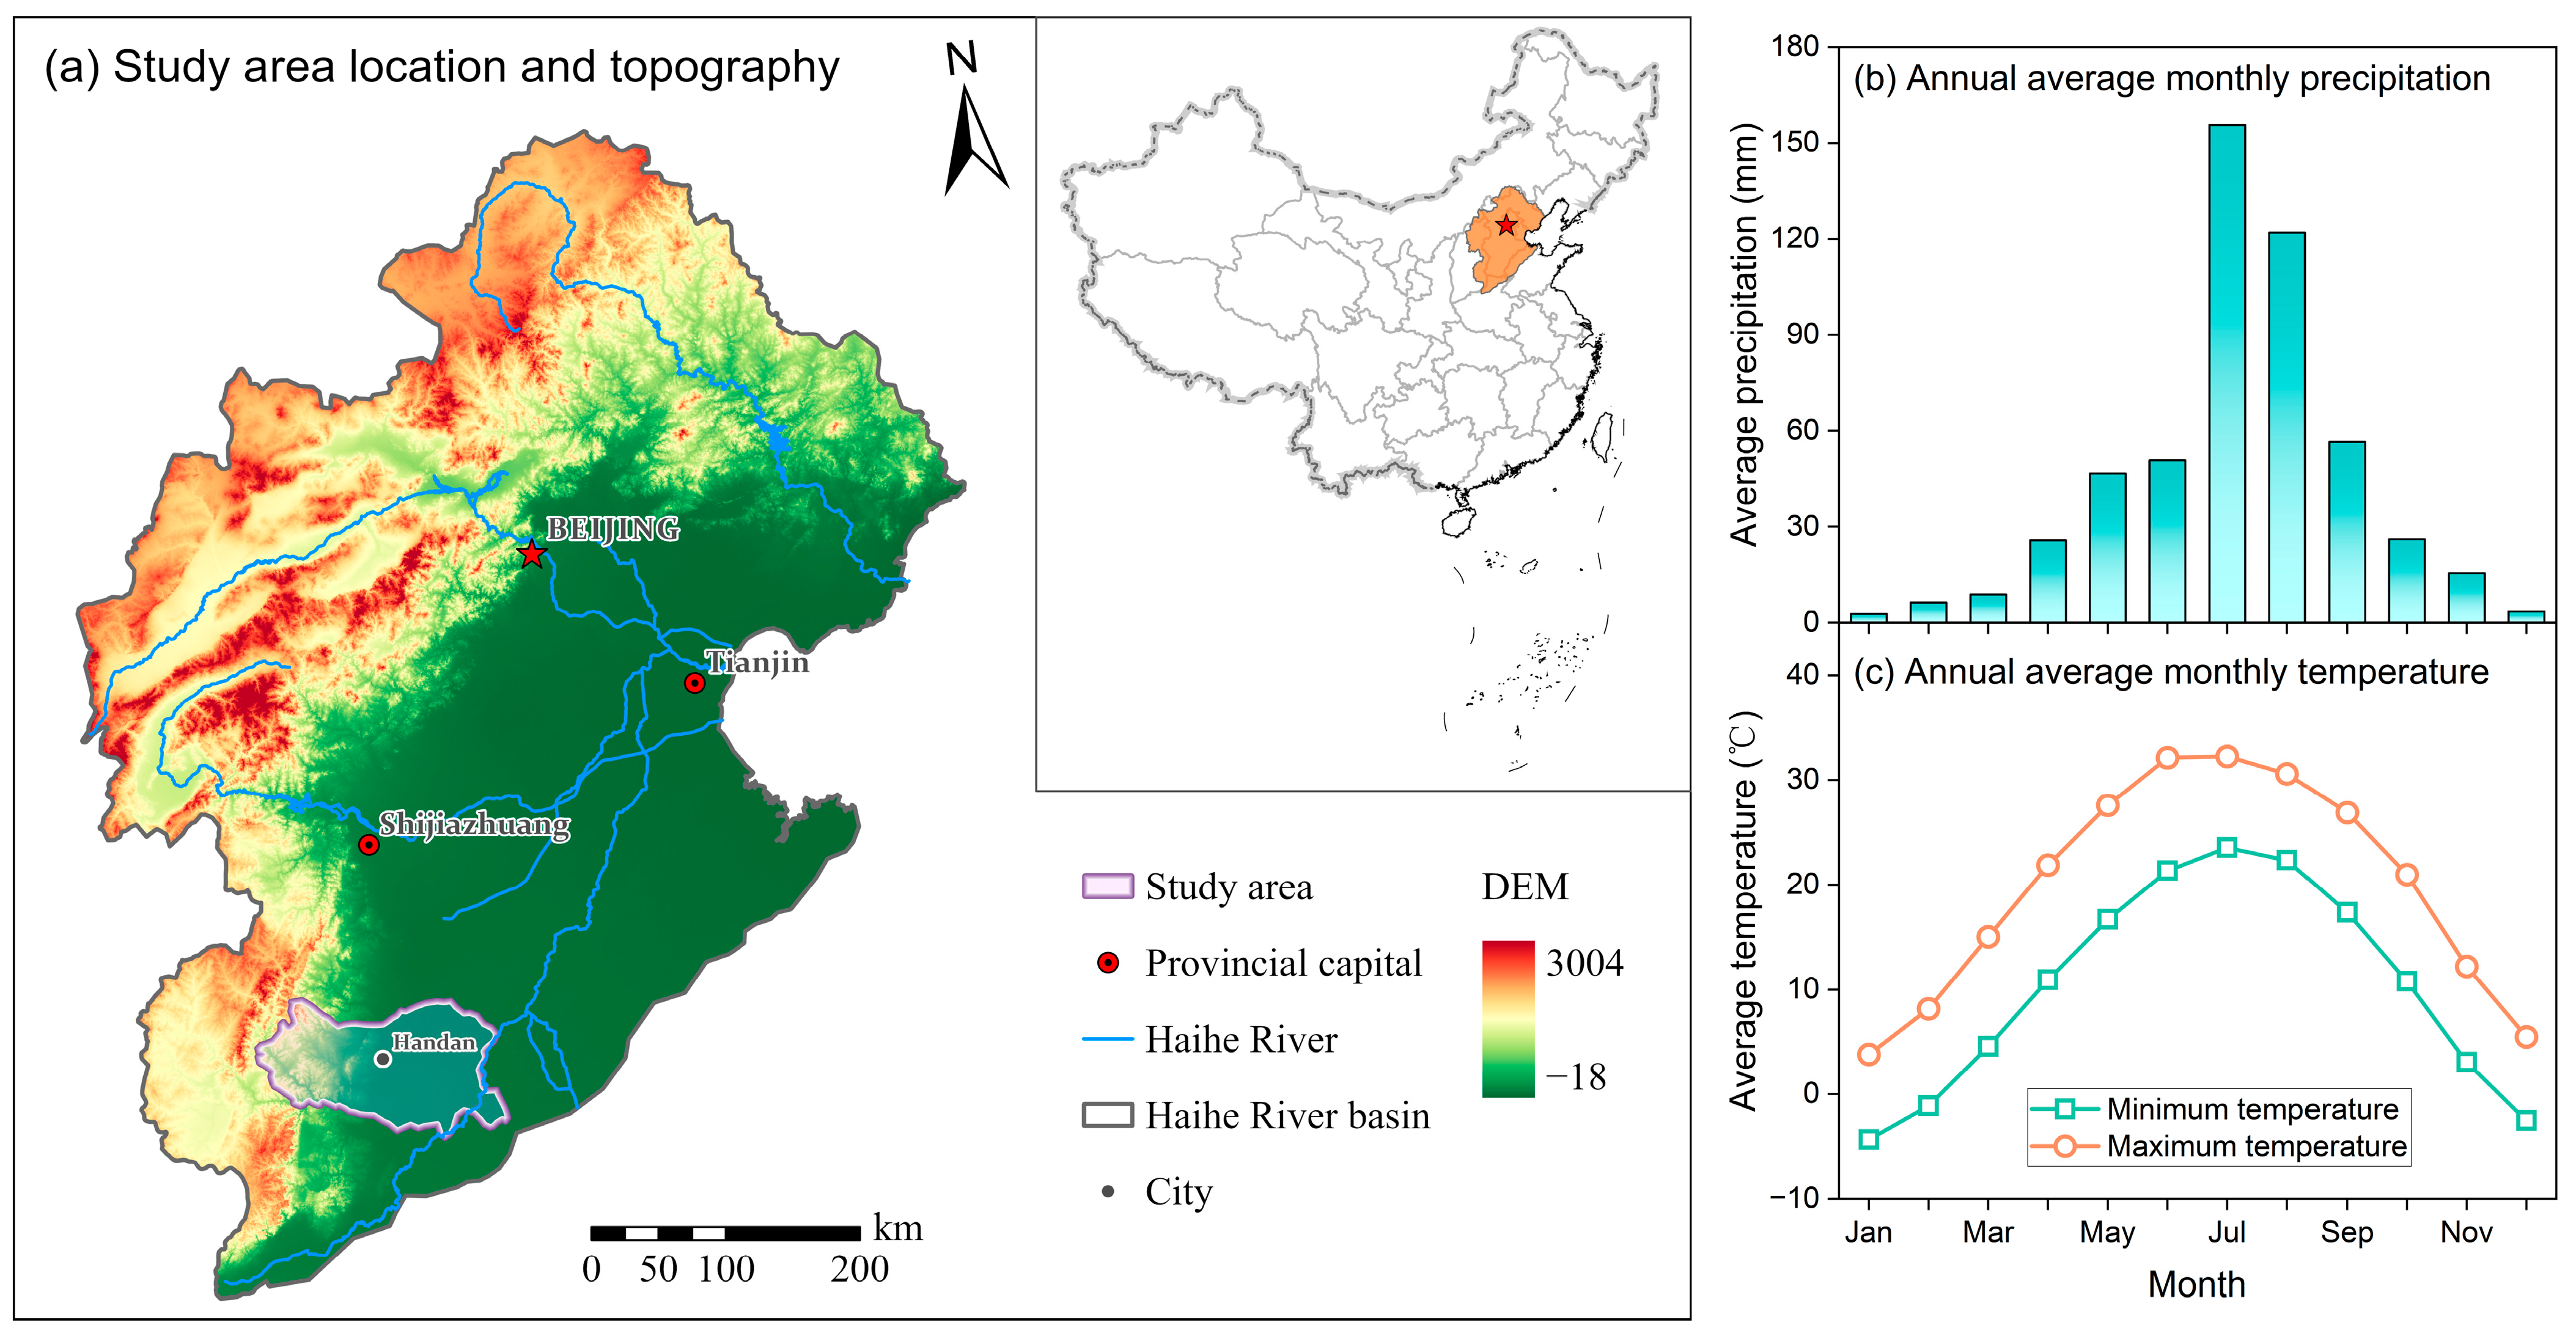
Figure 1. Study area and its climate characteristics: (a) geographical location and topographic characteristics of the study area; (b) multi-year monthly average precipitation from 1991 to 2020; (c) multi-year monthly average temperature from 1991 to 2020.
Agronomy 14 01922 g001
Figure 2. Runoff process and initial loss time of surface runoff and interflow. Treatments: ST1, ST4, ST7 = light rain (54 mm h−1); ST2, ST5, ST8 = moderate rain (75 mm h−1); ST3, ST6, ST9 = heavy rain (99 mm h−1).
Agronomy 14 01922 g002
Figure 3. Variation in phosphorus concentration with the runoff generation time. Error bars are standard errors. Treatments: ST1 = control check + light rainfall; ST2 = control check + moderate rainfall; ST3 = control check + heavy rainfall; ST4 = conventional fertilization + light rainfall; ST5 = conventional fertilization + moderate rainfall; ST6 = conventional fertilization + heavy rainfall; ST7 = optimized fertilization + light rainfall; ST8 = optimized fertilization + moderate rainfall; ST9 = optimized fertilization + heavy rainfall.
Agronomy 14 01922 g003
Figure 4. Cumulative runoff and phosphorus losses after rainfall under different fertilization schemes. Error bars are standard errors. Different letters above the bars indicate statistical differences between treatments at p < 0.05 using the LSD test.
Agronomy 14 01922 g004
Figure 5. Total phosphorus loss statistics: (a) percentages and (b) phosphorus loss coefficients for surface runoff and interflow.
Agronomy 14 01922 g005
Figure 6. Effect of different phosphorus fertilizer applications on root length (a), plant height (b), dry weight (c), and fresh weight (d) of pak choi. ST1, ST2, and ST3 are control check; ST4, ST5, and ST6 are conventional fertilization treatment; ST7, ST8, and ST9 are optimized fertilization treatment. Error bars are standard errors. Different letters above the bars indicate statistical differences between treatments at p < 0.05 using the LSD test.
Agronomy 14 01922 g006
Table 1. Nutrient phosphate P2O5 application levels (kg ha−1) globally and by country [3].
AreaYear
1990199520002005201020152020
Argentina1.96.511.714.817.511.325.8
Australia34.157.147.039.031.729.630.9
Brazil21.325.542.648.353.768.6113.9
Canada13.916.013.917.417.226.131.1
China44.368.165.887.0105.894.073.1
India18.417.124.830.748.441.253.2
Indonesia18.212.47.38.011.231.023.6
Japan131.6125.3120.798.886.776.877.3
Netherlands63.960.446.642.629.08.513.1
Spain26.527.231.028.819.624.029.2
Thailand15.522.220.216.721.520.816.6
United States of America20.622.121.824.124.324.824.8
Global24.320.421.525.028.528.430.9
Table 2. Physico-chemical properties of the test soil.
Soil TextureBDpHOMTNAHNTPAP
Cinnamon soil1.25813.40.8867.50.8213.1
Abbreviations: BD, bulk density (g cm−3); OM, organic matter (g kg−1); TN, total nitrogen (g kg−1); AHN, alkali hydrolyzable nitrogen (mg kg−1); TP, total phosphorus (g kg−1); AP, available phosphorus (mg kg−1).
Table 3. Fertilization schemes (kg ha−1) and rainfall intensity (mm h−1) of test soil troughs.
Soil TroughFertilization SchemesNP2O5Rainfall Intensity
ST1CK0054
ST2CK0075
ST3CK0099
ST4CF13510554
ST5CF13510575
ST6CF13510599
ST7OF82.567.554
ST8OF82.567.575
ST9OF82.567.599
Abbreviations: CK, control check; CF, conventional fertilization; OF, optimized fertilization.
Table 4. Pearson’s correlation analysis of phosphorus losses with influencing factors.
Influencing FactorsPhosphorus Losses from Surface RunoffPhosphorus Losses from Interflow
DPPPTPDPPPTP
Rainfall intensity0.6470.5910.5960.795 *0.780 *0.782 *
Fertilizer use0.674 *0.730 *0.725 *0.4830.4770.478
Runoff volume0.775 *0.731 *0.735 *0.919 **0.905 **0.906 **
Note: ** significant at p = 0.01 (two-tailed), * significant at p = 0.05 (two-tailed).
Table 5. Regression model of phosphorus losses with influencing factors.
Phosphorus TypeRegression Model EquationR2FSig.
Group 1: Surface runoff
DPTPL1 = −3.725 + 0.455PCF + 0.069RA0.87921.8730.003
PPTPL2 = −36.634 + 5.124PCF + 0.657RA0.88623.2160.004
TPTPL3 = −40.358 + 5.579CF + 0.726RA0.88523.1220.004
Group 2: Interflow
DPTPL4 = −0.504 + 0.029PCF + 0.008RA0.87020.1400.005
PPTPL5 = −4.766 + 0.270PCF + 0.070RA0.84316.0800.007
TPTPL6 = −5.270 + 0.299PCF + 0.078RA0.84616.4310.007
Abbreviations: TPL, total phosphorus losses (mg); PCF, phosphorus content of applied fertilizers (kg ha−1); RA, rainfall amounts (mm).
Disclaimer/Publisher’s Note: The statements, opinions and data contained in all publications are solely those of the individual author(s) and contributor(s) and not of MDPI and/or the editor(s). MDPI and/or the editor(s) disclaim responsibility for any injury to people or property resulting from any ideas, methods, instructions or products referred to in the content.