Abstract
Pests are widely distributed in nature, characterized by their small size, which, along with environmental factors such as lighting conditions, makes their identification challenging. A lightweight pest detection network, HCFormer, combining convolutional neural networks (CNNs) and a vision transformer (ViT) is proposed in this study. Data preprocessing is conducted using a bottleneck-structured convolutional network and a Stem module to reduce computational latency. CNNs with various kernel sizes capture local information at different scales, while the ViT network’s attention mechanism and global feature extraction enhance pest feature representation. A down-sampling method reduces the input image size, decreasing computational load and preventing overfitting while enhancing model robustness. Improved attention mechanisms effectively capture feature relationships, balancing detection accuracy and speed. The experimental results show that HCFormer achieves 98.17% accuracy, 91.98% recall, and a mean average precision (mAP) of 90.57%. Compared with SENet, CrossViT, and YOLOv8, HCFormer improves the average accuracy by 7.85%, 2.01%, and 3.55%, respectively, outperforming the overall mainstream detection models. Ablation experiments indicate that the model’s parameter count is 26.5 M, demonstrating advantages in lightweight design and detection accuracy. HCFormer’s efficiency and flexibility in deployment, combined with its high detection accuracy and precise classification, make it a valuable tool for identifying and classifying crop pests in complex environments, providing essential guidance for future pest monitoring and control.
1. Introduction
Crop pests reduce productivity, so managing them through early detection and prevention is essential []. It is estimated that between 20% and 40% of yearly crop production is lost because of plant diseases and insect damage across the world, costing the global economy USD 220 and USD 70 billion, respectively. The amount of these losses varies across the globe and often occurs as a result of transboundary plant pests and diseases []. To control these pests, the use of pesticides for crop protection is on the rise [], which not only raises the cost of agricultural production but may also lead to pesticide overuse, further affecting crop quality and environmental safety []. Effective pest management is crucial since it directly influences crop yields. Pests are diverse and widespread, reproducing quickly and in large numbers. However, this also increases the risk of pests developing pesticide resistance []. Therefore, the accurate identification and targeted treatment of different types of pests are essential for effective pest management. Accurate pest identification and classification are thus critical tasks.
However, it is extremely challenging to accurately distinguish these pests with the naked eye. Some pest species may appear very similar, especially in their larval or adult stages, and subtle morphological differences often require a microscope or expert biological knowledge to identify them [,]. For instance, certain types of beetles and moths can be very close in color and size. Additionally, environmental factors such as lighting and background also affect the identification of pests [,,]. More challengingly, these pests often move quickly or hide in natural environments, making it difficult for even experienced agricultural workers and researchers to effectively monitor and manage them. The traditional methods of visually inspecting and evaluating crops solely based on farmer expertise present several challenges and limitations in agricultural research []. In the worst-case scenario, an undetected crop pest might damage the entire crop, negatively affecting the yield.
When machine learning (ML) technology first emerged, it showed promise for use in pest identification, but its accuracy was often mediocre on large datasets owing to inadequate data preprocessing and generalization capabilities, affecting the classification precision []. In deep learning (DL), accuracy in pest classification has progressively improved. It can directly conduct unsupervised learning from the original image to obtain multi-level image feature information such as low-level features, intermediate features, and high-level semantic features []. As the significant advantages of deep learning in the field of machine learning continue to emerge, particularly with large amounts of training data, deep learning can extract more precise features. In recent years, the application of deep learning in the agricultural sector has become increasingly widespread. The gradual advancement in computer vision research has led to significant progress in crop identification, disease and pest recognition, and pest detection [,,]. This has effectively addressed the challenges of information extraction and low recognition efficiency in complex environments.
Traditional deep learning methods for pest detection rely primarily on a single convolutional neural network (CNN) that analyzes image data, as discussed by Malek et al. [] and Rajalakshmi et al. []. However, CNNs have limitations in capturing long-range dependencies because they focus mainly on local receptive fields. This approach often overlooks the global features of images, highlighting a significant drawback.
The introduction of a vision transformer (ViT) helps models better understand the interactions between distant parts of an image, as proposed by Wang et al. [] with the ODP-Transformer model and by Zhan et al. [] using the IterationViT model. Both models utilize transformers to capture global features among images, which is crucial for comprehending complex scenes. It is essential for pest detection that the ViT model is highly adaptable to different resolutions and image sizes, since pest images may come from various cameras and sensors with significant variations in quality and size. In particular, when ViT models are pre-trained on extensive datasets such as ImageNet, they demonstrate impressive transfer learning capabilities tailored to specific domains such as agriculture []. Once pre-trained on large datasets, the ViT model demonstrates robust generalization capabilities, effectively recognizing pest species not seen during training or those in varying environmental conditions []. Utilizing ViT for pest detection reduces the reliance on expert identification, significantly enhancing detection speed and accuracy.
CNNs excel at extracting local features from images, such as edges and textures, while ViTs are adept at capturing the relationships among different parts of an image. The convolutional layer of CNNs only considers the characteristics of the local area during convolution and does not explicitly incorporate the positional information of pixels []. Combining CNNs with ViTs allows models to not only capture detailed information but also understand how these details connect in the larger context. This hybrid approach enables models to process highly localized features and long-range dependencies, offering a robust method for tackling complex visual tasks. This combination reflects a trend in deep learning model development, which involves cross-domain borrowing and integrating different models’ strengths to solve more complex challenges.
Currently, research on pest detection in natural environments relies primarily on mainstream object detection network models such as YOLO and its improved networks [,], CNN for feature extraction [], and attention mechanisms [] to enhance detection accuracy. However, the accuracy of object detection can be constrained by complex environmental factors and lighting conditions, which in turn affect the network’s feature extraction capability. Despite significant progress in this field, numerous challenges remain, including the following:
- In the pest detection process, the limitations of image resolution result in insufficient feature information extraction, making it difficult to fully capture the image characteristics;
- In pest object detection tasks, complex environmental factors such as crops, lighting conditions, and occlusions increase the difficulties involved with target detection and impose higher demands on detection accuracy;
- During the training of object detection models, in the pursuit of greater accuracy, the models often have a large number of parameters. Therefore, finding a balance between accuracy and computational resources remains a significant challenge.
To enhance pest detection performance, we propose a lightweight pest image recognition model based on a hybrid ViT and a CNN. This model is designed with a parallel feature extraction network that integrates both the local and global features of the input images, resulting in more accurate feature representation. Additionally, an improved attention mechanism architecture is incorporated to make the entire network more lightweight. This approach not only strengthens the feature extraction capability for pest object detection but also improves the model’s training speed.
Therefore, the main contributions of this article are as follows:
- To address the issue of insufficient feature extraction capability in pest object detection tasks, a novel parallel feature extraction network for pest classification recognition, HCFormer, is proposed in this paper, which leverages the strengths of CNNs and ViT networks to address the shortcomings of traditional image recognition networks. This hybrid method utilizes CNN’s robust capability for local feature extraction and ViT’s advantage in handling long-range dependencies and capturing global features. This combination allows for a more comprehensive extraction of features across different scales and parts, enhancing the accuracy of recognition. At the same time, employing overlapping CNNs with varying kernel sizes to extract multi-scale local features from images has improved the model’s ability to adapt to different pest shapes and sizes;
- To address the issues of large parameter quantities, slow computation speeds, and low computational efficiencies during the training of large models, a lightweight improvement to the attention mechanism network is introduced in this paper alongside the down-sampling technique. Additionally, convolutional networks are incorporated to compensate for the accuracy loss caused by reduced image resolution, thereby reducing the weight of the model;
- We validated our model using pest photos from Flickr, a popular photo-sharing platform, comparing it against various types of deep-learning pest recognition networks. To increase the diversity and scale of our training dataset and thus boost the model’s generalization capacity and performance, we utilized a variety of image augmentation techniques, including rotation, local zoom, brightness adjustment, and saturation modification. These augmentation techniques ensured consistent performance across varying lighting conditions and improved the model’s adaptability to color variations.
2. Materials and Methods
2.1. Related Work on Pest Detection
In recent years, pest classification and recognition has become a hot topic in agricultural research, employing various methods including machine learning and deep learning. In the field of ML, significant progress has been made in classifying pest images by training classifiers using extracted pest features.
Larios et al. [] used target feature vectors and region detection to classify and recognize pest appearance through cascading histograms, achieving promising results. Heo et al. [] adopted the concept of fuzzy membership, combining it with the machine learning algorithm SVM to create a novel fuzzy support vector machine algorithm. This new method was applied to classifying pest tracks with notable success. As artificial intelligence advances, deep neural networks are progressively replacing traditional machine learning algorithms in vision applications. This shift has prompted researchers to concentrate on designing efficient neural network architectures and proposing diverse CNN-based methods.
One of the earliest studies [] that used a CNN for pest identification compared the accuracy of their CNN system, which included AlexNet, with six human experts. In this study, AlexNet outperformed four of the six experts on the Deng dataset. Kuzuhara et al. [] developed a two-stage small pest detection and recognition method based on CNNs, utilizing YOLOv3 for pest detection. Patel et al. [] employed the Faster R-CNN architecture for multi-class pest detection, achieving over 90% recognition accuracy.
With the advent of ViT, various derivative networks have been increasingly applied to pest classification. P, V. et al. [] introduced a pest detection and classification algorithm for peanut crops, GNVIT. This model enhances the ViT approach, overcoming the limitations of traditional CNN models in feature extraction and global visual understanding. Using the ImageNet dataset for evaluation, GNVIT demonstrated good performance on metrics such as the F1-score and recall. Zhang et al. [] developed a self-supervised learning network for pest classification, FE-VIT, which trains pre-trained models with unlabeled data, adapting ViT to pest recognition tasks. This method not only reduces training time but also improves classification accuracy.
From CNNs to recurrent neural networks (RNNs), and from transfer learning to ensemble methods, the spectrum of approaches underscores the innovative strategies harnessed to achieve precision in categorization []. Alkanan et al.’s [] enhanced iteration of MobileNetV2-integrated AI and the discriminative classification of corn diseases, strategically incorporating additional layers—Average Pooling, Flatten, Dense, Dropout, and Softmax—and augmenting its feature extraction capabilities.
Previous research on pest identification has clearly demonstrated that deep learning models surpass machine learning models in terms of pest recognition and classification. The most prevalent methods in deep learning include feature extraction techniques based on CNN methods [] and improvements to the YOLO algorithm [], as well as the ViT model and its derivatives. These methods focus on extracting either local features [] or global features for recognition and classification []. However, in real-world scenarios, environmental complexities and variations, such as different pest poses, different angles of photography, different lighting conditions, and individual differences, present significant challenges if only local or global features are extracted. This can lead to reduced accuracy and model performance. This study confronts these shortcomings by proposing a parallel pest recognition network that extracts features from both local and global perspectives. The network is tested on a dataset containing various types of pests and shows excellent performance in classification.
To address the issue of accuracy in pest detection models, we introduce a hybrid object detection network based on ViT and a CNN. By performing parallel feature extraction using ViT and CNNs at different scales, this process comprehensively captures both local and global features of the image. This effectively prevents feature loss and consequently improves detection accuracy, enabling the precise identification of pest characteristics.
Owing to the integration of CNNs and ViT networks, the model has a large number of parameters and a slow computation speed. Therefore, we suggest lightweight methods to enhance model performance. However, when the model processes small-sized, low-resolution images, the lightweight approach improves computational efficiency but negatively affects object detection performance. To address this issue, this study proposes an improved attention mechanism strategy. By employing down-sampling methods and incorporating convolutional networks, we reduce the computational load while compensating for the accuracy loss caused by low resolution.
2.2. Pest Dataset
To evaluate the effectiveness of our proposed model, HCFormer, we utilized a dataset that encompasses a collection of 12 distinct types of agricultural pests. The dataset used in this study was obtained from Flickr (SmugMug, Vancouver, BC, Canada) through an API, ensuring that the images in the dataset were captured in real-world scenarios rather than being AI-generated. This dataset included a variety of insects of different colors, shapes, and sizes across various environments. Such diversity facilitates the training and testing of algorithms, thereby enhancing the practical applicability of the model in detecting and classifying pests. This assortment included ants, bees, beetles, caterpillars, earthworms, millipedes, grasshoppers, moths, slugs, snails, wasps, and weevils, all of which predominantly affect a variety of plant species across Eurasia. Pests are typically defined as organisms that cause damage to crops, livestock, human living environments, or economic activities. The 12 types of pests in the dataset can cause reduced crop yields, diminished quality, or the spread of pathogens and viruses in agriculture. For example, beetles [], moths [], and slugs [] directly nibble on plant leaves, inflicting damage on crops. The pest samples are illustrated in Figure 1, comprising a total of 5500 images. These images have been resized to a uniform maximum width and height of 300 pixels. During the construction of the dataset, the images were divided into a training set, a test set, and a verification set in an 8:1:1 ratio to assess the model’s generalization capability. The dataset exhibited considerable variability, featuring pests in a range of sizes, angles, poses, environmental conditions, and lighting scenarios. To further enhance the robustness of our evaluation, some images within the dataset were rotated to ascertain the performance of our model more effectively.
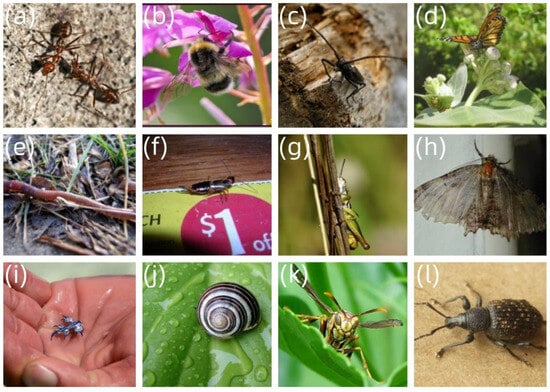
Figure 1.
Image samples from the dataset: (a) ants; (b) bee; (c) beetle; (d) caterpillar; (e) earthworm; (f) earwig; (g) grasshopper; (h) moth; (i) slug; (j) snail; (k) wasp; (l) weevil.
Additionally, to increase the diversity and scale of our training dataset, and thus boost the model’s generalization capacity and performance, we utilized a variety of image augmentation techniques, including rotation, local zoom, brightness adjustment, and saturation modification. These methods ensured stable performance across different lighting conditions and enhanced the model’s ability to adapt to color variations. We dynamically applied these transformations to the input data during each training cycle or batch, thereby creating a diverse array of training samples.
To augment the dataset, improve the network’s generalization capability, and prevent overfitting, this study implemented data augmentation on the original dataset. These steps facilitated more effective training and testing of the deep learning network. The primary image enhancement techniques employed include flipping, local zoom, brightness adjustment, and saturation modification. Flipping allowed the model to simulate the collection of the same sample from various angles, thus enabling it to learn features from multiple perspectives. The brightness adjustments replicated different real-world lighting conditions, enhancing the model’s capability to operate under various lighting scenarios and improving its robustness and accuracy. Table 1 outlines the specifics of the expanded dataset; the number of the original images is 5500.

Table 1.
Distribution of processed image data.
Figure 2 shows the effects of different enhancement methods applied to the same image.
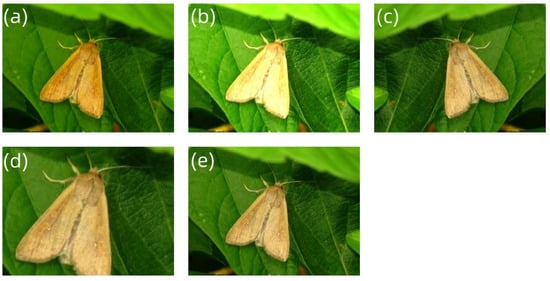
Figure 2.
Images after enhancement: (a) original image; (b) increased brightness; (c) flipped; (d) locally zoomed; (e) increased saturation.
2.3. Methods
In recent years, the use of deep neural networks has led to significant advancements in the field of object detection. CNNs can intelligently capture spatial local features at various layers of an image but lack consideration of global interdependencies. By integrating transformer blocks with CNNs, the performance and efficiency of object detection models can be significantly enhanced. However, the computational overhead of both CNN and ViT networks remains a considerable issue.
A novel pest object detection network is proposed in this paper that combines CNN and ViT, incorporating lightweight strategies to balance detection accuracy and testing time. The basic architecture of our HCFormer model employs a Stem module in its initial stage. This module consists of a set of standard convolutional networks, converting the input image into feature maps instead of converting linear mappings of image patches into tokens as in transformers. The feature extraction section is divided into three stages, adopting a pyramid structure. Each stage progressively reduces the resolution of the feature maps, with sizes of H/8 × W/8, H/16 × W/16, and H/32 × W/32, respectively.
Because of the quadratic growth in the computational complexity of the attention mechanism in transformer networks with respect to the input feature map size H × W, lower-stage large-sized feature maps require more computational cost and time. Considering this factor, we redesigned the attention mechanism section and introduced down-sampling methods to reduce computational costs. Additionally, convolutional networks were employed to compensate for the accuracy loss caused by reduced resolution. This approach minimizes computational costs while maintaining accuracy.
In our pyramid structure, the feature maps decrease in size across stages, potentially leading to the loss of local information. To address this issue, we propose a hybrid feature extraction network that employs a parallel structure to simultaneously extract both the local and global features of the image. Specifically, for local features, we use CNNs of different scales to comprehensively extract local feature maps of various sizes. For global features, ViT is utilized for global stream processing. The features from both paths are then merged and passed to the next block.
Figure 3 illustrates the overall framework of the HCFormer hybrid model proposed in this paper. The input section of the network consists of a Stem network, which includes three 3 × 3 convolutional layers with a stride of 2, converting the input image data into feature vectors. The main body of the network architecture is divided into three stages, with the input size decreasing progressively at each stage, connected through a single convolutional network. The output section employs a global average pooling layer and a linear network to achieve image recognition and classification.
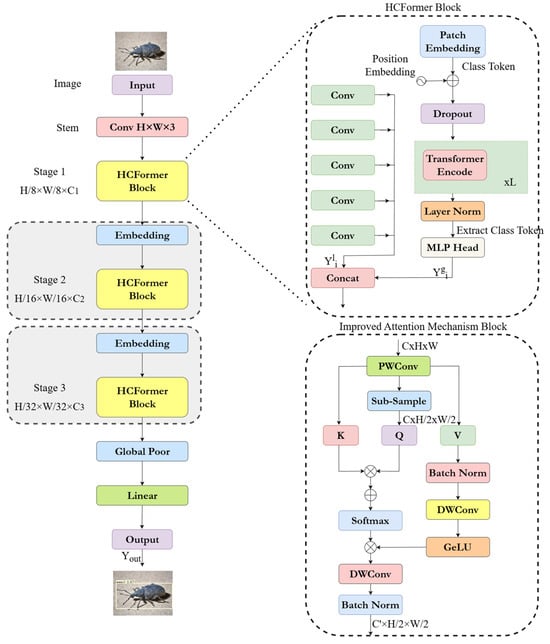
Figure 3.
Overview of the HCFormer hybrid model.
The input feature map of the i-th stage block is represented as .
2.3.1. Input Block
For the input section, a bottleneck structure is introduced in the network design. This structure applies a three-layer stacked convolutional network to each residual function F, consisting of a 1 × 1 convolution, a 3 × 3 convolution, and a 1 × 1 convolution. Specifically, a 1 × 1 convolution layer is first used to reduce the dimensionality of the feature map, followed by a 3 × 3 convolution layer for feature extraction, and finally, a 1 × 1 convolution layer for dimensionality restoration, as shown in Figure 4. This structure reduces the number of parameters and training time by decreasing the number of channels in the intermediate layer. Moreover, the introduction of this structure not only deepens the network but also significantly enhances the model’s performance and effectiveness.
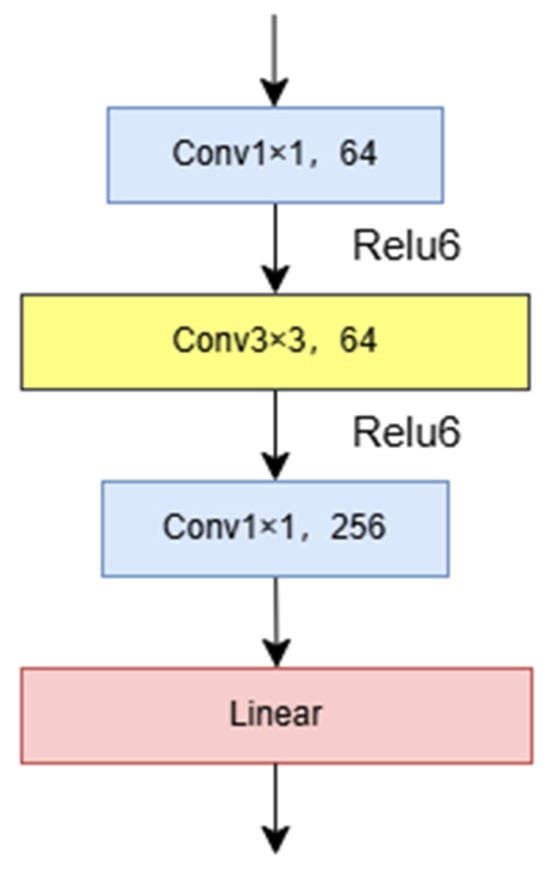
Figure 4.
The structure of the Stem network.
Processing high-resolution images can cause significant computational delays for the entire system. To mitigate this computational drawback, we introduced the Stem module. This module employs a 3 × 3 convolutional neural network and a max-pooling layer as the input components, achieving higher accuracy and lower latency in the original input network. Additionally, this module better captures the continuity of local features. Its primary purpose is to optimize feature extraction and data dimensionality reduction, thereby facilitating subsequent task-processing stages.
ReLU6 is used as the activation function for the first two stages, and a linear layer is utilized for the final stage; ReLU6 effectively maintains the resolution of floating-point numbers, enhancing the model’s nonlinear expression capability and transforming input features into:
where represents using multiple model structures as input modules. These steps work together to enable the initial block to process input data more flexibly and efficiently, enhancing its ability to capture and utilize feature information.
2.3.2. HCFormer Block
Features are output from the residual network and fed into the parallel network. This design aims to simultaneously extract and process both global and local features. Specifically, a local feature extraction structure was constructed, comprising five layers of CNNs with different scales to capture and process local information of varying scales. In this structure, we used larger convolution kernels to capture broader patterns and smaller convolution kernels to extract finer details. For global feature extraction, we selected the ViT network as the core architecture, primarily because of its superior feature extraction capabilities.
The multi-scale convolutional network generates new feature vectors by performing convolution operations on feature maps using convolution kernels of different sizes. By employing convolution operations with different kernel sizes, the feature representation of the image is enriched.
As illustrated in Figure 5, the preprocessed image features are fed into a parallel network structure, consisting of local and global feature extraction networks. The local feature extraction network employs a multi-scale array of convolution kernels sized 1 × 1, 3 × 3, 5 × 5, 7 × 7, and 10 × 10 to capture local features at different scales. The convolution operation is as follows:
where represents the input feature map, denotes the activation function, refers to a convolution kernel of size , and stands for the bias associated with the kernel. Multi-scale CNN kernels utilize different values of to extract feature information, resulting in a feature representation expressed as:
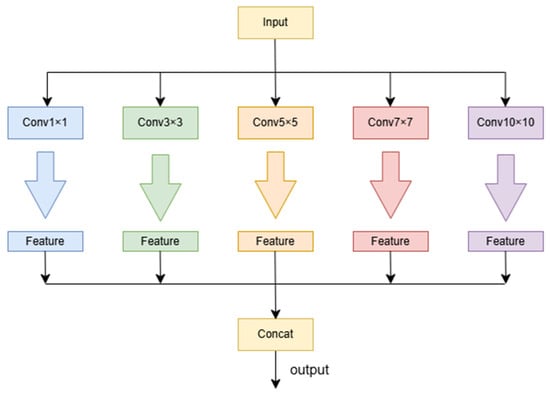
Figure 5.
Overview of local network.
For the other branch of the parallel network composed of the ViT network, data are initially segmented into patches. Assuming the image dimensions are length X and width Y, this decomposition results in small image patches. Each patch is linearly projected into a higher-dimensional space. A special token, added initially to represent the entire image data, follows this high-dimensional projection D and includes the unique spatial position information typical of transformers. After embedding each image module with spatial information, let represent the collection of all image patch embeddings and the class token, where denotes the number of blocks including one class token, and is the embedding dimension. In the model, the position embedding parameter is also learned. The final input sequence is represented as , and denotes the position parameter.
The ViT processes the sequence of encoded image patches using a standard transformer encoder. As shown in Figure 6a, the transformer encoder consists of four components: a Layer Norm network, a Multi-Head Attention mechanism, a Dropout layer, and an MLP block. The Layer Norm network increases the training speed and enhances training stability, Multi-Head Attention focuses on information representations in different subspaces, and Dropout is implemented as DropPath for improved effectiveness in practice. The MLP block, depicted in Figure 6b, includes fully connected layers, a GELU activation function, and Dropout, processing and outputting the results.
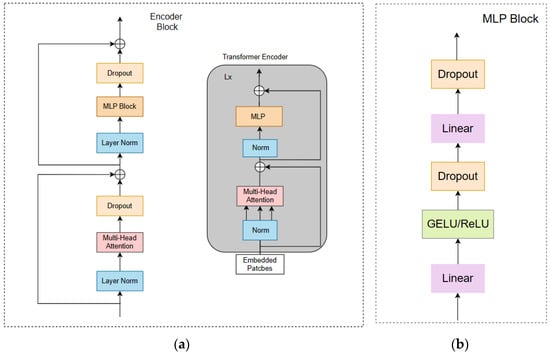
Figure 6.
Overview of global network: (a) encoder block; (b) MLP block.
After processing through a series of transformer encoder layers, the ViT extracts the output corresponding to the class token for the final classification task and fuses it with the local stream features to produce the final fused features. These operations are represented in the paper as “Trans”, providing a feature map .
In the later processing of the module, we effectively fuse local stream features with global stream features to generate new feature maps. Specifically, we first map the input data to create a weight map reflecting the importance of features. We then apply a Sigmoid activation function for the nonlinear processing of this weight map. Next, the processed weight map is element-wise multiplied with the original input data, allowing for targeted enhancement or the suppression of features. We then concatenate these weighted features with the global stream output features along the channel dimension to achieve feature fusion. To ensure the fused features match the dimensions required by subsequent processing modules, we reduce the channel count by half using another projection block, ultimately producing the output feature map of this module.
Figure 3 shows how local flow features and global flow features are fused at the end of this module. Specifically, we modulate using weights generated by , ensuring that the fused features both retain local detail and reflect global structural characteristics. This fusion strategy plays a key role in enhancing the performance of the model. The specific calculations are as follows:
where represents a point-wise convolution followed by batch normalization. It is then multiplied by , and the resulting product is mapped and concatenated with in the channel dimension as:
where is the Hadamard product. Finally, the fused feature is output from the parallel network.
2.3.3. Improved Attention Mechanism
Before performing the Q-transform, we first employ down-sampling techniques to convert the input image feature map from (C, H, W) to (C0, H/2, W/2), where C0 is greater than C. Because the change in resolution might lead to information loss, we introduce a CNN into the original attention structure to compensate for the accuracy loss.
Since the computational complexity of the attention mechanism in transformers increases quadratically with changes in input image resolution, we redesigned the attention mechanism to make the model more lightweight and improve computational efficiency, as shown in the Improved Attention Mechanism Block in Figure 3. Because down-sampling reduces the resolution of the feature map, leading to information loss, we incorporated a CNN to enhance the feature extraction capability.
Specifically, we utilize standard CNN computational groups to process the input. Through depthwise convolutions and GeLU activation functions, the input feature maps are aggregated and spatially normalized. The down-sampling module connects to Q (the supplementary connection to LeViT), while the rest connect directly to the K and V components, forming the output of the attention mechanism. The goal is to enhance feature extraction capability through training while reducing computational overhead. Finally, pointwise convolution is applied to the three components.
Since the attention operation runs on low-resolution (or small-sized) feature maps, the attention computation itself loses its representational capacity. To compensate for this loss, the self-attention mechanism was modified by leveraging CNNs to perform standard computational steps on the attention input, including 3 × 3 (depthwise) convolutions, GeLU activation functions, and batch normalization. Given that values are the basis of the attention output, we applied this computational step to the values to facilitate spatial information aggregation in the input feature map, thereby enhancing the representational capacity while reducing training difficulty. To offset the increased computational cost, we eliminated the independent linear transformations applied to the queries and keys, instead applying the same pointwise convolution to all three components.
The details of the improved attention computation are as follows. Let denote the input to the attention mechanism, where is defined as:
where Linear is a linear transformation with learnable weights and represents pointwise convolution. is defined as:
where d is the number of channels per head in the queries and keys, is a learnable bias, and is an all-ones vector. is defined as:
where represents depthwise convolution followed by GeLU activation and Batch Norm for batch normalization application.
2.3.4. Output Module
The output section employs a combined structure composed of a global average pooling (GAP) network and a linear network. Specifically, the GAP network is used to average all feature maps, and the result is then passed to the linear layer. The structure diagram of the output module is shown in Figure 7.
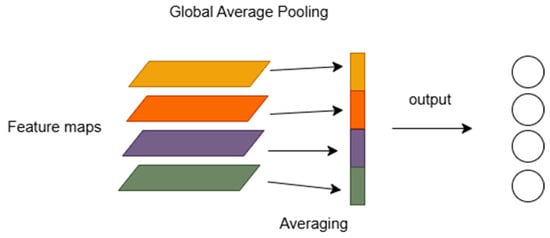
Figure 7.
The structure of the output block.
Owing to the tendency of fully connected layers to cause overfitting, which negatively affects the model’s generalization ability, the GAP network is used as a parameter-free black-box network. By averaging the feature maps for each category, the GAP network significantly reduces the number of parameters compared with the traditional approach of pooling followed by activation layers and fully connected layers. This not only helps prevent network overfitting but also serves as an important measure to reduce the weight of the model.
The Linear layer is a linear function with learnable weights that enhances the model’s expressive power by projecting the input into a higher dimension. The model’s output, , is as follows:
where is the output after the fusion of local and global features.
3. Results
3.1. Evaluation Metrics
The model is evaluated based on classification accuracy, Accuracy (Formula (11)), Recall (Formula (12)), and mean average precision (mAP) (Formula (14)). Recall is the proportion of the number of correctly classified positive samples to the actual positive samples. Precision (Formula (13)) is the proportion of the number of correctly classified positive samples to the total number of predicted positive samples in the classifier. The resulting AP is the area enclosed under the Precision–Recall curve, and the mAP is obtained by calculating the comprehensive weighted average of all categories of AP. The calculation formulas are as follows:
where TP, FP, TN, and FN stand for true positive, false positive, true negative, and false negative, respectively.
3.2. Experimental Environment Parameter Settings
Our experimental setup was as follows: we utilized an RTX3090 GPU and the PyTorch deep learning framework. Detailed configurations are listed in Table 2.

Table 2.
Experimental environment setup.
The dataset was divided as shown in Table 3, which also displays the key parameter settings used when training the model. We allocated 80% of the data for training, 10% for validation, and 10% for testing to evaluate the classification performance of our proposed pest classification recognition model, HCFormer. This division ensures that the test set information is not leaked during the training process and that both the validation and test sets closely match the training set in feature distribution, categories, and proportions. Such an alignment ensures more valid accuracy and loss metrics while helping prevent severe overfitting during model training. Regarding the selection of the learning rate, we adopted the method proposed by Leslie N. Smith [], which assists in identifying the optimal initial learning rate. A low learning rate of 1 × 10⁻⁵ was used to start, updating the network after each batch while increasing the learning rate and recording the loss for each batch. Figure 8 shows the relationship between the learning rate and loss.

Table 3.
Key parameter settings.
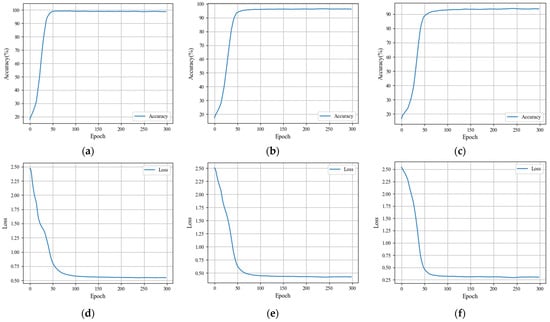
Figure 8.
Accuracy and loss of the HCFormer model: (a) accuracy of training stage; (b) accuracy of test stage; (c) accuracy of verifying stage; (d) loss of training stage; (e) loss of test stage; (f) loss of verifying stage.
Experiments were conducted to validate the accuracy and effectiveness of our proposed model in terms of pest classification recognition. We utilized images from an available dataset on Flickr for training, testing, and verifying the model, which comprised 5500 images split in an 8:1:1 ratio. The model was trained for 300 epochs to assess the training performance. Figure 8 displays the results showing the accuracy curves and the loss curves over the epochs.
Figure 8a,d shows that by epoch 100, both accuracy and loss have largely stabilized, maintaining nearly constant values. This indicates that our model can converge quickly, with the loss approaching zero and the accuracy exceeding 98.7%. Thus, the completed model training demonstrates the superior performance of our proposed model.
The changes in accuracy and loss across epochs during the testing phase are depicted in Figure 8b,e. The accuracy curve initially declines and then promptly rises, stabilizing around epoch 80 and ultimately reaching 98%. Additionally, the loss curve also converges close to zero.
During the verifying stage, as shown in Figure 8c,f, the accuracy curve rapidly rises, stabilizing around epoch 130 and maintaining a value of approximately 98%. The loss curve similarly converges close to zero, indicating successful model performance during verification.
4. Discussion
4.1. Experimental Results and Analysis
Over 5000 images of pests in micro-environments within our dataset were annotated. To better evaluate the model’s generalization ability and robustness, the pest images in the dataset encompass various environments, lighting conditions, categories, single-target and multi-target scenarios, and different backgrounds. Using these images under complex conditions, we assessed the model’s performance in terms of target detection across diverse situations. The detection results are shown in Figure 9 and Figure 10, which present the original pest images and the detected images. The experimental results demonstrate that the proposed model exhibits excellent performance in detecting pests across different backgrounds, lighting conditions, and single-target and multi-target scenarios, highlighting its significant advantages.
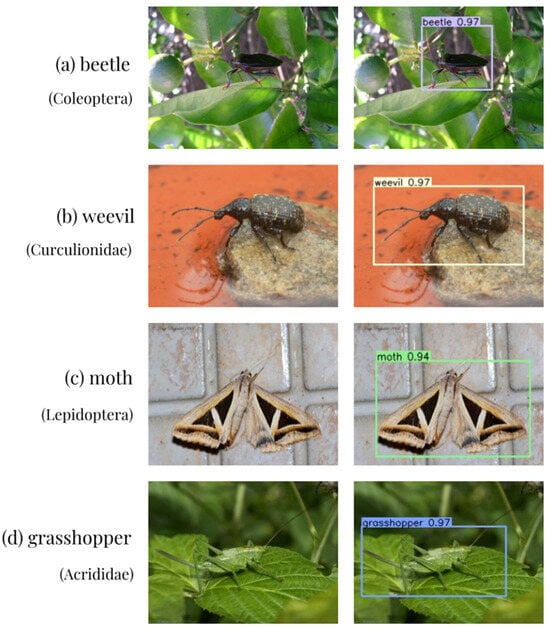
Figure 9.
Detection effect of HCFormer model under single-target situations: (a) beetle (Coleoptera); (b) weevil (Curculionidae); (c) moth (Lepidoptera); (d) grasshopper (Acrididae).
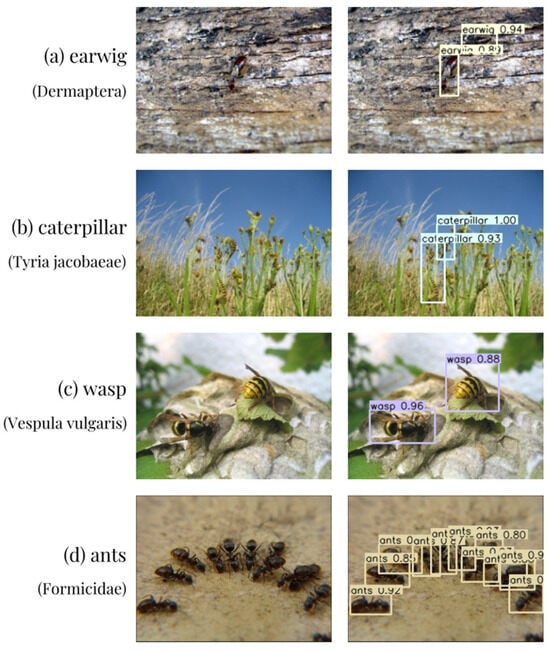
Figure 10.
Detection effect of HCFormer model under multi-target situations: (a) earwig (Dermaptera); (b) caterpillar (Tyria jacobaeae); (c) wasp (Vespula vulgaris); (d) ants (Formicidae).
To validate the effectiveness and superior performance of our model, we conducted tests under the same experimental conditions using the same dataset and compared the performance with several other models. The comparison results are presented in Table 4. These models included CNN-based networks (such as VGGNet, ResNet, and SENet), YOLO-based network models (such as YOLOv5 and YOLOv8), and transformer-based models (such as ViT, MobileViT, and CrossViT).

Table 4.
Comparison of pest classification results across different models.
As can be seen from the results in Table 4, in terms of performance metrics, CNN-type networks generally show relatively poor accuracy, with the VGGNet model displaying the lowest, achieving an accuracy of only 85.60% and an mAP of 77.31%. Following this are two other CNN-based models, ResNet and SENet, with classification accuracies of 87.75% and 90.32%, mAPs of 79.64% and 82.19%, and recall values of 80.60% and 82.33%, respectively. YOLO-type networks slightly outperform CNN-based ones; we compared two YOLO classification networks, YOLOv5 and YOLOv8, which achieved accuracies of 90.67% and 94.62%, mAPs of 82.43% and 87.78%, and recall values of 83.19% and 88.56% respectively. Finally, we compared ViT-type networks, selecting the basic ViT network and its derivatives Mobile ViT and CrossViT, which, respectively, achieved accuracies of 95.03%, 95.57%, and 96.16%; mAPs of 88.09%, 88.33%, and 89.12%; and recall values of 89.11%, 89.37%, and 90.35%. These results indicate that while traditional CNN architectures are limited by their capacity to capture only local features, the integration of transformers in ViT-type networks allows for superior performance through enhanced global feature extraction. YOLO models, although better than pure CNN models, still struggle with certain complex feature representations that ViT derivatives handle more adeptly.
This comparison reveals that the proposed HCFormer achieved the highest accuracy at 98.17% and the best mAP at 90.57%, demonstrating its exceptional ability to classify both local and global features in pest classification tasks. The remarkable performance of HCFormer underscores its effectiveness in leveraging the complementary strengths of convolutional kernels and transformer-based architectures. This is due to the collaborative effect of convolutional kernels of varying sizes and the ViT network, which comprehensively extracts and merges both local and global features. This fusion enables a more complete feature representation, resulting in superior classification accuracy. By integrating these components, HCFormer effectively addresses the limitations of prior models by enhancing feature representation, enabling it to distinguish even the most nuanced pest characteristics in diverse environmental conditions. This fusion not only provides superior classification accuracy but also facilitates robust performance across different datasets, illustrating the model’s adaptability and scalability.
4.2. Ablation Study
For our HCFormer pest detection model, several new improvements were introduced, including the design of global and local feature extraction networks, improvements to the multi-head attention mechanism, and the introduction of down-sampling techniques.
To evaluate the effectiveness of these improvements, we conducted multiple ablation experiments. The experimental setup was as follows: first, we used a single-layer CNN and the original ViT network; second, we removed the local stream module and retained only the ViT; and finally, we replaced the single-layer CNN with multi-CNN and added the original ViT network. The results are presented in Table 5.

Table 5.
Comparison of ablation study results.
In the first setup, the combination of a single-layer CNN with ViT showed limitations in capturing complex features, particularly when compared to the multi-CNN setup, which highlights the need for deeper convolutional layers for more effective feature extraction. The second setup, retaining only the ViT, showed decreased performance, emphasizing the importance of local features for detailed classification. The third setup, incorporating a multi-CNN with ViT, demonstrated improved accuracy and efficiency, showcasing the benefits of multi-scale feature extraction. These experiments confirm that each component significantly contributes to HCFormer’s superior performance, optimizing both accuracy and model efficiency.
These experiments were designed to verify the necessity and effectiveness of the proposed methods. The experimental results show that the HCFormer model achieved an accuracy of 98.17% and a recall value of 91.98%. In terms of performance, the HCFormer achieved an mAP of 90.57%, which is 4.84%, 2.48%, and 1.53% higher than CNN + ViT, ViT, and Multi-CNN + ViT, respectively. The parameter count of HCFormer is 26.5 M, which is a 29.71% reduction compared with the Multi-CNN + ViT model, a reduction of 16.14% compared with the ViT model, and a reduction of 22.74% compared with the CNN + ViT model, significantly reducing resource consumption. This reduction highlights the model’s efficiency in resource utilization, enabling its application in environments with limited computational capacity, without compromising on detection performance. Under the same hardware conditions, the real-time performance of the model was greatly improved. The enhanced processing speed demonstrates HCFormer’s capability to rapidly detect pests in dynamic and resource-constrained settings, making it highly suitable for practical agricultural applications. Overall, our improvements successfully balanced accuracy and speed while meeting the requirements for lightweight and high-precision pest detection. This balance is crucial for the practical deployment of pest detection systems, where both accuracy and efficiency are essential for timely and effective pest management.
5. Conclusions
This study proposes a lightweight pest object detection model, HCFormer, designed to effectively detect pests in complex environments while achieving a high detection accuracy with minimal resource consumption. The experimental results indicate that the model exhibits excellent practicality and detection accuracy as follows:
- To address the issues of insufficient detection accuracy, local receptive fields, and global receptive fields in current pest detection networks operating in complex environments, we propose a parallel feature extraction architecture that combines a multi-scale CNN and optimized ViT networks. This architecture extracts and integrates both the local and global features of images, enhancing the detection performance. Further, the backbone model employs a pyramid structure, which not only accelerates the computational speed of the model but also improves its robustness. This provides a new approach to pest object detection with strong practicality, it can be applied in agriculture through automated monitoring systems [], intelligent spraying, drone surveillance [], and farm management platforms [], improving detection accuracy, reducing pesticide use, and increasing crop yield and quality;
- We redesigned the attention mechanism in the transformer and proposed a new attention mechanism network to address the issue of local feature accuracy loss when the input resolution is reduced in the pyramid structure. Additionally, we introduced down-sampling methods to reduce the model’s weight while maintaining accuracy, significantly reducing the number of parameters in the network and improving the model’s speed;
- We trained our model on a dataset obtained from Flickr and tested it against other mainstream object detection models. In both single-target and multi-target scenarios across different environments, our model exhibited excellent performance. The experimental results show that the HCFormer model achieved an accuracy of 98.17%, a recall rate of 91.98%, and an mAP of 90.57%, effectively meeting the requirements for lightweight and high-precision pest detection. The pest detection network, based on a hybrid of a multi-scale CNN and ViT networks, can efficiently complete pest detection tasks in complex environments, quickly and accurately extracting features of pest images. Therefore, our model holds significant research importance and practical value in the field of pest detection.
In the future, to facilitate the application of the proposed method for agricultural pest control, there are several tasks that remain to be accomplished. The HCFormer introduced in this paper is an integrated network with a large parameter count, posing significant challenges for model deployment. Simplifying and reducing the model’s complexity is crucial to enhancing its real-time processing capabilities, facilitating its integration into mobile agricultural platforms such as unmanned aerial vehicles and automated rovers, which can make our model easier to apply for local farmers. Further, from an application perspective, the model’s generalization ability across various complex environments is crucial. There will be an urgent need in the future to construct larger-scale datasets encompassing a wider range of pest species and diverse environmental conditions in different regions. The aforementioned features can effectively reduce the application costs of the model and enhance its versatility, with significant implications for local farmers in terms of increasing their yield and return on investment.
Author Contributions
Conceptualization, M.Z. and J.X.; formal analysis, M.Z.; investigation, M.Z., S.C., H.L. and J.X.; methodology, M.Z.; project administration, H.L., W.W. and J.X.; resources, M.Z., S.C., H.L. and J.X.; software, M.Z.; supervision, H.L., W.W. and J.X.; validation, M.Z.; visualization, M.Z. and S.C.; writing—original draft, M.Z.; writing—review and editing, M.Z., S.C., H.L., W.W. and J.X. All authors have read and agreed to the published version of the manuscript.
Funding
This research was funded by the China Agriculture Research System of MOF and MARA, China (No. CARS-32-11). It was also partly supported by the Key-Area Research and Development Program of Guangdong Province (No. 2023B0202090001); the Guangdong Provincial Special Fund for Modern Agriculture Industry Technology Innovation Teams, China (No. 2023KJ108); and the Guangdong Science and Technology Innovation Cultivation Special Fund Project for College Students (“Climbing Program” Special Fund), China (No. pdjh2023a0074).
Data Availability Statement
The data presented in this study are available upon request from the corresponding author.
Acknowledgments
The authors would like to thank the anonymous reviewers for their critical comments and suggestions for improving the manuscript.
Conflicts of Interest
The authors declare no conflicts of interest.
References
- Lee, S.; Yun, C.M. A Deep Learning Model for Predicting Risks of Crop Pests and Diseases from Sequential Environmental Data. Plant Methods 2023, 19, 145. [Google Scholar] [CrossRef] [PubMed]
- Domingues, T.; Brandão, T.; Ferreira, J.C. Machine Learning for Detection and Prediction of Crop Diseases and Pests: A Comprehensive Survey. Agriculture 2022, 12, 1350. [Google Scholar] [CrossRef]
- FAOSTAT. Available online: https://www.fao.org/faostat/en/#data/RP/visualize (accessed on 11 May 2024).
- Khan, B.A.; Nadeem, M.A.; Nawaz, H.; Amin, M.M.; Abbasi, G.H.; Nadeem, M.; Ali, M.; Ameen, M.; Javaid, M.M.; Maqbool, R.; et al. Pesticides: Impacts on Agriculture Productivity, Environment, and Management Strategies. In Emerging Contaminants and Plants: Interactions, Adaptations and Remediation Technologies; Aftab, T., Ed.; Springer International Publishing: Cham, Switzerland, 2023; pp. 109–134. ISBN 978-3-031-22269-6. [Google Scholar]
- Deutsch, C.A.; Tewksbury, J.J.; Tigchelaar, M.; Battisti, D.S.; Merrill, S.C.; Huey, R.B.; Naylor, R.L. Increase in Crop Losses to Insect Pests in a Warming Climate. Science 2018, 361, 916–919. [Google Scholar] [CrossRef]
- Yang, B.; Zhang, Z.; Yang, C.-Q.; Wang, Y.; Orr, M.C.; Wang, H.; Zhang, A.-B. Identification of Species by Combining Molecular and Morphological Data Using Convolutional Neural Networks. Syst. Biol. 2022, 71, 690–705. [Google Scholar] [CrossRef] [PubMed]
- Almeida-Silva, D.; Vera Candioti, F. Shape Evolution in Two Acts: Morphological Diversity of Larval and Adult Neoaustraranan Frogs. Animals 2024, 14, 1406. [Google Scholar] [CrossRef]
- Hu, Z.; Xiang, Y.; Li, Y.; Long, Z.; Liu, A.; Dai, X.; Lei, X.; Tang, Z. Research on Identification Technology of Field Pests with Protective Color Characteristics. Appl. Sci. 2022, 12, 3810. [Google Scholar] [CrossRef]
- Xiao, Z.; Yin, K.; Geng, L.; Wu, J.; Zhang, F.; Liu, Y. Pest Identification via Hyperspectral Image and Deep Learning. Signal Image Video Process. 2022, 16, 873–880. [Google Scholar] [CrossRef]
- Ai, Y.; Sun, C.; Tie, J.; Cai, X. Research on Recognition Model of Crop Diseases and Insect Pests Based on Deep Learning in Harsh Environments. IEEE Access 2020, 8, 171686–171693. [Google Scholar] [CrossRef]
- Jafar, A.; Bibi, N.; Naqvi, R.A.; Sadeghi-Niaraki, A.; Jeong, D. Revolutionizing Agriculture with Artificial Intelligence: Plant Disease Detection Methods, Applications, and Their Limitations. Front. Plant Sci. 2024, 15, 1356260. [Google Scholar] [CrossRef]
- Ngugi, L.C.; Abelwahab, M.; Abo-Zahhad, M. Recent Advances in Image Processing Techniques for Automated Leaf Pest and Disease Recognition—A Review. Inf. Process. Agric. 2021, 8, 27–51. [Google Scholar] [CrossRef]
- Liu, J.; Wang, X. Plant Diseases and Pests Detection Based on Deep Learning: A Review. Plant Methods 2021, 17, 22. [Google Scholar] [CrossRef] [PubMed]
- Cai, G.; Qian, J.; Song, T.; Zhang, Q.; Liu, B. A Deep Learning-Based Algorithm for Crop Disease Identification Positioning Using Computer Vision. Int. J. Comput. Sci. Inf. Technol. 2023, 1, 85–92. [Google Scholar] [CrossRef]
- Preti, M.; Verheggen, F.; Angeli, S. Insect Pest Monitoring with Camera-Equipped Traps: Strengths and Limitations. J. Pest Sci. 2021, 94, 203–217. [Google Scholar] [CrossRef]
- Fu, X.; Ma, Q.; Yang, F.; Zhang, C.; Zhao, X.; Chang, F.; Han, L. Crop Pest Image Recognition Based on the Improved ViT Method. Inf. Process. Agric. 2024, 11, 249–259. [Google Scholar] [CrossRef]
- Malek, M.A.; Reya, S.S.; Hasan, M.Z.; Hossain, S. A Crop Pest Classification Model Using Deep Learning Techniques. In Proceedings of the 2021 2nd International Conference on Robotics, Electrical and Signal Processing Techniques (ICREST), Dhaka, Bangladesh, 5–7 January 2021; pp. 367–371. [Google Scholar]
- Rajalakshmi, D.D.; Monishkumar, V.; Balasainarayana, S.; Prasad, M.S.R. Deep Learning Based Multi Class Wild Pest Identification and Solving Approach Using Cnn. Ann. Rom. Soc. Cell Biol. 2021, 25, 16439–16450. [Google Scholar]
- Wang, S.; Zeng, Q.; Ni, W.; Cheng, C.; Wang, Y. ODP-Transformer: Interpretation of Pest Classification Results Using Image Caption Generation Techniques. Comput. Electron. Agric. 2023, 209, 107863. [Google Scholar] [CrossRef]
- Zhan, B.; Li, M.; Luo, W.; Li, P.; Li, X.; Zhang, H. Study on the Tea Pest Classification Model Using a Convolutional and Embedded Iterative Region of Interest Encoding Transformer. Biology 2023, 12, 1017. [Google Scholar] [CrossRef]
- Kalaydjian, C.T. An Application of Vision Transformer(ViT) for Image-Based Plant Disease Classification; UCLA: Los Angeles, CA, USA, 2023. [Google Scholar]
- Remya, S.; Anjali, T.; Abhishek, S.; Ramasubbareddy, S.; Cho, Y. The Power of Vision Transformers and Acoustic Sensors for Cotton Pest Detection. IEEE Open J. Comput. Soc. 2024, 5, 356–367. [Google Scholar] [CrossRef]
- Li, G.; Wang, Y.; Zhao, Q.; Yuan, P.; Chang, B. PMVT: A Lightweight Vision Transformer for Plant Disease Identification on Mobile Devices. Front. Plant Sci. 2023, 14, 1256773. [Google Scholar] [CrossRef]
- Ye, R.; Gao, Q.; Qian, Y.; Sun, J.; Li, T. Improved YOLOv8 and SAHI Model for the Collaborative Detection of Small Targets at the Micro Scale: A Case Study of Pest Detection in Tea. Agronomy 2024, 14, 1034. [Google Scholar] [CrossRef]
- Tian, Y.; Wang, S.; Li, E.; Yang, G.; Liang, Z.; Tan, M. MD-YOLO: Multi-Scale Dense YOLO for Small Target Pest Detection. Comput. Electron. Agric. 2023, 213, 108233. [Google Scholar] [CrossRef]
- Wang, F.; Wang, R.; Xie, C.; Zhang, J.; Li, R.; Liu, L. Convolutional Neural Network Based Automatic Pest Monitoring System Using Hand-Held Mobile Image Analysis towards Non-Site-Specific Wild Environment. Comput. Electron. Agric. 2021, 187, 106268. [Google Scholar] [CrossRef]
- Kang, C.; Jiao, L.; Wang, R.; Liu, Z.; Du, J.; Hu, H. Attention-Based Multiscale Feature Pyramid Network for Corn Pest Detection under Wild Environment. Insects 2022, 13, 978. [Google Scholar] [CrossRef]
- Larios, N.; Deng, H.; Zhang, W.; Sarpola, M.; Yuen, J.; Paasch, R.; Moldenke, A.; Lytle, D.A.; Correa, S.R.; Mortensen, E.N.; et al. Automated Insect Identification through Concatenated Histograms of Local Appearance Features: Feature Vector Generation and Region Detection for Deformable Objects. Mach. Vis. Appl. 2008, 19, 105–123. [Google Scholar] [CrossRef]
- Heo, G.; Klette, R.; Woo, Y.W.; Kim, K.-B.; Kim, N.H. Fuzzy Support Vector Machine with a Fuzzy Nearest Neighbor Classifier for Insect Footprint Classification. In Proceedings of the International Conference on Fuzzy Systems, Barcelona, Spain, 18–23 July 2010; pp. 1–6. [Google Scholar]
- Nanni, L.; Manfè, A.; Maguolo, G.; Lumini, A.; Brahnam, S. High Performing Ensemble of Convolutional Neural Networks for Insect Pest Image Detection. Ecol. Inform. 2022, 67, 101515. [Google Scholar] [CrossRef]
- Kuzuhara, H.; Takimoto, H.; Sato, Y.; Kanagawa, A. Insect Pest Detection and Identification Method Based on Deep Learning for Realizing a Pest Control System. In Proceedings of the 2020 59th Annual Conference of the Society of Instrument and Control Engineers of Japan (SICE), Chiang Mai, Thailand, 23–26 September 2020; pp. 709–714. [Google Scholar]
- Patel, D.; Bhatt, N. Improved Accuracy of Pest Detection Using Augmentation Approach with Faster R-CNN. IOP Conf. Ser. Mater. Sci. Eng. 2021, 1042, 012020. [Google Scholar] [CrossRef]
- Venkatasaichandrakanth, P.; Iyapparaja, M. GNViT—An Enhanced Image-Based Groundnut Pest Classification Using Vision Transformer (ViT) Model. PLoS ONE 2024, 19, e0301174. [Google Scholar] [CrossRef]
- Zhang, L.; Du, J.; Wang, R. FE-VIT: A Faster and Extensible Vision Transformer Based on Self Pre-Training for Pest Recognition. In Proceedings of the International Conference on Agri-Photonics and Smart Agricultural Sensing Technologies (ICASAST 2022), Zhengzhou, China, 18 October 2022; SPIE: Bellingham, WA, USA, 2022; Volume 12349, pp. 35–42. [Google Scholar]
- Gulzar, Y.; Ünal, Z.; Ayoub, S.; Reegu, F.A.; Altulihan, A. Adaptability of Deep Learning: Datasets and Strategies in Fruit Classification. BIO Web Conf. 2024, 85, 01020. [Google Scholar] [CrossRef]
- Alkanan, M.; Gulzar, Y. Enhanced Corn Seed Disease Classification: Leveraging MobileNetV2 with Feature Augmentation and Transfer Learning. Front. Appl. Math. Stat. 2024, 9, 1320177. [Google Scholar] [CrossRef]
- Agarwal, N.; Kalita, T.; Dubey, A.K. Classification of Insect Pest Species Using CNN Based Models. In Proceedings of the 2023 International Conference on Computational Intelligence and Sustainable Engineering Solutions (CISES), Greater Noida, India, 28–30 April 2023; pp. 862–866. [Google Scholar]
- Zhang, L.; Yin, L.; Liu, L.; Zhuo, R.; Zhuo, Y. Forestry Pests Identification and Classification Based on Improved YOLO V5s. In Proceedings of the 2021 International Conference on Electronic Information Engineering and Computer Science (EIECS), Changchun, China, 23–26 September 2021; pp. 670–673. [Google Scholar]
- Song, Y.; Duan, X.; Ren, Y.; Xu, J.; Luo, L.; Li, D. Identification of the Agricultural Pests Based on Deep Learning Models. In Proceedings of the 2019 International Conference on Machine Learning, Big Data and Business Intelligence (MLBDBI), Taiyuan, China, 8–10 November 2019; pp. 195–198. [Google Scholar]
- Ullah, N.; Khan, J.A.; Alharbi, L.A.; Raza, A.; Khan, W.; Ahmad, I. An Efficient Approach for Crops Pests Recognition and Classification Based on Novel DeepPestNet Deep Learning Model. IEEE Access 2022, 10, 73019–73032. [Google Scholar] [CrossRef]
- Patole, S.S. Review on Beetles (Coleopteran): An Agricultural Major Crop Pests of the World. Int. J. Life-Sci. Sci. Res. 2017, 3, 1424–1432. [Google Scholar] [CrossRef]
- Szwejda, J.H. Butterfly Pests (Lepidoptera) Occurring on Vegetable Crops in Poland. J. Hortic. Res. 2022, 30, 67–86. [Google Scholar] [CrossRef]
- Das, P.P.G.; Bhattacharyya, B.; Bhagawati, S.; Devi, E.B.; Manpoong, N.S.; Bhairavi, K.S. Slug: An Emerging Menace in Agriculture: A Review. J. Entomol. Zool. Stud. 2020, 8, 1–6. [Google Scholar]
- Smith, L.N. Cyclical Learning Rates for Training Neural Networks. In Proceedings of the 2017 IEEE Winter Conference on Applications of Computer Vision (WACV), Santa Rosa, CA, USA, 24–31 March 2017; pp. 464–472. [Google Scholar]
- Simonyan, K.; Zisserman, A. Very Deep Convolutional Networks for Large-Scale Image Recognition. arXiv 2014, arXiv:1409.1556. [Google Scholar]
- He, K.; Zhang, X.; Ren, S.; Sun, J. Deep Residual Learning for Image Recognition. In Proceedings of the 2016 IEEE Conference on Computer Vision and Pattern Recognition (CVPR), Las Vegas, NV, USA, 27–30 June 2016; pp. 770–778. [Google Scholar]
- Hu, J.; Shen, L.; Sun, G. Squeeze-and-Excitation Networks. In Proceedings of the 2018 IEEE/CVF Conference on Computer Vision and Pattern Recognition, Salt Lake City, UT, USA, 18–23 June 2018; pp. 7132–7141. [Google Scholar]
- Jocher, G.; Chaurasia, A.; Stoken, A.; Borovec, J.; Kwon, Y.; Michael, K.; Fang, J.; Yifu, Z.; Wong, C.; Montes, D.; et al. Ultralytics/Yolov5: V7.0—YOLOv5 SOTA Realtime Instance Segmentation. Zenodo 2022. Available online: https://zenodo.org/records/7347926 (accessed on 11 May 2024).
- Ultralytics YOLOv8. Available online: https://docs.ultralytics.com/models/yolov8 (accessed on 11 May 2024).
- Dosovitskiy, A.; Beyer, L.; Kolesnikov, A.; Weissenborn, D.; Zhai, X.; Unterthiner, T.; Dehghani, M.; Minderer, M.; Heigold, G.; Gelly, S.; et al. An Image Is Worth 16 × 16 Words: Transformers for Image Recognition at Scale. arXiv 2020, arXiv:2010.11929. [Google Scholar]
- Mehta, S.; Rastegari, M. MobileViT: Light-Weight, General-Purpose, and Mobile-Friendly Vision Transformer. arXiv 2021, arXiv:2110.02178. [Google Scholar]
- Chen, C.-F.R.; Fan, Q.; Panda, R. CrossViT: Cross-Attention Multi-Scale Vision Transformer for Image Classification. In Proceedings of the 2021 IEEE/CVF International Conference on Computer Vision (ICCV), Montreal, QC, Canada, 11–17 October 2021; pp. 347–356. [Google Scholar]
- Sciarretta, A.; Calabrese, P. Development of Automated Devices for the Monitoring of Insect Pests. Curr. Agric. Res. J. 2019, 7, 19–25. [Google Scholar] [CrossRef]
- Chen, C.-J.; Huang, Y.-Y.; Li, Y.-S.; Chen, Y.-C.; Chang, C.-Y.; Huang, Y.-M. Identification of Fruit Tree Pests with Deep Learning on Embedded Drone to Achieve Accurate Pesticide Spraying. IEEE Access 2021, 9, 21986–21997. [Google Scholar] [CrossRef]
- Awuor, F.; Otanga, S.; Kimeli, V.; Rambim, D.; Abuya, T. E-Pest Surveillance: Large Scale Crop Pest Surveillance and Control. In Proceedings of the 2019 IST-Africa Week Conference (IST-Africa), Nairobi, Kenya, 8–10 May 2019; pp. 1–8. [Google Scholar]
Disclaimer/Publisher’s Note: The statements, opinions and data contained in all publications are solely those of the individual author(s) and contributor(s) and not of MDPI and/or the editor(s). MDPI and/or the editor(s) disclaim responsibility for any injury to people or property resulting from any ideas, methods, instructions or products referred to in the content. |
© 2024 by the authors. Licensee MDPI, Basel, Switzerland. This article is an open access article distributed under the terms and conditions of the Creative Commons Attribution (CC BY) license (https://creativecommons.org/licenses/by/4.0/).