Article

Automated Assessment of Wheat Leaf Disease Spore Concentration Using a Smart Microscopy Scanning System

by
Olga V. Doroshenko
1,2,*,
Mikhail V. Golub
2,
Oksana Yu. Kremneva
1,
Pavel S. Shcherban’
1,2,
Andrey S. Peklich
2,
Roman Yu. Danilov
1,
Ksenia E. Gasiyan
1,
Artem V. Ponomarev
1,
Ilya N. Lagutin
2,
Ilya A. Moroz
3 and
Victor K. Postovoy
2
1
Federal Research Centre of Biological Plant Protection, Krasnodar 350000, Russia
2
Institute for Mathematics, Mechanics and Informatics, Kuban State University, Krasnodar 350040, Russia
3
Membrane Institute, Kuban State University, Krasnodar 350040, Russia
*
Author to whom correspondence should be addressed.
Agronomy 2024, 14(9), 1945; https://doi.org/10.3390/agronomy14091945
Submission received: 26 July 2024 / Revised: 13 August 2024 / Accepted: 26 August 2024 / Published: 28 August 2024
(This article belongs to the Special Issue The Applications of Deep Learning in Smart Agriculture)

Abstract

:
An advanced approach to the automated assessment of a microscopic slide containing spores is presented. The objective is to develop an intelligent system for the rapid and precise estimation of phytopathogenic spore concentration on microscopic slides, thereby enabling automated processing. The smart microscopy scanning system comprises an electronic microscope, a coordinate table, and software for the control of the coordinate table and image processing. The developed smart microscopy scanning system processes the entire microscope slide with multiple exposed strips, which are automatically determined based on the novel two-stage algorithm. The analysis of trained convolutional neural networks employed for the detection of spore phytopathogens demonstrates high precision and recall metrics. The system is capable of identifying and counting the number of spores of phytopathogenic fungi species Blumeria graminis, Puccinia striiformis, and Pyrenophora tritici-repentis on each exposed strip. A methodology for estimating the spore distribution on a microscopic slide is proposed, which involves calculating the average spore concentration density.

1. Introduction

The rapid growth of the world’s population continues to pose a challenge to food security. This problem is intensified by the inability to expand arable land, even though most of the world’s food supply comes from crop production. An important part of food security involves the protection of crops against disease to increase yields. Wheat is among the most important food crops in the world since cereal crops occupy the largest sown areas among all agricultural crops. Leaf diseases caused by fungal pathogens significantly reduce wheat yields and may be responsible for 15–20% of losses [1,2]. Moreover, wheat yield losses in South Russia reached 30–40% when conditions were favorable for fungal pathogens [3,4]. These are significant additional losses since the Russian Federation is the third-largest producer and the first-largest exporter of wheat in the last decade (www.fao.org, accessed on 12 June 2024).
Early detection and precise identification of diseases are crucial challenges in wheat protection. The traditional method of disease detection and identification based on visual inspection is often not reliable enough and could lead to a significant decrease in agricultural production since the corresponding procedure cannot guarantee the required estimation accuracy. Moreover, it is also quite labor-intensive and demands intensive academic phytopathological training for farmers or agronomists. Thus, the implementation of artificial intelligence in agriculture automation is now being widely addressed [5,6].
The effective monitoring of plant diseases can be achieved through the utilization of specially designed devices. A variety of optical sensors are employed in fieldwork to collect data for the early detection of alteration in plant physiology, such as multispectral and hyperspectral reflectance sensors [7,8], thermal sensors [9], and other types of sensors detailed in [10]. Nevertheless, it is preferable to identify infectious diseases at the earliest possible stage, prior to the emergence of visible symptoms. One of the most promising areas of phytosanitary monitoring involves the use of samplers for the detection of pathogen spores in the atmosphere [11]. The combination of this technology with novel diagnostics methodologies will facilitate a more expeditious and precise quantitative evaluation of airborne infection. The results may be further interpreted, particularly to detect primary inoculum thresholds, in order to predict disease development and, thereby, enhance the efficiency of crop protection.
So far, a variety of sampler designs have been proposed, including volumetric samplers based on suction, passive samplers relying on passive deposition [11,12], and microfluidic devices featuring low-pressure collection chambers [13]. On the other hand, various methods are being developed to analyze the collected samples and to identify and quantify collected biological particles: immunological methods (e.g., ELISA), DNA-based diagnostics (e.g., PCR, TwistDX, and LAMP) and biosensors [12,14]. Among the various techniques employed for the analysis of spore samples, light microscopy is a widely used method, facilitating the identification of spore species and the enumeration of the detected pathogen spores [15,16,17]. The extensive utilization of light microscopy can be attributed to its cost-effectiveness when compared to alternative methodologies. Given that the number of spores collected by samplers can exceed 1000 per sample, identifying and counting these numerous phytopathogenic spores is a meticulous and time-consuming process that requires the expertise of trained experts. Therefore, it is necessary to develop cost-effective and precise automated techniques that combine rapid sample processing with high-throughput identification of spore species.
The advent of sophisticated digital image processing technologies has given rise to the development of novel algorithms for the automatic detection and counting of spores. Some existing methods employ a series of image processing techniques for the automatic identification of objects in microscopic images of slides [16,18,19]. In some instances, the extracted geometric features are employed to build object classifiers in images using machine learning methods [20,21,22]. The advancement of deep learning techniques, particularly convolutional neural networks (CNNs) in computer vision, enables the automatic extraction of object features for the detection of diverse objects within images [17,23,24,25,26,27]. It is important to note that the majority of the studies mentioned above were conducted in laboratory settings. In contrast, using data collected under natural conditions, where images contain multiple fungal spores and other microparticles, results in complex backgrounds. This complexity invariably degrades the recognition quality of the target spores.
An advanced approach to the automatic evaluation of microscopic slides with a variety of spore types on a complex background is proposed in the present paper. The developed smart microscopy scanning system is based on the employment of an X-Y coordinate table for slide movement and convolutional neural networks (CNNs) for spore detection. The main objective of this study is to develop a universal approach to estimating the level of spore concentration on microscopic slides. The main novelty of the paper is the proposed two-stage algorithm for the automatic scanning of microscopic slides obtained from spore-trapping devices and estimating spore concentration. Moreover, we propose a methodology for calculating a universal measure of spore concentration, namely, a spore concentration density instead of calculating the number of spores. The efficacy of this methodology has been validated through experimentation with various exposure times. To the best of our knowledge, this study is the first to propose such a methodology.
To implement the intelligent system, namely, a smart microscopy scanning system, for the rapid and precise detection of spores, thereby enabling the automated processing of microscopic slides several stages have been passed. Initially, microscopic slides were exposed in a spore trapping device (as described in Section 2.1) to create a data collection of images of several kinds of airborne spores (dataset) as described in Section 2.3.1. Next, a smart device and the corresponding software based on a novel two-stage algorithm for scanning microscopic slides was developed, see Section 2.2. The developed smart microscopy scanning system is to automatically process the entire microscope slide with multiple exposed strips that are automatically determined, and then identify and count the number of spores in each exposed strip. Accordingly, two CNNs were trained on the prepared dataset to enable their application for spore detection in micrographs. The selected CNNs, which have proven highly effective in object detection, are YOLOv8 and RT-DETR. The accuracy of these CNNs and the proposed algorithm for spore detection is demonstrated in Section 3. Finally, the average spore concentration density for various exposure times is investigated.

2. Materials and Methods

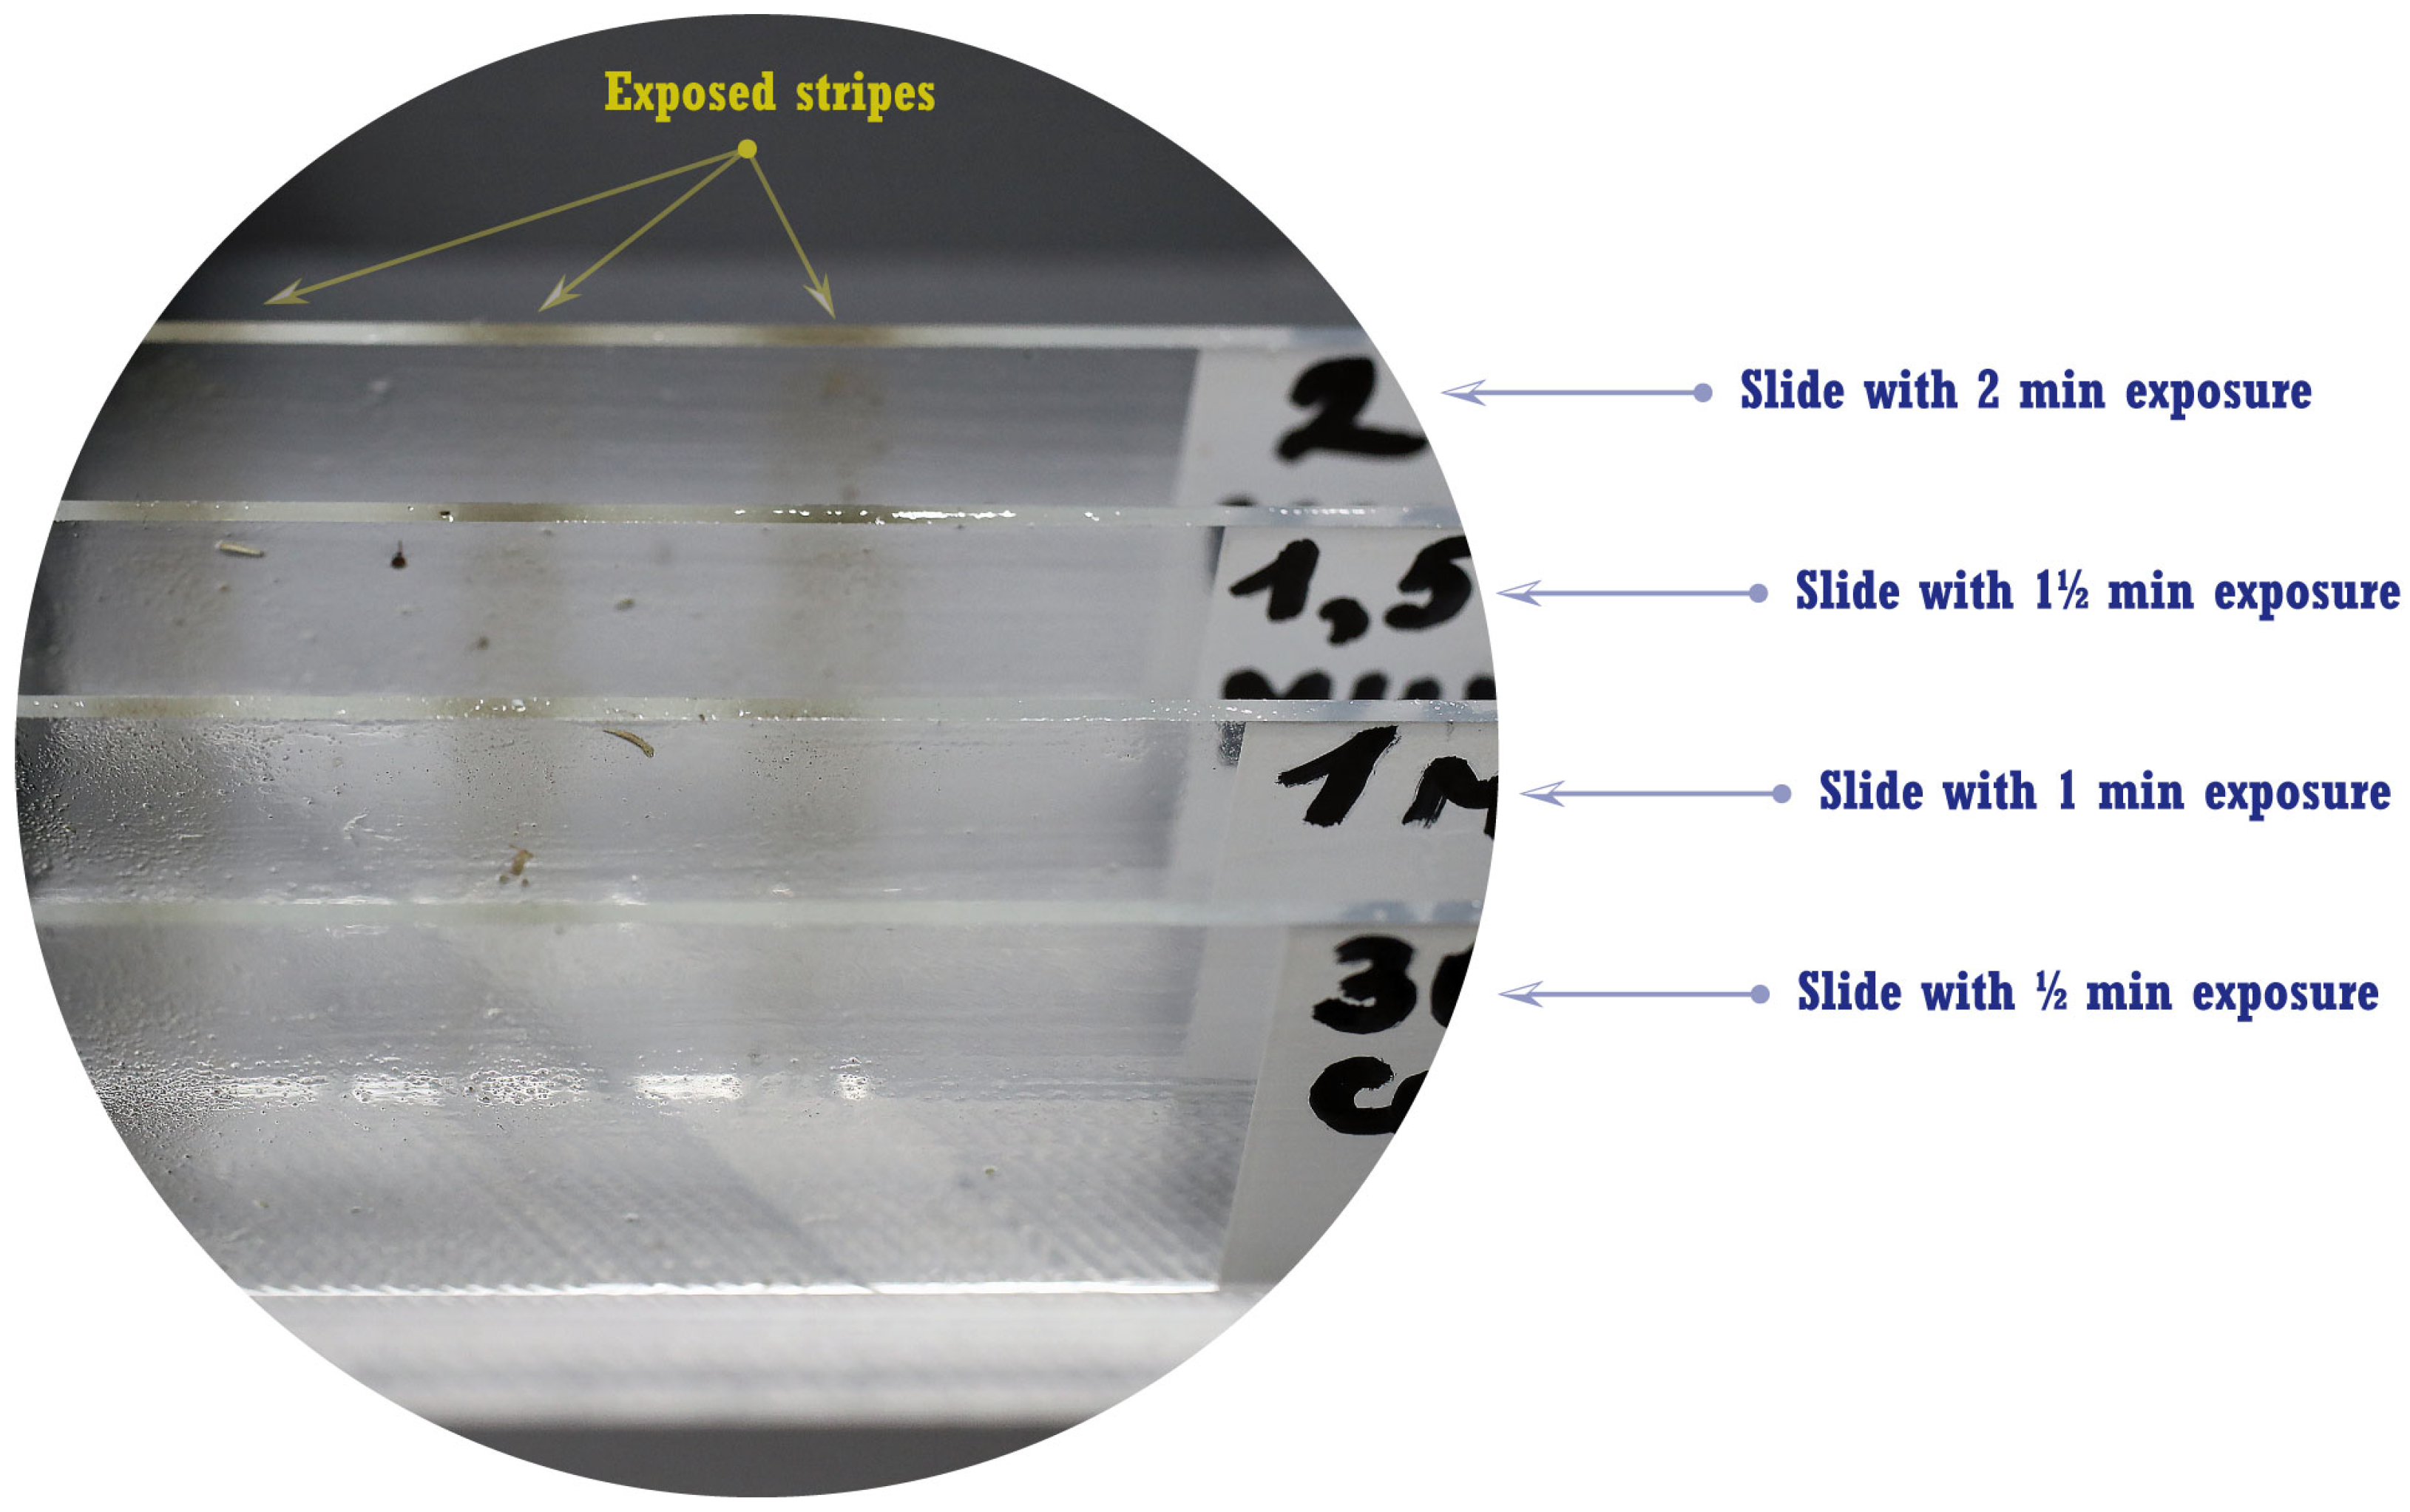
2.1. Airborne Spore Collection

The spores of pathogens responsible for leaf disease in wheat were obtained under field conditions using a device for the detection of plant diseases developed at the Federal Research Centre of Biological Plant Protection (Krasnodar, Russian Federation) [28]. A dataset comprising airborne spores of fungal pathogens was collected in 2022–2023 from experimental fields of the Laboratory of Phytosanitary Monitoring of Agroecosystems. The present study focuses on the examination of spores associated with fungal diseases of wheat (Triticum L.). During the experiment, various types of winter soft wheat (Triticum aestivum L.) with varying degrees of sensitivity to pathogens were examined for the collection of phytopathogen spores. The following spores of leaf diseases of wheat are the subjects of this study: Blumeria graminis, Puccinia striiformis, and Pyrenophora tritici-repentis [29]. Examples of wheat leaves affected by the above-mentioned wheat pathogens are depicted in Figure 1.
In order to ensure the identification of all target pathogens, winter wheat varieties characterized by different levels of resistance to leaf diseases were selected for the study. Furthermore, an artificial infectious background of intended leaf diseases was created in the plots to provide a sufficient quantity of infectious material for the establishment of a database of spore images. Collection, isolation, and multiplication of infectious material from pathogens were conducted in order to inoculate the test plots with winter wheat plants. In the case of Puccinia striiformis, an experimental procedure was conducted in a greenhouse setting. This involved the repeated infection of plants cultivated in hydroponics, followed by the collection of urediniospores [3]. Tan spot pathogens were isolated and propagated on a nutrient medium in a clean box [30]. The artificial background of infestation at the experimental fields was established in the second half of April, when conditions conducive to inoculation occurred, such as an air temperature above 16   C and the presence of dew on plant leaves.
The spore-trapping device was employed for the purpose of air sampling containing spores of pathogens responsible for wheat leaf diseases [28]. The device is an impactor that uses a standard microscope slide coated with Vaseline as a retention compound to precipitate contaminants from the air.
Sampling was carried out during May and June, representing the period of peak disease development and diversity in wheat crops, spanning the transition from the flag leaf stage (Z 47) to flowering (Z 61–69). During the sampling process, the device was lowered on a belt so that the slot nozzle (narrow nozzle) was positioned at a height 8–10 cm below the tops of the plants. Subsequently, the device was operated for a period of time following its activation, oscillating at an amplitude of 15–20 cm, which facilitates the shaking of spores from the leaves and their entrainment into the aspiration zone of the device. Samples were obtained at ten points along the diagonal of each plot so that there were 10 samples on each slide as rectangular imprints of 100 mm   2 .
To investigate the influence of the exposure time, four slides with exposure time periods of 1, 1.5, and 2 min have been prepared for analysis (see Figure 2). The slides were prepared with three stripes exposed in the same area of the agrocenosis to ensure consistency in the level of wheat decline. The exposure locations were positioned two meters apart to facilitate the uniform distribution of spores [29].

2.2. Smart Microscopy Scanning System

The smart microscopy scanning system should calculate the number of spores r per a certain area, e.g., per 1 mm   2 , for each exposed stripe. In this section, the design and the processing algorithm providing the corresponding values are described.

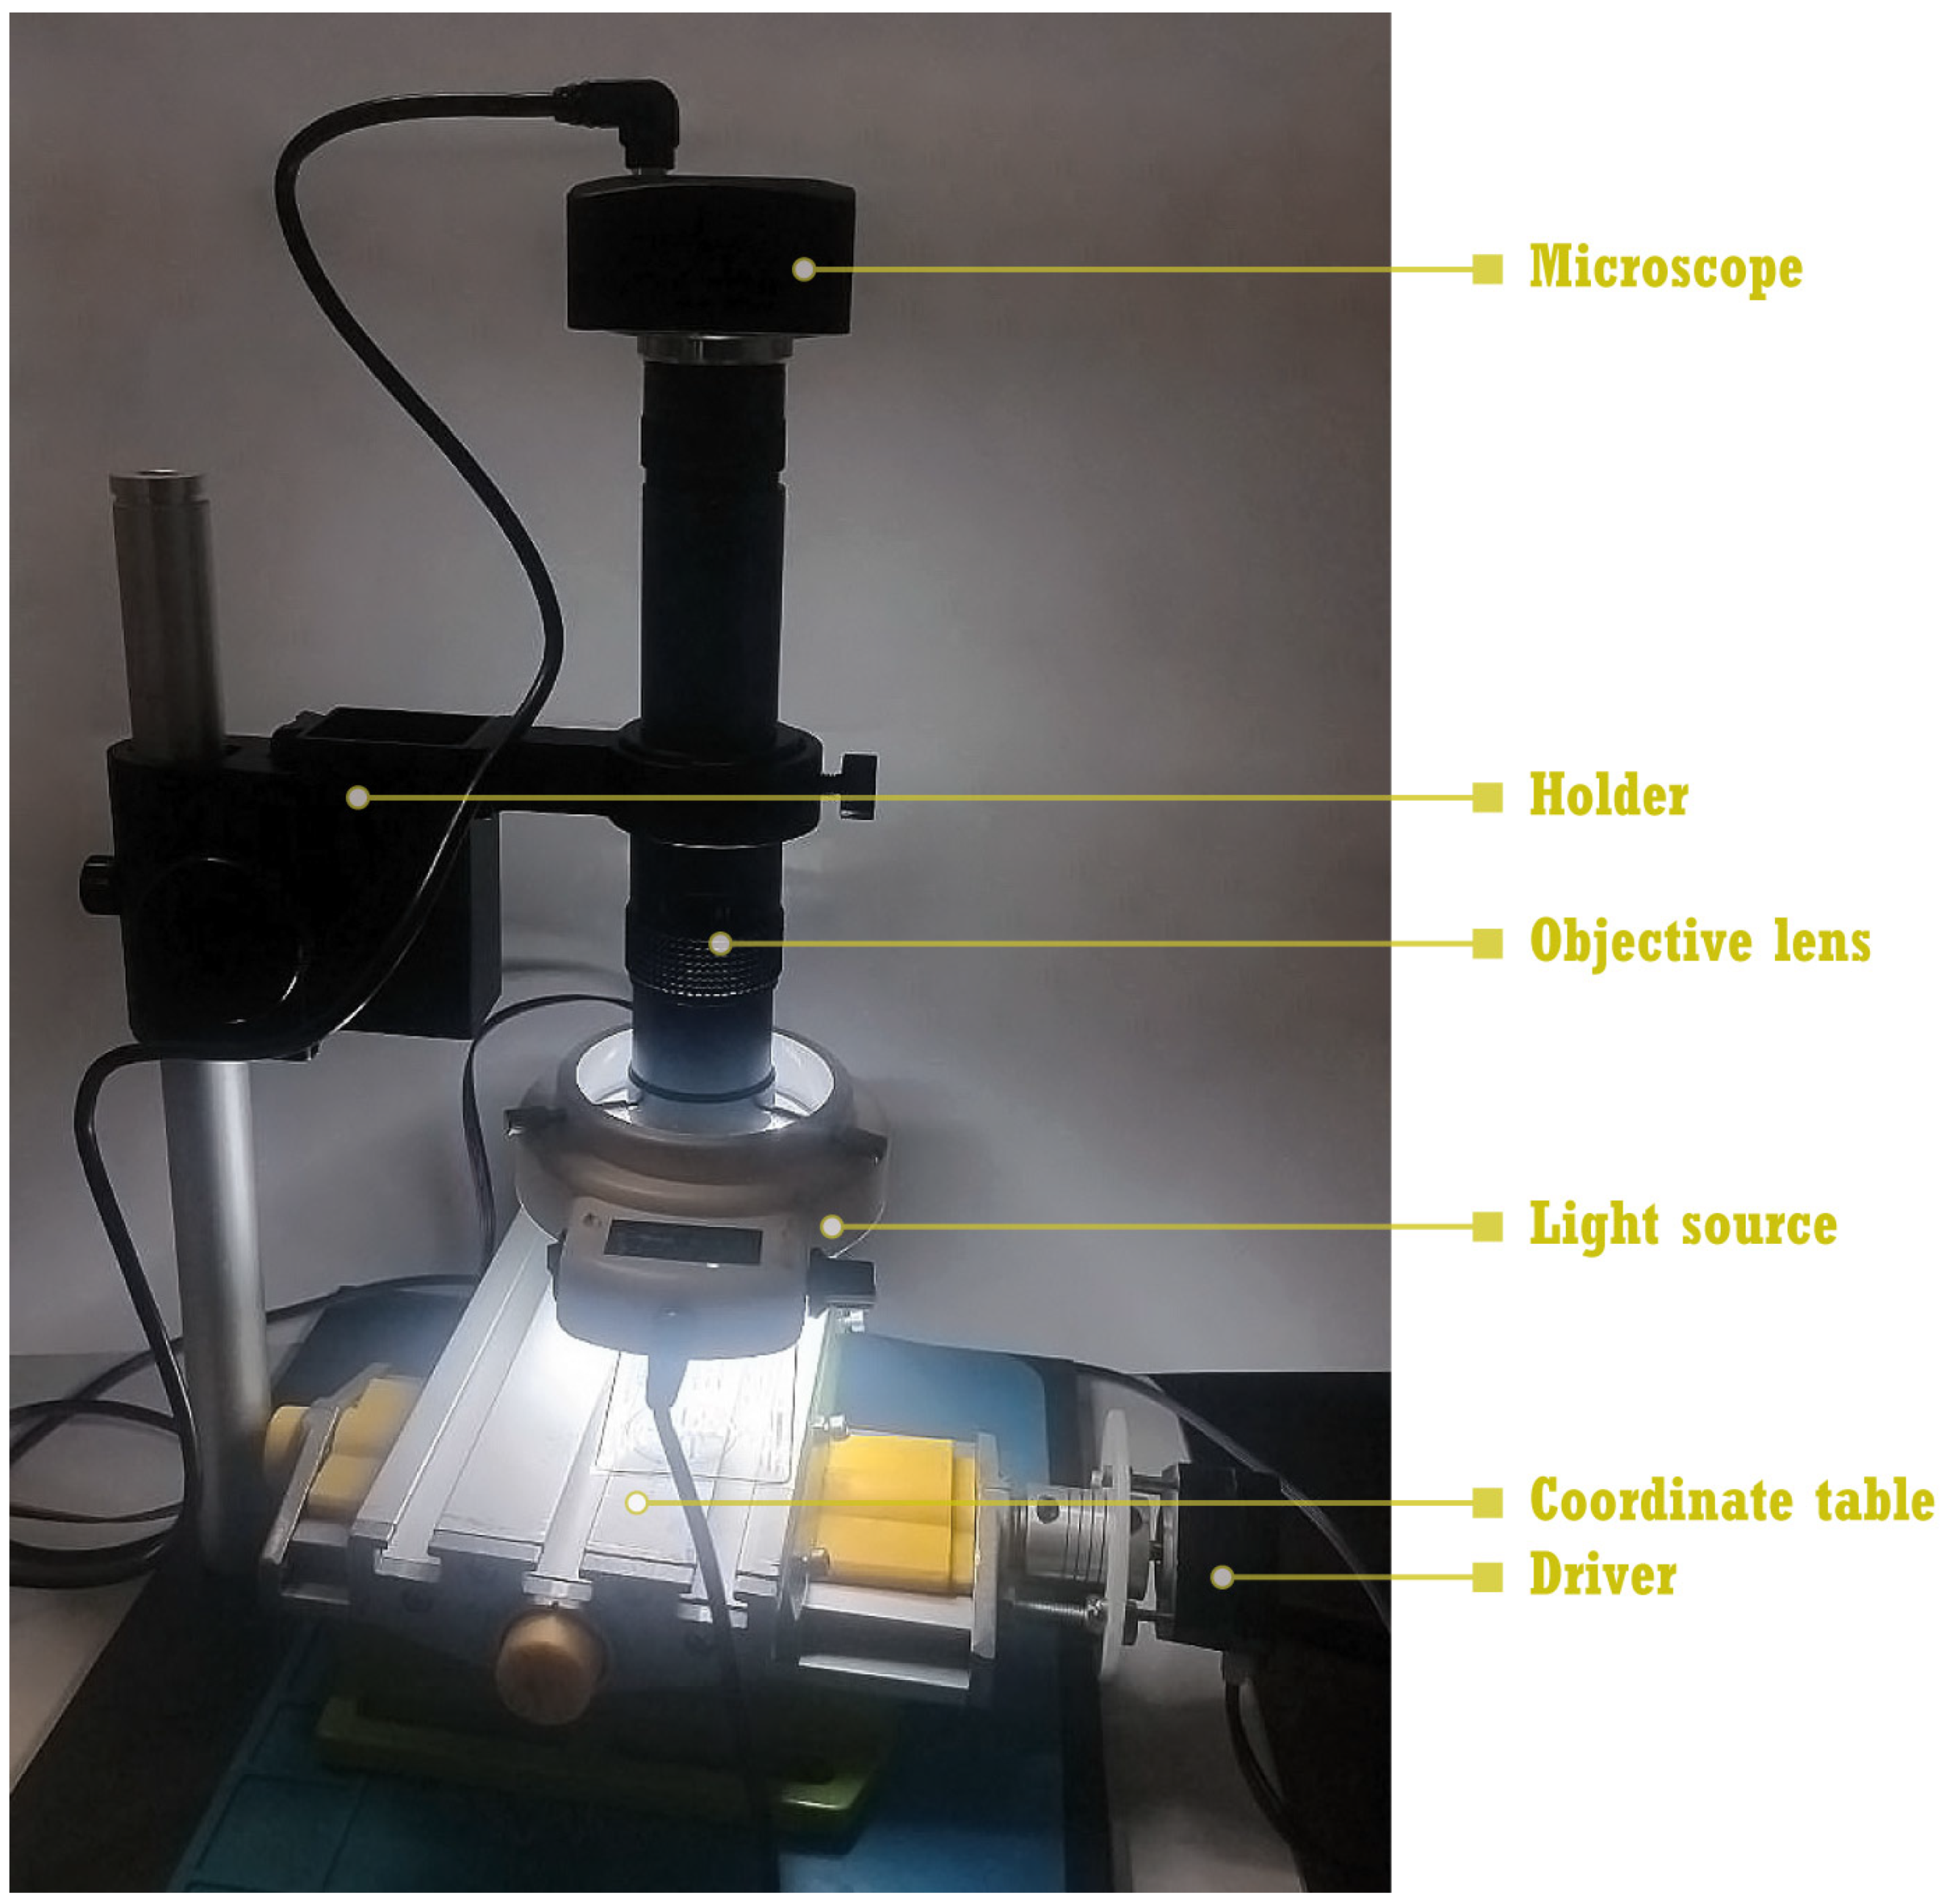
2.2.1. Design of the Device

The smart microscopy scanning system consists of the foundation, which is used for the installment of the two-dimensional X-Y coordinate table with a microscopic slide, a light source, and a microscope based on the holder; see Figure 3. The two-dimensional coordinate table provides the movement of the microscopic slide along two axes parallel to the motor shafts, which are driven by motors Stepper Nema 17hs-4023 and threaded shafts. The fixed angle of the rotation of the stepper motor shaft provides precise linear movement of the table. In the presented assemblage, a microscope ToupCam UCMOS03100KPB with a 60X-600X objective, ToupTek Photonics Co. Ltd., Hangzhou, China has been used.

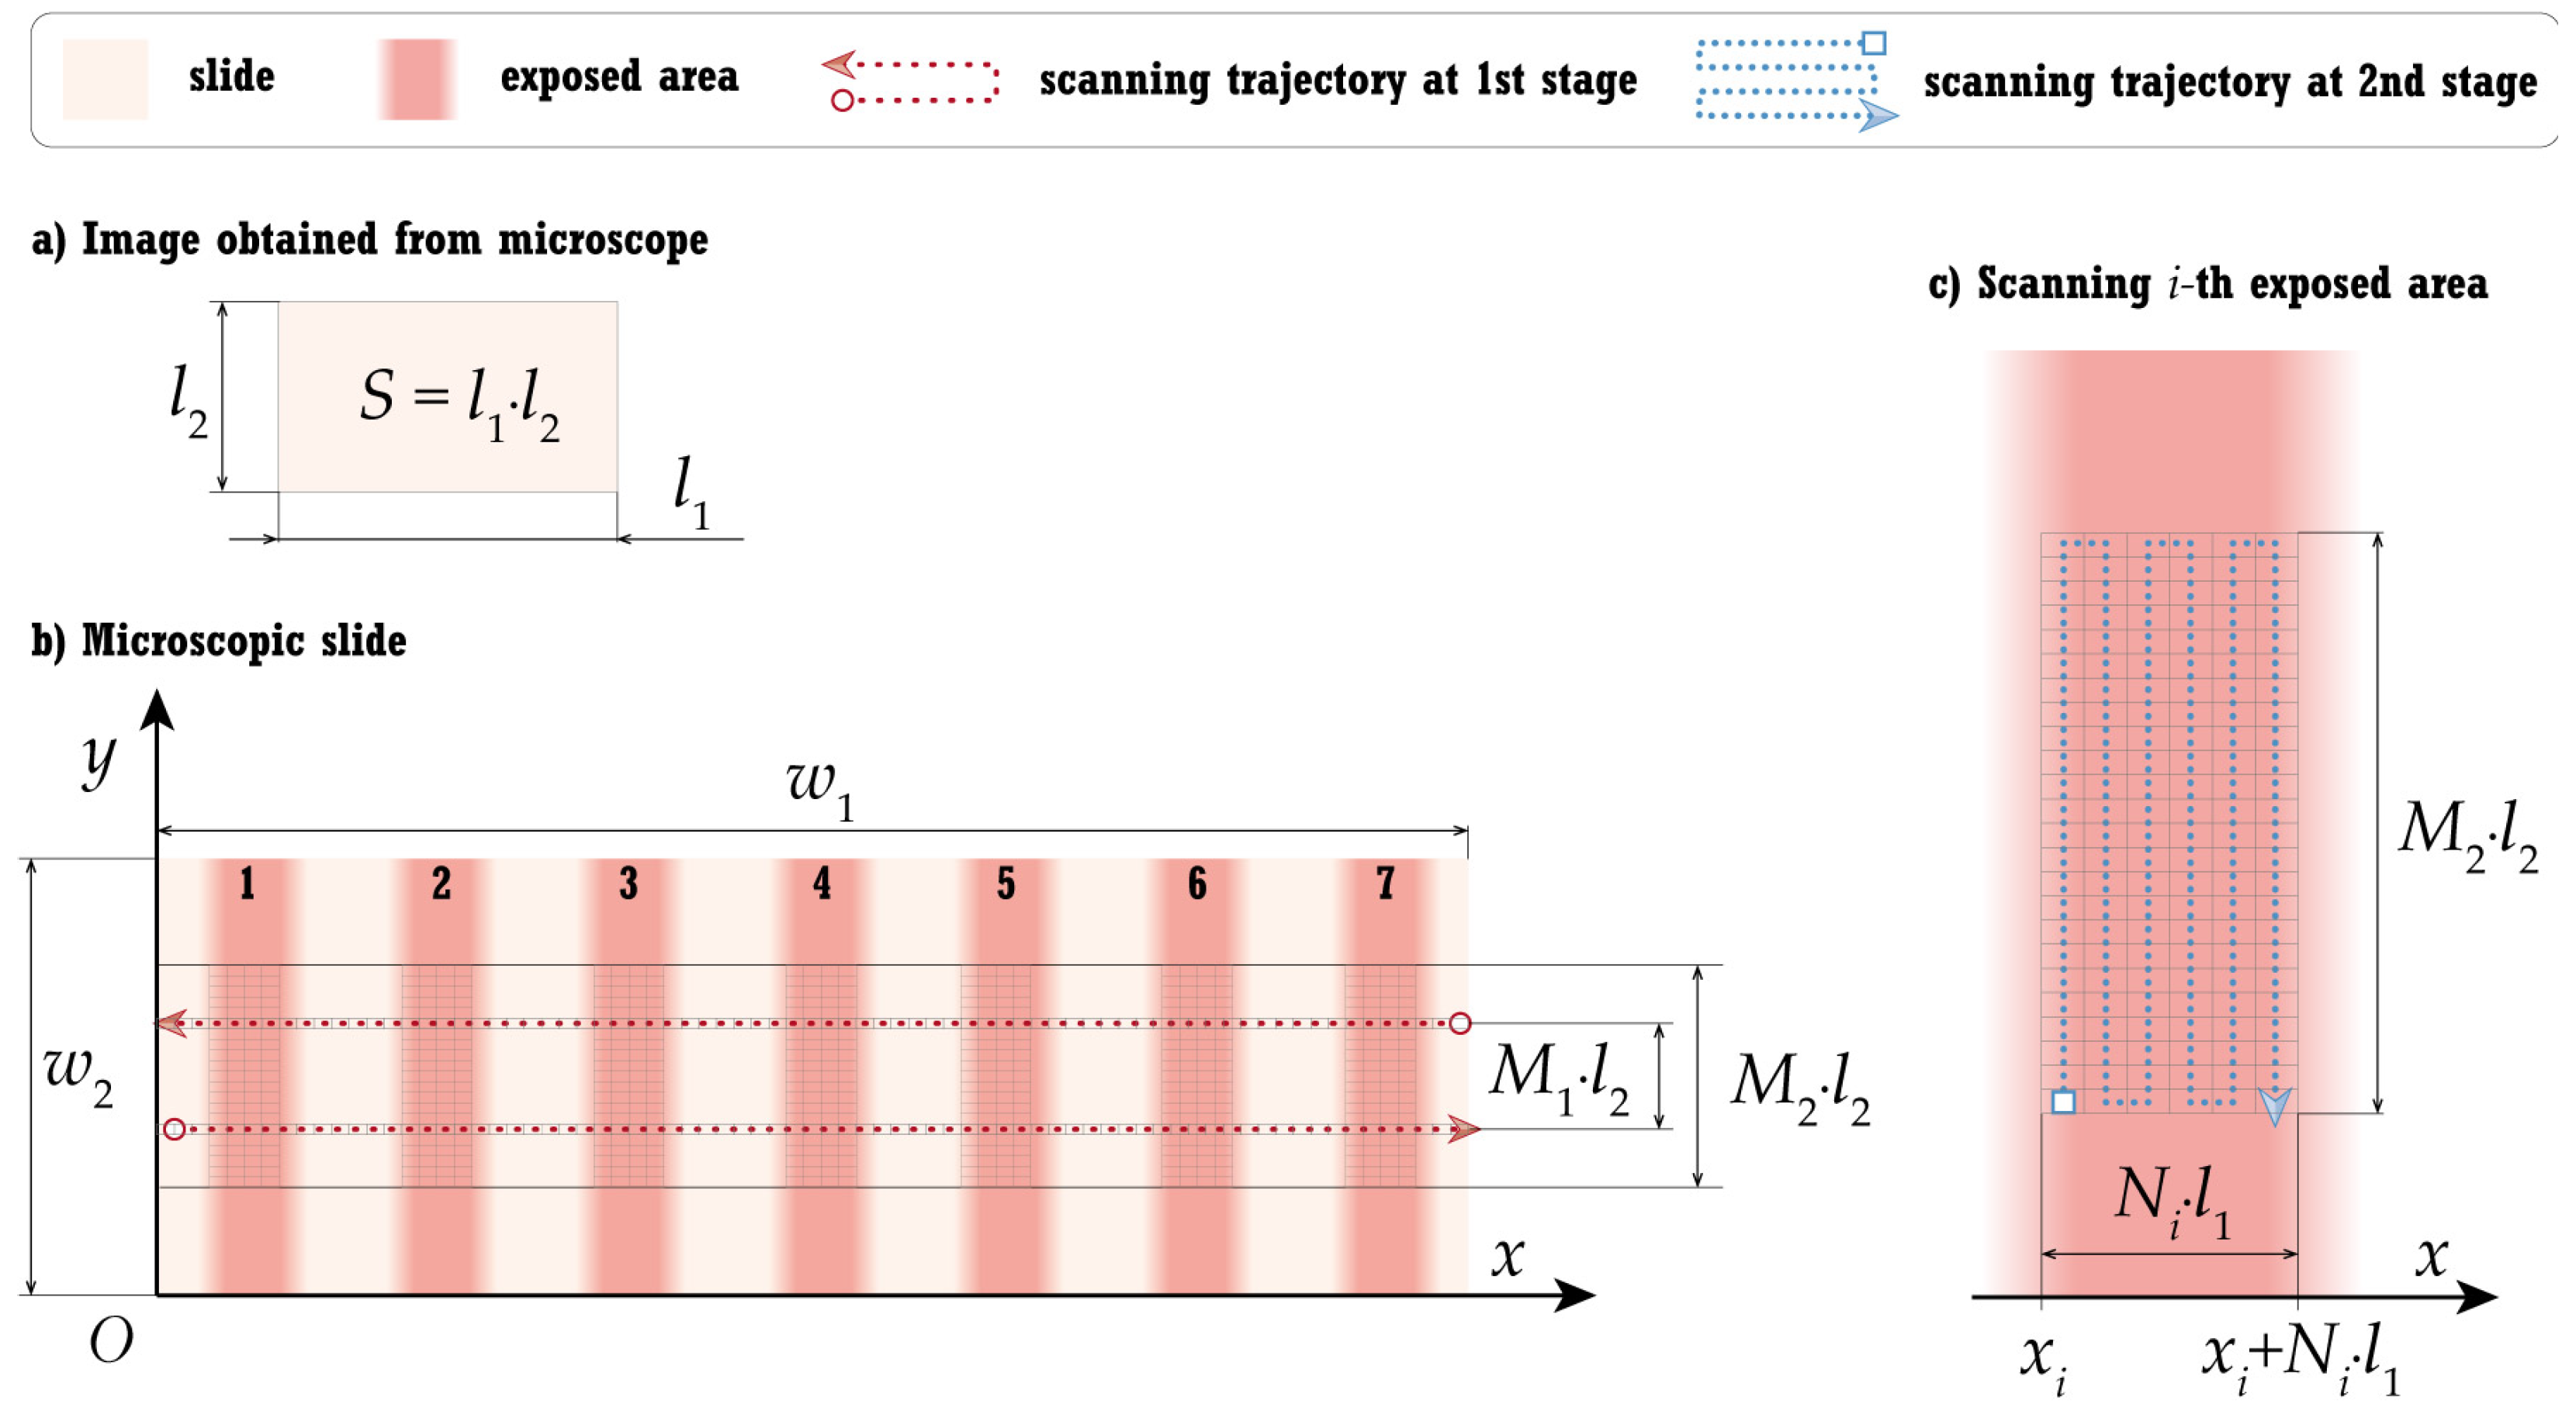
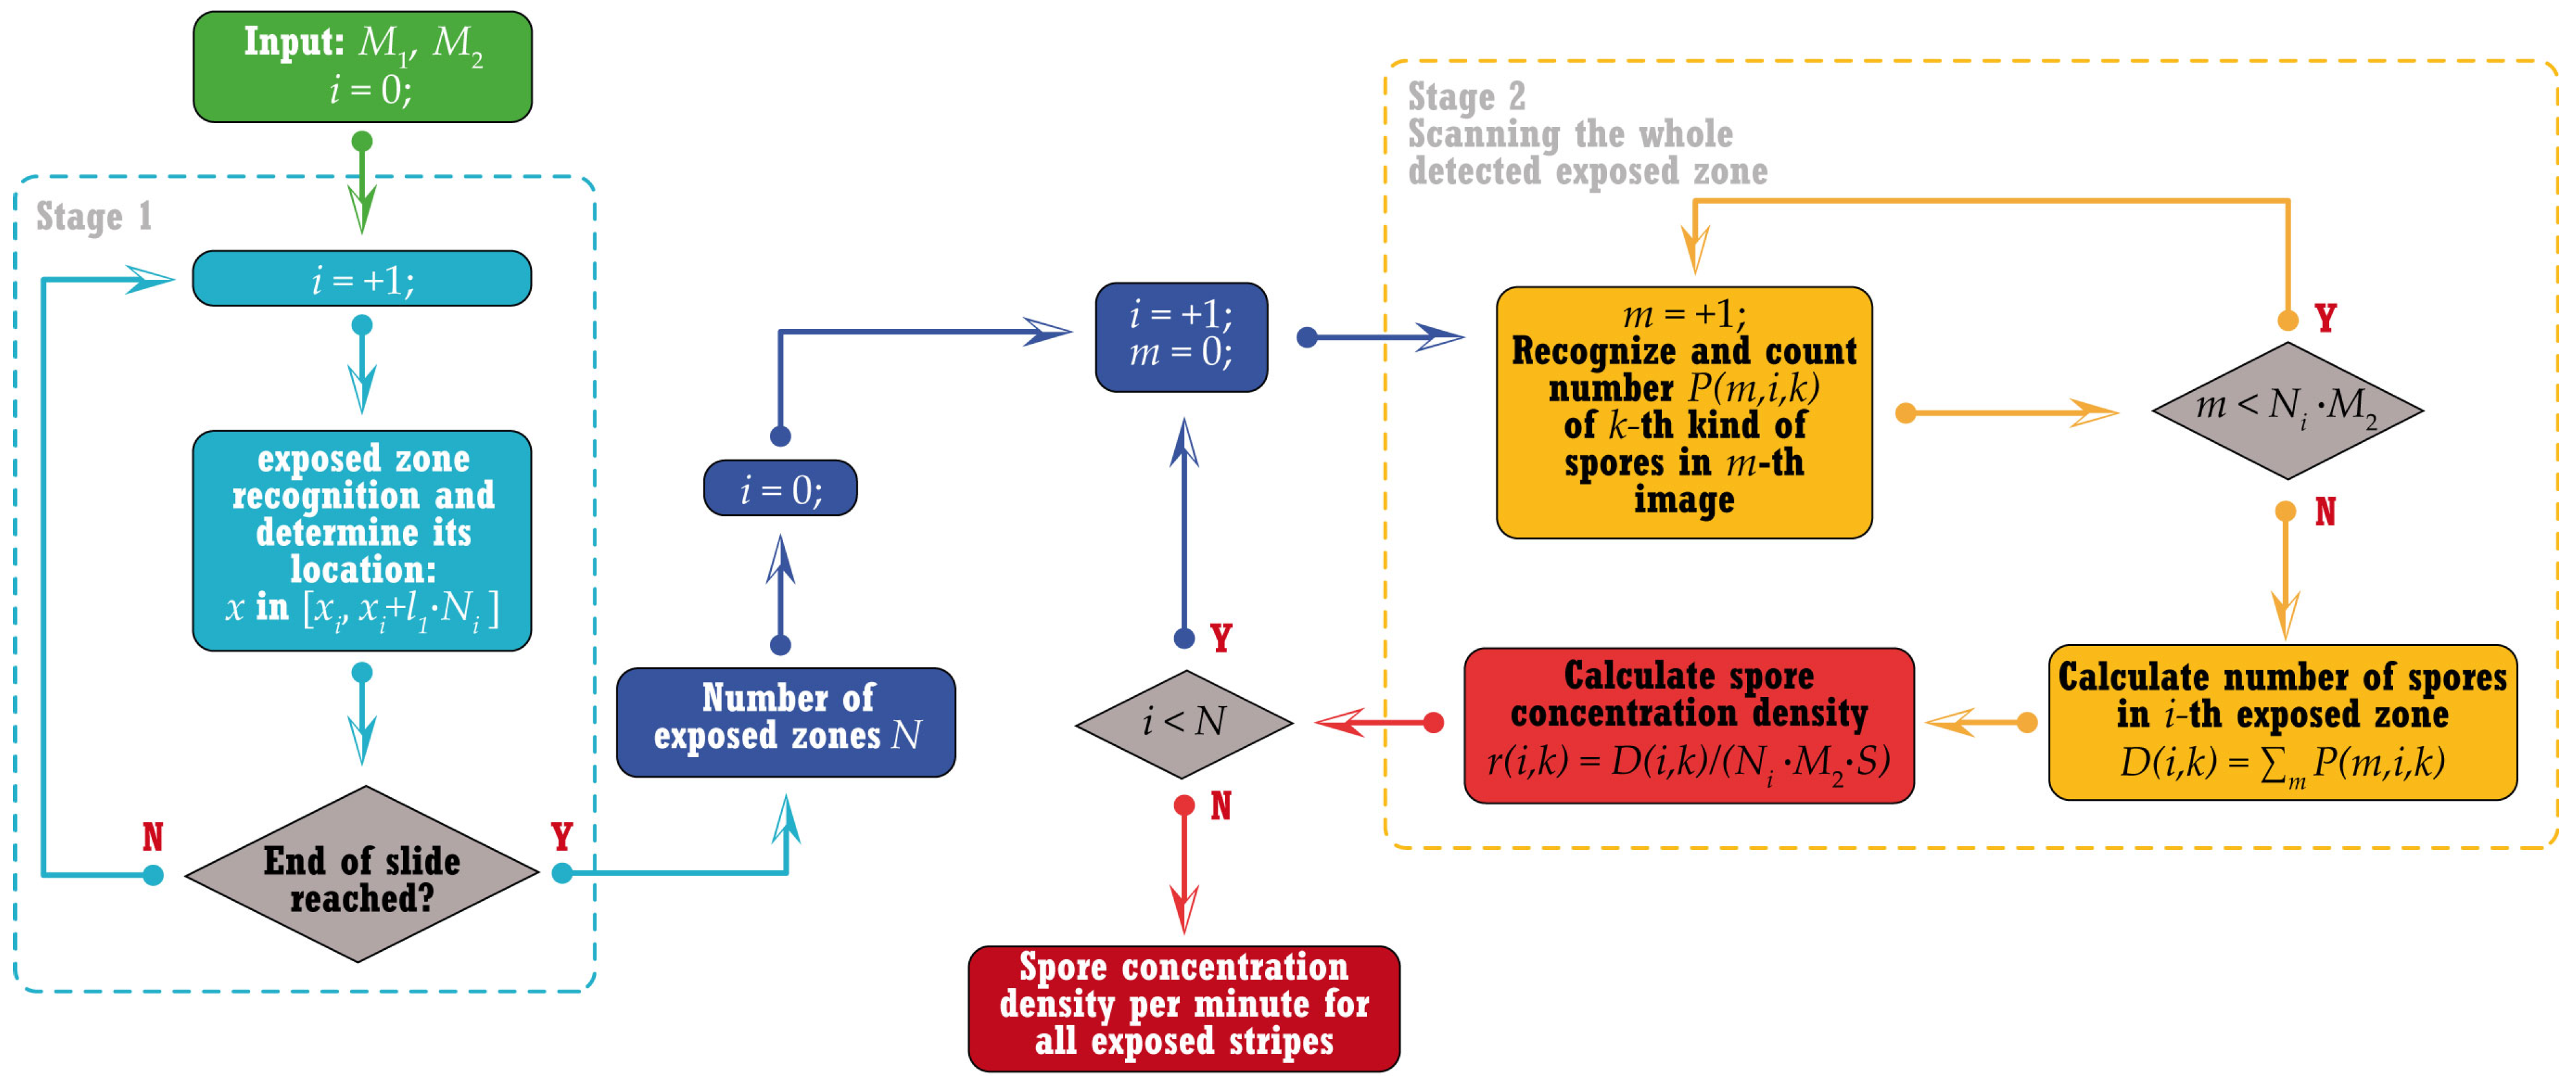
2.2.2. General Algorithm

For simplicity, Cartesian coordinates are introduced, with the origin located at the corner of the slide, as shown in Figure 4. It is assumed that a single image made by a microscope depicts a rectangle with sides l 1 and l 2 , i.e., it has area S = l 1 l 2 ; therefore, frames of the m-th image can be exhaustively described if the coordinates of the left lower corner are known.
The entire scanning procedure is split into two stages. In the first stage, the lengths and locations of all exposed stripes are determined. In the second stage, each stripe is scanned and the number of spores identified in the stripe is counted. A detailed description of the scanning is given below. The scanning scheme is illustrated in Figure 4.
At the preliminary stage, two input values M 1 and M 2 must be determined. M 1 1 is the number of frames situated between two arrays of images to be made at the first stage; see Figure 4b. The number of frames situated along the axis O x in the two-dimensional arrays for each exposed area is denoted as M 2 ; see Figure 4b,c.

2.2.3. Stage 1: Exposed Zones Recognition

To determine the exposed stripes, two series of N 0 snapshots of the entire slide ( N 0 l 1 w 1 ) along two lines distanced from the center of the slide at distance M 1 l 2 / 2 , occupying frames
F j ± = { | x x j l 1 / 2 | l 1 / 2 , | y w 2 / 2 M 1 l 2 | l 2 } ,
must be made. The left lower corner of the rectangular frame F j ± is situated at the point ( x j , w 2 / 2 ± M 1 l 2 / 2 ) , where x j = l 1 j .
Let us define a recognition function R ( F , l ) , which has frame F and the enumerator of spore/particle class number l as input and returns the number of spores or particles belonging to the l-th class recognized in the image (F). The total number of considered classes is denoted (L).
The search for the i-th exposed stripe is performed, considering the following rule for each pair of frames F j ± :
s j = Q ( F j + ) R ^ Q ( F j ) R ^ ,
Q ( F j ± ) = l = 1 L R ( F j ± , l ) .
Condition (1) is true if the number of recognized spores or particles is larger than the threshold value R ^ for both frames. In addition, the series of images is assumed to be in the i-th exposed stripe if more than two pairs of frames in a row have feature s j , showing that they belong to the exposed stripe, i.e.,
s j = = s j + K = T r u e s j 1 = F a l s e j > 1 s j + K + 1 = F a l s e j N 0 K 1 .
If K and j are determined, then the centers of the frames corresponding to the start and the end of i-th exposed stripe can be determined as follows:
a i = c j , b i = c j + K , N i = K .
The number of recognized exposed stripes is denoted as N.

2.2.4. Stage 2: Pore Concentration Evaluation for Each Exposed Area

In the second stage, scanning of the exposed stripe is performed as illustrated in Figure 4c. Therefore, a two-dimensional array of frames F m belonging to the i-th exposed area
{ a i l 1 / 2 x b i + l 1 / 2 , | y w 2 / 2 | M 2 l 2 / 2 }
determined at Stage 1 is to be considered. For each frame F m , the same recognition procedure is applied so that the total number of spores identified in the i-th stripe is as follows:
P ( i , l ) = m = 1 N 1 M 2 R ( F m , l ) .
Therefore, the spore concentration density can be calculated using (3) for each kind of spore and recognized exposed stripes, as follows:
D ( i , l ) = P ( i , l ) N i · M 2 · S .
The flowchart demonstrated in Figure 5 summarizes the two-stage algorithm for processing the slide via the smart microscopy scanning system described above.

2.3. Proposed Methodology or Pipeline of the Automated Procedure

2.3.1. Dataset Creation

At first, glass slides from a spore-trapping device exposed in the agrocenosis with a high concentration of the three considered wheat disease spores were collected and examined. Micrographs of the exposed slides were then made using a ToupCam UCMOS05100KPA (ToupTek Photonics Co. Ltd., China) video eyepiece at different magnifications, 10× and 40×, and processed. The crisp photos with images of spores of the three kinds were extracted from the photo set for data annotation. After the systematic processing of these images by experienced biologists, a labeled dataset of spore images was created. The number of images of each spore species at two magnifications is shown in Table 1.
Following the application of image augmentations, including the rotation and mixing of spores from different species within a single image at 40× magnification and the allocation of spore clusters from the images at 10× magnification, 1392 images were retained. These images encompass all the target classes of spores. All the images have a complex background, where a lot of microparticles are also observed in addition to spores. Moreover, two species of spores under study might be observed in the same image; therefore, such images were also included in the dataset. Some examples of images from the dataset are depicted in Figure 6.
The data annotation was performed using LabelImg image annotation platform with the Auto Mouse Clicker macro. In addition to the target spore species, various microparticles were also labeled, resulting in four classes being classified. The images from the dataset were further divided into training, validation, and sets at a 7:2:1 ratio. The number of types of spores and the microparticles in the sets are presented in Table 2.

2.3.2. Spore Detection

In order to detect spores in micrographs, the developed algorithm has to detect targets and classify objects in the images. Thus, the problem consists of two tasks related to object detection methods: localization and classification. CNNs are powerful tools for solving classification problems through the efficient extraction of features from images. The development of CNNs has also enabled the solution of localization problems by enumerating potential areas and determining in which regions objects are located. In the application of deep learning methods, various CNNs were used for the detection of microparticles (spores, pollen grains), e.g., ResNet [23,25], Faster R-CNN [17,25], and more frequently, YOLOv5 [17,24,25,26].
The YOLOv8 algorithm, which is one of the latest stable versions of the YOLO series of object detection algorithms, is employed in this study. The YOLO algorithms use the grid in the image to predict the probability of membership to a particular class. YOLO’s performance is limited by the number of predicted bounding boxes in each cell, so the neural network does not work well with small objects that are densely clustered in the image. A series of enhancements have been implemented in YOLOv8 to optimize the detector’s performance in terms of accuracy and speed [31].
In addition to the YOLO object detector, the real-time detection transformer (RT-DETR), which offers real-time performance while maintaining high accuracy, is also applied. The RT-DETR architecture is based on the concept of end-to-end Transformer-based detectors (DETRs) that do not use the non-maximum suppression (NMS) method, which negatively affects the speed and accuracy of YOLOs. The RT-DETR deals efficiently with multiscale features, separating intra-scale interactions from cross-scale fusion [32]. YOLO and RT-DETR models have been trained on the dataset described in Section 2.3.1. An example of the application of YOLOv8 and RT-DETR model to three images from the test set is depicted in Figure 7.

2.3.3. Evaluation of the Number of Spores on a Micrograph of the Exposed Microscope Slide

An example of the image composed of all micrographs obtained via scanning the entire exposed microscopic slide using the proposed system and further considered in Section 3.3 is exhibited in Figure 8. Several trajectories of scanning procedures used at the two stages of the proposed algorithm described in Section 2.2.2 are shown by dashed lines, whereas the domains detected as exposed stripes are surrounded by red rectangles.
Thus, two linear scans of the slide or one-dimensional arrays of micrographs are evaluated at the first stage, as shown in Figure 8 by red dashed lines. Two pre-trained CNN models, as described in Section 2.3.2, are applied to each image in the array, with the results evaluated according to the proposed algorithm. Notably, the exposure time determines the threshold value R ^ . The total number of objects detected in each frame (CNNs are trained on both target spores and other microparticles at this stage) is used to determine the location of the exposed stripes on the slide according to (1) and (2).
In the second stage, each recognized exposed strip is processed row by row, see Figure 8, where only the scanning trajectory for the first exposed strip is shown by blue dashed lines. The best CNN selected in the training phase is used for object detection here, and the number of spores of the target species is counted in each scanned image. Formula (4) is finally applied to ascertain the aggregate number of spores of each species present on the exposed strip or the entire slide.

3. Results

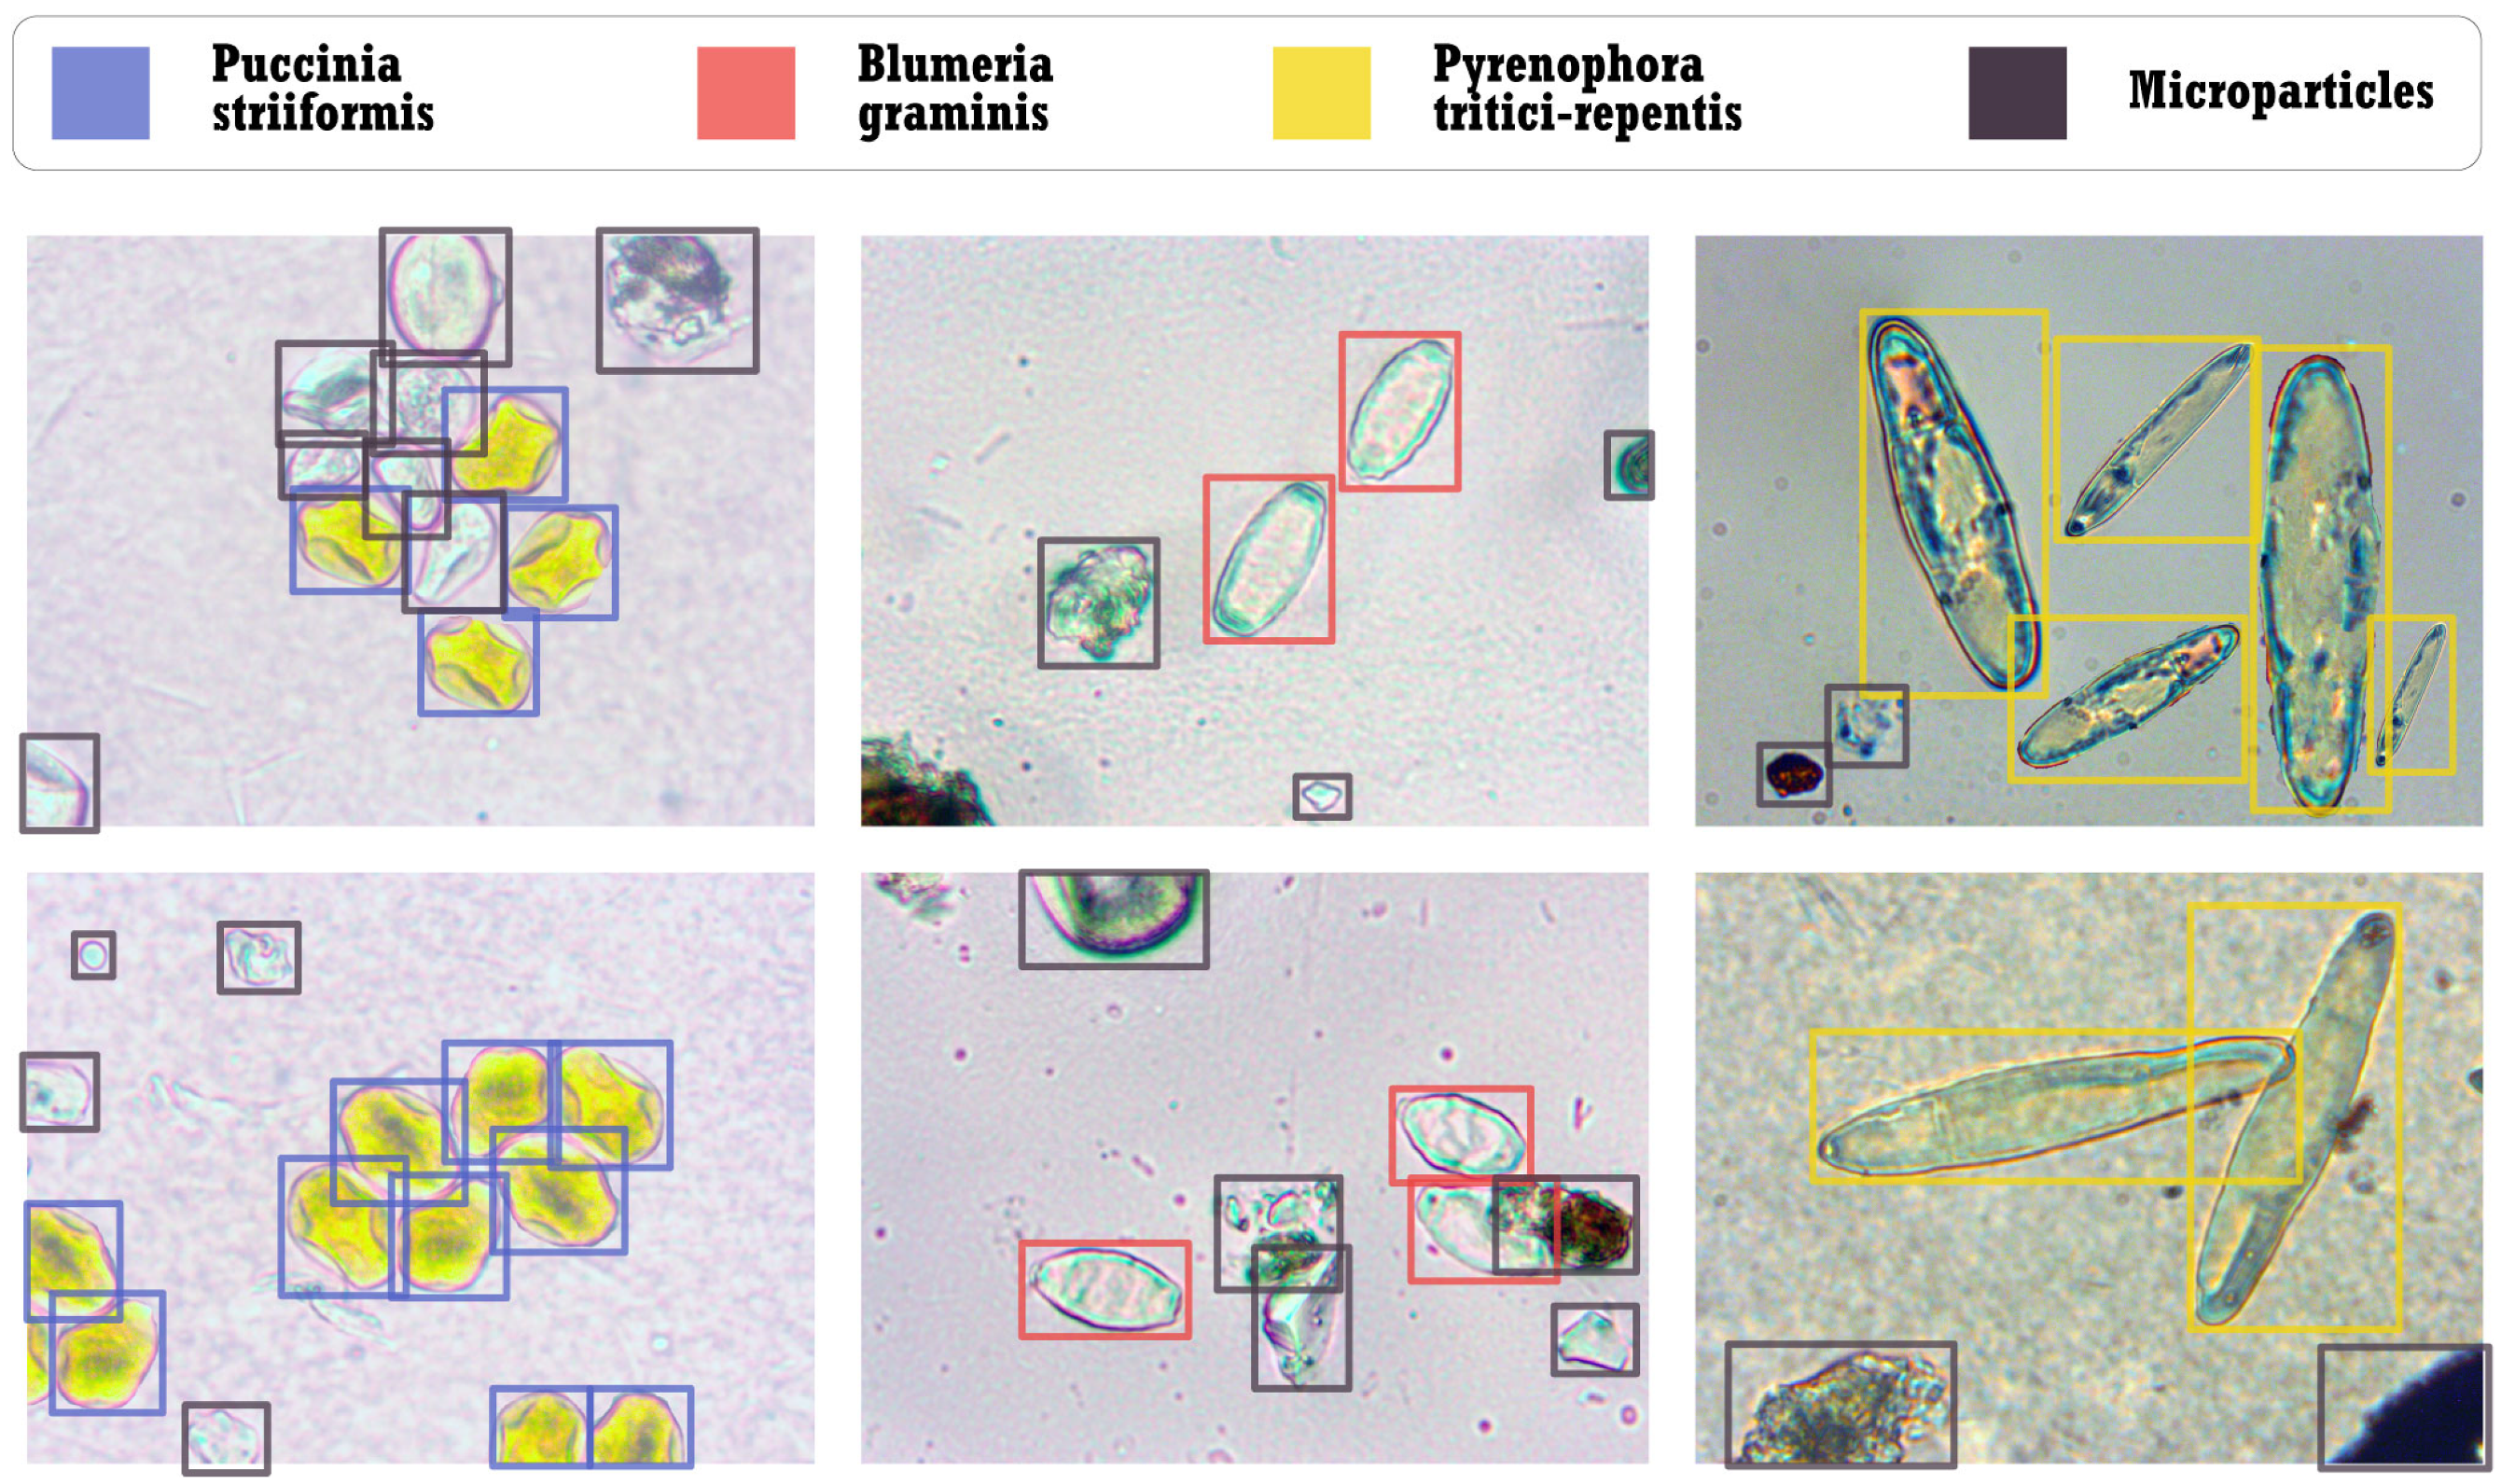
3.1. Spores Identification

The two selected CNNs, YOLOv8 and RT-DETR, were trained on prepared test sets with the following hyperparameters: the training process was conducted over 100 epochs, with a batch size value of 8 and a learning rate of 0.01. Table 3 presents the metrics for the bounding boxes. The metrics of CNNs trained on data labeled with only three types of spores are slightly better than those of CNNs trained on data labeled with other microparticles on the slide. Although the precision and recall rates are higher for the RT-DETR model, the mean average precision (mAP) at an IoU threshold of 0.5 is higher for the YOLOv8 model. Basically, the performance of both models is comparable.
The quality of the predictions of class membership was determined by confusion matrix C based on the detection of spores in the images from the validation set. The TP (true positive) value indicates that the classifier has correctly assigned the detected object to the class under consideration. The FP (false positive) value indicates the incorrect assignment of an object to the k-th class under consideration and is calculated for each class by the following formula:
F P k = j = 1 j k L C k , j ,
and the F N (false negative) value corresponds to an incorrect statement that the object does not belong to the class under consideration:
F N k = j = 1 j k L C j , k .
The following recognition quality metrics are calculated based on (5) and (6) for the k-th class:
P r e c i s i o n k = T P k T P k + F P k , R e c a l l k = T P k T P k + F N k .
Here, P r e c i s i o n is the ratio of the number of correctly classified objects of a class to the total number of elements of that class, and R e c a l l is the ratio of the number of correctly classified objects to all objects that the classifier has assigned to that class. The values and metrics calculated from the confusion matrix for the four CNN models are given in Table 4, where “Y” and “N” in column microparticles show whether the microparticle class was used for model training or not, respectively.
The data presented in Table 4 demonstrate that all the trained models provide high-quality detection for all three spore types. The RT-DETR model exhibits a higher P r e c i s i o n metric than the YOLOv8 model. Conversely, the R e c a l l metric indicates that CNNs may erroneously identify some microparticles as spores, resulting in an overestimation of the spore count. It should be noted that the misidentification of spores belonging to the Blumeria graminis species is more prevalent.
To calculate the generalization metrics for the quality of the detection of all types of spores by the trained models, the following relations are used:
P r e c i s i o n = k = 1 L T P k k = 1 L T P k + k = 1 L F P k , R e c a l l = k = 1 L T P k k = 1 L T P k + k = 1 L F N k .
The YOLOv8 model, trained on the full complete labeled dataset, including both spores and microparticles, demonstrated the highest average precision value of 0.982 and average recall value of 0.9697. The value of the average recall can be employed to rectify the number of identified spores in micrographs. The results of the spore counting of each species in the test set are presented in Table 5. The number of spores in the images, calculated using trained CNNs, differs from the real values presented in Table 2 by less than 5%. Calculations on the test set have confirmed the results obtained for the validation set: the most effective model is YOLOv8, which demonstrated an average recall value of 0.9949. For instance, Li et al. [26] applied an improved YOLOv5 to detect downy mildew spores in complex contexts, and the resulting recall metric was 0.947. An advanced version of the YOLOv5 algorithm was employed by Zhang et al. [24] for the detection of Fusarium germinate spores, resulting in a recall metric of 0.98.

3.2. Exposed Zones Recognition

In accordance with the algorithm for automatic spore density determination, as outlined in Section 2.2.3, a linear scan of the slide is conducted initially to ascertain the exposed zones. The number of objects present in each frame, including both spores and other microparticles, is determined through the application of pre-trained CNNs. Figure 9 illustrates the outcomes of a single linear scan, displaying the number of micro-objects Q ( F j + ) as a function of the number of image j identified by YOLOv8 (Figure 9a) and RT-DETR (Figure 9b).
It can be observed that RT-DETR identifies a greater number of objects in the micro-images. This is due to the fact that RT-DETR is better at recognizing fine details and can separate objects when they are clustered. Figure 9c, where recognized exposed zones are marked, illustrates the presence of three distinct exposed strips. It demonstrates that the area between the first and second strips is not pristine and has adhered microparticles. Furthermore, the third strip exhibits a slight lateral displacement toward the right edge of the slide.
In order to ascertain the start and end of each strip, the threshold level R ^ is as follows:
R ^ = 0.5 q 0.9 q 0.1 .
Here, q α is the quantile of order α . In the case of the YOLO application, the threshold level is R ^ YOLO = 5.1 , while in the case of RT-DETR, the threshold level is R ^ RT DETR = 11.18 . The corresponding levels are shown by thick blue solid lines in Figure 9a,b. Frames with a number of objects in excess of a specified threshold level are potentially classified as belonging to the exposed zone.
It should be noted that the edges of the exposed zone might be non-uniformly covered by microparticles. This phenomenon leads to the reduction of the width of the recognized exposed zone, e.g., the first strip and the third strip in Figure 9a,b. Thus, the beginning of the exposed strip is accepted by the algorithm if the number of recognized objects in two consecutive frames is above the specified threshold value R ^ .

3.3. Evaluation of Average Spore Concentration Density

In this section, the average spore concentration density is introduced to provide a universal characteristic for estimating spore distribution over the microscopic slide. For this purpose, the three slides with various exposure times described in Section 2.1 and depicted in Figure 2 have been studied. Different exposure times have been chosen to introduce a unifying measure that allows for the assessment of the agroecosystem not only for the presence of certain spores but also quantitatively, regardless of exposure time.
The sampling for this investigation was carried out on 5 June 2024, during the development phase of wheat Z 75-85 “milk-wax ripeness”. This phase of wheat development is typical for such diseases as wheat brown rust, whose spores are visually very similar to those of wheat yellow rust. The predominance of brown rust is caused by climatic conditions such as temperature and humidity, which are the most favorable for the corresponding pathogens during this period. For pathogens of powdery mildew and yellow rust of wheat, lower temperatures are preferable; therefore, intensive development of these diseases is usually observed from the end of March until the beginning of May. Further development of these diseases and the sporulation process slowly decreases. Therefore, the largest number of spores in the obtained samples is related to brown rust of wheat or Puccinia recondita. Although the CNNs have been trained on the dataset without brown rust, the CNN models were applied to the slides with brown rust since spores of brown leaf rust are visually very similar to those of wheat yellow rust.
Three sample slides were evaluated automatically and images obtained with parameters l 1 = 0.234 mm and l 2 = 0.176 mm were carefully studied using the developed smart microscopy scanning system and by biologists with double cross-validation. An example of the calculations performed with the algorithm and manually on a single exposure strip for each slide is shown in Table 6. Although the YOLOv8 model, trained on the full dataset with microparticles, achieves the best R e c a l l metric on the validation and training sets, the RT-DETR model shows superior performance on the experimental data. The discrepancy in the number of detected spores reaches as high as 15%, which may be attributed to various factors, as outlined in Section 4.
The results of the unified measure, i.e., normalized average spore concentration density, calculations show that exposure times of 1.5 and 2 min are in good agreement. Therefore, these exposure times can be recommended for characterizing the number of spores with high accuracy.

4. Discussion

The experimental verification of the developed algorithm for automatic spore counting has demonstrated its practical applicability to the processing of microscopic slides with good quality. The two CNNs, YOLOv8 and RT-DETR, exhibited comparable performance in spotting the exposed strips. Manual counting typically considers wider strips than those analyzed by the proposed algorithm, but a unifying measure such as the proposed average spore concentration density—which counts the number of specific spores per square millimeter per minute—appears to be more accurate. Although the CNNs were trained on the yellow rust dataset, the algorithm confidently detects brown rust spores. It should be noted that the simultaneous and separate detection of brown and yellow rust spores, which appear similar to CNNs, requires training with a larger dataset than the one used in this study.
The notable discrepancy in spore counts implemented with the algorithm and manually is attributed to the degradation of spore recognition in some blurred images. The latter is caused by the non-uniform distribution of the glue on the microscopic slide, which results in changes in the distance to the microscope and its de-focusing. Nevertheless, these discrepancies are not critical, and the results produced by the smart microscopy scanning system allow us to adequately determine the number of spores in the air.

5. Conclusions

In the present study, an advanced smart microscopy scanning system for the rapid and precise identification of spores providing automated processing of microscopic slides is presented. It is shown that the average spore concentration density can be employed as a measure allowing for the standardization of results obtained under different conditions.
The proposed system is based on a novel two-stage algorithm, which has the potential to be extended to the detection of other types of spores. The presented methodology and the developed software can be adapted for the scanning and detection of various objects situated on microscopic slides. Furthermore, the method provides an effective tool for related researchers to fasten the processing of the microscopic slides for the collection of data on the changes in various agrocenosis, where the knowledge of the spore density is important for decision-making.
It should also be noted that the procedure used at the second stage of the proposed algorithm can be directly applied to the selected area of the slide using the developed software and the system. This enables the application of this specific stage of the algorithm not only to slides but also, for instance, to the enumeration of spores obtained using other types of spore-trapping devices. Although winter soft wheat (Triticum aestivum L.) was used to collect spores of phytopathogens due to its varying sensitivity to them, the proposed smart system can be readily extended to other grain crops, including soft spring wheat, and both winter and spring durum wheat (Triticum durum).

Author Contributions

Conceptualization, M.V.G., O.Y.K. and O.V.D.; methodology, O.V.D., O.Y.K., M.V.G. and R.Y.D.; software, P.S.S., O.V.D., A.S.P. and I.N.L.; validation, O.V.D., I.N.L., K.E.G. and P.S.S.; formal analysis, O.V.D., M.V.G., O.Y.K. and P.S.S.; investigation, O.V.D., A.S.P., A.V.P., I.N.L., M.V.G. and K.E.G.; resources, O.Y.K., R.Y.D. and I.A.M.; data curation, O.V.D., O.Y.K., M.V.G., P.S.S., K.E.G., A.S.P., I.N.L., A.V.P., I.A.M. and V.K.P.; writing—original draft preparation, O.V.D., O.Y.K., M.V.G. and R.Y.D.; writing—review and editing, O.V.D., O.Y.K., M.V.G. and R.Y.D.; visualization, M.V.G.; project administration, R.Y.D. and O.Y.K. All authors have read and agreed to the published version of the manuscript.

Funding

The study was funded by the Kuban Science Foundation within the framework of the scientific and innovative project no. NIP-20.1/22.8.

Data Availability Statement

The data presented in this study are available on request from the corresponding author due to institutional restriction.

Conflicts of Interest

The authors declare no conflicts of interest.

References

  1. Singh, V.; Sharma, N.; Singh, S. A review of imaging techniques for plant disease detection. Artif. Intell. Agric. 2020, 4, 229–242. [Google Scholar] [CrossRef]
  2. Figueroa, M.; Hammond-Kosack, K.E.; Solomon, P.S. A review of wheat diseases—A field perspective. Mol. Plant Pathol. 2018, 19, 1523–1536. [Google Scholar] [CrossRef] [PubMed]
  3. Volkova, G.V.; Kudinova, O.A.; Matveeva, I.P. Virulence and diversity of Puccinia striiformis in South Russia. Phytopathol. Mediterr. 2021, 60, 119–127. [Google Scholar] [CrossRef]
  4. Kremneva, O.Y.; Mironenko, N.V.; Volkova, G.V.; Baranova, O.A.; Kim, Y.S.; Kovalenko, N.M. Resistance of winter wheat varieties to tan spot in the North Caucasus region of Russia. Saudi J. Biol. Sci. 2021, 28, 1787–1794. [Google Scholar] [CrossRef] [PubMed]
  5. Jha, K.; Doshi, A.; Patel, P.; Shah, M. A comprehensive review on automation in agriculture using artificial intelligence. Artif. Intell. Agric. 2019, 2, 1–12. [Google Scholar] [CrossRef]
  6. Demilie, W.B. Plant disease detection and classification techniques: A comparative study of the performances. J. Big Data 2024, 11, 5. [Google Scholar] [CrossRef]
  7. Adao, T.; Hruska, J.; Padua, L.; Bessa, J.; Peres, E.; Morais, R.; Sousa, J. Hyperspectral Imaging: A Review on UAV-Based Sensors, Data Processing and Applications for Agriculture and Forestry. Remote Sens. 2017, 9, 1110. [Google Scholar] [CrossRef]
  8. Terentev, A.; Dolzhenko, V.; Fedotov, A.; Eremenko, D. Current State of Hyperspectral Remote Sensing for Early Plant Disease Detection: A Review. Sensors 2022, 22, 757. [Google Scholar] [CrossRef]
  9. Khanal, S.; Fulton, J.; Shearer, S. An overview of current and potential applications of thermal remote sensing in precision agriculture. Comput. Electron. Agric. 2017, 139, 22–32. [Google Scholar] [CrossRef]
  10. Mahlein, A.K. Plant Disease Detection by Imaging Sensors - Parallels and Specific Demands for Precision Agriculture and Plant Phenotyping. Plant Dis. 2016, 100, 241–251. [Google Scholar] [CrossRef]
  11. Martinez-Bracero, M.; Markey, E.; Clancy, J.H.; McGillicuddy, E.J.; Sewell, G.; O’Connor, D.J. Airborne Fungal Spore Review, New Advances and Automatisation. Atmosphere 2022, 13, 398. [Google Scholar] [CrossRef]
  12. West, J.; Kimber, R. Innovations in air sampling to detect plant pathogens. Ann. Appl. Biol. 2015, 166, 4–17. [Google Scholar] [CrossRef] [PubMed]
  13. Wang, P.; Yuan, S.; Yang, N.; Wang, A.; Fordjour, A.; Chen, S. The Collection Method for Crop Fungal Spores Based on an Efficient Microfluidic Device. Aerosol Air Qual. Res. 2020, 20, 72–79. [Google Scholar] [CrossRef]
  14. Patel, R.; Mitra, B.; Vinchurkar, M.; Adami, A.; Patkar, R.; Giacomozzi, F.; Lorenzelli, L.; Baghini, M.S. A review of recent advances in plant-pathogen detection systems. Heliyon 2022, 8, e11855. [Google Scholar] [CrossRef]
  15. Wagner, J.; Macher, J. Automated spore measurements using microscopy, image analysis, and peak recognition of near-monodisperse aerosols. Aerosol Sci. Technol. 2012, 46, 862–873. [Google Scholar] [CrossRef]
  16. Lei, Y.; Yao, Z.; He, D. Automatic detection and counting of urediniospores of Puccinia striiformis f. sp. tritici using spore traps and image processing. Sci. Rep. 2018, 8, 13647. [Google Scholar] [CrossRef]
  17. Kubera, E.; Kubik-Komar, A.; Kurasinski, P.; Piotrowska-Weryszko, K.; Skrzypiec, M. Detection and Recognition of Pollen Grains in Multilabel Microscopic Images. Sensors 2022, 22, 2690. [Google Scholar] [CrossRef] [PubMed]
  18. Korsnes, R.; Westrum, K.; Fløistad, E.; Klingen, I. Computer-assisted image processing to detect spores from the fungus Pandora neoaphidis. MethodsX 2016, 3, 231–241. [Google Scholar] [CrossRef] [PubMed]
  19. Biermann, R.; Niemeyer, L.; Rösner, L.; Ude, C.; Lindner, P.; Bice, I.; Beutel, S. Facilitated endospore detection for Bacillus spp. through automated algorithm-based image processing. Eng. Life Sci. 2022, 22, 299–307. [Google Scholar] [CrossRef]
  20. Danping, W.; Botao, W.; Yue, Y. The identification of powdery mildew spores image based on the integration of intelligent spore image sequence capture device. In Proceedings of the 2013 Ninth International Conference on Intelligent Information Hiding and Multimedia Signal Processing, Beijing, China, 16–18 October 2013; pp. 177–180. [Google Scholar] [CrossRef]
  21. Yang, N.; Yu, J.; Wang, A.; Tang, J.; Zhang, R.; Xie, L.; Shu, F.; Kwabena, O.P. A rapid rice blast detection and identification method based on crop disease spores’ diffraction fingerprint texture. J. Sci. Food Agric. 2020, 100, 3608–3621. [Google Scholar] [CrossRef]
  22. Javidan, S.M.; Banakar, A.; Vakilian, K.A.; Ampatzidis, Y.; Rahnama, K. Diagnosing the spores of tomato fungal diseases using microscopic image processing and machine learning. Multimed. Tools Appl. 2024, 83, 67283–67301. [Google Scholar] [CrossRef]
  23. Gao, W.; Li, M.; Wu, R.; Du, W.; Zhang, S.; Yin, S.; Chen, Z.; Huang, H. The design and application of an automated microscope developed based on deep learning for fungal detection in dermatology. Mycoses 2021, 64, 245–251. [Google Scholar] [CrossRef] [PubMed]
  24. Zhang, D.Y.; Zhang, W.; Cheng, T.; Zhou, X.G.; Yan, Z.; Wu, Y.; Zhang, G.; Yang, X. Detection of wheat scab fungus spores utilizing the Yolov5-ECA-ASFF network structure. Comput. Electron. Agric. 2023, 210, 107953. [Google Scholar] [CrossRef]
  25. Zhou, H.; Lai, Q.; Huang, Q.; Cai, D.; Huang, D.; Wu, B. Automatic Detection of Rice Blast Fungus Spores by Deep Learning-Based Object Detection: Models, Benchmarks and Quantitative Analysis. Agriculture 2024, 14, 290. [Google Scholar] [CrossRef]
  26. Li, K.; Qiao, C.; Zhu, X.; Song, Y.; Zhang, L.; Gao, W.; Wang, Y. Lightweight fungal spore detection based on improved YOLOv5 in natural scenes. Int. J. Mach. Learn. Cybern. 2024, 15, 2247–2261. [Google Scholar] [CrossRef]
  27. Yao, C.; Yang, Z.; Li, P.; Liang, Y.; Fan, Y.; Luo, J.; Jiang, C.; Mu, J. Two-Stage Detection Algorithm for Plum Leaf Disease and Severity Assessment Based on Deep Learning. Agronomy 2024, 14, 1589. [Google Scholar] [CrossRef]
  28. Kremneva, O.; Danilov, R.; Gasiyan, K.; Ponomarev, A. Spore-Trapping Device: An Efficient Tool to Manage Fungal Diseases in Winter Wheat Crops. Plants 2023, 12, 391. [Google Scholar] [CrossRef]
  29. Kremneva, O.; Gasiyan, K.; Ponomarev, A. Detection of the causal agent of tan spot (Pyrenophora tritici-repentis) using spore-catching devices. Int. J. Ecosyst. Ecol. Sci. 2023, 13, 53–58. [Google Scholar] [CrossRef]
  30. Kremneva, O.Y.; Volkova, G.V.; Kovalenko, N.M. The dynamics of the race structure of Pyrenophora tritici-repentis in the North Caucasus region. Mikol. Fitopatol. 2019, 53, 246–253. [Google Scholar] [CrossRef]
  31. Jocher, G.; Chaurasia, A.; Qiu, J. Ultralytics YOLOv8. 2023. Available online: https://github.com/ultralytics/ultralytics (accessed on 15 April 2024).
  32. Lv, W.; Xu, S.; Zhao, Y.; Wang, G.; Wei, J.; Cui, C.; Du, Y.; Dang, Q.; Liu, Y. DETRs beat YOLOs on real-time object detection. arXiv 2023, arXiv:2304.08069. [Google Scholar]
Figure 1. Photos of leaves affected by Puccinia striiformis, Blumeria graminis, and Pyrenophora tritici-repentis.
Agronomy 14 01945 g001
Figure 2. Photo of the microscopic slides with exposed stripes.
Agronomy 14 01945 g002
Figure 3. Photo of the intelligent system.
Agronomy 14 01945 g003
Figure 4. Scheme of the scanning procedure of the microscopic slide.
Agronomy 14 01945 g004
Figure 5. Flowchart of the algorithm for processing the slide via the intelligent system.
Agronomy 14 01945 g005
Figure 6. Examples of the annotated data from the created dataset.
Agronomy 14 01945 g006
Figure 7. Examples of the application of YOLOv8 and RT-DETR to the images from the test set.
Agronomy 14 01945 g007
Figure 8. An example of the photomicrograph of the exposed microscopic slide.
Agronomy 14 01945 g008
Figure 9. The number of objects Q ( F j + ) recognized by YOLOv8 (a), RT-DETR (b) in the j-th image at the first stage of the proposed algorithm and marked zones belonging to the recognized exposed zones (c).
Agronomy 14 01945 g009
Table 1. Number of images of spores taken by a microscope.
MagnificationPuccinia striiformisBlumeria graminisPyrenophora tritici-repentis
10×241929
40×10010044
Table 2. Split of data into training, validation, and test samples.
SamplePuccinia striiformisBlumeria graminisPyrenophora tritici-repentisMicroparticle
train7506533133626
validation4962841641231
test24126585721
Table 3. CNN metrics for bounding boxes.
ModelMicro-ParticlesMetrics
Precision (B)Recall (B)mAP50 (B)mAP50-95 (B)
YOLOv8Y0.9340.9390.9540.803
N0.9640.9830.9840.861
RT-DETRY0.9780.9840.9420.791
N0.9610.9770.9820.857
Table 4. CNN metrics for classification.
ModelMicro-ParticlesType of SporesTPFNFPRecallPrecision
YOLOv8YP. striiformis4861040.97980.9918
B. graminis2795250.98240.9148
P. tritici-repentis162230.98780.9818
NP. striiformis4851130.97780.9939
B. graminis2777240.97540.9203
P. tritici-repentis161330.98170.9817
RT-DETRYP. striiformis491560.98990.9879
B. graminis2795390.99360.8774
P. tritici-repentis1622190.98780.895
NP. striiformis4888110.98390.978
B. graminis2822360.9930.8868
P. tritici-repentis1622200.98780.8901
Table 5. The amount of identified spores on test data.
ModelMicro-ParticlesAmount of Identified Spores
P. striiformisB. graminisP. tritici-repentis
YOLOv8Y24226785
N24126184
RT-DETRY23926482
N24126781
Table 6. Normalized average spore concentration density.
AmountExposure TimeRT-DETR, YReal Data
Spores per 1 mm21 min17.215.5
1.5 min3944.5
2 min52.259.2
Spores per 1 mm2 in a 1 min1 min17.215.5
1.5 min2629.7
2 min26.129.6
Disclaimer/Publisher’s Note: The statements, opinions and data contained in all publications are solely those of the individual author(s) and contributor(s) and not of MDPI and/or the editor(s). MDPI and/or the editor(s) disclaim responsibility for any injury to people or property resulting from any ideas, methods, instructions or products referred to in the content.

