Abstract
To address the current issues of low intelligence and accuracy in seed-sorting devices, an intelligent seed sorter was developed in this study using machine-vision technology and the lightweight YOLOv5n. The machine consisted of a transmission system, feeding system, image acquisition system, and seed screening system. A lightweight YOLOv5n model, FS-YOLOv5n, was trained using 4756 images, incorporating FasterNet, Local Convolution (PConv), and a squeeze-and-excitation (SE) attention mechanism to improve feature extraction efficiency, detection accuracy, and reduce redundancy. Taking ‘Zhengdan 958’ corn seeds as the research object, a quality identification and seed sorting test was conducted on six test groups (each consisting of 1000 seeds) using the FS-YOLOv5n model. Following lightweight improvements, the machine showed an 81% reduction in parameters and floating-point operations compared to baseline models. The intelligent seed sorter achieved an average sorting rate of 90.76%, effectively satisfying the seed-sorting requirements.
1. Introduction
Seeds play a crucial role in agricultural production and serve as the foundation of farming. Seed quality significantly affects crop yield and quality. Traditional seed-sorting methods, which rely on manual labor and outdated machinery, are inefficient and susceptible to errors in detection [1,2,3]. With the rapid advancement in machine vision technology, an increasing number of seed-detection facilities have turned to machine vision for detection and sorting. Among these methods, color-sorting machines are commonly used [4,5]. For instance, companies such as CIMBRIA in Europe and VMEK in the United States have developed color-sorting machines that utilize an inclined chute feeding system to identify the color of seed particles and subsequently blow out seeds of different colors using gases. Although these machines offer fast sorting speeds and high levels of automation, they may not comprehensively assess phenotypic traits, such as seed texture [6]. Xu et al. [7] employed computer vision technology and deep-learning algorithms to achieve high-speed and accurate seed detection and sorting. This approach not only enhances sorting efficiency but also reduces labor costs and the occurrence of false and missed detections.
Visible-light imaging technology has been developed and implemented for the quality inspection of various agricultural products such as rice, corn, wheat, and vegetable seeds [8,9,10]. For instance, Cheng et al. [11] utilized machine vision to classify rice based on its appearance quality, categorizing it into polished, broken, and chalky varieties. The system operates at a rate of 30 samples/s. Zhang et al. [12] designed an online corn single-seed detection and sorting device that employed machine-vision-based image acquisition and processing, along with real-time seed tracking using sensors. The accuracy of damaged seed sorting in this system exceeded 89%. Nonetheless, the utilization of machine-vision technology and lightweight YOLOv5n for seed-quality detection is still in the research phase, with high-throughput screening and commercial applications yet to be realized.
To compensate for market vacancies, we developed an intelligent seed sorter utilizing visible and near-infrared high-resolution imaging. By leveraging machine vision and the FS-YOLOv5n model, this system can comprehensively analyze and evaluate various appearance traits of seeds, such as color, shape, size, and texture, enabling the precise and intelligent sorting of seeds. This system could provide a solution to problems that exist in seed sorting.
2. Materials and Methods
2.1. Structure and Working Principle of the Intelligent Seed Sorter
The intelligent seed sorter described in this study consists primarily of transmission, feeding, image acquisition, and seed screening systems. The hardware structure of an intelligent seed sorter includes components, such as an air compressor, direct-acting solenoid valve group, high-quality seed box, low-quality seed box, conveyor belt, encoder, linear light source, line-scan camera, electromagnetic vibration feeder, multistage seed separation device, and host computer, as shown in Figure 1.
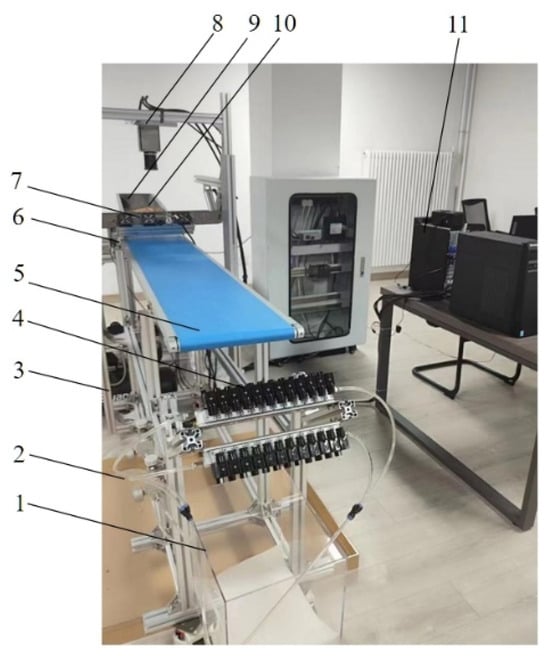
Figure 1.
Diagram of the structure and working principle of the intelligent seed sorter: 1. high-quality seed box; 2. low-quality seed box; 3. air compressor; 4. direct-acting solenoid valve group; 5. conveyor belt; 6. encoder; 7. linear light source; 8. line-scan camera; 9. electromagnetic vibration feeder; 10. multistage seed-separation device; and 11. host computer.
The startup sequence is initiated by activating the host computer, air compressor, linear light source, and line-scan camera. Subsequently, a conveyor belt and electromagnetic vibration feeder are installed. The seeds within the feeder are vibrated and passed through a multistage seed-separation device to organize them into multiple rows on the conveyor belt. A line-scan camera is used to capture images of the seeds during motion. The host computer conducts a preprocessing analysis of the acquired seed images, which includes tasks such as noise filtering, contrast enhancement, grey scaling, and binarization. Subsequently, a target detection model scrutinizes the color, shape, size, and texture of the seeds to assess their quality. Superior-quality seeds are directed to a high-quality seed box. For low-quality seeds, the host computer transmits the recognition results in a binary format to the PLC information storage module. The PLC then expels low-quality seeds by precisely controlling a direct-acting solenoid valve group and depositing them in the designated low-quality seed box. This process ensures precise and accurate sorting of seeds.
2.2. Feeding System Design
To facilitate the organized arrangement of seeds on the conveyor belt for subsequent image acquisition, detection, and sorting, the feeding system incorporates an electromagnetic vibration feeder. This feeder includes components such as a hopper, plate spring, electromagnet, coil, armature, base, multistage seed-separation device, and other electronic auxiliary devices (Figure 2).
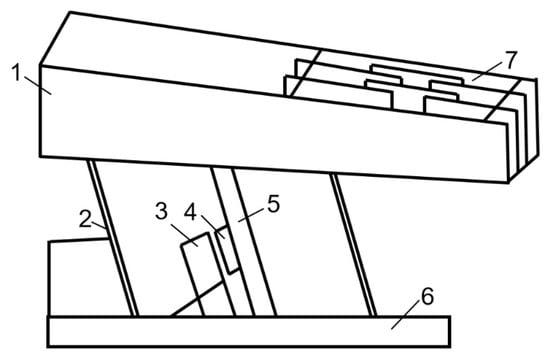
Figure 2.
Diagram of the structure of the electromagnetic vibration feeder: 1. hopper; 2. plate spring; 3. coil; 4. electromagnet; 5. armature; 6. base; and 7. multistage seed-separation device.
For the systematic test in this study, the corn seed ‘Zheng Dan 958’ was selected as the research subject. The seeds were 10−18 mm in length and 10−15 mm in width. Seeds tend to cluster and form connections easily. To avoid complications during subsequent image analysis and processing caused by densely arranged seeds and to improve the accuracy of the system, a multistage seed-separation device (Figure 3) was designed at the seed outlet of the electromagnetic vibration feeder. This device sorts and feeds seeds. Considering the three-dimensional characteristic parameters of corn seeds, the device was designed with 20 mm slits to allow only one seed to pass at a time. This design choice led to the dispersion and organized arrangement of seeds.
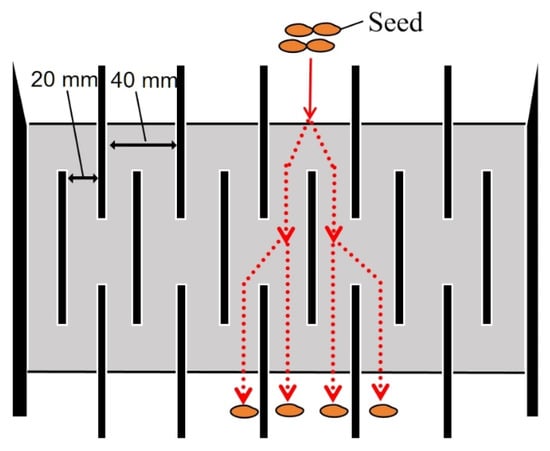
Figure 3.
Multistage seed-separation device.
2.3. Transmission System Design
2.3.1. Transmission System Hardware Design
The transmission system utilized an SPQ01 built-in drive conveyor belt (Misumi, Shanghai, China) with an anti-run-deflection rib. This design incorporated a drive device inside the fuselage profile, leading to a noticeable reduction in the overall height of the transmission system. The system primarily comprises a rack, idler, synchronous wheel, conveyor belt, tensioning device, and driving device, as shown in Figure 4.
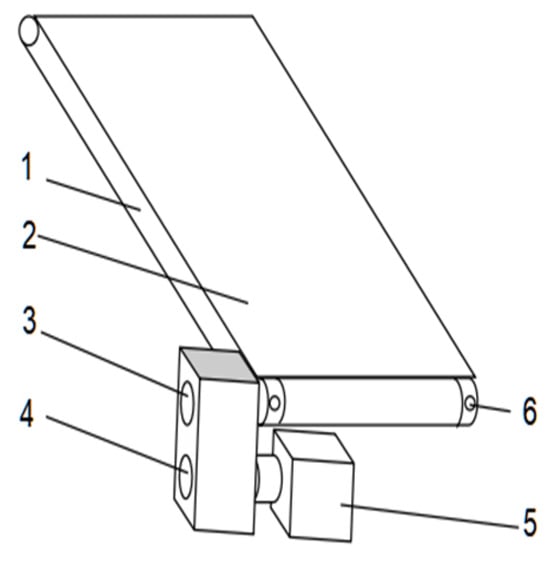
Figure 4.
Diagram of the structure of the transmission system: 1. rack; 2. idler; 3. synchronous wheel; 4. conveyor belt; 5. tension device; and 6. drive device.
The line-scan camera, positioned 300 mm from the conveyor belt, has a viewing angle range of ±25°. Using this configuration, the calculated width of the conveyor belt is 279.78 mm. In this study, the model detection time for a single image was 0.24 s and the seed-screening time was 0.3 s. To enhance the accuracy and efficiency of seed sorting, it is crucial to account for color differences between the conveyor belt and the seeds during image analysis and processing. Therefore, a blue conveyor belt with a width of 280 mm and a length of 2000 mm was chosen to improve the color contrast, reduce the virtual edge on the seed contours, and facilitate the separation of seeds from the background for image recognition purposes [13,14,15].
2.3.2. Transmission System Control
The transmission system control module is responsible for accurately controlling the speed, stop position, torque, and other conveyor belt parameters. Given that the conveyor belt handles light loads and conveys small volumes of lightweight seeds, the focus should be on calculating the speed of the servomotor rather than the stop position and torque of the belt.
The circumference of the circular section driven by the servomotor was approximately 62.8 mm, which caused the conveyor belt to move the same distance when the motor completed one full rotation. To achieve a conveyor speed of 800 mm/s, the servomotor must rotate approximately 12.7 times per second. According to Equation (1), the controller pulse frequency should be adjusted to 3175 Hz. Different pulse frequencies were tested at various conveyor speeds to determine the optimal controller pulse frequency.
where P is the controller pulse frequency (Hz), L is the circumference of the cylindrical section (mm), Z is the electronic gear ratio, and C is the encoder resolution.
2.4. Design of the Image Acquisition System
2.4.1. Image Acquisition System Hardware Design
To capture the fast-moving seeds on the conveyor belt, an LQ-201-CL-F (JAI, Danish) model line-scanning camera was chosen for this study. The key parameters of the line-scan camera are listed in Table 1.

Table 1.
Primary parameters of the line-scan camera.
To enhance the light intensity, two linear light sources were chosen and positioned 50 mm above the conveyor belt to minimize any potential impact on the seed. The light was focused precisely onto the belt to generate a bright line perpendicular to the camera lens, ensuring maximum light penetration. The line-scanning camera has a viewing angle range of ±25° and the conveyor belt has a bandwidth of 280 mm. In the initial test setup, the sorting efficiency and image acquisition accuracy were prioritized, leading to the placement of a camera lens 300 mm above the belt. Figure 5 provides a visual representation of the working principle of the line-scan camera and integrated light source.
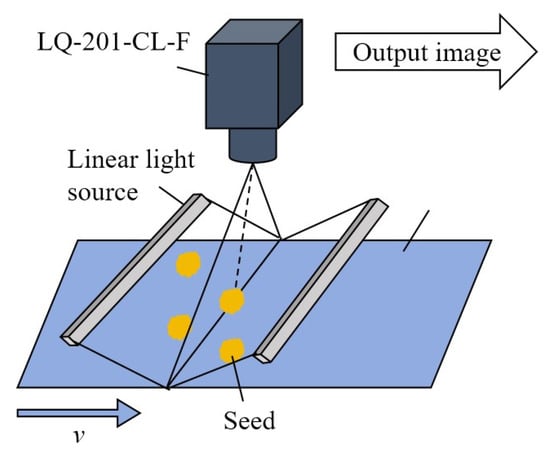
Figure 5.
Working principle of the line-scan camera and light source construction diagram.
The encoder is connected to the image-processing device and is responsible for triggering the line-scan camera to capture images externally. In this study, a rotary encoder was used to synchronize the speed of the conveyor belt with the sampling rate of the line-scanning camera to prevent distortion or deformation of the scanned image. Maintaining a horizontal pixel accuracy equal to the vertical pixel accuracy is essential [16,17]. A conveyor belt with a width of 280 mm was selected for the study, with a seed image resolution of 2048 × 2048 pixels. The horizontal pixel accuracy was calculated as 0.14 mm using Equation (2). To avoid image distortion, the vertical pixel accuracy should also be 0.14 mm, as indicated by Equations (3)–(5).
where is the horizontal pixel accuracy (mm), is the conveyor belt width (mm), is the unit pixel number of the line-scan camera, is the vertical pixel accuracy (mm), is the conveyor running speed (mm/s), is the linear array camera line-scanning rate (mm/s), is the running time of the conveyor belt for scanning an image frame (s), and is the scan time of the line-scan camera for scanning one frame.
2.4.2. Encoder Design
The Omron E6B2−CWZ1X (Omron, Osaka, Japan) runner encoder, with a runner circumference of 200 mm and output of 2500 pulses per turn, was chosen for this study. When the wheel completes a 360° rotation to cover a distance of 200 mm on the conveyor belt, the line-scan camera scans 1429 images to achieve a longitudinal accuracy of 0.14 mm. This implies that the encoder generates one pulse for every 0.252° rotation of the wheel. The encoder requires a 0.144° rotation of the shaft to emit a pulse. Thus, when the runner rotates by approximately 0.252°, the encoder transmits two pulse signals to the acquisition card, requiring double-frequency division settings for the signals received from the multispectral image acquisition device. By instructing the line-scanning camera to capture an image for every two pulse signals received from the encoder, the multispectral image acquisition device ensured the accuracy of the longitudinal pixels in the image.
2.4.3. Image Acquisition System Software Control
The image-processing software was developed by integrating the camera control software and image-processing device control software. The software was designed and compiled using Python in the PyCharm2020.1 software.
The image-processing interface software can automatically identify seed locations based on the acquired RGB images and NIR image files. It can also assess the seed quality using image-processing algorithms, enabling the automatic classification and sorting of seeds. In addition, the software marks and selects seeds, records the two-dimensional coordinates of low-quality seeds, and provides preconditions for seed screening. The image referred to is shown in Figure 6.
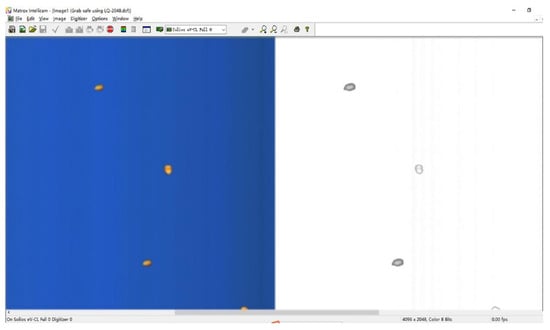
Figure 6.
Control software for RGB and NIR image processing.
2.5. Seed-Screening System Design
2.5.1. PLC and Direct-Acting Solenoid Valve Group
Solenoid valves are categorized into three types: direct-acting, step-by-step direct-acting, and pilot-operated valves [18]. An AirTAC 3V series 3V210-08-NC (AirTAC, Taipei, Taiwan) two-position three-way normally closed solenoid valve group was used. This group consists of two rows of direct-acting three-position two-body normally closed solenoid valves, totaling 280 mm in length, to match the conveyor belt width. Each solenoid valve group comprises 12 blowing devices. The digital output of the PLC is connected to each solenoid valve terminal for individual control. The solenoid valves operate on DC 24 V with a power of 3.0 W, applicable pressure range of 0.16 to 0.8 MPa, and maximum operating frequency of 10 Hz.
In a seed-screening system, a transistor output-type PLC should be selected to quickly control the opening and closing of the direct-acting solenoid valve group and remove low-quality seeds [19]. SIMATIC S7-200 CN and CPU224XP (Siemens, Beijing, China) devices from the Siemens S7-200 series were chosen for their NPN- and transistor-type output terminals, meeting the requirements of the system for rapid response and high operating frequency.
2.5.2. Principle of the Seed-Screening System
Figure 7 shows a schematic of the seed-screening system. The system is powered by an air compressor with an air inlet on the solenoid valve group connected to the air compressor, and the blow hole is aligned with the screening end of the conveyor belt. During operation, the low-quality seeds carried by the conveyor belt are directed to the low-quality seed box on the right by the solenoid valve air-blowing actuator upon exiting the conveyor belt. Conversely, the high-quality seeds undergo a flat-throwing motion and fall into the left high-quality seed box after leaving the conveyor belt.
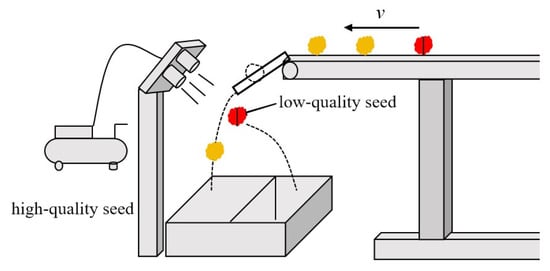
Figure 7.
Schematic diagram of the seed-screening system.
The direct-acting solenoid valve group has outlet holes spaced 10 mm apart, creating a sorting-blind zone (Figure 8). When the low-quality seeds identified by the system fall within this blind zone, separating them from the gas blown by a single solenoid valve group becomes challenging. To address this issue, two solenoid valve groups were installed, with a vertical displacement of 10 mm between them. This arrangement ensured that the blind area between the outlet holes of the lower solenoid valve group was covered by the outlet holes of the upper solenoid valve group, thereby effectively preventing leakage and ensuring proper seed selection.
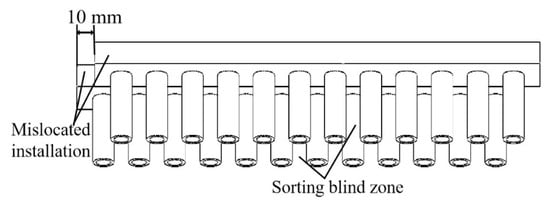
Figure 8.
Schematic diagram of the direct-acting solenoid valve group.
Taking corn seeds as the research object, the low-quality corn seed samples were prepared by manual tapping and moldy treatment, and the samples of artificial broken and moldy seeds are shown in Figure 9. We evenly mixed high-quality seeds and low-quality seeds at a 3:1 ratio and made 6 seed sample sets for sorting tests using a sampling-type automatic counting instrument, with each sample set containing 1000 seeds.
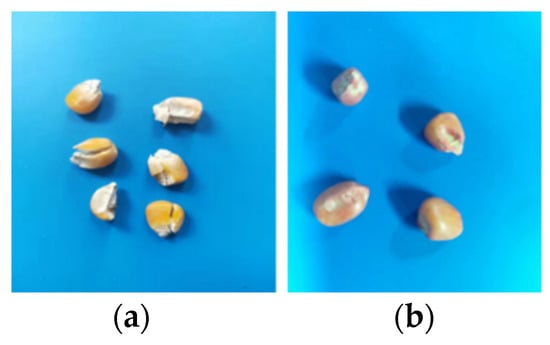
Figure 9.
Samples of low-quality seeds: (a) artificially broken seed; (b) mildew seed.
2.6. Optimization of the YOLOv5n Model
2.6.1. Creation of the Dataset
In total, 1189 seed images were labeled. To prevent overfitting and improve the generalization ability of the model, the call Imgaug library includes symmetrical flipping, zooming, random brightness, color transformation, perspective transformation, noise addition, and other methods for single or combined data enhancement processing. After completion, 4756 images were obtained and divided into 3840 training sets, 449 verification sets, and 467 test sets in a 9:1:1 ratio. The model was then subjected to 300 training iterations.
2.6.2. FS-YOLOv5n Lightweight Improvement
The YOLO series, a classic single-stage object detection algorithm, has been widely utilized in various fields because of its exceptional detection capabilities. YOLOv5n, a version of the YOLOv5 series, is distinguished by its smaller network depth and width compared to other versions, resulting in fewer parameters and lower hardware requirements. The enhanced FS-YOLOv5n, built upon YOLOv5n, is particularly well-suited for scenarios with limited resources or those that require real-time feedback. The network structure of the FS-YOLOv5n model is illustrated in Figure 10.
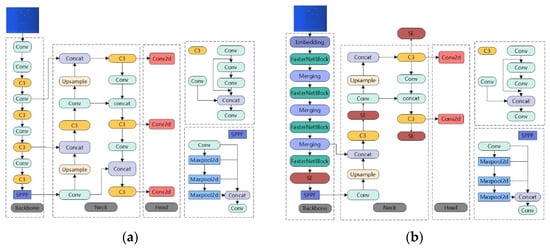
Figure 10.
Network structure of the model: (a) YOLOv5n model and (b) FS-YOLOv5n model.
The backbone of YOLOv5n integrates convolutional modules with C3 modules to create a complex structure that may pose challenges during implementation. Presently, popular lightweight networks, such as MobileNets, ShuffleNets, and GhostNet, utilize DWConv and GConv for spatial feature extraction, effectively reducing floating-point operations and network complexity. However, this methodology also increases memory access, potentially causing higher latency.
This study introduced local convolution (PConv) to enhance spatial feature extraction efficiency by minimizing redundant computations and memory accesses. FasterNet, as shown in Figure 11, was integrated with a local convolution. FasterNet comprises FasterNet blocks, embedding layers (4 × 4 convolution with a stride of 4), merging layers (2 × 2 convolution with a stride of 2), and feature extraction layers. The embedding and merging layers facilitated spatial down-sampling and channel expansion [20].
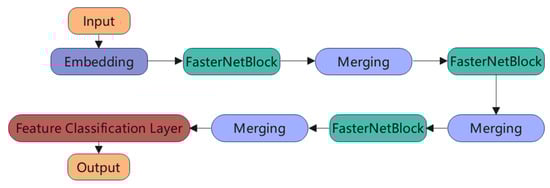
Figure 11.
Structure of the FasterNet model.
FasterNet exhibits a faster training speed during the training phase, enhancing the efficiency of the model training process and significantly reducing the training time. The smaller output size of FasterNet may lead to deviations in the feature extraction, prompting the utilization of the squeeze-and-excitation (SE) attention mechanism to rectify these features. This mechanism enables the corrected features to concentrate more on the valuable information. The structure of the SE layer is shown in Figure 12, demonstrating its ability to achieve adaptive learning of the importance of each channel through three steps and to adjust the contribution of channels in the feature map according to the task requirements.
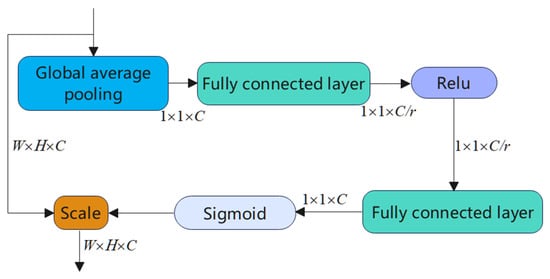
Figure 12.
Structure of the SE attention mechanism.
2.6.3. Loss Function Improvement
The YOLOv5n loss function comprises the bounding box regression loss, object confidence loss, and class loss. Among them, the bounding box regression loss employs the complete intersection over union (CIoU) loss function, as shown in Equation (6). Although it considers the overlap area, center point distance, and aspect ratio for bounding box regression, where the aspect ratio is defined as a relative value, it does not directly address the issue of sample imbalance in terms of difficulty.
In this study, the Focal-EIoU loss function [21] was selected, which substitutes the aspect ratio with the variance in width and height and incorporates focal loss to tackle the imbalance between high-quality and low-quality samples and model excessive fitting. Equation (7) describes the formulation of EIoU.
where A is the predicted bounding box, B is the target bounding box; (.) is the Euclidean distance (pixels); and are the width and height of the predicted bounding box (pixels); and are the width and height of the target bounding box (pixels); c refers to the diagonal length of the minimum enclosing rectangle that covers both the predicted and target bounding boxes (pixels); and and are the width and height of the minimum enclosing rectangle, respectively.
Most existing loss functions do not account for the imbalance in the bounding boxes, leading to low-quality samples dominating the gradient computation and hindering accurate bounding box regression. To address this issue, it is crucial to increase the importance of high-quality samples while reducing the impact of low-quality ones. Equation (8) introduces the Focal-EIoU to mitigate this issue.
3. Results and Discussion
3.1. Results and Analysis of the Air-Pump Pressure Test
Table 2 lists the measured results of the seed flight distance for various air-pump pressure values. The experiment revealed that at a maximum air-pump pressure of 0.7 MPa, the seed could reach a distance of 0.83 m. Adjusting the air-pump pressure to 0.3 MPa resulted in the seed being thrown obliquely to the farthest distance of 0.41 m, with an average distance of 0.33 m. This distance surpasses the length of the high-quality seed box and satisfies the separation distance requirements for an intelligent seed sorter that channels low-quality seeds to the designated box.
Table 2.
Blown seed distance under different air-pump pressures.
3.2. Results and Analysis of the Controller Pulse Test
The relationship between the pulse frequency of the controller and the conveyor belt speed is listed in Table 3. After the pulse frequency of the motion controller was determined, the variable-speed controller parameters were configured. We set the X-axis pulse frequency instruction to 3175 Hz and verified the instructions. To save the instructions, the instruction file was chosen, and the automatic program execution was activated. When the conveyor belt was not in operation, the stop button was clicked to halt the movement.
Table 3.
Controller pulse frequency (P) for different conveyor belt transmission speeds (v).
3.3. Results and Analysis of Model Testing
3.3.1. Test Environment Setup
All lightweight structural improvements and training were conducted on a desktop computer. The specific test environment configurations are listed in Table 4. The training parameters were set as follows: input image size of 640 × 640 pixels, 300 training epochs, batch size of 16, initial learning rate of 0.001, and intersection over union (IoU) threshold of 0.5. Other training parameters were set to their default values.
Table 4.
Host computer test environment configuration.
3.3.2. Analysis of Improved Results
The test results obtained after the improvements are listed in Table 5. Within the YOLOv5 series of models for detection tasks, the YOLOv5n, while exhibiting slightly lower accuracy figures, maintains a numerical proximity that is not significantly detrimental. Remarkably, it stands out as the smallest in the number of parameters, giga floating-point operations (GFLOPs), and each piece takes time, ensuring the most efficient processing speed. These data indicate a significant decrease in the complexity of the FS-YOLOv5n model. Compared to the original YOLOv5n model, there was an approximately 81% reduction in the number of parameters and giga floating-point operations, accompanied by an approximate 65% reduction in each piece takes time, with no significant decline in the accuracy performance metrics. The FS-YOLOv5n model is adept at swiftly processing seed images, thereby fulfilling the real-time response requirements from detection to sorting in the seed-sorting sorter, ensuring seamless integration and enhanced operational efficiency.
Table 5.
Performance comparison between YOLOv5 and FS-YOLOv5n models.
In this study, the model was subjected to 300 training iterations. Table 6 displays the average precision (AP) values for high- and low-quality seeds as 87.3% and 71.5%, respectively. The mean AP (mAP) reached a stabilized maximum of 79.4%. The F1 value, which is the harmonic mean of precision and recall, was 82.4% for the high-quality seeds and 70.2% for the low-quality seeds. In the classification detection model, the F1 values are typically calculated separately for each category, and the mean F1 (mF1) values are determined. The mF1 value for high-quality and low-quality corn seeds was found to be 76.3%, considering both precision and recall values to optimize the model performance by maximizing both simultaneously.
Table 6.
Results of FS-YOLOv5n model testing.
3.3.3. Ablation Experiment
In order to verify the performance of the improvement model, the ablation experiments of each improvement strategy are analyzed. Under the same dataset, training environment, and super parameters, the results of the ablation experiments are shown in Table 7.
Table 7.
Results of ablation experiment.
It can be seen from the Table 7 that a single additional SE attention mechanism can improve the identification accuracy of the model, but the calculation amount will be increased accordingly. The FasterNet module can greatly reduce the complexity of the model, bringing faster detection speed to the model and reducing the number of parameters and GFLOPS by 81%. The Focal-EloU loss function considers the unbalanced problem between samples, which substitutes the aspect ratio with the variance in width and height, and incorporates it, effectively realizing the accuracy improvement. Combined with the above-mentioned improved FS-YOLOv5n models, 81% of the parameters and GFLOPS have been reduced.
3.3.4. Comparative Tests of Different Models
To further validate the effectiveness of the lightweight model improvements, we conducted experiments with several other models using the same dataset, as listed in Table 8. Although the detection accuracy of the other models slightly surpassed that of FS-YOLOv5n, the significant compression ratio of this model stood out. Compared to YOLOv4 Tiny, YOLOx Tiny, YOLO6n, and YOLOv7Tiny, FS-YOLOv5n reduced the parameter count by 94%, 95%, 95%, and 97%, respectively. Moreover, there was no notable decrease in the mAP value, with only slight reductions of 4%, 4%, 5%, and 8% compared with YOLOv4, YOLO6n, and YOLOv7Tiny, respectively. Hence, the FS-YOLOv5n model not only offers a smaller size but also maintains high accuracy, making it well-suited for deployment on embedded and mobile devices.
Table 8.
Comparison results of different models.
3.4. Results and Analysis of the Seed-Sorting Test
In this study, corn seeds of the ‘Zhengdan 958’ variety were used for sorting tests. Six test groups, each containing 1000 seed samples, were used. The results of the seed-sorting tests are presented in Table 9.
Table 9.
Results of the seed-sorting test.
The number of identified and sorted samples and the actual number of sorted samples were recorded. As shown in Table 8, the artificially broken seed-sorting rate was low at only 88.64%, whereas the rate for mildew seed sorting was better (95.86%). The intelligent seed sorter achieved an average sorting rate of 90.76%, effectively satisfying the seed-sorting requirements.
4. Conclusions
- (1)
- A lightweight YOLOv5n model (FS-YOLOv5n) was constructed. FasterNet was incorporated to replace the backbone network, thereby reducing computational redundancy and memory access. Additionally, an SE attention mechanism was added to enhance the feature extraction and fusion effects. Following these lightweight enhancements, the model demonstrated a reduction of approximately 81% in the number of parameters and floating-point operations compared with the baseline models. The model achieved an mAP of 79.4% and an mF1 of 76.3%.
- (2)
- This study explored the utilization of RGB and high-resolution imaging technology to create an intelligent seed sorter. The key components of the sorter are the transmission, feeding, image acquisition, and seed-screening systems. Through the collection of seed images and application of a target detection model, the multispectral intelligent seed sorter conducts a comprehensive analysis and evaluation of seeds based on color, shape, size, texture, and other characteristics. Subsequently, the sorter assessed the seed quality and accomplished seed sorting using an air-blowing actuator.
- (3)
- Using ‘Zheng Dan 958’ corn seeds as the research object, experiments were carried out to optimize the horizontal distance of seed airflow skew casting and the speed of the conveyor belt by adjusting the air-pump pressure and controller pulse frequency of the intelligent seed sorter. The optimal parameter combination of 0.3 MPa air-pump pressure and 3175 Hz controller pulse frequency was determined based on the test results.
- (4)
- Six test groups (1000 seeds in each group) were quality-identified using the target detection model, and a direct-acting solenoid valve group was used to conduct the corn seed-sorting test. The seed-sorting rate was 90.76%. The sorting machine can effectively satisfy the seed-sorting requirements.
Author Contributions
Conceptualization, Y.F., X.Z., and X.F.; methodology, Y.F. and X.Z.; software, Y.F., C.L., and R.T.; validation, Y.F., X.Z., and X.F.; formal analysis, X.Z.; investigation, X.Z., C.L., and R.T.; resources, X.F.; data curation, C.L. and R.T.; writing—original draft preparation, Y.F. and X.Z.; writing—review and editing, X.Z. and J.L.; visualization, X.Z. and R.T.; supervision, X.F.; project administration, J.L.; funding acquisition, J.L. and X.F. All authors have read and agreed to the published version of the manuscript.
Funding
This research was supported by the earmarked fund for CARS (CARS-23); Hebei province innovation research group project (C2024204246); Baoding city science and technology plan (2372P016).
Data Availability Statement
The datasets used and/or analyzed in the current study are available from the corresponding author upon reasonable request.
Acknowledgments
The authors would like to thank the Xiongxian National Modern Agricultural Industrial Park Seed Quality Testing Center and Xiongxian Modern Agricultural Industry Science and Technology Innovation Center for their help with the provision of experimental equipment for this study.
Conflicts of Interest
The authors declare no conflicts of interest.
References
- Xu, P.; Yang, R.B.; Zeng, T.W.; Zhang, J.; Zhang, Y.P.; Tan, Q. Varietal classification of maize seeds using computer vision and machine learning techniques. J. Food Process Eng. 2021, 44, e13846. [Google Scholar] [CrossRef]
- Chen, M.; Ni, Y.L.; Jin, C.Q.; Xu, J.S.; Zhang, G.Y. Online monitoring method of mechanized soybean harvest quality based on machine vision. Trans. Chin. Soc. Agric. Mach. 2021, 52, 91–98. (In Chinese) [Google Scholar]
- Jiang, P.; Chen, Y.H.; Liu, B.; He, D.J.; Liang, C.Q. Real−time detection of apple leaf diseases using deep learning approach based on improved convolutional neural networks. IEEE Access 2019, 7, 59069–59080. [Google Scholar] [CrossRef]
- Zhang, L.; Wang, D.; Liu, J.C.; An, D. Vis-NIR hyperspectral imaging combined with incremental learning for open world maize seed varieties identification. Comput. Electron. Agric. 2022, 199, 107153. [Google Scholar] [CrossRef]
- Bi, C.G.; Hu, N.; Zou, Y.Q.; Zhang, S.; Xu, S.Z.; Yu, H.L. Development of deep learning methodology for maize seed variety recognition based on improved Swin transformer. Agronomy 2022, 12, 1843. [Google Scholar] [CrossRef]
- Bao, Y.D.; Mi, C.X.; Wu, N.; Liu, F.; He, Y. Rapid classification of wheat grain varieties using hyperspectral imaging and chemometrics. Appl. Sci. 2019, 9, 4119. [Google Scholar] [CrossRef]
- Xu, P.; Tan, Q.; Zhang, Y.P.; Zha, X.T.; Yang, S.M.; Yang, R.B. Research on maize seed classification and recognition based on machine vision and deep learning. Agriculture 2022, 12, 232. [Google Scholar] [CrossRef]
- Ma, R.; Wang, J.; Zhao, W.; Guo, H.J.; Dai, D.N.; Yun, Y.L.; Li, L.; Hao, F.Q.; Bai, J.Q.; Ma, D.X. Identification of maize seed varieties using MobileNetV2 with improved attention mechanism CBAM. Agriculture 2023, 13, 11. [Google Scholar] [CrossRef]
- Jin, S.L.; Zhang, W.D.; Yang, P.F.; Zheng, Y.; An, J.L.; Zhang, Z.Y.; Qu, P.X.; Pan, X.P. Spatial-spectral feature extraction of hyperspectral images for wheat seed identification. Comput. Electr. Eng. 2022, 101, 108077. [Google Scholar] [CrossRef]
- Zhu, S.P.; Zhuo, J.X.; Huang, H.; Li, G.L. Wheat grain integrity image detection system based on CNN. Trans. Chin. Soc. Agric. Mach. 2020, 51, 36–42. (In Chinese) [Google Scholar]
- Cheng, K.; Huang, W.X.; Xie, J.; Guo, Y.L.; Zhou, N.; Pan, Q.H.; Cao, M.L.; Guo, Y.F.; Dai, Z.H.; Wang, B.; et al. On-line inspection system of rice processing quality based on machine vision. Mod. Food 2022, 28, 9–11, 22. (In Chinese) [Google Scholar]
- Zhang, H.; Yan, N.; Wu, X.D.; Wang, C.; Luo, B. Design and experiment of online maize single seed detection and sorting device. Trans. Chin. Soc. Agric. Mach. 2022, 53, 159–166. (In Chinese) [Google Scholar]
- Zhang, F.; Zhang, C.C.; Chen, Z.J.; Teng, S.; Xu, R.L. Application of spectral testing technology in seed quality testing. Chin. Agric. Mech. 2021, 42, 109–114. (In Chinese) [Google Scholar]
- Wang, D.; Wang, K.; Wu, J.Z.; Han, P. Progress in research on rapid and non-destructive detection of seed quality based on spectroscopy and imaging technology. Spectrosc. Spectr. Anal. 2021, 41, 52–59. [Google Scholar] [CrossRef]
- Huang, B.S.; Liu, J.; Jiao, J.Y.; Lu, J.; Lv, D.J.; Mao, J.W.; Zhao, Y.J.; Zhang, Y. Applications of machine learning in pine nuts classification. Sci. Rep. 2022, 12, 8799. [Google Scholar] [CrossRef]
- Wang, L.B.; Liu, J.Y.; Zhang, J.; Wang, J.; Fan, X.F. Corn seed defect detection based on watershed algorithm and two−pathway convolutional neural networks. Front. Plant Sci. 2022, 13, 730190. [Google Scholar] [CrossRef]
- Kumar, C.; Mubvumba, P.; Huang, Y.; Dhillon, J.; Reddy, K. Multi-Stage Corn Yield prediction using high-resolution UAV multispectral data and machine learning models. Agronomy 2023, 13, 1277. [Google Scholar] [CrossRef]
- Fan, X.F.; Wang, L.B.; Liu, J.Y.; Zhou, Y.H.; Zhang, J.; Suo, X.S. Corn seed appearance quality estimation based on improved YOLO v4. Trans. Chin. Soc. Agric. Mach. 2022, 53, 226–233. (In Chinese) [Google Scholar]
- Meng, F.J.; Luo, S.; Sun, H.; Li, M.Z. Design and experiment of real-time detection and sorting device for maize seeds. Trans. Chin. Soc. Agric. Mach. 2021, 52, 153–159, 177. (In Chinese) [Google Scholar]
- Chen, J.R.; Kao, S.H.; He, H.; Zhuo, W.P.; Wen, S.; Lee, C.H.; Gary, S.H. Run, Don’t Walk: Chasing Higher FLOPS for Faster Neural Networks. arXiv 2023, arXiv:2303.03667. [Google Scholar]
- Zhang, Y.F.; Ren, W.Q.; Zhang, Z.; Jia, Z.; Wang, L.; Tan, T.N. Focal and efficient IOU loss for accurate bounding box regression. Neurocomputing 2022, 506, 146–157. [Google Scholar] [CrossRef]
Disclaimer/Publisher’s Note: The statements, opinions and data contained in all publications are solely those of the individual author(s) and contributor(s) and not of MDPI and/or the editor(s). MDPI and/or the editor(s) disclaim responsibility for any injury to people or property resulting from any ideas, methods, instructions or products referred to in the content. |
© 2024 by the authors. Licensee MDPI, Basel, Switzerland. This article is an open access article distributed under the terms and conditions of the Creative Commons Attribution (CC BY) license (https://creativecommons.org/licenses/by/4.0/).