Article

Supplemental Irrigation with Recycled Drainage Water: Outcomes for Corn and Soybean in a Fine-Textured Soil

by
Ali R. Niaghi
1,
Axel Garcia y Garcia
2,3 and
Jeffrey S. Strock
3,4,*
1
Global R&D, PepsiCo., St. Paul, MN 55108, USA
2
Department of Agronomy and Plant Genetics, University of Minnesota, St. Paul, MN 55108, USA
3
Southwest Research and Outreach Center, University of Minnesota, Lamberton, MN 56152, USA
4
Department of Soil, Water, and Climate, University of Minnesota, St. Paul, MN 55108, USA
*
Author to whom correspondence should be addressed.
Agronomy 2024, 14(9), 1948; https://doi.org/10.3390/agronomy14091948
Submission received: 7 June 2024 / Revised: 23 August 2024 / Accepted: 27 August 2024 / Published: 29 August 2024

Abstract

:
Drought and heavier spring storms from climate change will increase crop water stress and affect productivity. A study was conducted to determine whether supplemental irrigation on fine-textured soils with recycled drainage and surface runoff water, combined with nitrogen (N) management, could mitigate these effects. This study was set as a randomized complete block design in a split-plot arrangement with three replicates. The main plots, which were individually drained, corresponded to three water management strategies (full irrigation, limited irrigation, and rainfed), and the subplots corresponded to six N rates (0, 90, 134, 179, 224, and 269 kg/ha) in the corn phase of the rotation. In the soybean phase, the same water management strategies were uniformly applied across the subplots. Irrigation and drainage water, volumetric soil water content (SWC), and grain yield data were collected. The full irrigation significantly increased the SWC in the top 60 cm of the soil across crops during the driest year, where it increased by an average of 30% compared with the rainfed conditions. The limited irrigation increased the SWC in the top 20 cm only for the soybean during the driest year, where it increased by as much as 25%. As a result, the supplemental irrigation prevented yield reduction in one year. While the irrigation alone did not significantly affect the grain yield of either crop, the irrigation × N interaction for the corn was consistently significant, which suggests that the N effectively enhanced the corn productivity. The results suggest that reusing drainage water could be a valuable practice for reducing the effects of limited soil water on crops in fine-textured soils.

1. Introduction

In the Midwest Corn Belt region, the annual rainfall is roughly in balance with the crop water use. However, rainfall does not always occur with the timing or amount needed by crops. Seasonal variation in rainfall requires the drainage of excess water in the spring and during seasonally heavy rainfall events, while a water deficit often exists during summer months when the crop water demand is highest [1]. The amount of annual rainfall has been increasing across many regions of the country, including the Midwest [2,3,4]. Nonetheless, rainfall variability is also increasing, which leads to more extreme events, such as drought and flooding [5,6]. Seasonal excess water can result in yield loss, and where artificial drainage is present, water can be lost from the field. This reduces the potential for beneficial crop use and contributes to downstream damage from peak flows and water quality degradation due to increased nutrient transport. Longer dry spells and sustained droughts, combined with heavier spring storms, are expected to significantly affect corn (Zea mays L.) and soybean [Glycine max (L.) Merr.] productivity through increased water stress and a reduced number of working days [1,7].
Corn and soybean grain yields in the Midwest are frequently high when the available soil moisture and growing season rainfall are sufficient. Improvements in crop genetics, management practices, and updated knowledge have dramatically increased crop production in recent decades [8]. However, the likelihood of continuing improvement and yield trajectory is uncertain [9]. Water availability during periods of high crop water demand plays a crucial role in crop production. Increasing demand has led corn and soybean producers in the Midwest to seek options for coping with unpredictable weather conditions during the growing season through managing available water.
Artificial drainage is a critical part of agricultural water management worldwide [10,11]. In the U.S. upper Midwest region, where a shallow water table and fine-textured, poorly drained soil restrict agricultural activities, artificial drainage is a necessary practice [12] that benefits the overall agroecosystem, including improved nitrogen (N) use in corn [13]. The essential functions of these drainage systems are to prevent flooding through the rapid removal of surface and excess soil water, lower the water table to prevent crop stress, and create suitable conditions for field operations. The high water-holding capacity of fine-textured Mollisols, which is a predominant soil taxonomic order in the region, is an intrinsic characteristic for producers to improve production conditions while adjusting to extreme weather circumstances. Using the water storage capacity of fine-textured soil and maintaining an adequate level of soil moisture can significantly improve crop production. Soil properties, such as the texture, fertility, organic matter, and available water, can have a significant effect on corn yield [14,15].
Adaptation to climate change requires significant improvement in water conservation, as well as investment in strategies to overcome the water deficit during the growing season. Such options include planting date flexibility, selection of drought-tolerant genotypes, reduced tillage, or supplemental irrigation. Research revealed that the drought sensitivity of corn has increased due to rising yields, which leads to planting more plants per unit area, which consequently result in less available soil water for each plant [16]. Drainage water storage and reuse was proposed as a crop production, conservation, and mitigation strategy in the U.S. Midwest and other regions [17]. Global-scale analysis revealed that the use of captured and stored water for supplemental irrigation can increase the grain yield from 19% to 35% [18,19]. However, limited research was conducted to determine the potential of enhancing the volumetric soil water content (SWC) and grain yield through supplemental irrigation using recycling drainage and surface runoff in the upper Midwest region, especially in Minnesota. As water resources come under higher demand for municipal and industrial use, limits on agricultural use, including irrigation, are expected.
Limited reports exist regarding the potential effects of supplemental irrigation on the highly productive yet poorly drained soils characteristic of the Midwest, as well as on the possible water quality improvements that result from such a practice. A negative correlation between yield and drought stress was observed during the early- and mid-reproductive growth stages of corn in the U.S. Midwest [20]. Despite considerable effort in breeding drought-tolerant crops, success has been limited [21]. Benefits, however, could be substantial since water is a yield-limiting factor during summer, even in this relatively humid region [22,23]. Supplemental irrigation is considered an effective technology for reducing the inter-annual yield variability associated with insufficient soil water [24]. Previous studies in the U.S. Midwest showed significantly lower achievable yields under rainfed conditions compared with irrigated conditions [4]. The average annual productivity of rainfed cropland in the Midwest is typically 50% less than the potential yield due to the sensitivity of crops to water stress [25]. A study conducted in west central Minnesota demonstrated that supplemental irrigation of fine-textured soil can enhance corn production by 6.4% during a dry season [15]. The study also revealed that a single application of supplemental irrigation at the tasseling and reproductive stages may be sufficient for crop needs in fine-textured soil, which was capable of storing 350 to 450 mm of water in the top 2 m of soil. The use of recycled drainage water for supplemental irrigation within tile-drained land in Missouri and Ohio showed a yield increase of 14% for corn and 7% for soybean compared with conventional free drainage [26,27]. A single application of 20 mm to 80 mm of water through irrigation increased the corn yield by 3–35 and 5–35% for sandy and clay soils, respectively, across different irrigation dates compared with rainfed conditions [28].
The objectives of this study were to assess the potential benefits of supplemental irrigation on fine-textured soils by determining whether (i) it can mitigate the soil water deficit on corn and soybean productivity, (ii) affect the tile drainage, and (iii) either prevent a yield reduction or enhance the crop productivity during periods of seasonal drought.

2. Materials and Methods
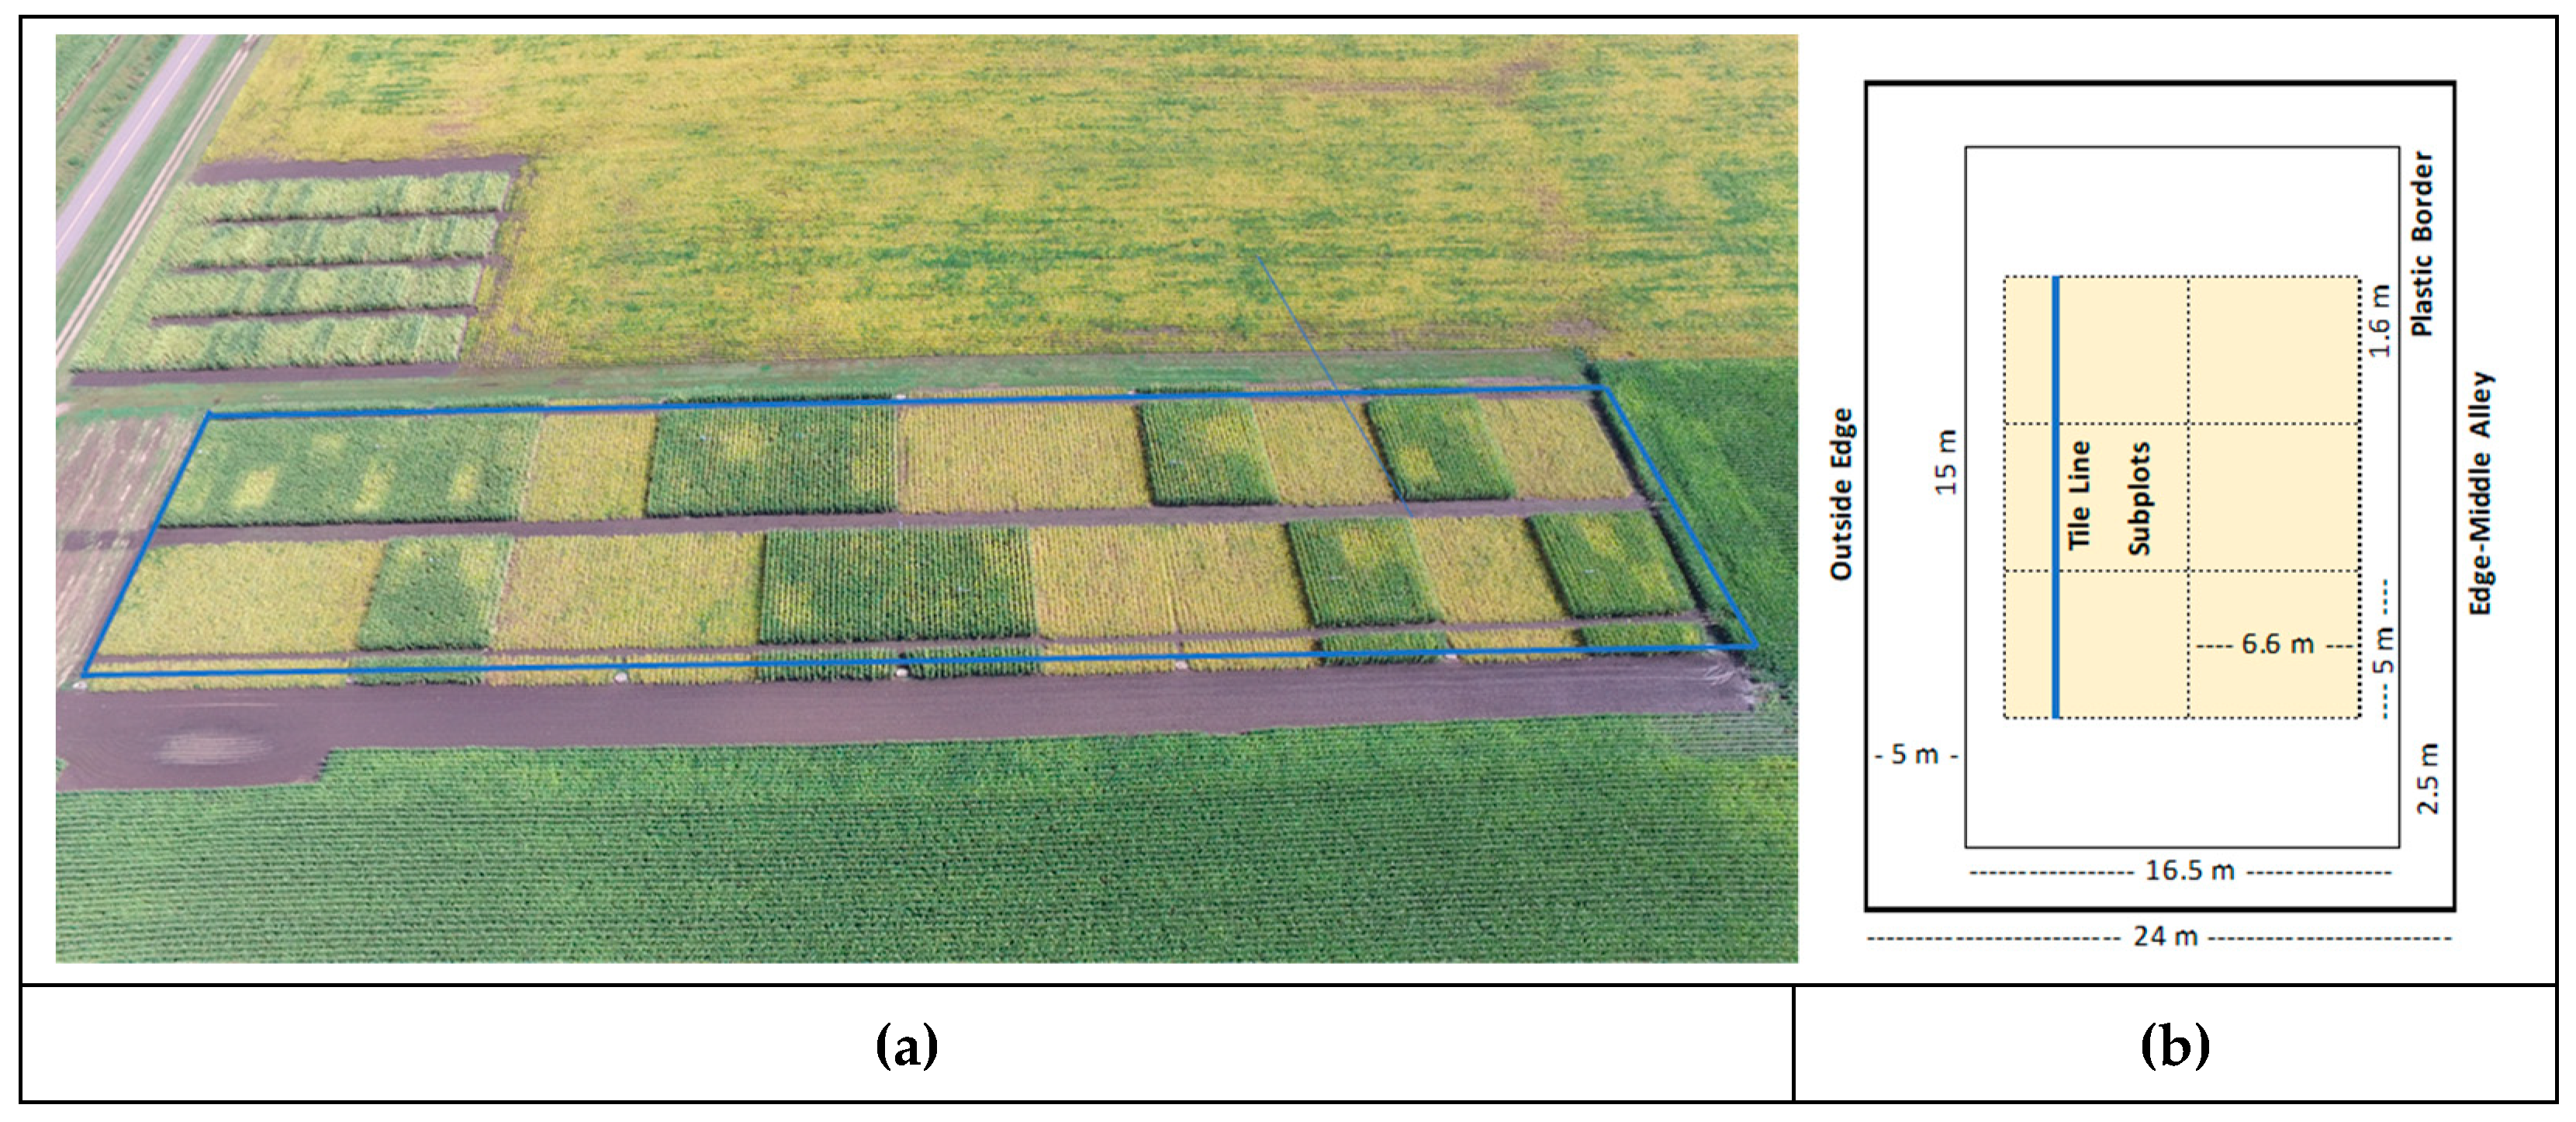
2.1. Study Site

A field experiment was conducted at the University of Minnesota Southwest Research and Outreach Center (SWROC) near Lamberton, MN, USA, during the 2016 to 2019 growing seasons. The soil of the experimental site was characterized as Normania clay loam, fine-loamy, mixed, superactive, mesic Aquic Hapludolls, and moderately well-drained [29]. The region has a continental climate with long cold winters averaging −6 °C, moderately hot summers averaging 20 °C, and a long-term average (LTA) annual rainfall of 727 mm.

2.2. The Experiment

The experiment was conducted in both phases of a corn–soybean rotation. This study was set as a randomized complete block design in a split-plot arrangement with three replicates. Main plots, which were individually drained, corresponded to three water management strategies (full irrigation, limited irrigation, and rainfed) and subplots corresponded to six N rates (0, 90, 134, 179, 224, and 269 kg/ha) in the corn phase of the rotation. In the soybean phase, the same water management strategies were applied uniformly across the subplots. The plots were surrounded to a depth of 1.8 m with a plastic barrier for hydrological isolation from seepage and lateral flow. Each plot was equipped with an artificial drainage system with 100 mm corrugated plastic tubing installed at a 1.2 m depth and an effective drain spacing of 27 m.
Water for supplemental irrigation was obtained from a farm pond (Figure 1a) that received runoff, seepage, and subsurface drainage water. Irrigation treatments included full, limited, and rainfed (control) with three replications. Corn plots were divided into six subplots, with each representing a nitrogen (N) rate, including 0 (control), 90, 134, 179, 224, and 269 kg/ha (Figure 1b) during four growing seasons (2016–2019). Corn (DKC52–84RIB; 86,000 seeds/ha) and soybean (Asgrow 2035; 400,000 seeds/ha) were planted on cultivated plots in May in 76 cm wide rows to a depth of 5 cm with a 4-row planter (John Deere, 1700; Moline, IL, USA), and harvested in October (Table 1).
The SWC was obtained in all plots to a depth of 1 m (10, 20, 30, 40, 60, and 100 cm) using a PR2/6 multi-depth soil moisture probe (Delta-T, Cambridge, UK) on a weekly basis. Single-access tubes with a 27 mm internal diameter were installed in each plot using a hydraulic probe. The ranges of the SWC at saturation, field capacity, and permanent wilting point were 49–52%, 24–36%, and 17–25%, respectively. The average bulk density and porosity of the soil profile were 1.45 and 0.45 g cm−3, respectively. The amount of subsurface drainage outflow was monitored for each plot and measured manually during the growing season. The drain flow was measured up to five times per week depending on the drain flow conditions. The corn and soybean grain yield was obtained from the middle two rows of each plot using a two-row plot combine (Almaco Inc., Nevada, IA, USA), with yield results reported at 15.5% and 13% water content bases, respectively. Weather data were collected from an automated weather station installed at the experimental site.

2.3. Supplemental Irrigation

On-surface drip irrigation was used to deliver water to each experimental plot from a collecting pond that received runoff and drainage from a 146 ha watershed. Irrigation water was delivered to every other row at a rate of 2.8 mm/hr. The full irrigation treatment received water as needed throughout the entire growing season. Irrigation was applied from the V14 (14th leaf with a visible collar) to R2 (blister) phenological stages in the corn, which is the most water-sensitive period for yield losses [30], and the R3 to R6 (beginning pod to full seed) phenological stages in soybean.
The water requirements of crops corresponded to a management-allowable depletion of 50% of the total soil available water in the rooting zone based on data collected with a PR2 probe (Delta-T, Cambridge, UK). The timing for irrigation varied greatly; irrigation water was applied during the 2016 and 2017 study years only because no irrigation was needed in 2018 and 2019 due to the above average rainfall (Table 2).

2.4. Statistical Analysis

Less than 3% of missing data were estimated using an artificial neural network (ANN) model, which better fitted the non-linear relations regarding the nature of the soil moisture [31]. The ANN model was fitted using JMP Pro 14.0 (JMP Pro 14.0, SAS Institute Inc., Cary, NC, USA). An analysis of variance was performed for the replicated measurements using R statistical software v.4.2.3 [32], along with lme4 and emmeans packages. Significant differences between treatments were identified using a mixed model at p < 0.10 for both within year and across year. For a condition where the dataset did not follow a normal distribution, the data were transformed using a log transformation, and a normality test was performed using the Shapiro–Wilk test of residuals. The relationship between the crop yield and irrigation, nitrogen levels, and SWC were developed to estimate the final effect on the corn grain and soybean yield by considering the plot as a random effect and month, irrigation, and nitrogen as fixed effects.

3. Results

3.1. Weather Conditions during the Study Years

All study years were wetter than the long-term average (LTA) during the growing season. The amounts of off-season (Oct.–Apr.) rainfall were 25, 18, 3, and 78% higher than the LTA in 2016, 2017, 2018, and 2019, respectively. The May–September growing season was wetter than the LTA in most study years, except for 2017. The year 2017 received 9% less rainfall than the LTA but winter and the end of spring (June) and summer (September) resulted in drier conditions compared with the other study years. The distribution of rainfall among the study years was highly variable and illustrated a trend of conditions wetter than the LTA in spring and summer (Table 3).

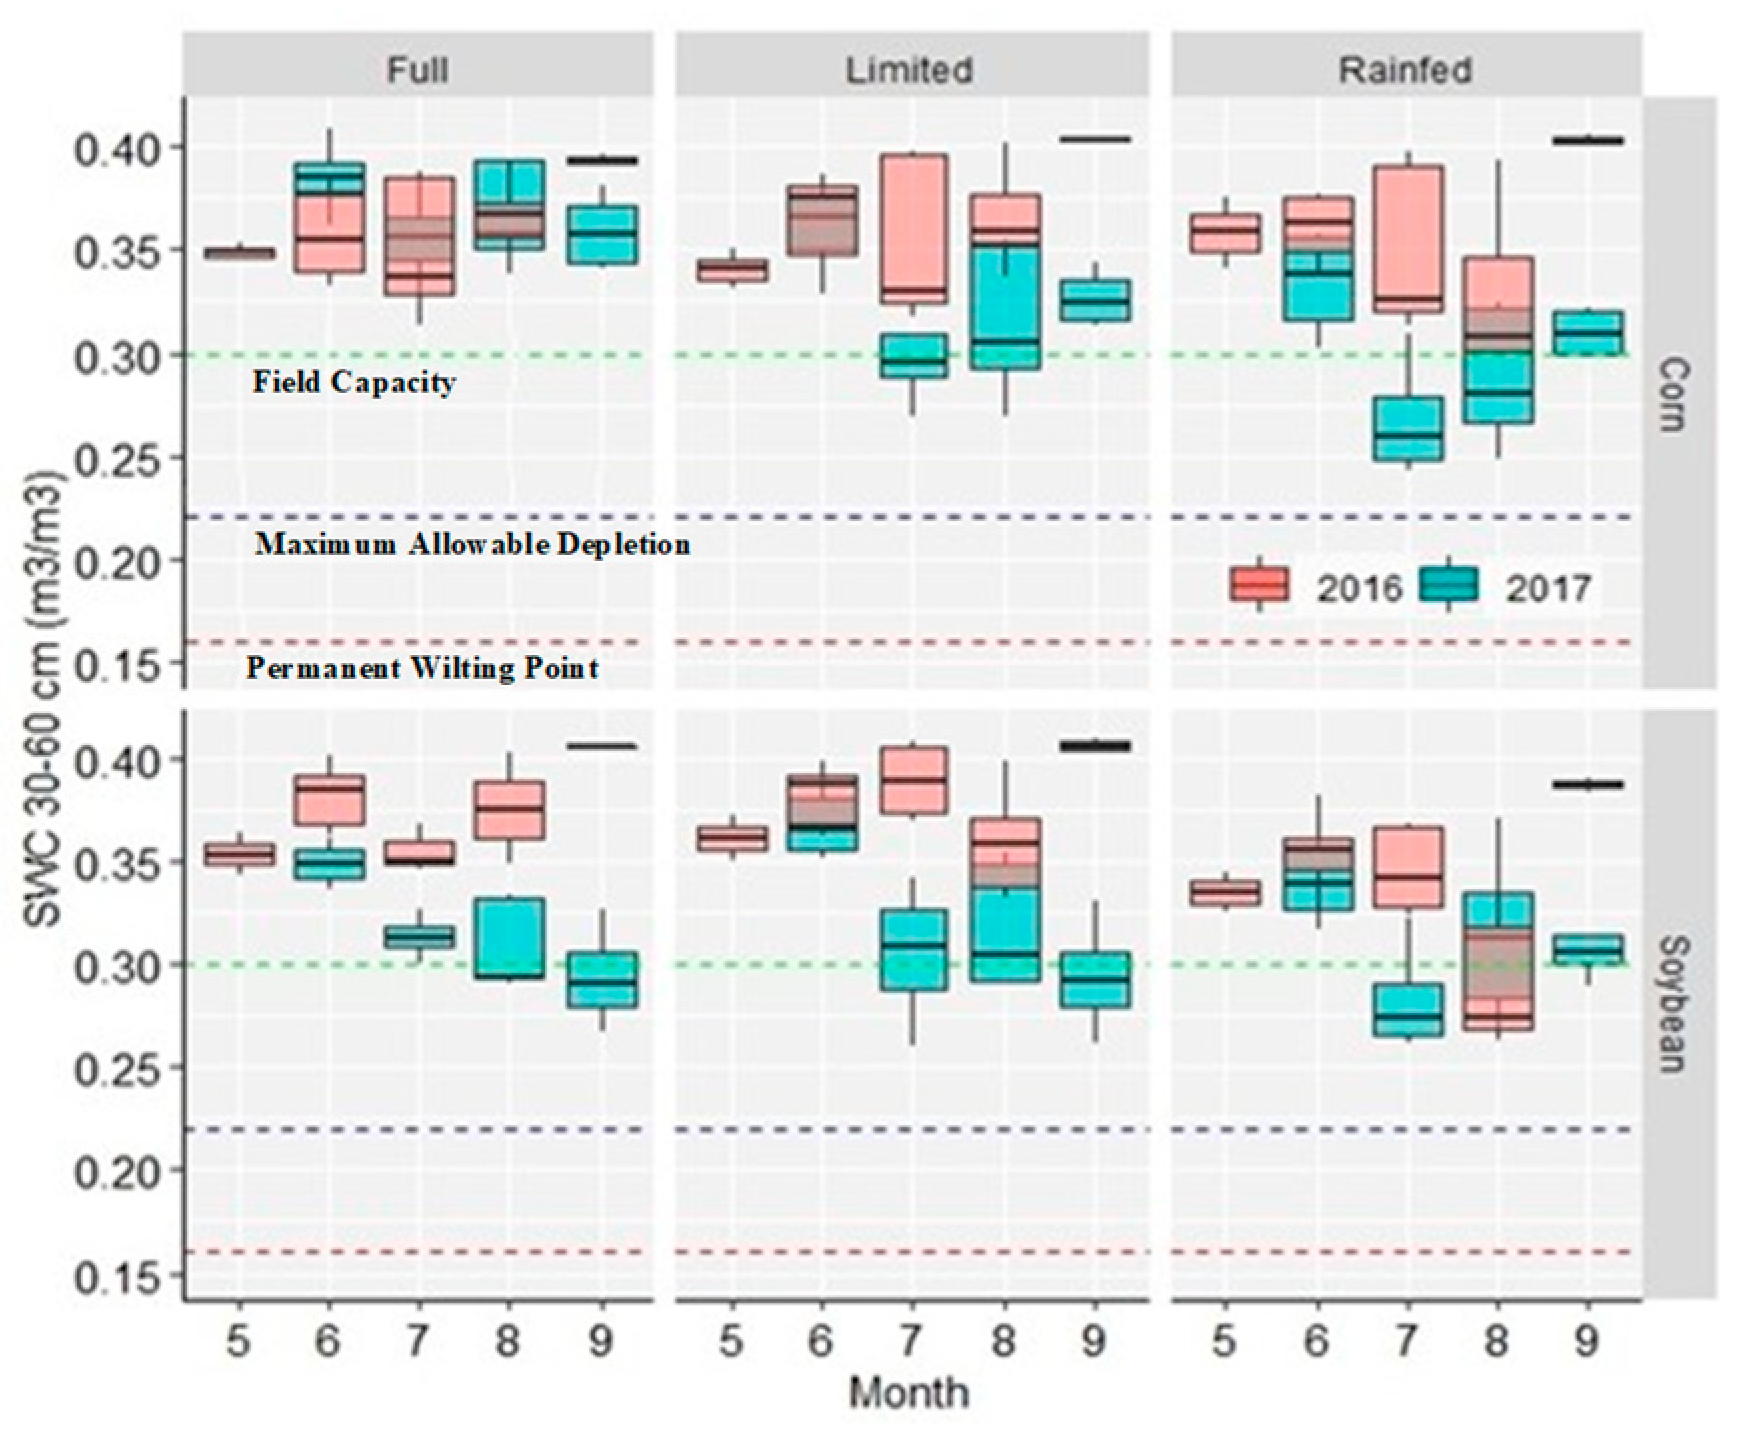
3.2. Irrigation and Soil Water Content

Soil moisture was mostly affected by the timing (month) during each of the study years. Of the two years when water was supplied, supplemental irrigation significantly affected the SWC only during the 2017 growing season (Table 4). Due to the wet conditions in 2018 and 2019, no irrigation was applied. A total of 73 mm more rainfall was received in July 2016 compared with July 2017, which translated into 8.5% and 11.5% greater SWC for corn and soybean, respectively. The soil water content in the 0–20 and 30–60 cm layers for the rainfed corn in July was 63% and 30% higher in 2016 compared with 2017, respectively. Also, the SWC in the rainfed soybean was 30% and 20% higher in 2016 compared with 2017 in the 0–20 and 30–60 cm layers, respectively. The results suggest that additional water through irrigation created a better soil moisture condition and prevented crop yield reduction.
Overall, the full irrigation showed the highest SWC and kept it closer to field capacity, thus effectively maintaining optimal soil moisture levels for both crops, which ensured stability throughout the growing season. Under limited irrigation, the SWC varied more but remained above the maximum allowable depletion, which provided sufficient mitigation against soil moisture deficits, though not as consistent as full irrigation. The rainfed conditions showed the lowest SWC compared with the full and limited irrigation, with variability similar to the limited irrigation, but consistently stayed above the maximum allowable depletion, which suggests resilience but also potential stress for crops during dry spell periods. Even with the application of a limited amount of water in 2017 (59/33 and 59/12 mm for the full/limited irrigation of corn and soybean, respectively), the soil profile was recharged up to or above the field capacity (Figure 2).
The full irrigation maintained the SWC close to or above the field capacity for both crops, with slight year-to-year variations observed for the soybean. The SWC remained relatively stable throughout the growing season under full irrigation, with minor fluctuations between months and years, mainly in the corn plots. The limited irrigation generally kept the SWC lower than the full irrigation but above the maximum allowable depletion level, although with some variability across the months and years. The rainfed plots for both crops exhibited a lower SWC compared with the full and limited irrigation treatments; however, the SWC remained above the maximum allowable depletion threshold. Almost 70% of crop water uptake occurred from the top 60 cm of soil. Our results agree with previous studies reporting that the highest percentage of water requirement for corn is obtained in the 30–60 soil layer [33]. The variability in the rainfed plots was comparable with the limited irrigation, with occasional decreases in the SWC but consistently above the critical thresholds (Figure 2).
The SWC increase due to irrigation showed some variability between the corn and soybean plots, with no consistent pattern favoring one over the other. On average, in early August of 2016, the full irrigation increased the SWC in the 0–20 and 30–60 cm layers by 36% (0.05 m3/m3) and 12% (0.04 m3/m3) for the corn and by 25% (0.03 m3/m3) and 28% (0.08 m3/m3) for the soybean compared with the rainfed condition, respectively. In early August, the limited irrigation increased the SWC in the 0–20 and 30–60 cm layers by 14% (0.02 m3/m3) and 9% (0.03 m3/m3) for the corn and decreased it by 17% (−0.02 m3/m3) and increased it by 24% (0.07 m3/m3) for the soybean, respectively. In July 2017, the drier year, the effect of supplemental irrigation was more apparent. Compared with the rainfed condition, the SWCs in the 0–20 and 30–60 cm layers were increased by 55% and 30% for the full irrigation and approximately 18% and 11% for the limited irrigation, respectively (Table 5). As a result, the irrigated plots showed higher SWCs compared with the rainfed treatment, which reflected the effect of irrigation in increasing the SWC.

3.3. Irrigation and Drainage Flow

The drain flow was slightly higher from the soybean plots in 2017 due to later planting that allowed for less evapotranspiration and more drainage. Overall, however, the high water-holding capacity of the fine-textured soil seems to have provided additional water to crops with minimal to no additional drainage flow. In fact, the average monthly drain flow was similar between the irrigated plots (Figure 3). Yet, the drain flows during the 2018 and 2019 wet years were much greater than those from 2016 and 2017, which resulted in lower yields, which was mainly due to excess water.

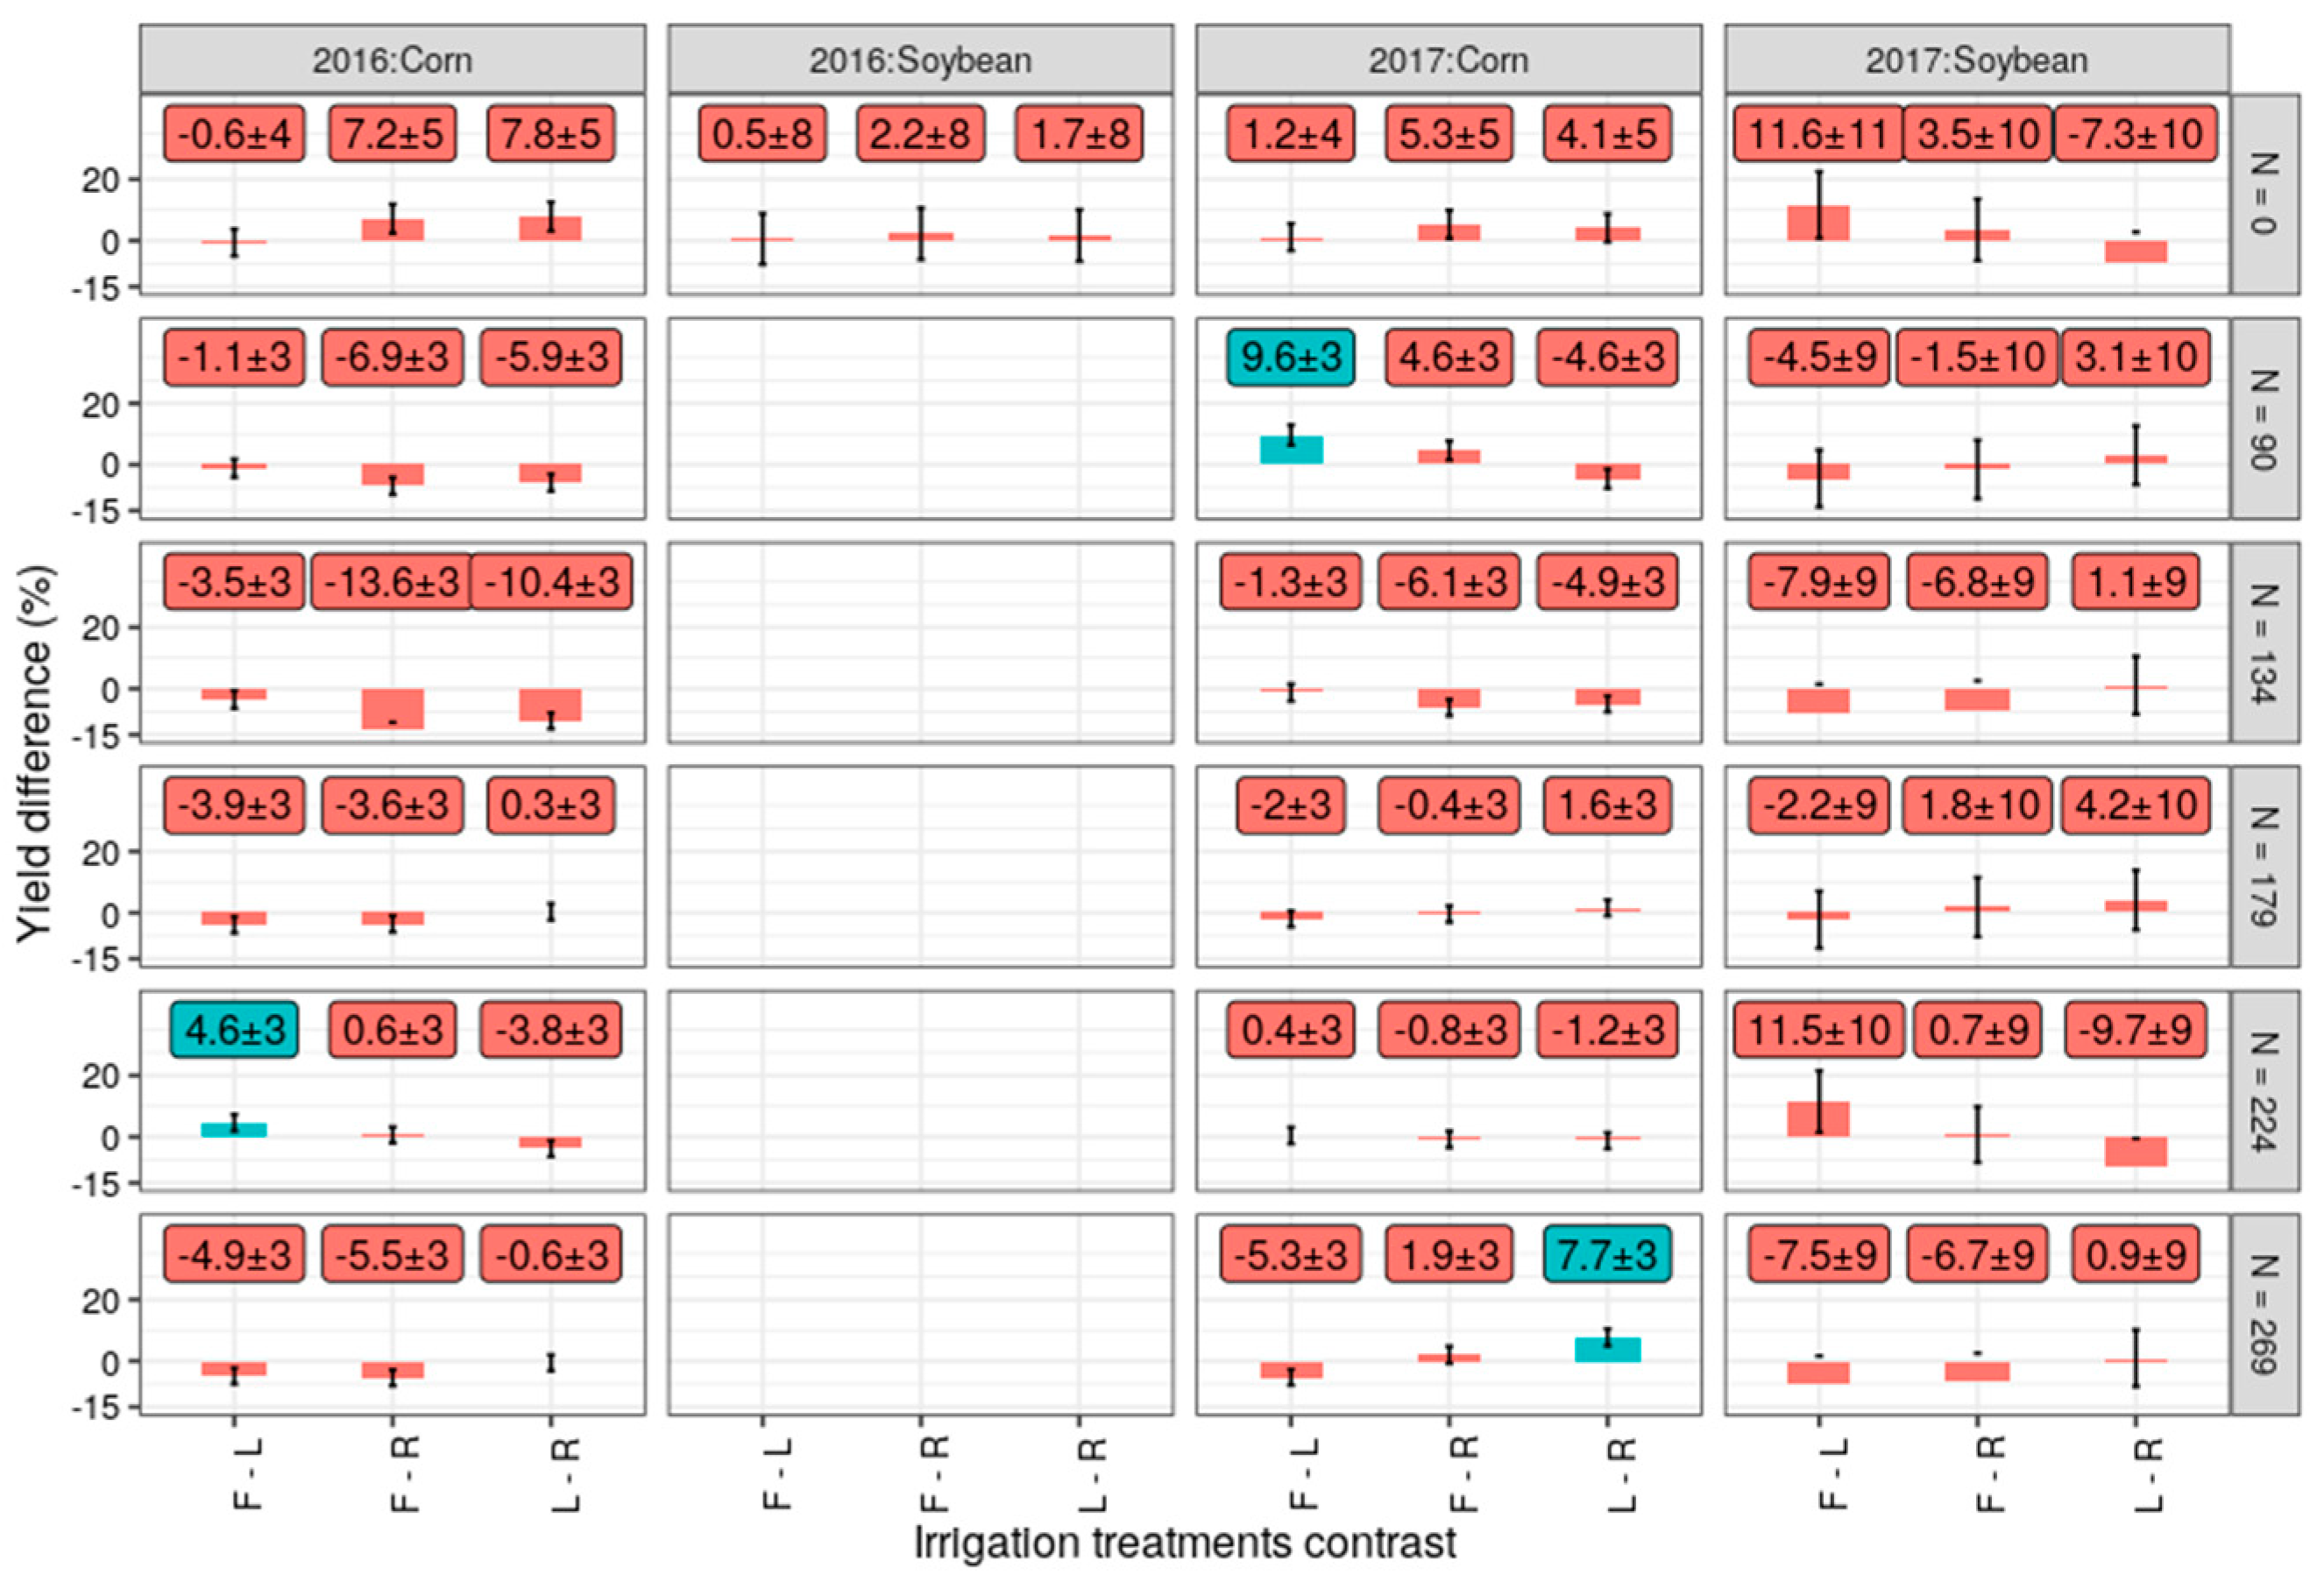
3.4. Irrigation, Nitrogen, and Yield of Crops

The yield of corn was significantly affected by N and the irrigation × N interaction. Irrigation did not affect the yield of both the corn and soybean in 2016 and 2017 (Table 6). The rainfall in July 2017, when most irrigation occurred, was 73 mm less than in 2016 during the same period, which indicates that the supplemental irrigation might have prevented water stress, and eventually a yield reduction. Nevertheless, the irrigated yield showed a lower standard deviation compared with the rainfed yield, which suggests that, indeed, the supplemental irrigation helped to reduce the inter-annual variability of the crop yield due to limited water. This was in agreement with research that showed that supplemental irrigation with subsurface drainage water enhanced the yield stability of corn in the humid U.S. Midwest [34]. The yield of corn and soybean during the 2018 and 2019 growing seasons were negatively affected by excess rainfall, which resulted in lower productivity than the previous two years.
Although not statistically significant, the fully irrigated corn yield was 7.2% higher than the rainfed corn yield in 2016, even when N was not applied (0 N treatment). In 2016, the average yields of corn without N fertilizer from the limited and full irrigated plots were 0.66 MT/ha (7.8%) and 0.60 MT/ha (7.2%) higher compared with the rainfed corn yield, respectively. The yield of the fully irrigated soybean in 2016 was slightly higher (3.5%) than the yield of the rainfed plots.
Although the irrigation did not affect crop yields, the irrigation × N interaction in corn showed a statistically significant difference in the yield for some treatments. The corn yield without N fertilization was higher when irrigated than rainfed, which provides evidence of the importance of water as a limiting factor to productivity in the humid continental climate of the U.S. upper Midwest. Except for the 0 N treatment, the irrigated and rainfed yields differed for most of the N-fertilized treatments, particularly at higher N rates. The yield differences were reduced at higher N rates for both the irrigated and rainfed treatments and, in some instances, resulted in significant differences. Despite its sensitivity to waterlogging conditions [35] and water use similar to corn [36], the soybean productivity was not affected by the high soil moisture (Figure 4).

4. Discussion

In this study, supplemental irrigation to corn and soybean grown in the humid, continental climate of the U.S. upper Midwest was applied in two (2016 and 2017) out of four years of this study. The rainfall in 2018 and 2019 was above the LTA, and thus, no irrigation was needed. The slightly drier soil conditions that followed the artificial drainage during the irrigated years and the increased crop evapotranspiration in July and August, which was a period of active crop growth, led to less-than-optimal soil water conditions that ultimately reduced the yields of the crops.
Supplemental irrigation affected the SWC in both the full and limited irrigation treatments compared with the rainfed treatment during the irrigated years. The significant effect of timing (month) on soil moisture during each of the study years clearly reflected the dynamics of soil water due to crop growth and water uptake. Alone, the average soil moisture of the seasonally shallow water table conditions and fine-textured soil of the experimental site might have underestimated the effect of supplemental irrigation. Supplemental irrigation in 2017, for example, brought the soil profile to or above the field capacity in both the corn and soybean plots. These results suggest that additional water through supplemental irrigation created a better soil moisture condition and prevented crop yield reductions during the irrigated years.
The drain flow patterns in 2017 showed variability under different irrigation treatments, with no consistent evidence to suggest that it was higher under a specific crop. Full irrigation generally resulted in higher drain flow compared with the limited and rainfed treatments. The rather high water-holding capacity of the fine textured Mollisols of the study site might have provided additional water to the crops with minimal to no additional drainage flow. Compared with 2016 and 2017, the drain flow during the 2018 and 2019 wet years was greater and resulted in lower corn and soybean yields.
The irrigated yields of corn and soybean was less variable (lower standard deviation) than those in rainfed plots, which suggests that, indeed, the supplemental irrigation helped to reduce the inter-annual variability of crops productivity due to limited water. In fact, it has been reported that supplemental irrigation is an economically viable practice [4] in the region, so much so that the corn yield can be increased if supplemental irrigation in fine-textured soils is practiced from mid-season [15]. A study conducted in Nebraska, USA, reported that 16% of a corn yield increase was due to the cooling effect of irrigation, while 84% was due to the water amount supplied [37]. A study on a single irrigation over different irrigation dates, especially early to mid-July in clay soil with a water amount to refill soil water storage of the active root zone to field capacity, reported that corn yield increases varied from 5 to 35% compared with a rainfed condition [28]. Similar to our findings, the combined effect of drainage and supplemental irrigation was reported to have increased soybean yield up to 1200 kg/ha compared with a drained-only field [26]. Using wetland reservoir sub-irrigation systems in a field with a high clay content and low hydraulic conductivity soils was reported to have improved the yield of corn, but not soybeans [27]. These research results strongly support the premise that supplemental irrigation benefits sustainable crop production in the U.S. Midwest [4].
The irrigation did not affect the yields of the crops but the irrigation × N interaction affected the yield of corn. The irrigated corn without N fertilization produced a higher yield than without irrigation, which evidences the importance of water as a limiting factor to growth in the humid continental climate of the U.S. upper Midwest. Except for the plots without N fertilizer, the irrigated corn showed yield differences compared with the rainfed, N-fertilized plots. The highest yield decrease for the irrigated corn was observed in plots with N rates at 90 and 134 kg/ha. In some instances, differences in the yield of irrigated and rainfed corn at higher N rates was significantly different.

5. Conclusions

A 4-year experiment was conducted to study the effect of supplemental irrigation on the yields of corn and soybean grown in fine textured soils with the idea of using drainage water. Irrigation was needed in two of the four study years. Despite the very wet conditions during the 2018 and 2019 growing seasons, our analysis allowed for advancing our understanding of the response of both crops to supplemental water in the wet, continental climate of the U.S. upper Midwest.
Supplemental irrigation significantly increased the soil moisture compared with rainfed plots. Overall, SWC was greater in corn compared with soybean in the top 20 cm but similar in the 30–60 cm soil layer. The drainage flow was not affected by supplemental irrigation in both crops but tended to be slightly higher in the soybean plots during the 2017 season, which was the most irrigated year.
The results from this study show that although there was no significant increases in grain yield, supplemental irrigation seems to have prevented yield reduction in one of the irrigated years. Such results suggest that reusing drainage water could be a valuable practice to reduce the effects of limited soil water on crops in fine-textured soils.
Further studies may consider plant-available N in tile-drainage water, as well as the uniformity and frequency of irrigation, in an effort to develop sustainable practices.

Author Contributions

Conceptualization, J.S.S.; software, J.S.S.; validation, A.G.y.G. and J.S.S.; formal analysis, A.R.N.; investigation, A.R.N. and J.S.S.; resources, A.G.y.G. and J.S.S.; data curation, A.R.N.; writing—original draft, A.R.N.; writing—review and editing, A.G.y.G. and J.S.S.; visualization, A.R.N. and A.G.y.G.; funding acquisition, J.S.S. All authors have read and agreed to the published version of the manuscript.

Funding

This material was based upon work that was supported by the National Institute of Food and Agriculture, U.S. Department of Agriculture, under award number 2015-68007-23193, “Managing Water for Increased Resiliency of Drained Agricultural Landscapes”, http://transformingdrainage.org (accessed on 26 August 2024). Any opinions, findings, conclusions, or recommendations expressed in this publication are those of the author(s) and do not necessarily reflect the view of the U.S. Department of Agriculture.

Data Availability Statement

The raw data supporting the conclusions of this article will be made available by the authors on request.

Acknowledgments

We would like to express our gratitude to the numerous technicians and summer interns for their assistance with this research.

Conflicts of Interest

Author Ali R. Niaghi was employed by the company PepsiCo. The remaining authors declare that the research was conducted in the absence of any commercial or financial relationships that could be construed as a potential conflict of interest. The funders had no role in the design of this study; in the collection, analyses, or interpretation of data; in the writing of this manuscript; or in the decision to publish the results.

References

  1. Walthall, C.L.; Hatfield, J.; Backlund, P.; Lengnick, L.; Marshall, E.; Walsh, M.; Adkins, S.; Aillery, M.; Ainsworth, E.A.; Ammann, C.; et al. Climate Change and Agriculture in the United States: Effects and Adaptation. In USDA Technical Bulletin 1935; Cambridge University Press: Cambridge, UK, 2013. [Google Scholar] [CrossRef]
  2. Melillo, J.M.; Richmond, T.C.; Yohe, G.W.; US Government Printing Office. Climate Change Impacts in the United States: Highlights; Cambridge University Press: Cambridge, UK, 2014; ISBN 9780160924033.
  3. Marshall, E.; Aillery, M.; Malcolm, S.; Williams, R. Agricultural Production under Climate Change: The Potential Impacts of Shifting Regional Water Balances in the United States. Am. J. Agric. Econ. 2015, 97, 568–588. [Google Scholar] [CrossRef]
  4. Baker, J.M.; Griffis, T.J.; Ochsner, T.E. Coupling Landscape Water Storage and Supplemental Irrigation to Increase Productivity and Improve Environmental Stewardship in the U.S. Midwest. Water Resour. Res. 2012, 48. [Google Scholar] [CrossRef]
  5. Hatfield, J.L.; Prueger, J.H. Temperature Extremes: Effect on Plant Growth and Development. Weather Clim. Extrem. 2015, 10, 4–10. [Google Scholar] [CrossRef]
  6. Pryor, S.C.; Scavia, D.; Downer, C.; Gaden, M.; Iverson, L.; Nordstrom, R.; Patz, J.; Robertson, G.P. Midwest. Climate Change Impacts in the United States: The Third National Climate Assessment. In U.S. Global Change Research Program; Melillo, J.M., Richmond, T.C., Yohe, G.W., Eds.; National Climate Assessment: Washington, DC, USA, 2014; pp. 418–440. [Google Scholar] [CrossRef]
  7. Ort, D.R.; Long, S.P. Limitson Yields in the Corn Belt. Science 2014, 344, 484–485. [Google Scholar] [CrossRef] [PubMed]
  8. Tannura, M.A.; Irwin, S.H.; Good, D.L. Weather, Technology, and Corn and Soybean Yields in the U.S. Corn Belt. SSRN Electron. J. 2011. [Google Scholar] [CrossRef]
  9. Long, S.P.; Ort, D.R. More than Taking the Heat: Crops and Global Change. Curr Opin Plant Biol. 2010, 13, 240–247. [Google Scholar] [CrossRef]
  10. Peltonen-Sainio, P.; Sorvali, J.; Kaseva, J. Finnish Farmers’ Views towards Fluctuating and Changing Precipitation Patterns Pave the Way for the Future. Agric. Water Manag. 2021, 255, 107011. [Google Scholar] [CrossRef]
  11. Ashu, A.; Lee, S.-I. Reuse of Agriculture Drainage Water in a Mixed Land-Use Watershed. Agronomy 2018, 9, 6. [Google Scholar] [CrossRef]
  12. Jame, S.A.; Frankenberger, J.; Reinhart, B.D.; Bowling, L. Mapping Agricultural Drainage Extent in the U.S. Corn Belt: The Value of Multiple Methods. Appl. Eng. Agric. 2022, 38, 917–930. [Google Scholar] [CrossRef]
  13. Paiao, G.D.; Fernández, F.G.; Naeve, S.L. Drainage Conditions Influence Corn-Nitrogen Management in the US Upper Midwest. Agronomy 2021, 11, 2491. [Google Scholar] [CrossRef]
  14. Wright, R.J.; Boyer, D.G.; Winant, W.M.; Perry, H.D. The Influence of Soil Factors on Yield Differences among Landscape Positions in an Appalachian Cornfield. Soil Sci. 1990, 149, 375–382. [Google Scholar] [CrossRef]
  15. Niaghi, A.R.; Jia, X.; Steele, D.D.; Scherer, T.F. Drainage Water Management Effects on Energy Flux Partitioning, Evapotranspiration, and Crop Coefficients of Corn. Agric. Water Manag. 2019, 225, 105760. [Google Scholar] [CrossRef]
  16. Lobell, D.B.; Roberts, M.J.; Schlenker, W.; Braun, N.; Little, B.B.; Rejesus, R.M.; Hammer, G.L. Greater Sensitivity to Drought Accompanies Maize Yield Increase in the U.S. Midwest. Science 2014, 344, 516–519. [Google Scholar] [CrossRef]
  17. Abendroth, L.J.; Chighladze, G.; Frankenberger, J.R.; Bowling, L.C.; Helmers, M.J.; Herzmann, D.E.; Jia, X.; Kjaersgaard, J.; Pease, L.A.; Reinhart, B.D.; et al. Paired Field and Water Measurements from Drainage Management Practices in Row-Crop Agriculture. Sci. Data 2022, 9, 257. [Google Scholar] [CrossRef]
  18. Rost, S.; Gerten, D.; Hoff, H.; Lucht, W.; Falkenmark, M.; Rockström, J. Global Potential to Increase Crop Production through Water Management in Rainfed Agriculture. Environ. Res. Lett. 2009, 4, 044002. [Google Scholar] [CrossRef]
  19. Wisser, D.; Frolking, S.; Douglas, E.M.; Fekete, B.M.; Schumann, A.H.; Vörösmarty, C.J. The Significance of Local Water Resources Captured in Small Reservoirs for Crop Production—A Global-Scale Analysis. J. Hydrol. 2010, 384, 264–275. [Google Scholar] [CrossRef]
  20. Wang, R.; Bowling, L.C.; Cherkauer, K.A. Estimation of the Effects of Climate Variability on Crop Yield in the Midwest USA. Agric. For. Meteorol. 2016, 216, 141–156. [Google Scholar] [CrossRef]
  21. Gurian, D. High and Dry. Why Genetic Engineering Is Not Solving Agriculture’s Drought Problem in a Thristy World; Union of Concerned Scientists: Cambridge, MA, USA, 2012; Volume 34. [Google Scholar]
  22. Campos, H.; Cooper, M.; Habben, J.E.; Edmeades, G.O.; Schussler, J.R. Improving Drought Tolerance in Maize: A View from Industry. Field Crops Res. 2004, 90, 19–34. [Google Scholar] [CrossRef]
  23. Reinhart, B.D.; Frankenberger, J.R.; Hay, C.H.; Helmers, M.J. Simulated Water Quality and Irrigation Benefits from Drainage Water Recycling at Two Tile-Drained Sites in the U.S. Midwest. Agric. Water Manag. 2019, 223, 105699. [Google Scholar] [CrossRef]
  24. Grassini, P.; Specht, J.E.; Tollenaar, M.; Ciampitti, I.; Cassman, K.G. High-Yield Maize-Soybean Cropping Systems in the US Corn Belt. In Crop Physiology: Applications for Genetic Improvement and Agronomy, 2nd ed.; Academic Press: Cambridge, MA, USA, 2015; ISBN 9780124171046. [Google Scholar]
  25. Lobell, D.B.; Cassman, K.G.; Field, C.B. Crop Yield Gaps: Their Importance, Magnitudes, and Causes. Annu. Rev. Environ. Resour. 2009, 34, 179–204. [Google Scholar] [CrossRef]
  26. Nelson, K.A.; Smoot, R.L.; Meinhardt, C.G. Soybean Response to Drainage and Subirrigation on a Claypan Soil in Northeast Missouri. Agron. J. 2011, 103, 1216–1222. [Google Scholar] [CrossRef]
  27. Allred, B.J.; Gamble, D.L.; Clevenger, W.B.; LaBarge, G.A.; Prill, G.L.; Czartoski, B.J.; Fausey, N.R.; Brown, L.C. Crop Yield Summary for Three Wetland Reservoir Subirrigation Systems in Northwest Ohio. Appl. Eng. Agric. 2014, 30, 889–903. [Google Scholar] [CrossRef]
  28. Li, Z.; Sun, Z. Optimized Single Irrigation Can Achieve High Corn Yield and Water Use Efficiency in the Corn Belt of Northeast China. Eur. J. Agron. 2016, 75, 12–24. [Google Scholar] [CrossRef]
  29. National Cooperative Soil Survey. National Cooperative Soil Characterization Database. Available online: https://ncsslabdatamart.sc.egov.usda.gov/ (accessed on 12 September 2022).
  30. Berglund, D.R.; Endres, G.J.; McWilliams, D.A. Corn: Growth and Management Quick Guide. Agron.—Cereal Crops NDSU Ext. Serv. 2013, 1173, 1–8. [Google Scholar]
  31. Zhao, J.; Lange, H.; Meissner, H. Gap-Filling Continuously-Measured Soil Respiration Data: A Highlight of Time-Series-Based Methods. Agric. For. Meteorol. 2020, 285–286, 107912. [Google Scholar] [CrossRef]
  32. R Core Team. R: A Language and Environment for Statistical Computing; R Foundation for Statistical Computing: Vienna, Austria, 2019. [Google Scholar]
  33. Copeland, P.J.; Allmaras, R.R.; Crookston, R.K.; Nelson, W.W. Corn–Soybean Rotation Effects on Soil Water Depletion. Agron. J. 1993, 85, 203–210. [Google Scholar] [CrossRef]
  34. Willison, R.S.; Nelson, K.A.; Abendroth, L.J.; Chighladze, G.; Hay, C.H.; Jia, X.; Kjaersgaard, J.; Reinhart, B.D.; Strock, J.S.; Wikle, C.K. Corn Yield Response to Subsurface Drainage Water Recycling in the Midwestern United States. Agron. J. 2021, 113, 1865–1881. [Google Scholar] [CrossRef]
  35. Fidantemiz, Y.F.; Jia, X.; Daigh, A.L.M.; Hatterman-Valenti, H.; Steele, D.D.; Niaghi, A.R.; Simsek, H. Effect of Water Table Depth on Soybean Water Use, Growth, and Yield Parameters. Water 2019, 11, 931. [Google Scholar] [CrossRef]
  36. Hussain, M.Z.; Hamilton, S.K.; Bhardwaj, A.K.; Basso, B.; Thelen, K.D.; Robertson, G.P. Evapotranspiration and Water Use Efficiency of Continuous Maize and Maize and Soybean in Rotation in the Upper Midwest U.S. Agric. Water Manag. 2019, 221, 92–98. [Google Scholar] [CrossRef]
  37. Li, Y.; Guan, K.; Peng, B.; Franz, T.E.; Wardlow, B.; Pan, M. Quantifying Irrigation Cooling Benefits to Maize Yield in the US Midwest. Glob. Chang. Biol. 2020, 26, 3065–3078. [Google Scholar] [CrossRef]
Figure 1. (a) Experimental site and (b) plots and subplots design.
Agronomy 14 01948 g001
Figure 2. Average monthly volumetric soil water content (SWC) in the 30–60 cm layer for the full, limited, and rainfed condition during the 2016 and 2017 growing seasons.
Agronomy 14 01948 g002
Figure 3. Average monthly drainage flow from each irrigation treatment during study years. Graph captions represent year and month, for example, 2016:07 represents July 2016.
Agronomy 14 01948 g003
Figure 4. Effect of irrigation × nitrogen (N) on yield of corn and irrigation on soybean yield in 2016 and 2017 growing seasons. Values in boxes denote significant (blue) and not significant (red) percent difference on yield at α = 0.05. Full irrigation (F), limited irrigation (L; 50% F), and rainfed (R) conditions.
Agronomy 14 01948 g004
Table 1. Summary of cropping system information for supplemental irrigation study between 2016 and 2019 at the Southwest Research and Outreach Center, near Lamberton, MN.
ActivityCornSoybean
20162017201820192016201720182019
Planting5/55/85/185/165/55/85/185/16
Harvest10/2410/2610/2210/2910/1310/1710/1810/17
Tillage5/45/85/185/155/45/85/185/15
Fertilization5/45/75/185/15----
Table 2. Timing and water amounts (mm) in the full (F) and limited (L) irrigation treatments during the study years. A hyphen (-) denotes no irrigation due to excess rainfall.
Irrigation
Date
CornSoybean
20162017201820192016201720182019
FLFLFLFLFLFLFLFL
10-Jul--103------100----
11-Jul--100------100----
14-Jul--1920------190----
19-Jul--1010------100----
29-Jul53------43------
2-Aug1010------1010------
4-Aug66100----661012----
8-Aug100------1010------
Total 31195933----30295912----
Table 3. Deviation from the long-term average (LTA; 1990–2022) of monthly rainfall (mm) during the four study years at Lamberton, MN.
Month/PeriodLTA2016201720182019
(mm)Deviation from LTA (mm) †
Jan14−7−2−3−3
Feb164−14029
Mar418−31−127
Apr731741−2785
May10037161515
Jun110−43−41947
Jul9184114826
Aug9242330−36
Sep8252−278574
Oct5516941544
Nov3217−30−6−2
Dec216−112916
Growing season (May–Sep)475171−924385
Off-season (Oct–Apr)25262468197
Total (year LTA)72723336251282
† Negative (−) and positive values denote below and above the LTA. Bold values correspond to the growing season.
Table 4. Significance of p-values for fixed sources of variation for soil water content in corn.
Fixed Sources
of Variation
201620172018 §2019
p > χ2
Month (M)************
Irrigation (I)ns***--
N rate (N)nsns--
M × I----
M × N----
I × Nnsns--
M × I × N
*** denotes significantly different at p < 0.01; ns denotes not significant. § Because of wet conditions, supplemental irrigation was not needed and SWC was not analyzed in 2018 and 2019.
Table 5. Average volumetric soil water content (m3/m3) for two soil layers in July and August during the 2016 and 2017 irrigated growing seasons.
Irrigation
Regime
Month20162017
CornSoybeanCornSoybean
0–20 cm30–60 cm0–20 cm30–60 cm0–20 cm30–60 cm0–20 cm30–60 cm
FullJuly0.19 a†0.35 a0.16 ab0.38 ab0.17 b0.35 a0.16 ab0.31 a
August0.19 a0.37 a0.15 ab0.37 ab0.22 a0.37 a0.20 a0.31 a
LimitedJuly0.17 ab0.35 a0.12 ab0.39 a0.13 d0.30 bc0.09 c0.30 a
August0.16 b0.36 a0.10 b0.36 bc0.19 b0.31 b0.16 ab0.32 a
RainfedJuly0.17 ab0.34 b0.16 a0.34 c0.11 e0.27 d0.12 bc0.28 a
August0.14 c0.33 b0.12 ab0.29 d0.16 c0.29 c0.18 ab0.31 a
† Within a column, values with the same letter were not significantly different at 0.1 level.
Table 6. Significance of p-values for fixed sources of variation for corn and soybean yield during the 2016 and 2017 irrigated growing seasons.
Fixed Source
of Variation
CornSoybean
20162017Average20162017Average
_____________________________________________ p > χ2 _______________________________________________
Irrigation (I)nsnsnsnsnsns
Nitrogen (N)*********---
Year (Y)--ns--***
I × N*********---
I × Y--ns--ns
N × Y--***---
I × N × Y--***---
*** Significant at 0.001; ns no significance; “-” not included in the statistical analysis.
Disclaimer/Publisher’s Note: The statements, opinions and data contained in all publications are solely those of the individual author(s) and contributor(s) and not of MDPI and/or the editor(s). MDPI and/or the editor(s) disclaim responsibility for any injury to people or property resulting from any ideas, methods, instructions or products referred to in the content.

