Article

Online Detection of Loading Capacity in Mechanized Pepper Harvesting Using Ultrasonic Sensors

1
Intelligent Equipment Research Center, Beijing Academy of Agriculture and Forestry Sciences, Beijing 100097, China
2
College of Mechanical and Electrical Engineering, Xinjiang Agricultural University, Urumqi 830052, China
3
National Engineering Research Center of Intelligent Equipment for Agriculture (NERCIEA), Beijing 100097, China
4
Beijing PAIDE Science and Technology Development Co., Ltd., Beijing 100097, China
*
Authors to whom correspondence should be addressed.
Agronomy 2024, 14(9), 1955; https://doi.org/10.3390/agronomy14091955 (registering DOI)
Submission received: 30 July 2024 / Revised: 26 August 2024 / Accepted: 28 August 2024 / Published: 29 August 2024
(This article belongs to the Section Precision and Digital Agriculture)

Abstract

:
This study addresses the challenge of scheduling coordination between harvesters and transfer vehicles during the mechanized harvesting of processing peppers. An online detection method for assessing the loading capacity during harvesting was proposed, employing non-contact distance sensors to measure the stacking height of peppers in the hopper in real time. This measurement was used to calculate the loading capacity of the transfer vehicle for peppers. This study compared and analyzed the detection accuracy of ultrasonic, infrared distance, and light detection and ranging sensors to identify the most suitable sensor for detecting the stacking height of peppers, and establish an optimal detection model for the loading capacity of peppers in transfer vehicles. The results indicated that ultrasonic sensors achieved the highest accuracy, with a maximum absolute error of 11.0 mm and a standard deviation of 8.5 mm in detecting the stacking height of peppers. When three symmetrically mounted ultrasonic sensors were used, the maximum error and standard deviation for the mean stacking height under varying lifting speeds were 37.0 mm and 15.5 mm, respectively. The developed model’s relative error in detecting the pepper loading capacity decreased to less than 2% when the fed volume exceeded 0.4 m3. These findings provide a basis for scheduling decisions in the coordination of pepper harvesters and transfer vehicles.

1. Introduction

China has the largest scale of chili pepper cultivation globally, with the planting area for processing peppers accounting for about half of the total planting area [1,2]. Additionally, China is the world’s largest producer and exporter of chili pepper products [3,4]. The processing pepper industry has grown rapidly in recent years, increasing the demand for efficient and automated pepper harvesting machinery [5]. However, the development of pepper harvesting machinery in China lags behind, with a low level of intelligence [6,7]. The mechanized harvesting of peppers often adopts methods used for crops like wheat and corn [8]. During mechanized harvesting, peppers are inevitably damaged due to squeezing, leading to oxidation and rancidity when exposed to the air [9]. Therefore, it is crucial to quickly transfer harvested peppers to drying yards or processing plants. This necessitates the fast and accurate detection of the loading capacity during mechanized pepper harvesting [10] to improve the efficiency of coordination between the harvesters and transfer vehicles, reduce non-operational waiting time, and ensure the quality of processed products.
Currently, there is a lack of effective scheduling in the coordination of harvesters and transfer vehicles in pepper harvesting [11]. The common practice of relying on drivers to observe the loading capacity visually leads to subjective and inaccurate decisions, causing multiple transfer vehicles to idle, wasting valuable agricultural resources.
To address this issue, advanced sensors and real time detection systems integrated into harvesters or transfer vehicles can accurately and instantly collect and process loading capacity data. This technology reduces errors caused by human observation, and enables the intelligent scheduling of transfer vehicles based on real time loading capacity information, thus improving the utilization efficiency of agricultural machinery [12].
Currently, mature detection methods exist for the mechanized harvesting of cereals like wheat and corn [13]. Changzhan Li et al. [14] utilized resistance strain gauge pressure sensors to weigh harvested grains and developed a regression prediction model for calculating the current grain yield. Xiaochao Li et al. [15] leveraged the characteristics of conventional combined harvesters during the grain transfer process, employing weighing technology to measure the yield flow rate. Schrock et al. [16] placed piezoelectric films on the inner wall of a scraper lifter’s protective hood and developed a mathematical model that captures the impact of grains on the protective hood with piezoelectric films, reflecting the dynamic relationship between the impact force and the mass flow rate of rice. Iida et al. [17] simplified the structure of a single-arm impact-based sensor and developed and validated a yield prediction model through field experiments. These methods are often affected by vibration noise from the machinery. Techniques like mechanical vibration reduction, data differential, and digital filtering are required to mitigate these effects, increasing the overall computation and complexity of the system. Machine vision has been proposed for detecting grain stacking angles [18], however, it is less effective in dusty environments like those encountered during pepper harvesting. Photoelectric sensors have also been explored to measure grain thickness on scraper lifting devices, indirectly calculating grain volume [19,20,21]. Although this method is effective in grain harvesting, it is not accurate for directly detecting the stacking thickness of peppers on each scraper due to the larger volume and significant friction between peppers. Distance sensors can be installed above the hopper of the transfer vehicle to detect the stacking height of peppers, thereby calculating the hopper’s loading capacity by applying this principle. Currently, the sensors used for ranging include ultrasonic, infrared distance, and light detection and ranging (LiDAR) sensors, which have proven successful in various fields and provide valuable references for their application in pepper harvesting. For instance, ultrasonic sensors are used to detect the spray height of spray bars [22,23,24], infrared distance sensors are used to measure the distance between tobacco harvesters and ridges [25], and are combined with image processing techniques to measure the distance between individual cottons [26]. LiDAR sensors are used to detect the distance of robots from obstacles, aiding in navigation and obstacle avoidance [27,28,29].
In summary, based on the principle of detecting the stacking height of peppers in the hopper and then calculating the transfer vehicle’s loading capacity, this study identifies the most suitable sensors for detecting the stacking height of peppers. It investigates the influence of the lifting speed on the stacking pattern of peppers, explores a method for detecting the stacking height without being influenced by the lifting speed, constructs a detection model for the loading capacity of processing pepper transfer vehicles, and conducts relevant experiments for validation.

2. Materials and Methods

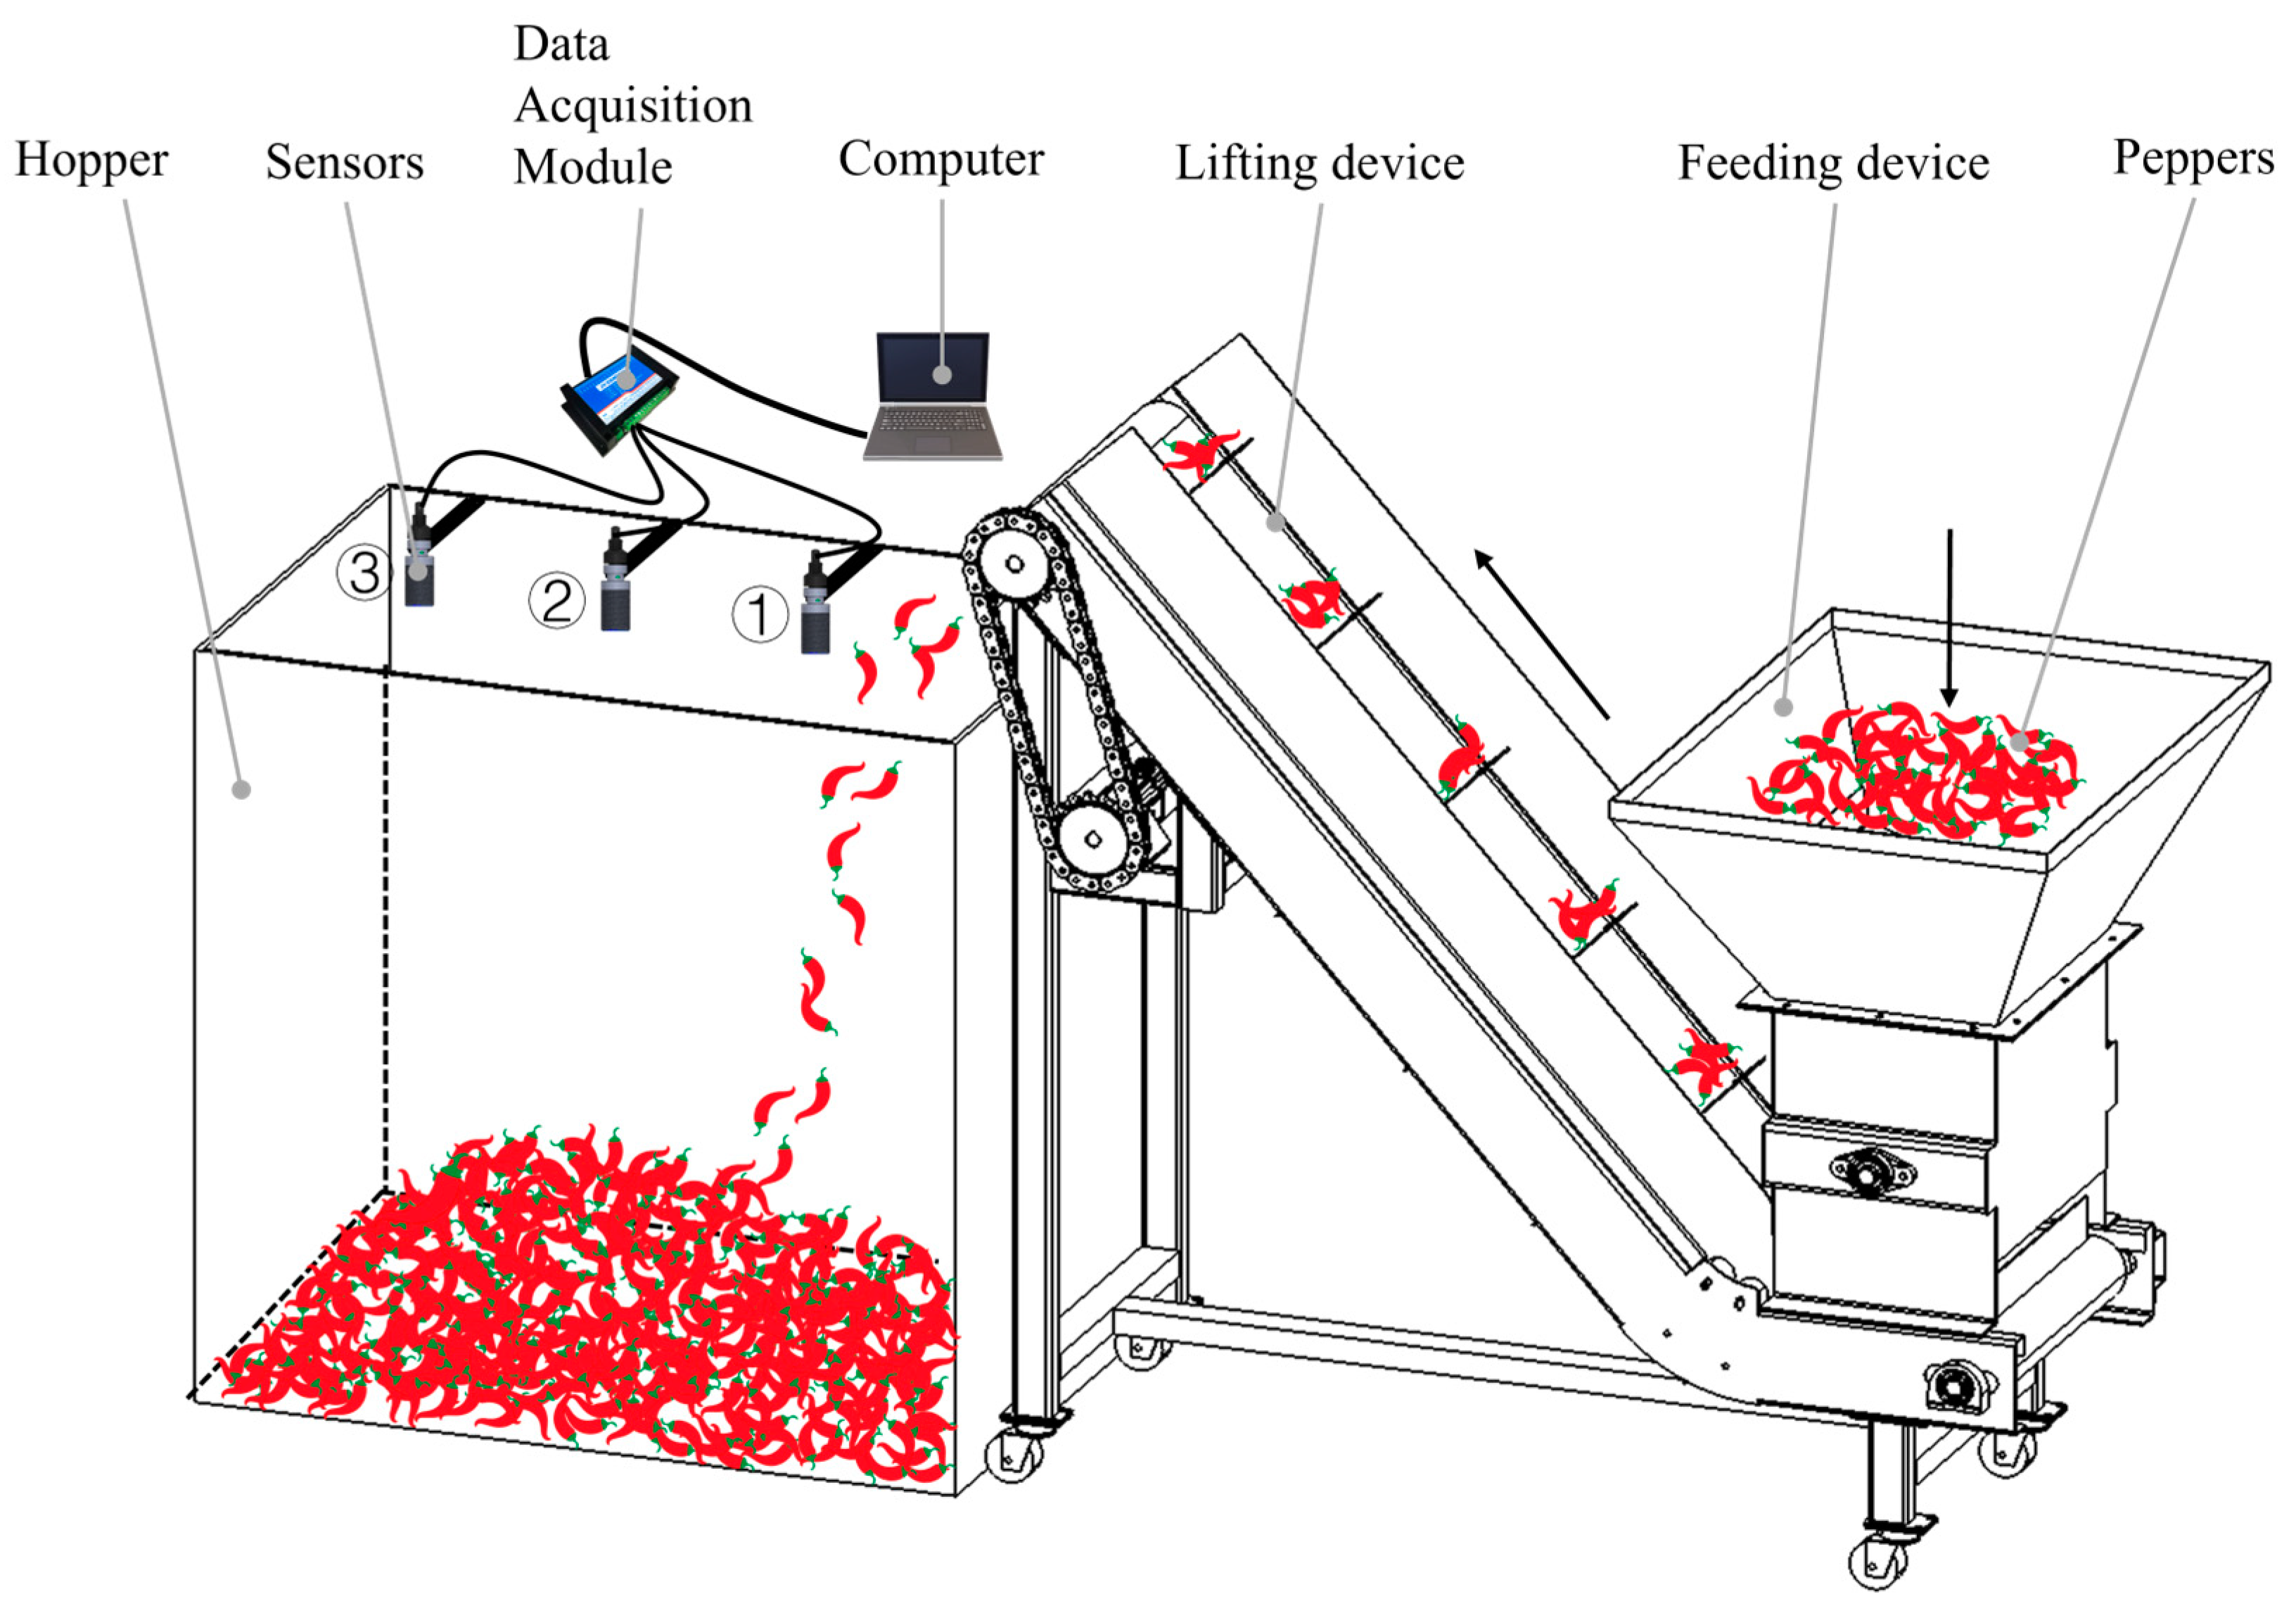
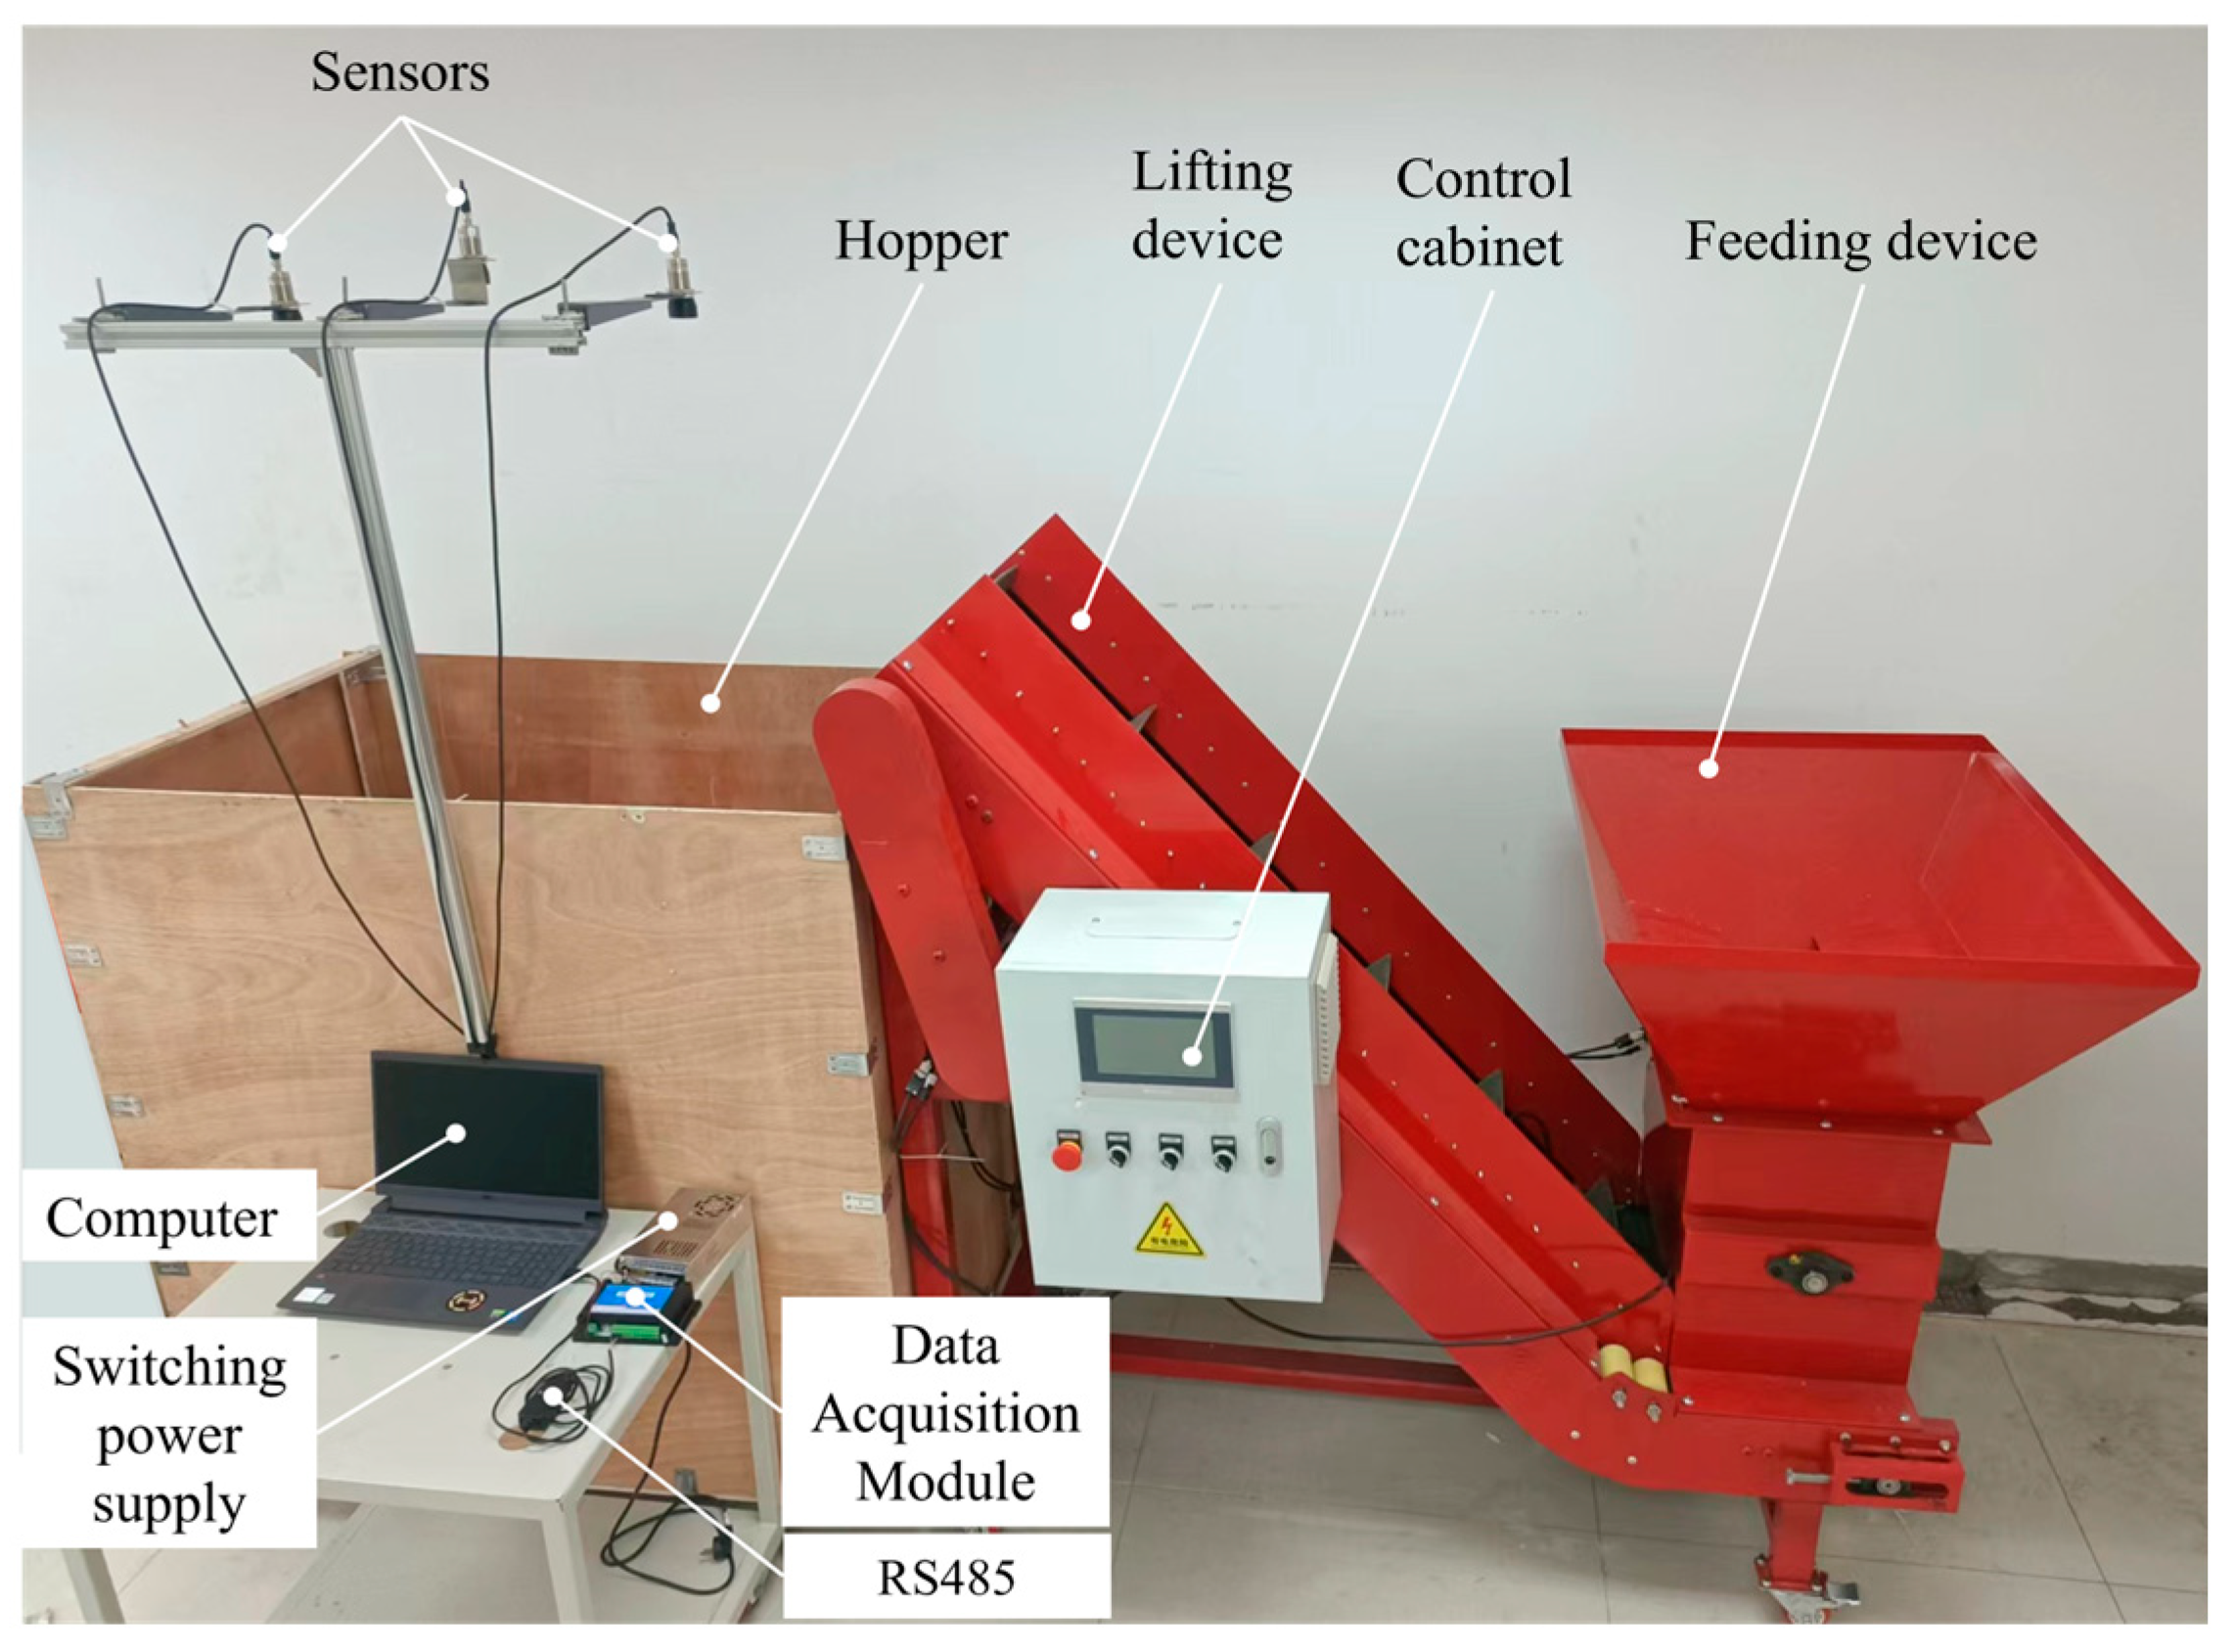
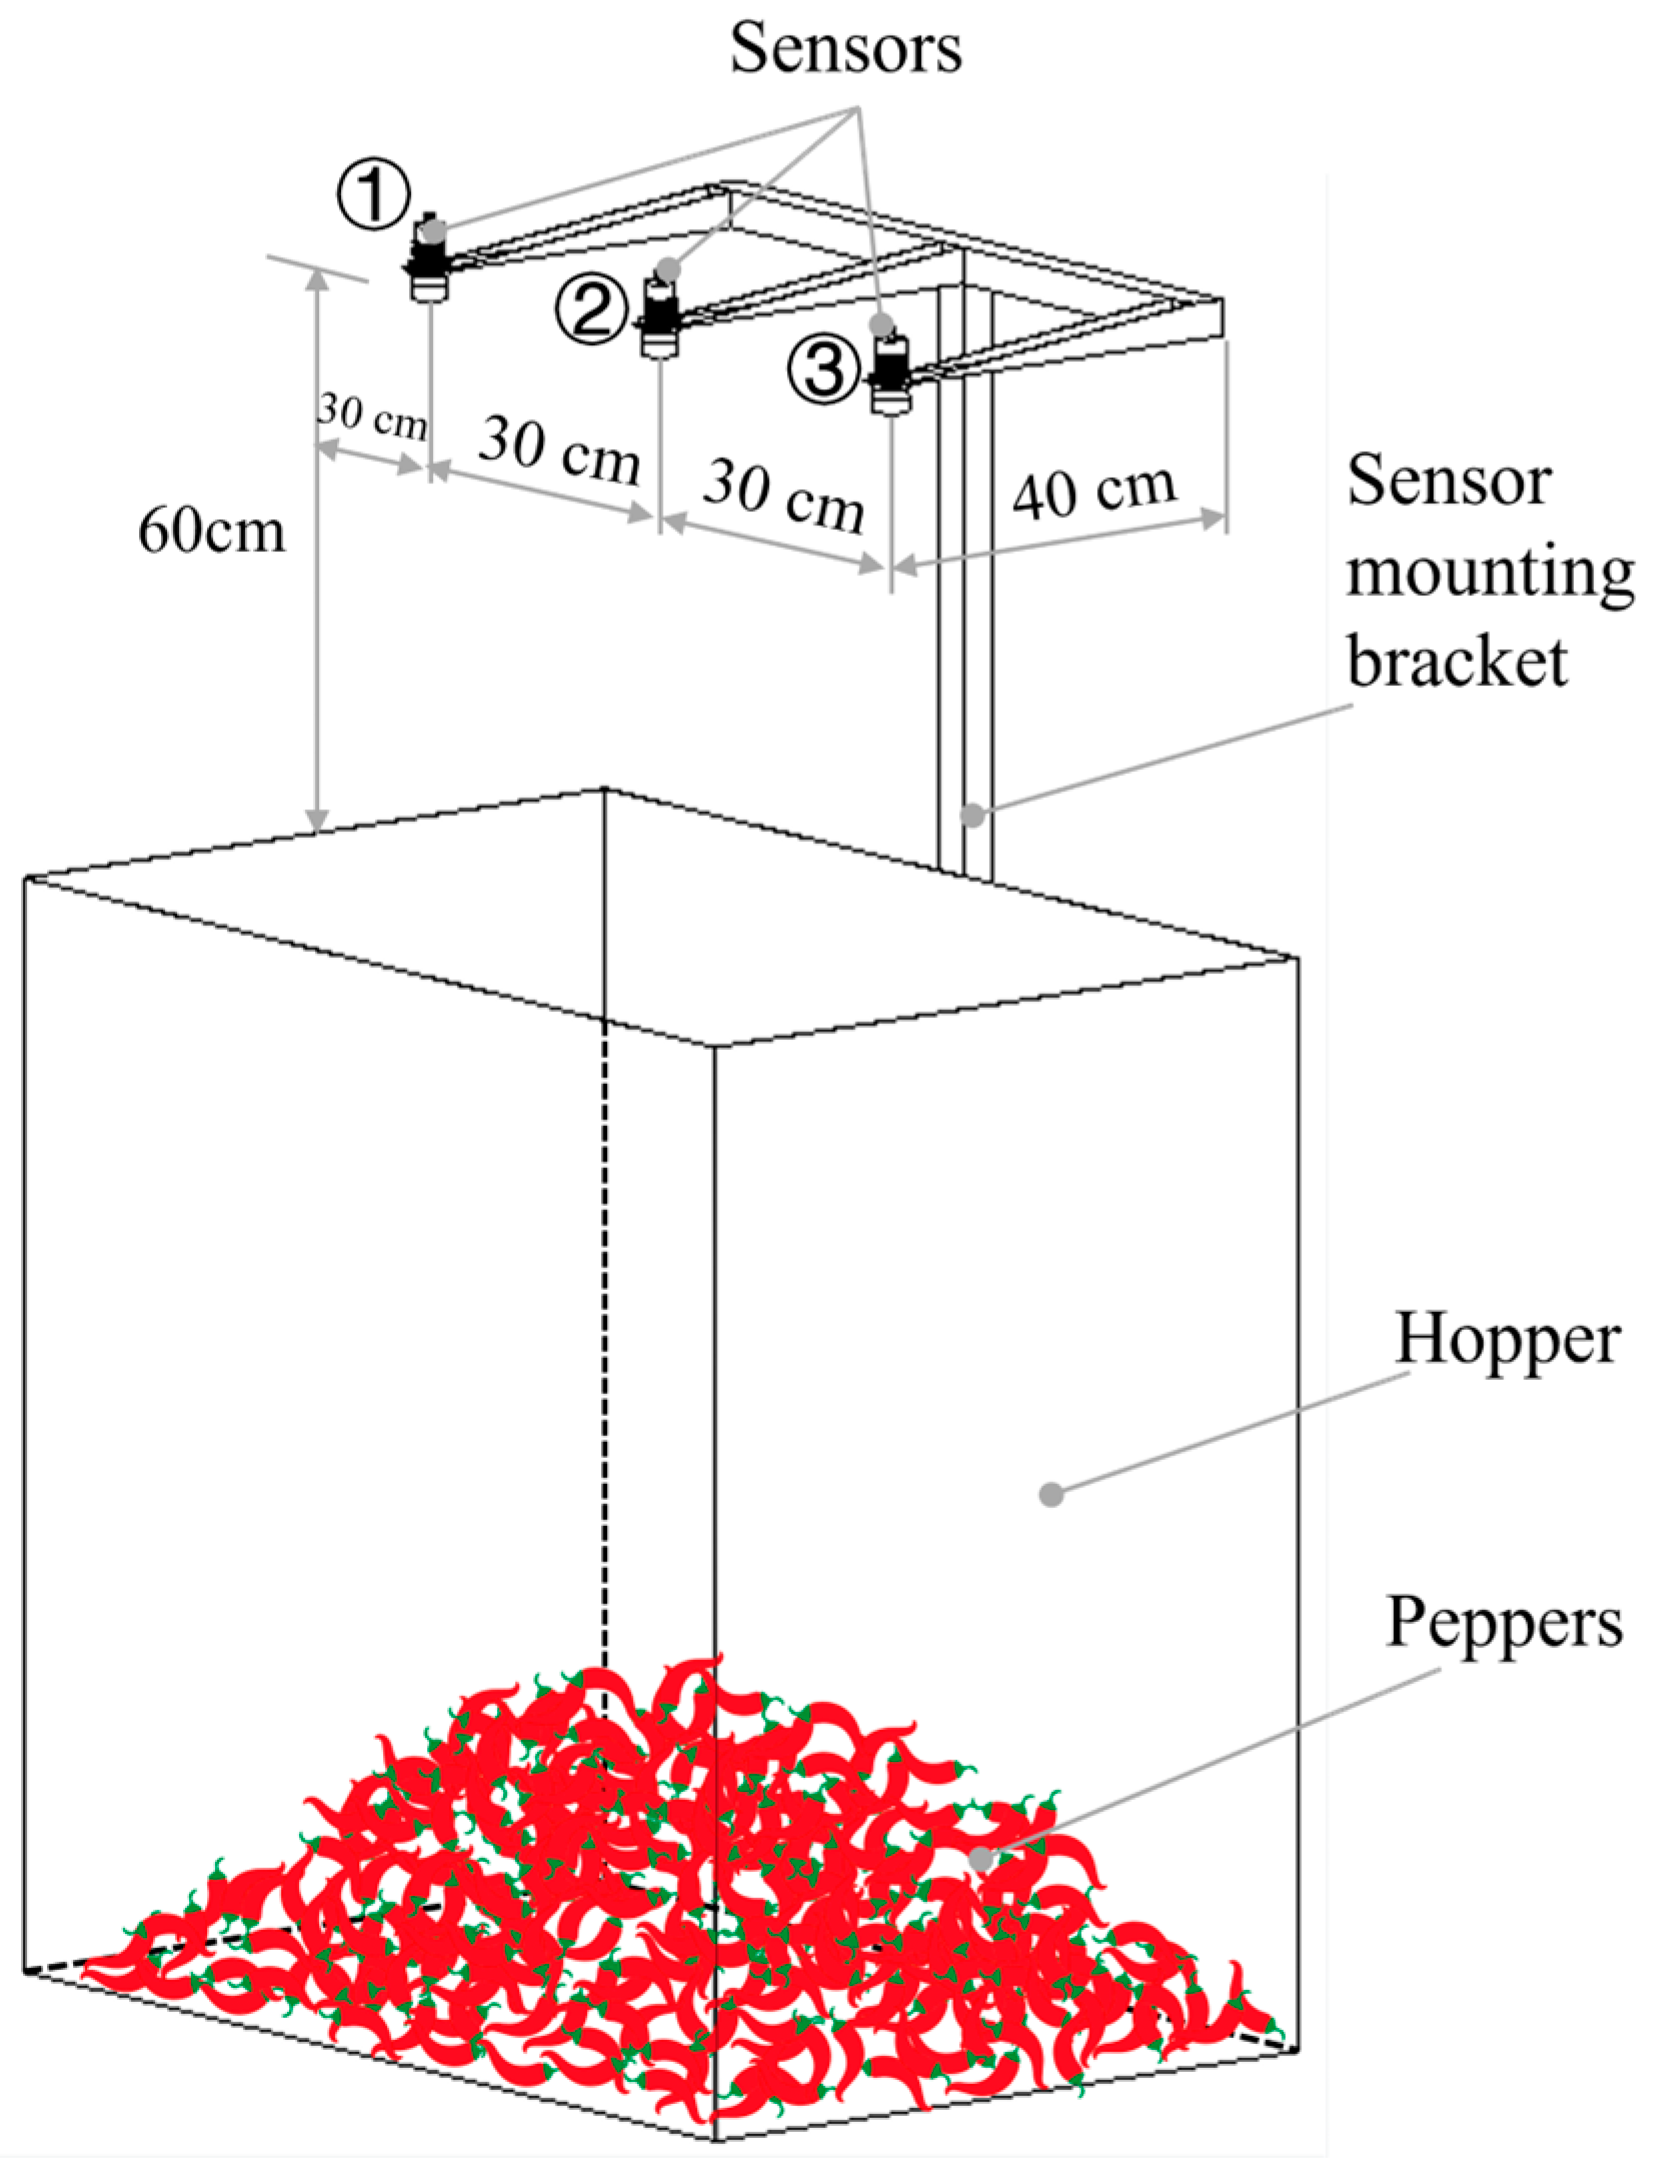
2.1. Construction of a Bench Test for the Detection of Pepper Loading Capacity

To simulate real harvesting conditions, a testing platform for detecting the loading capacity of peppers was designed based on the prototype of the Mushen 4JZ-3600B self-propelled pepper harvester’s (Xinjiang New Research Luperus Technology Co., Ltd., Urumqi, China) conveyor system (Figure 1). The testing platform comprised a computer, a data acquisition module, sensors, a frame, a feeding device, a lifting device, a hopper, and a control cabinet. The computer runs the system’s software, which is used to receive and visualize data from the sensors. The JY-DAM0888 data acquisition module, featuring RS485 serial ports, simultaneously collects data from eight analog channels. It operates at a default communication baud rate of 9600, with an operating voltage range of 7–30 V, and a temperature range of −40–85 °C. The feeding device has a volume of approximately 0.15 m3. The lifting device features a conveyor belt 500 mm wide, a lifting angle of 45°, and a roller diameter of 100 mm, driven by a servo motor (SD80AEA07530-SC3-AP-CB) with a power rating of 0.75 kW and a maximum speed of 3000 r/min. The transmission ratio is 1:1, and the motor speed is adjustable between 0 and 3000 r/min via the control cabinet. The hopper, made of composite panels, measures 1.2 m in length, 0.8 m in width, and 1.2 m in height, with a total volume of 1.152 m3.
In this study, an ultrasonic sensor (LGUB4000-30GM60-I-V15, LORDDOM Intelligent Technology Co., Ltd., Yueqing City, China), an infrared distance sensor (GP2Y0A21YK0F, Ruixin Hengchuang Electronics Co., Ltd., Shenzhen, China), and a LiDAR sensor (SDM15, Yahboom Technology Co., Ltd., Shenzhen, China) were calibrated using a flat surface as the detection object. The accuracy of these sensors was compared by using the stacking height of peppers as the detection object to select the most suitable sensor for this purpose. The ultrasonic sensor has a measurement range of 200–4000 mm, a blind spot of 0–200 mm, a resolution of 0.17–1.5 mm, repeatability of ±0.15%, a divergence angle of 10°, a maximum measurement diameter of about 1 m, an analog current output of 4–20 mA, an operating voltage of 10–30 V, a response time of 162 ms, and an operating temperature range of −25–70 °C. The infrared distance sensor has a measurement range of 200–1500 mm, a blind spot of 0–200 mm, an operating voltage of 0–7 V, an analog voltage output of 0–3 V, and an operating temperature range of −10–60 °C. The LiDAR sensor has a measurement range of 50–15000 mm, a ranging frequency of 10–1800 Hz, a relative error of less than 2%, and an operating temperature range of −20–50 °C, supporting direct reading of raw data through the serial port.

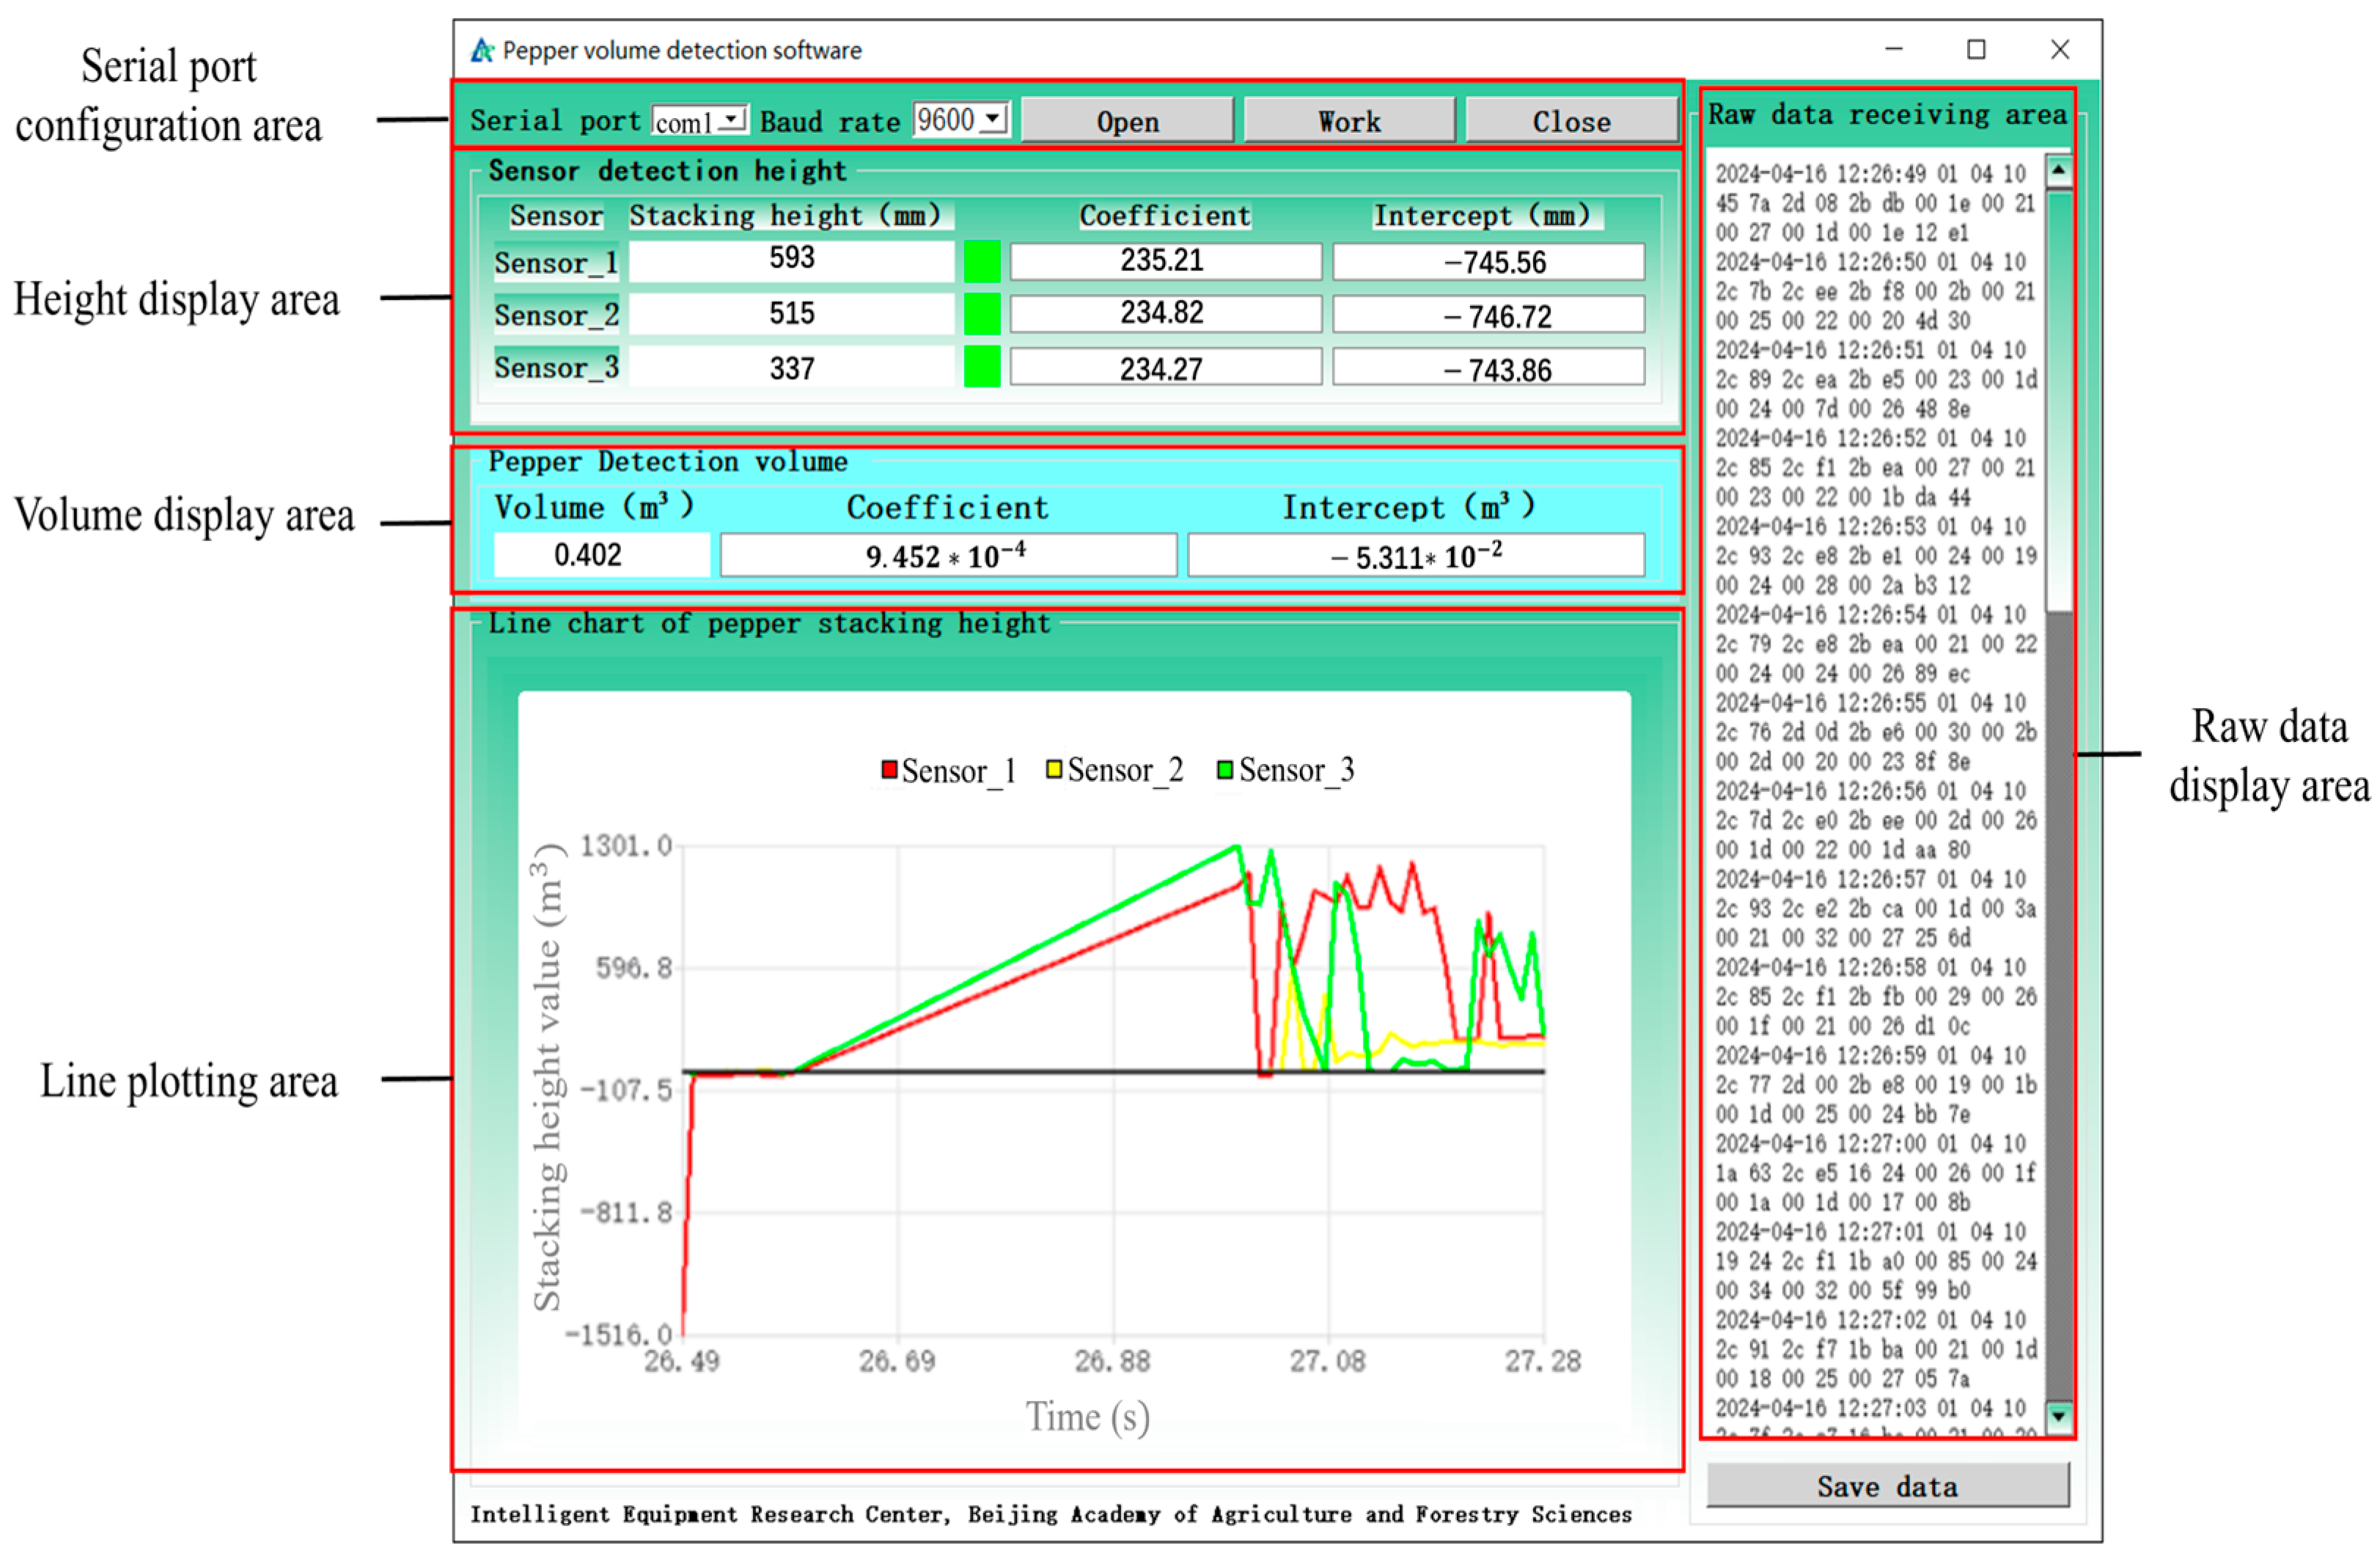
2.2. Pepper Loading Capacity Detection Software Design

To visualize the detected pepper loading capacity, a software application was developed using Python V3.10 and the PyQt5 library, utilizing RS485 serial communication. The user interface, as shown in Figure 2, consists of several key areas: the serial port configuration area, height and volume display areas, line plotting area, and raw data display area. The serial port configuration area facilitates communication control between the host computer and the data acquisition card. The raw data display area shows the raw hexadecimal data of the pepper stacking height detected by the sensors in real time. The height display area allows the setting of the function’s linear coefficient and intercept based on the sensor calibration results. This area parses the original hexadecimal data into decimal form and applies the calibration equation to display the detected pepper stacking height in real time. The volume display area similarly allows the setting of the linear coefficient and intercept for the pepper loading capacity detection model. The pepper stacking height can be input into this model to display the pepper loading capacity in real time. The line plotting area was designed to plot line charts based on the pepper stacking height data detected by the sensors. Finally, the “Save data” button enables users to save the detected pepper loading capacity over a specified period in a tabular format.

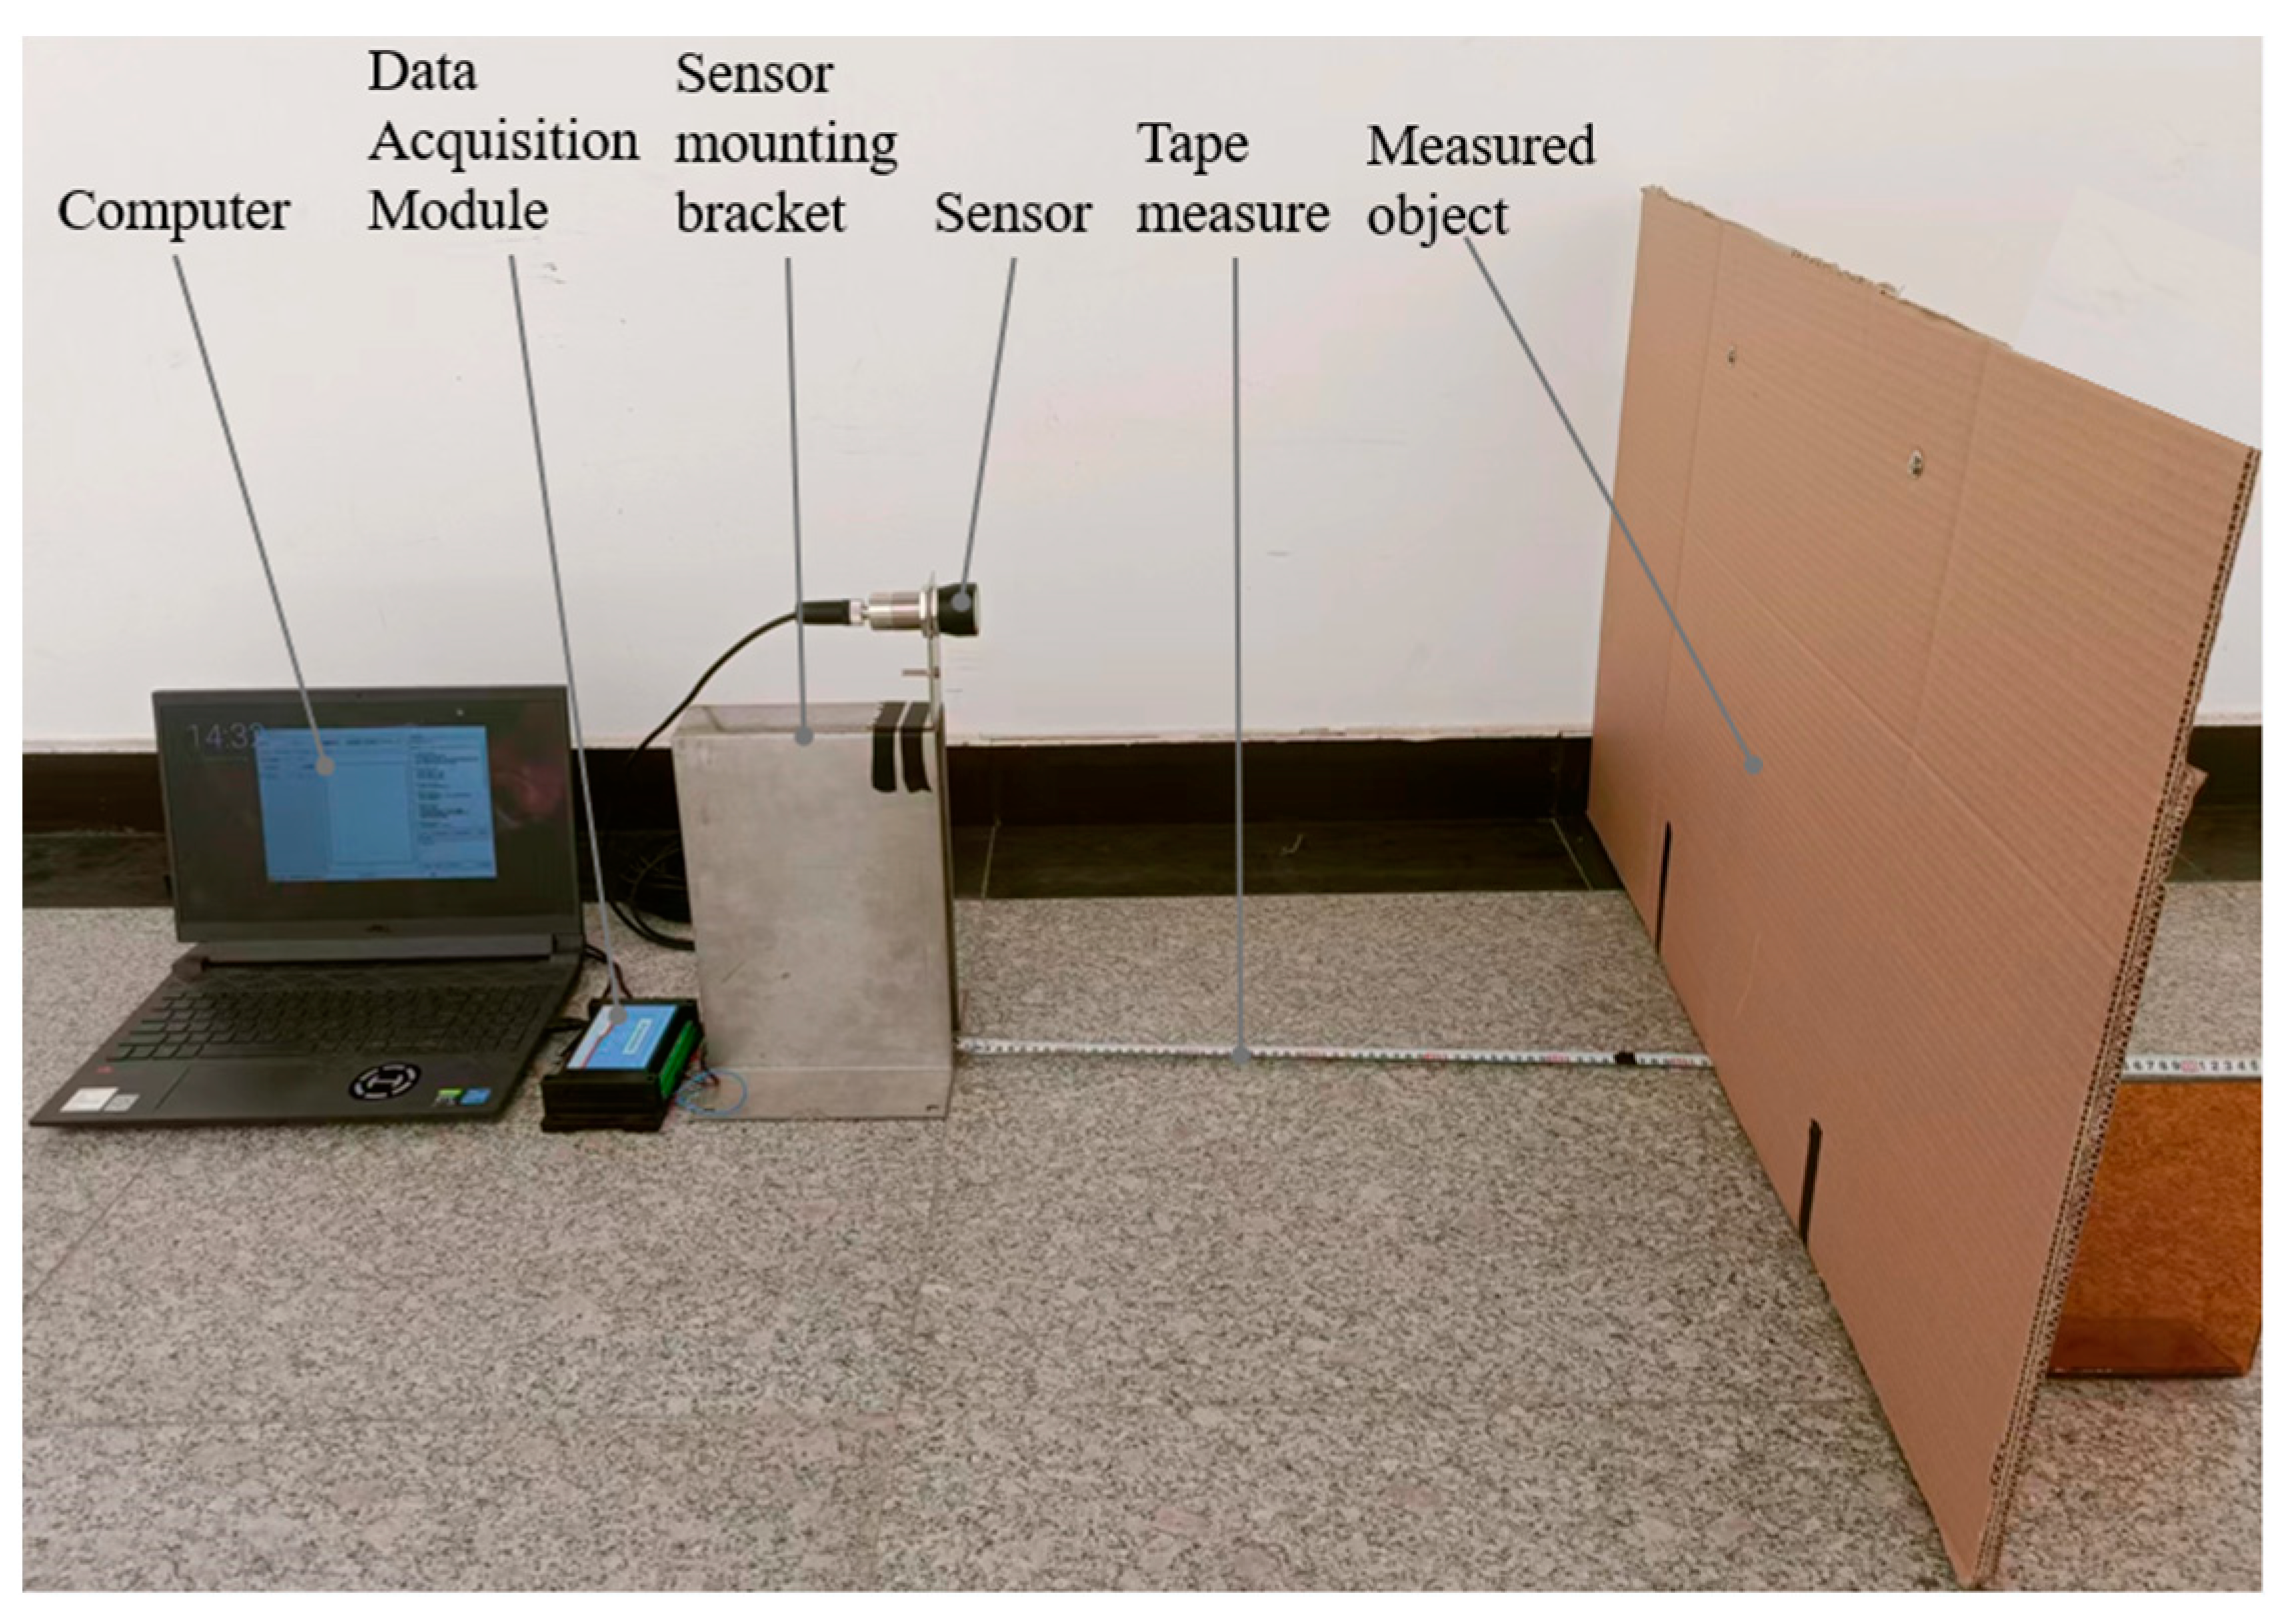
2.3. Sensor Calibration and Accuracy Tests

2.3.1. Sensor Calibration

The sensor was mounted horizontally on a bracket, 40 mm above the ground, with a vertically positioned cardboard box serving as the measured plane. During the experiment, the distance between the sensor and the measured plane was manually adjusted, ensuring the sensor remained parallel to the ground and perpendicular to the measured plane, as shown in Figure 3.
The computer was connected to the data acquisition module via an RS485 serial communication cable during the calibration process. The JYDAM serial debugging software V2.0, which accompanies the data acquisition module, was used to receive and display the current and voltage signal outputs from the ultrasonic and infrared sensors, respectively, at various distances. A tape measure was used to measure the actual distance from the sensor to the measured plane, and these values, along with the current and voltage signals, were recorded. The distance range between the ultrasonic sensor and the measured plane was set to 200–4000 mm, with an adjustment interval of 200 mm. For the infrared distance sensor, the range was set to 200–1500 mm, with a 100 mm adjustment interval. Each distance was measured three times to ensure accuracy. The current signal output from the ultrasonic sensor and the voltage signal output from the infrared distance sensor were plotted against the actual distances to obtain the detection characteristic curves for each sensor. These curves established the calibration relationships between the two sensors’ output analog data and the distance from the measured plane.
y 1 = a x 1 + c ,
where
y 1 is the measured distance value of the ultrasonic sensor, m;
x 1 is the output current value of the ultrasonic sensor, mA;
a is the regression coefficient; and
c is the error value, m.
The ultrasonic sensor’s analog current output for distance measurement exhibits a linear relationship, primarily owing to its operating principle and output characteristics, which ensures a high accuracy, stability, and flexibility in distance measurement.
y 2 = b x 2 d ,
where
y 2 is the measured distance value of the infrared distance sensor, m;
x 2 is the output voltage value of the ultrasonic sensor, V;
b is the regression coefficient; and
d is the exponential factor.
The infrared sensor’s analog voltage output for distance measurement is exponential because the reflected intensity of the infrared signal is inversely proportional to the distance. This relationship allows the sensor to achieve a higher sensitivity and accuracy within close distance ranges, meeting the practical application requirements.

2.3.2. Accuracy Tests for the Detection of Pepper Stacking Height

The sensor was mounted vertically at one end of the horizontal bracket of the lifting platform. The horizontal bracket was 500 mm long, and the peppers were stacked directly below the sensor. During the tests, the height of the lifting platform was manually adjusted to change the height of the sensor relative to the surface of the pepper pile, simulating changes in the pepper stacking height. The sensor remained vertically oriented throughout the entire height adjustment process, as evident in Figure 4.
The height adjustment range for the ultrasonic and LiDAR sensors relative to the surface of the pepper pile was set to 200–2800 mm, with an adjustment interval of 200 mm. The height adjustment range of the infrared sensor was set to 200–1500 mm, with a 100 mm adjustment interval. Each height was measured three times, and both the detected and the actual heights of the sensor from the surface of the pepper pile were recorded.
To better compare and analyze the accuracy of the three sensors, a correlation analysis was performed on the recorded data to obtain the correlation coefficients between the detected and the actual heights for each sensor. Additionally, the difference between the detected and the actual heights, and the standard deviation of these differences were calculated to further evaluate the accuracy of each sensor. Based on these analyses, the most suitable sensor for detecting the pepper stacking height was determined.

2.4. Detection Tests of Pepper Stacking Height in the Hopper

To investigate the effects of sensor quantity, mounting positions, and lifting speed on the model construction, the three sensors identified as being most suitable for detecting pepper stacking height were employed simultaneously on the testing platform (Figure 5). The sensors were labeled as No. 1, No. 2, and No. 3. They were mounted directly above the hopper using brackets, positioned 1800 mm from the hopper’s bottom surface, aligned horizontally, and spaced 300 mm apart. The drive motor speed range of the lifting device was set between 500 and 3000 r/min, with adjustments made at 250 r/min intervals. The corresponding lifting speed range was between 50 and 300 m/min. For each lifting speed, simulated peppers were sequentially fed in volumes ranging from 0.1 to 0.8 m3, increasing by increments of 0.1 m3 each time. Eight different volumes of peppers were preset for each lifting speed, with each volume test repeated four times. The peppers were loaded into the feeding device, and as the lifting device was activated, they were transported to the top of the lifting device, where they fell into the hopper due to gravity. The sensors above the hopper detected and recorded the stacking height of the peppers in real time. Four sets of detection data were obtained from the three sensors under varying lifting speeds and pepper volumes. Three sets of data were utilized to construct the model, while the remaining set were reserved for verifying the model’s accuracy.

2.5. Construction Method of the Pepper Loading Capacity Detection Model

To determine the specific volume of peppers in the hopper, the pepper stacking height detected by the sensor was plotted as the horizontal coordinate, and the actual volume of peppers as the vertical coordinate. These data were used to create a correlation characteristic curve between the detected height of the peppers and their volume. A regression analysis was then performed to construct a mathematical regression model, described by the equations
V = k H + β ,
H = h y ,
where
V represents the volume of peppers, in m3;
H denotes the pepper stacking height, in mm;
h is the fixed distance of the sensor from the bottom of the hopper, 1800 mm in this study;
y is the detected distance from the sensor to the surface of the pepper stack in mm;
k is the regression coefficient; and
β is the error value, in m3.
Given that the number of sensors, their mounting locations, and the lifting speed can all affect the detection results, multiple detection models were constructed. To identify the optimal model configuration, validation data were input into each model, and the resulting output volumes were compared against the actual volumes. The detection errors were calculated to ascertain the sensor configuration and the mounting positions that provided the most accurate measurements for constructing the pepper loading capacity detection model.

3. Results and Discussion

3.1. Adaptability Test Results for Pepper Loading Capacity Detection Sensors

3.1.1. Sensor Calibration Test Results

The calibration relationships for the ultrasonic and infrared distance sensors were determined using the “calibration platform”, as shown in Table 1. The coefficients of determination R2 for both types of sensors were found to be close to one, indicating a strong correlation between the analog signal output and the detected distance. This high R2 value suggests that the models have a good fitting performance, making them reliable for detecting the pepper loading capacity.

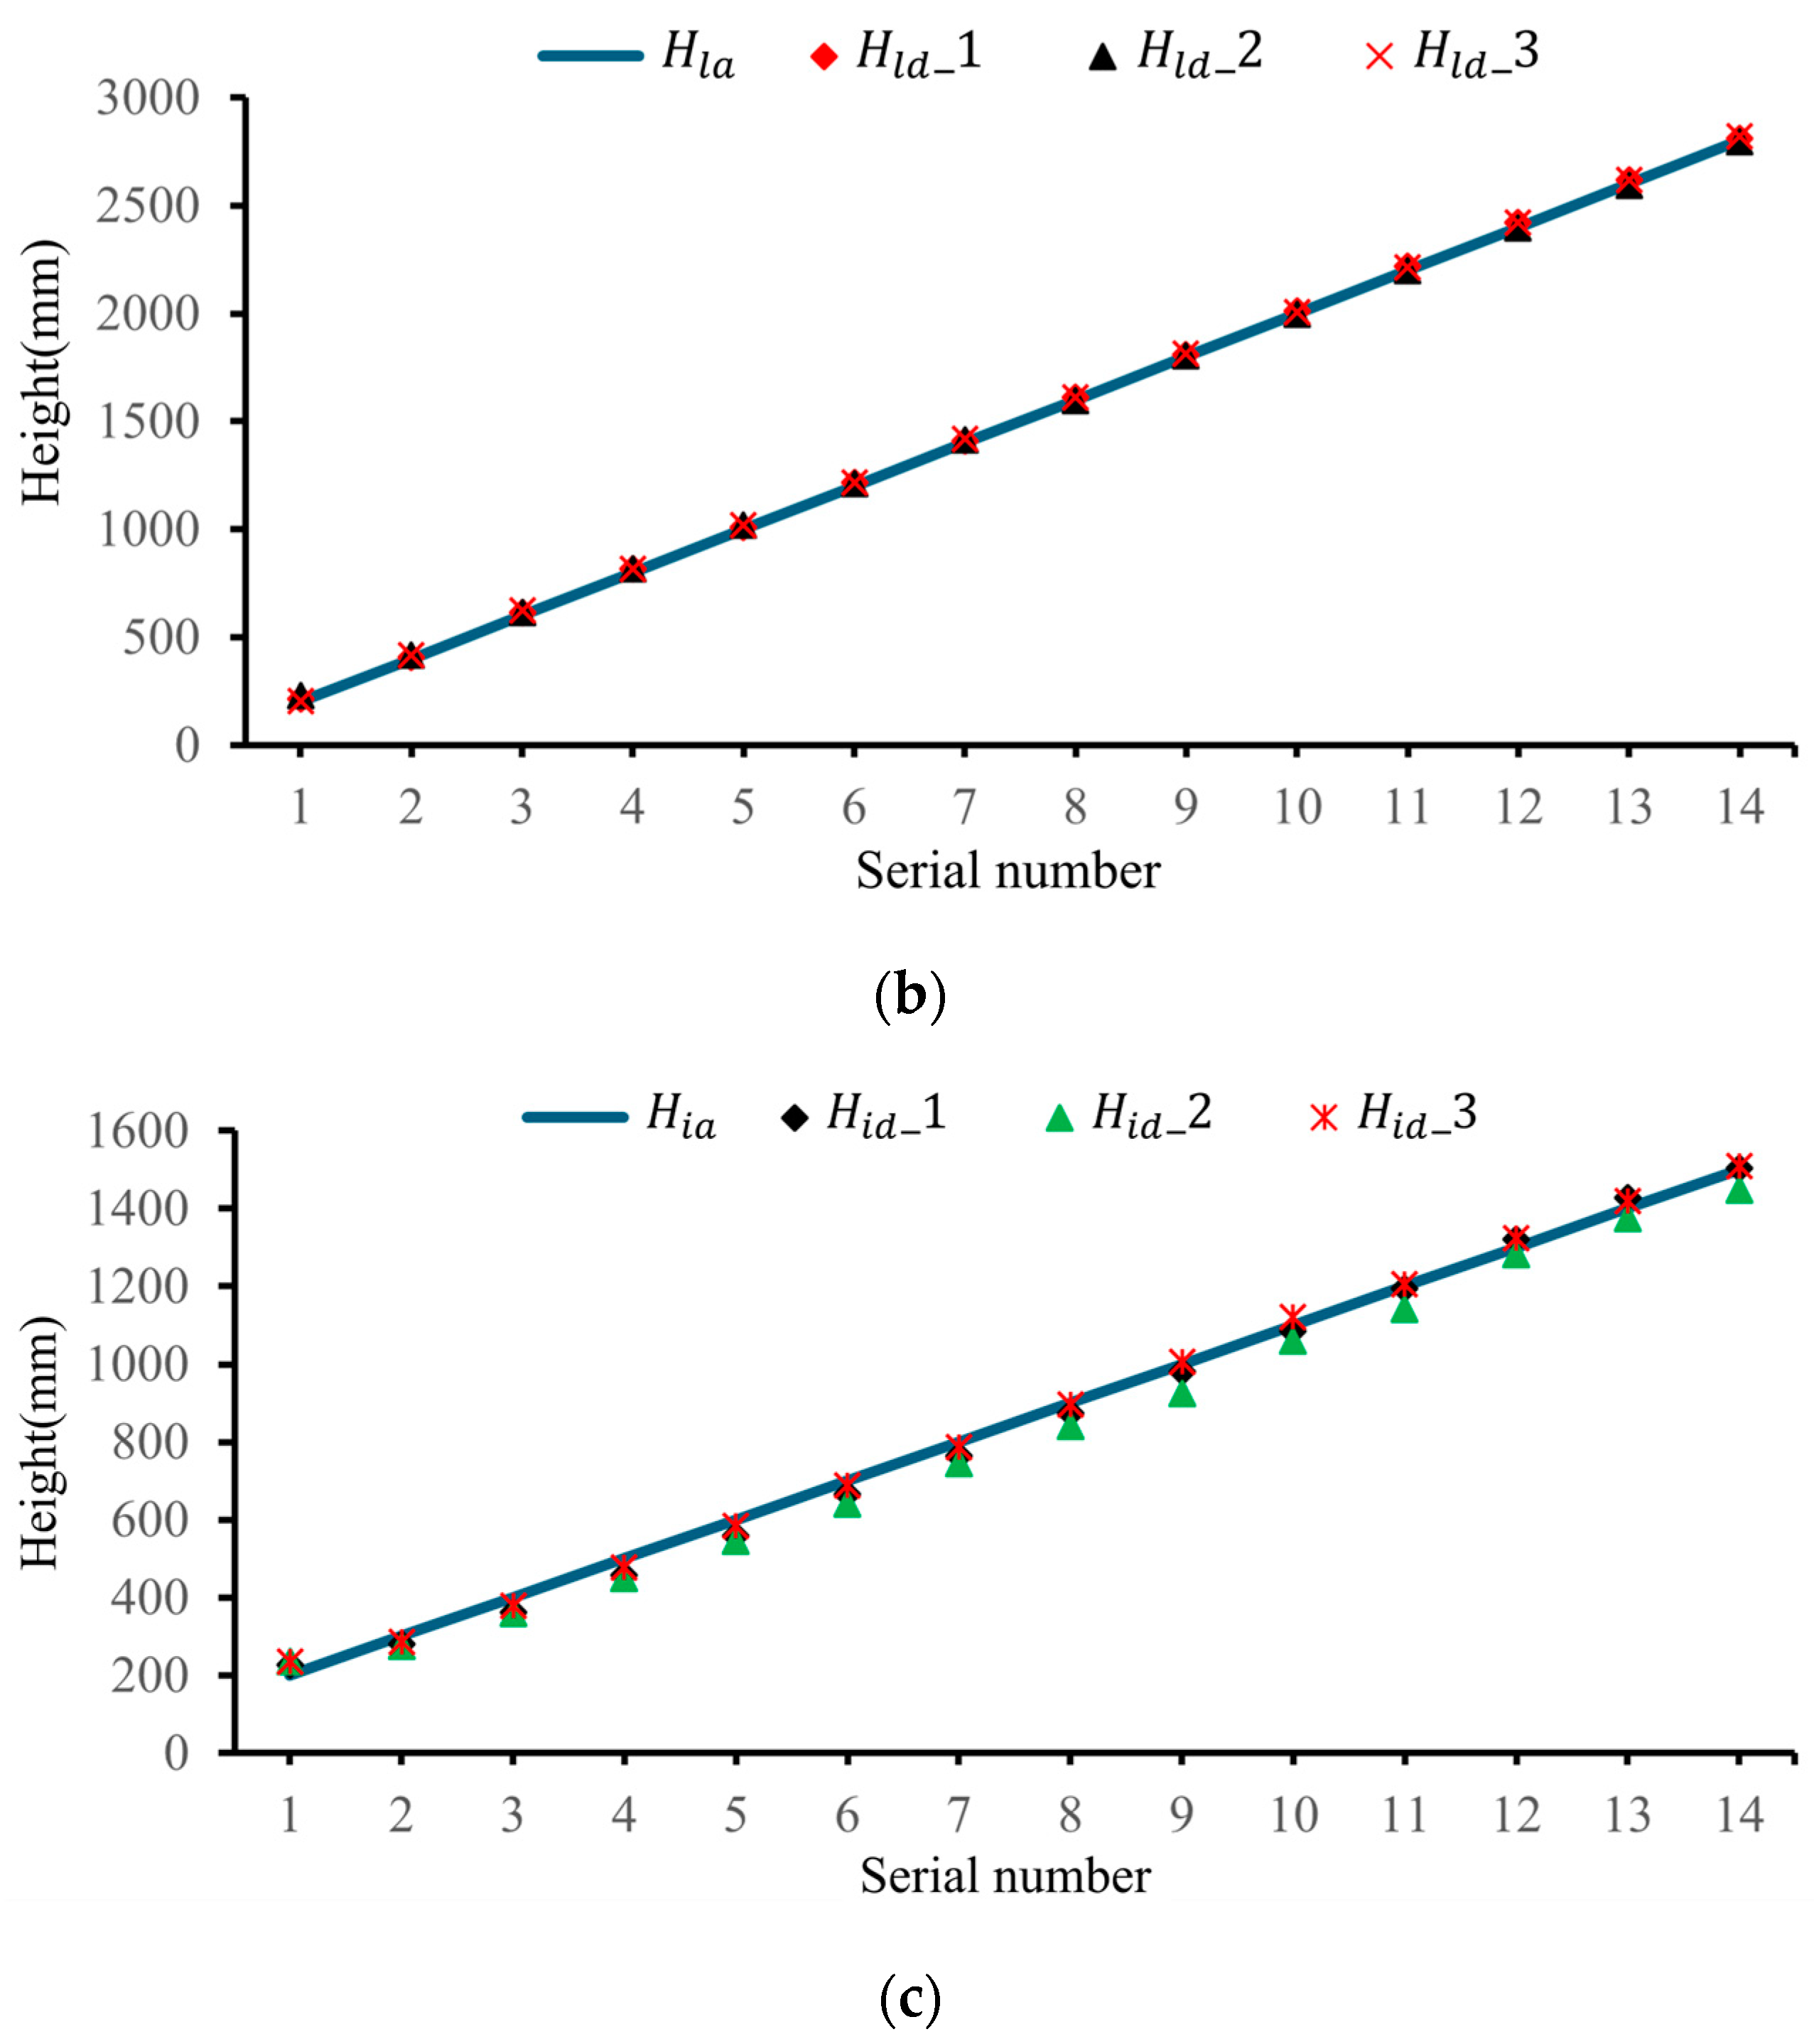
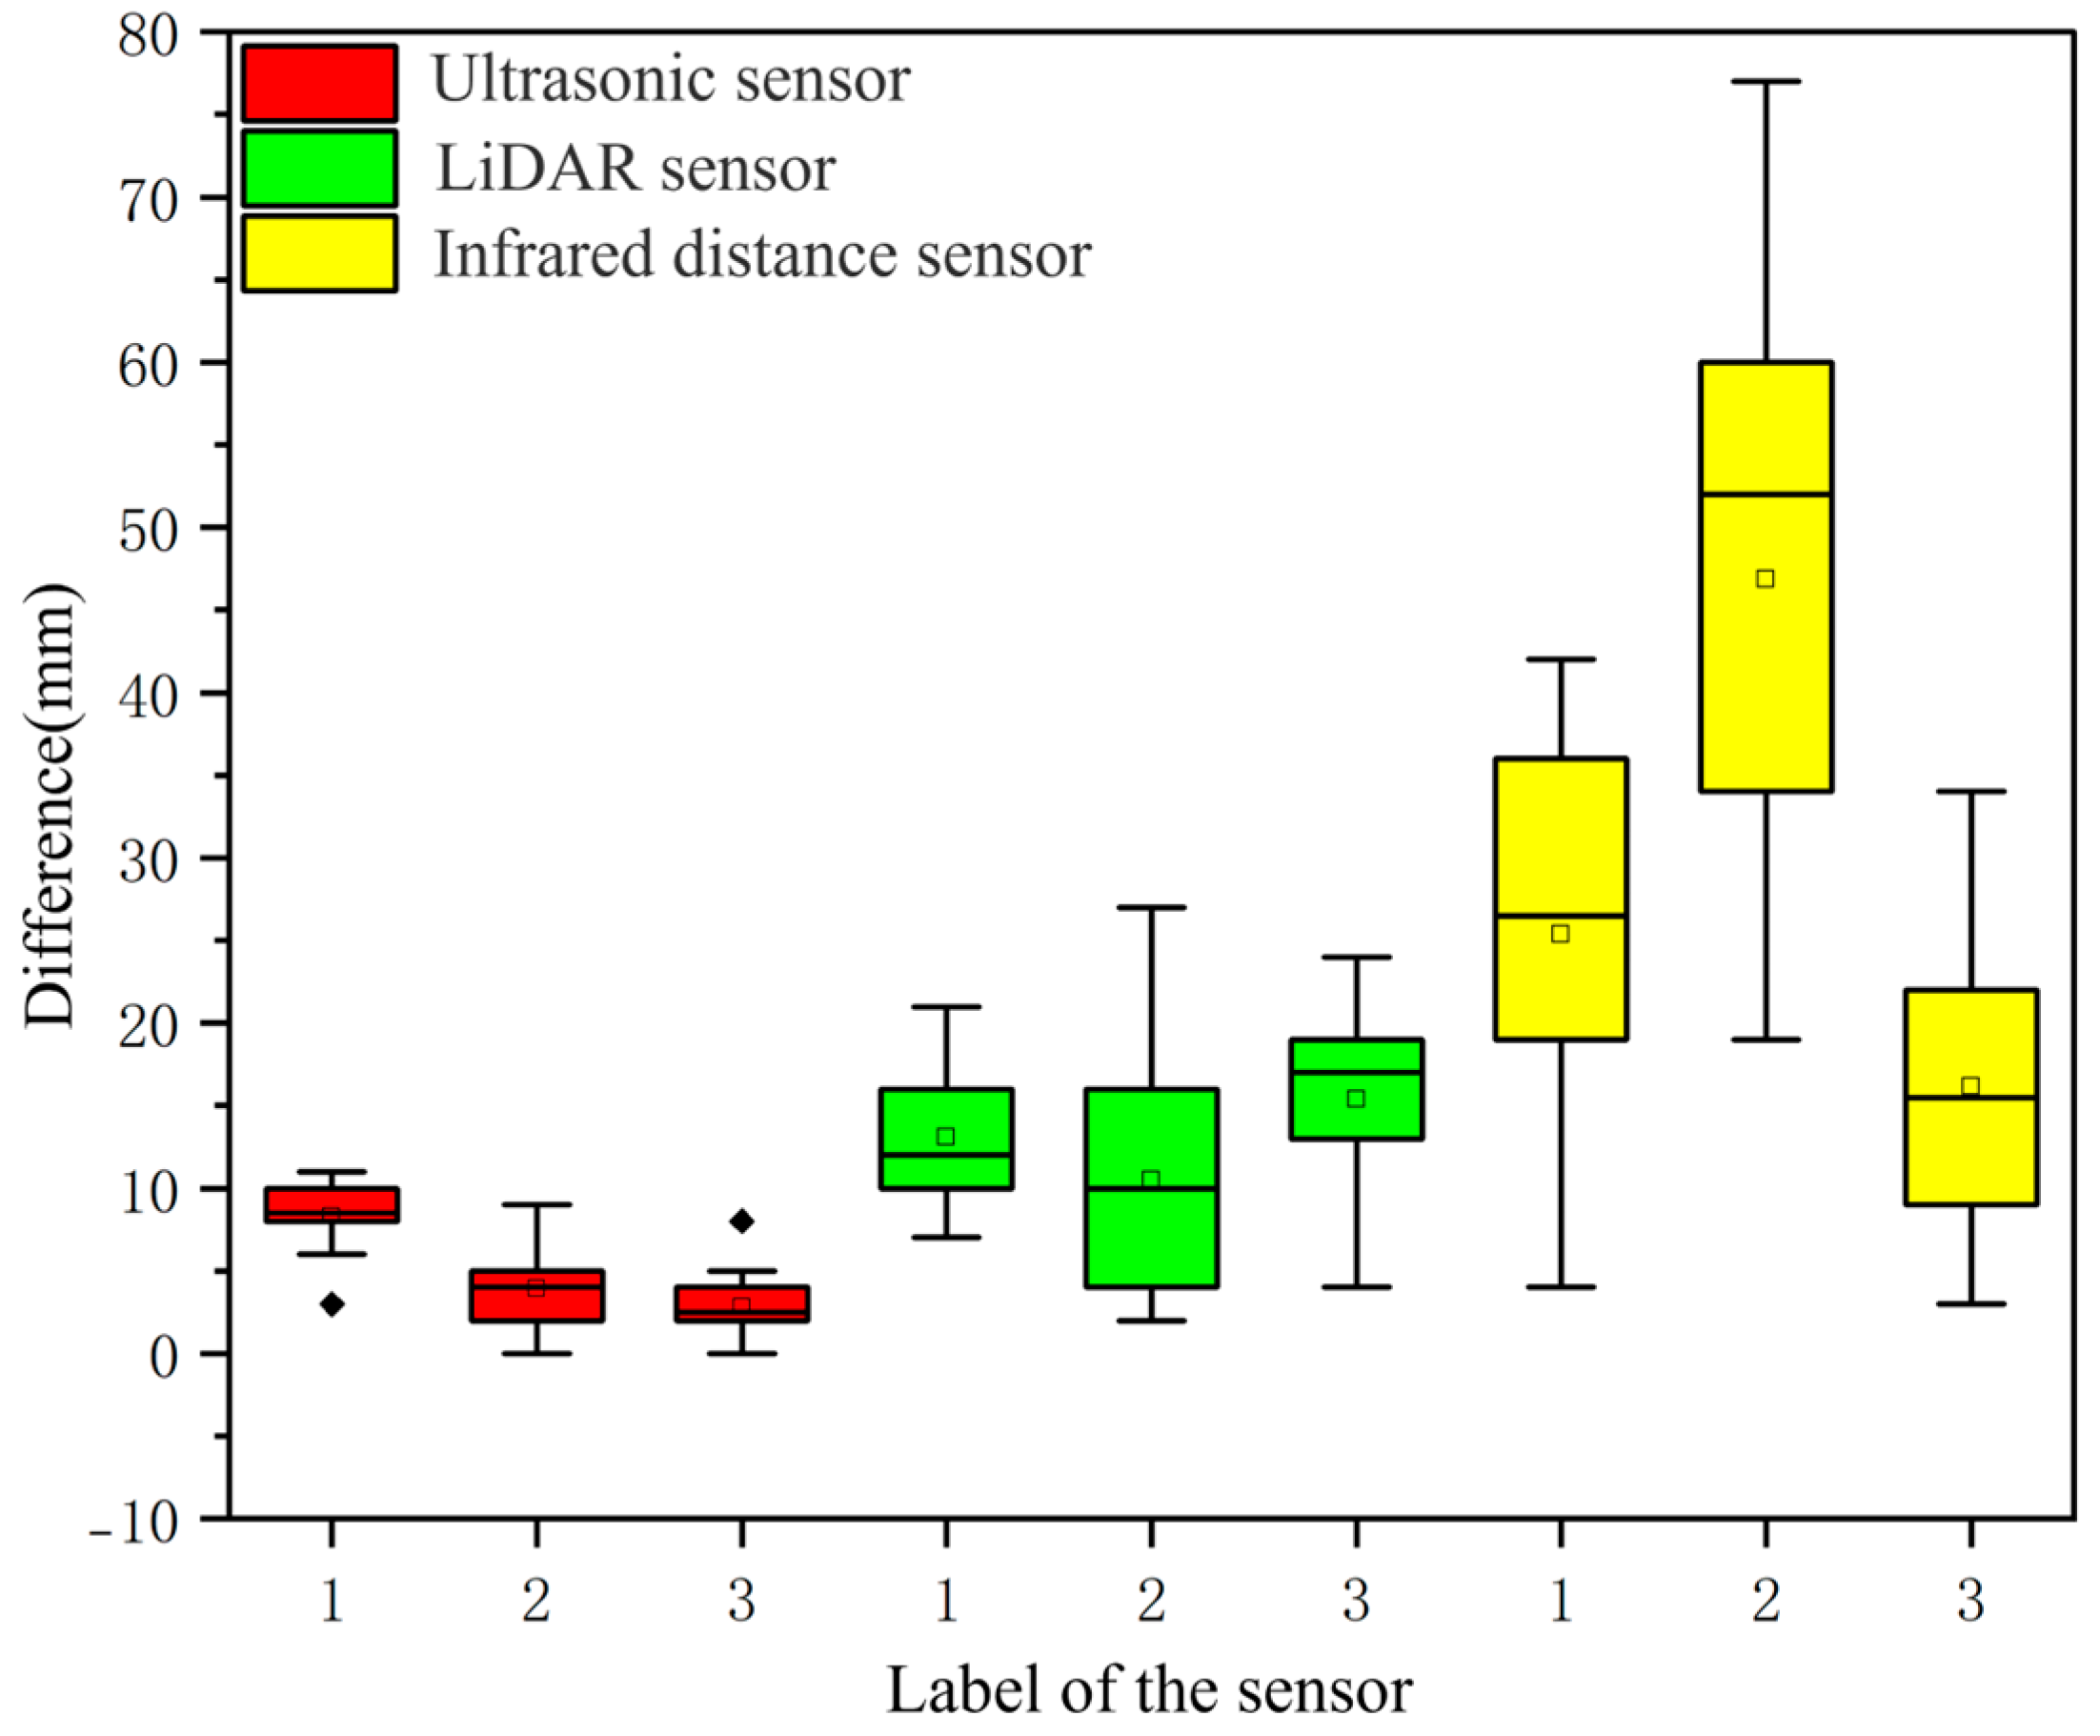
3.1.2. Comparison Results of the Detection Accuracy of Pepper Stacking Height

The accuracy test results for detecting the pepper stacking height using ultrasonic, LiDAR, and infrared distance sensors are shown in Figure 6. The detected heights for the ultrasonic (Hud) and LiDAR sensors (Hld) were found to be closely aligned with the actual heights (Hua, and Hla, respectively), while the infrared distance sensors (Hid) showed slight deviations from the actual heights (Hia). To further assess the detection accuracy of the three sensor types, we calculated the maximum and minimum differences, and the standard deviations of the differences between the detected and actual heights of the sensors. The results are shown in Table 2. From Table 2, the ultrasonic sensors demonstrated the highest accuracy, with a maximum standard deviation of 8.5 mm. The LiDAR sensors also showed a high accuracy but with slightly higher standard deviations, up to 16.2 mm. The infrared distance sensors had the lowest accuracy, with a maximum standard deviation of 49.6 mm. These results indicate that the ultrasonic and LiDAR sensors are more accurate than the infrared distance sensors for detecting the pepper stacking height.
We conducted a fluctuation analysis to further assess the detection accuracy of the three types of sensors in measuring the pepper stacking height, as illustrated in Figure 7. This analysis revealed that the ultrasonic sensors exhibited the smallest fluctuation in detection, while the infrared distance sensors showed larger detection fluctuations. Given the comparison of detection accuracy, the ultrasonic sensors were identified as the most suitable for detecting the pepper stacking height.
The high error fluctuation observed in the LiDAR sensors can be explained by the complex surface characteristics of pepper piles. LiDAR sensors use single-point laser beam ranging, which may result in variable measurements when the beam encounters peaks and valleys on the surface of the pile. This variability contributes to greater error fluctuations, as shown in Figure 8. The infrared distance sensors face similar challenges owing to the nonlinear relationship between the output voltage and detection distance, which complicates the linear correction. Additionally, as the detection distance increases, the strength of the received infrared signals diminishes owing to attenuation during propagation, further impacting the measurement accuracy.
In the current experimental process, although strict training and standardized operation procedures have been adopted to minimize the influence of human factors, this potential error cannot be completely excluded, but it has little impact on the overall results.

3.2. Construction and Validation of the Detection Model for Pepper Loading Capacity

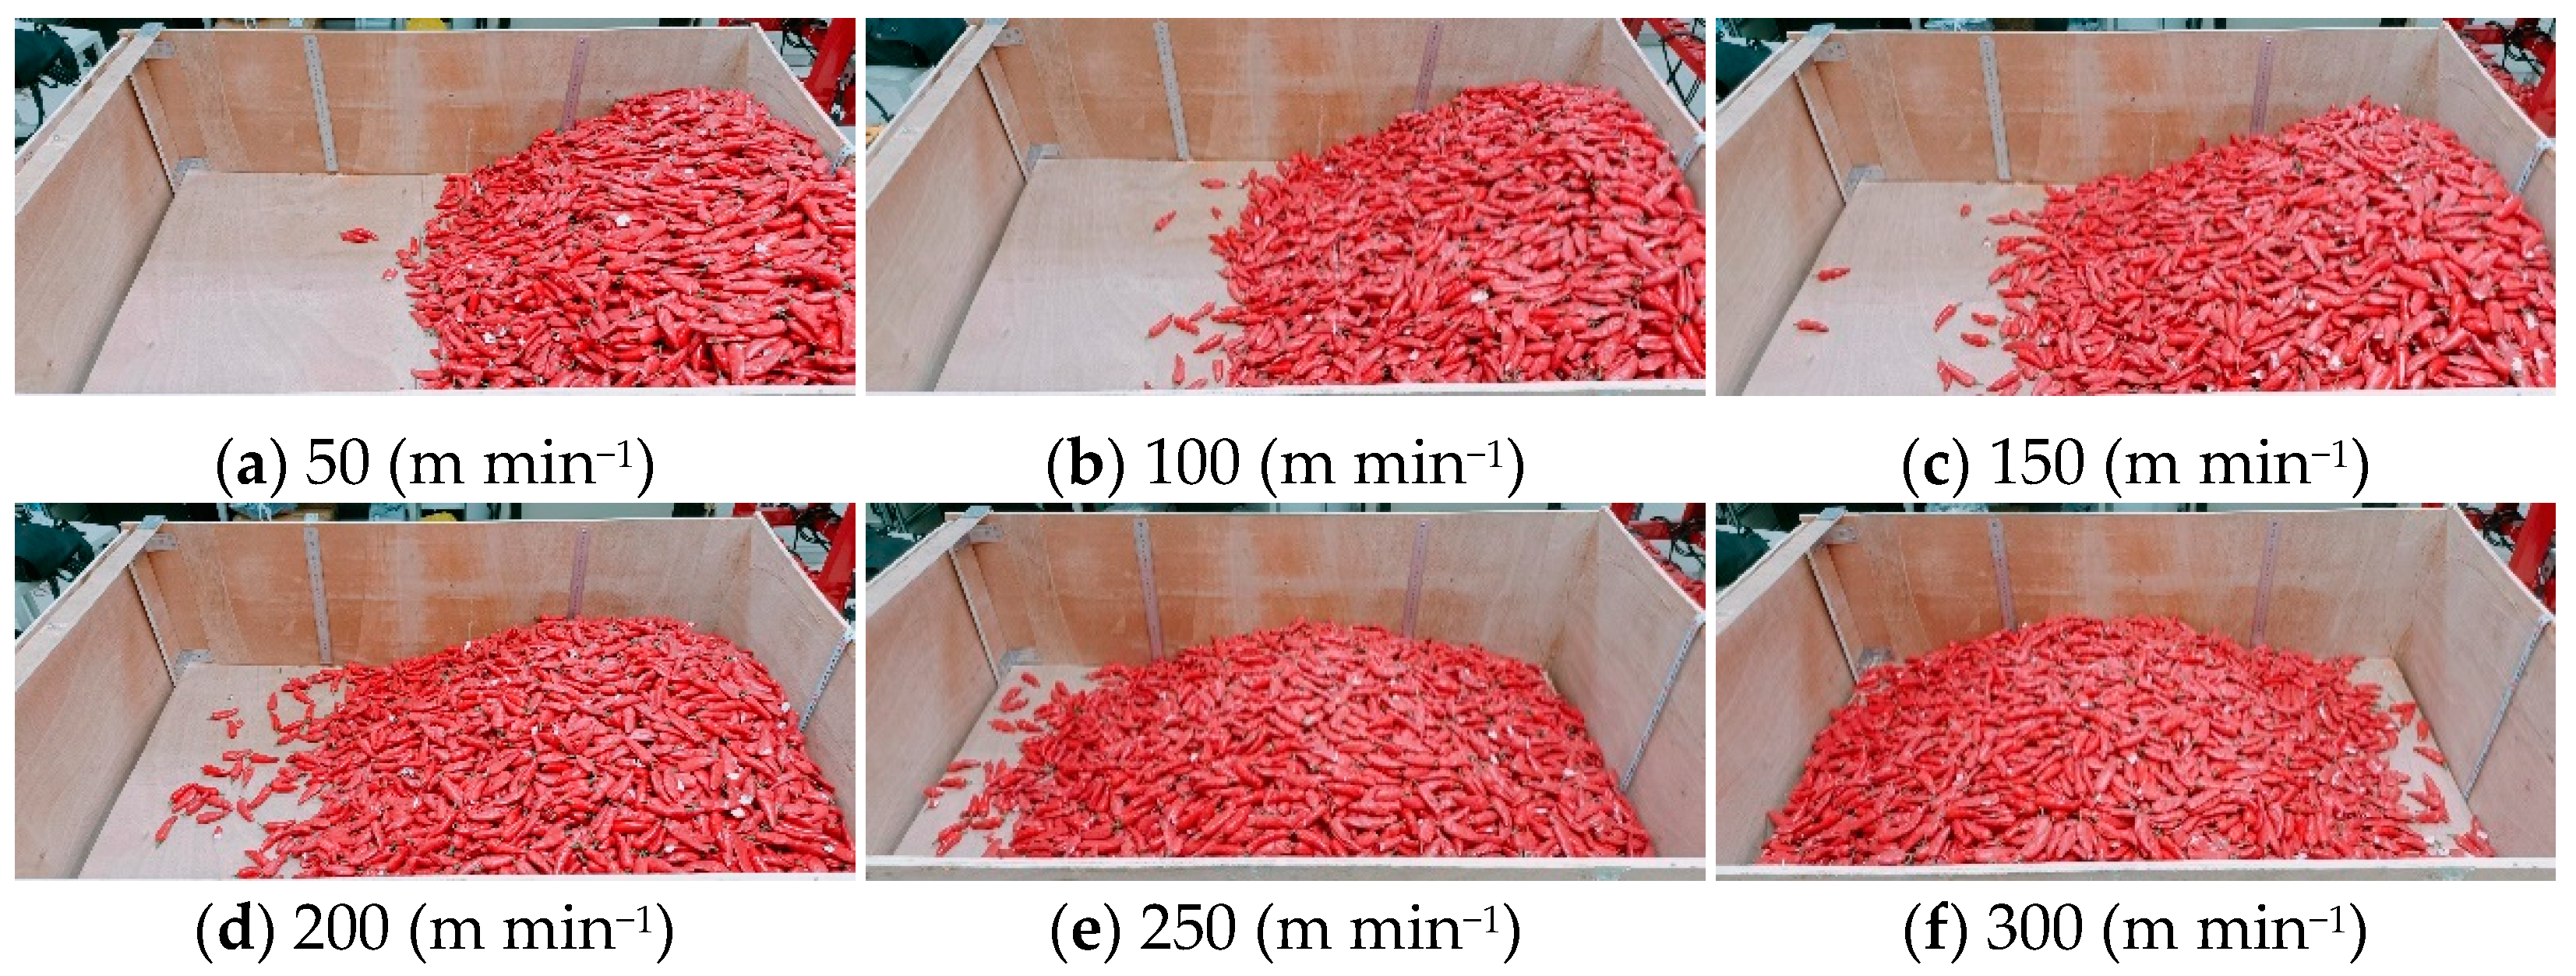
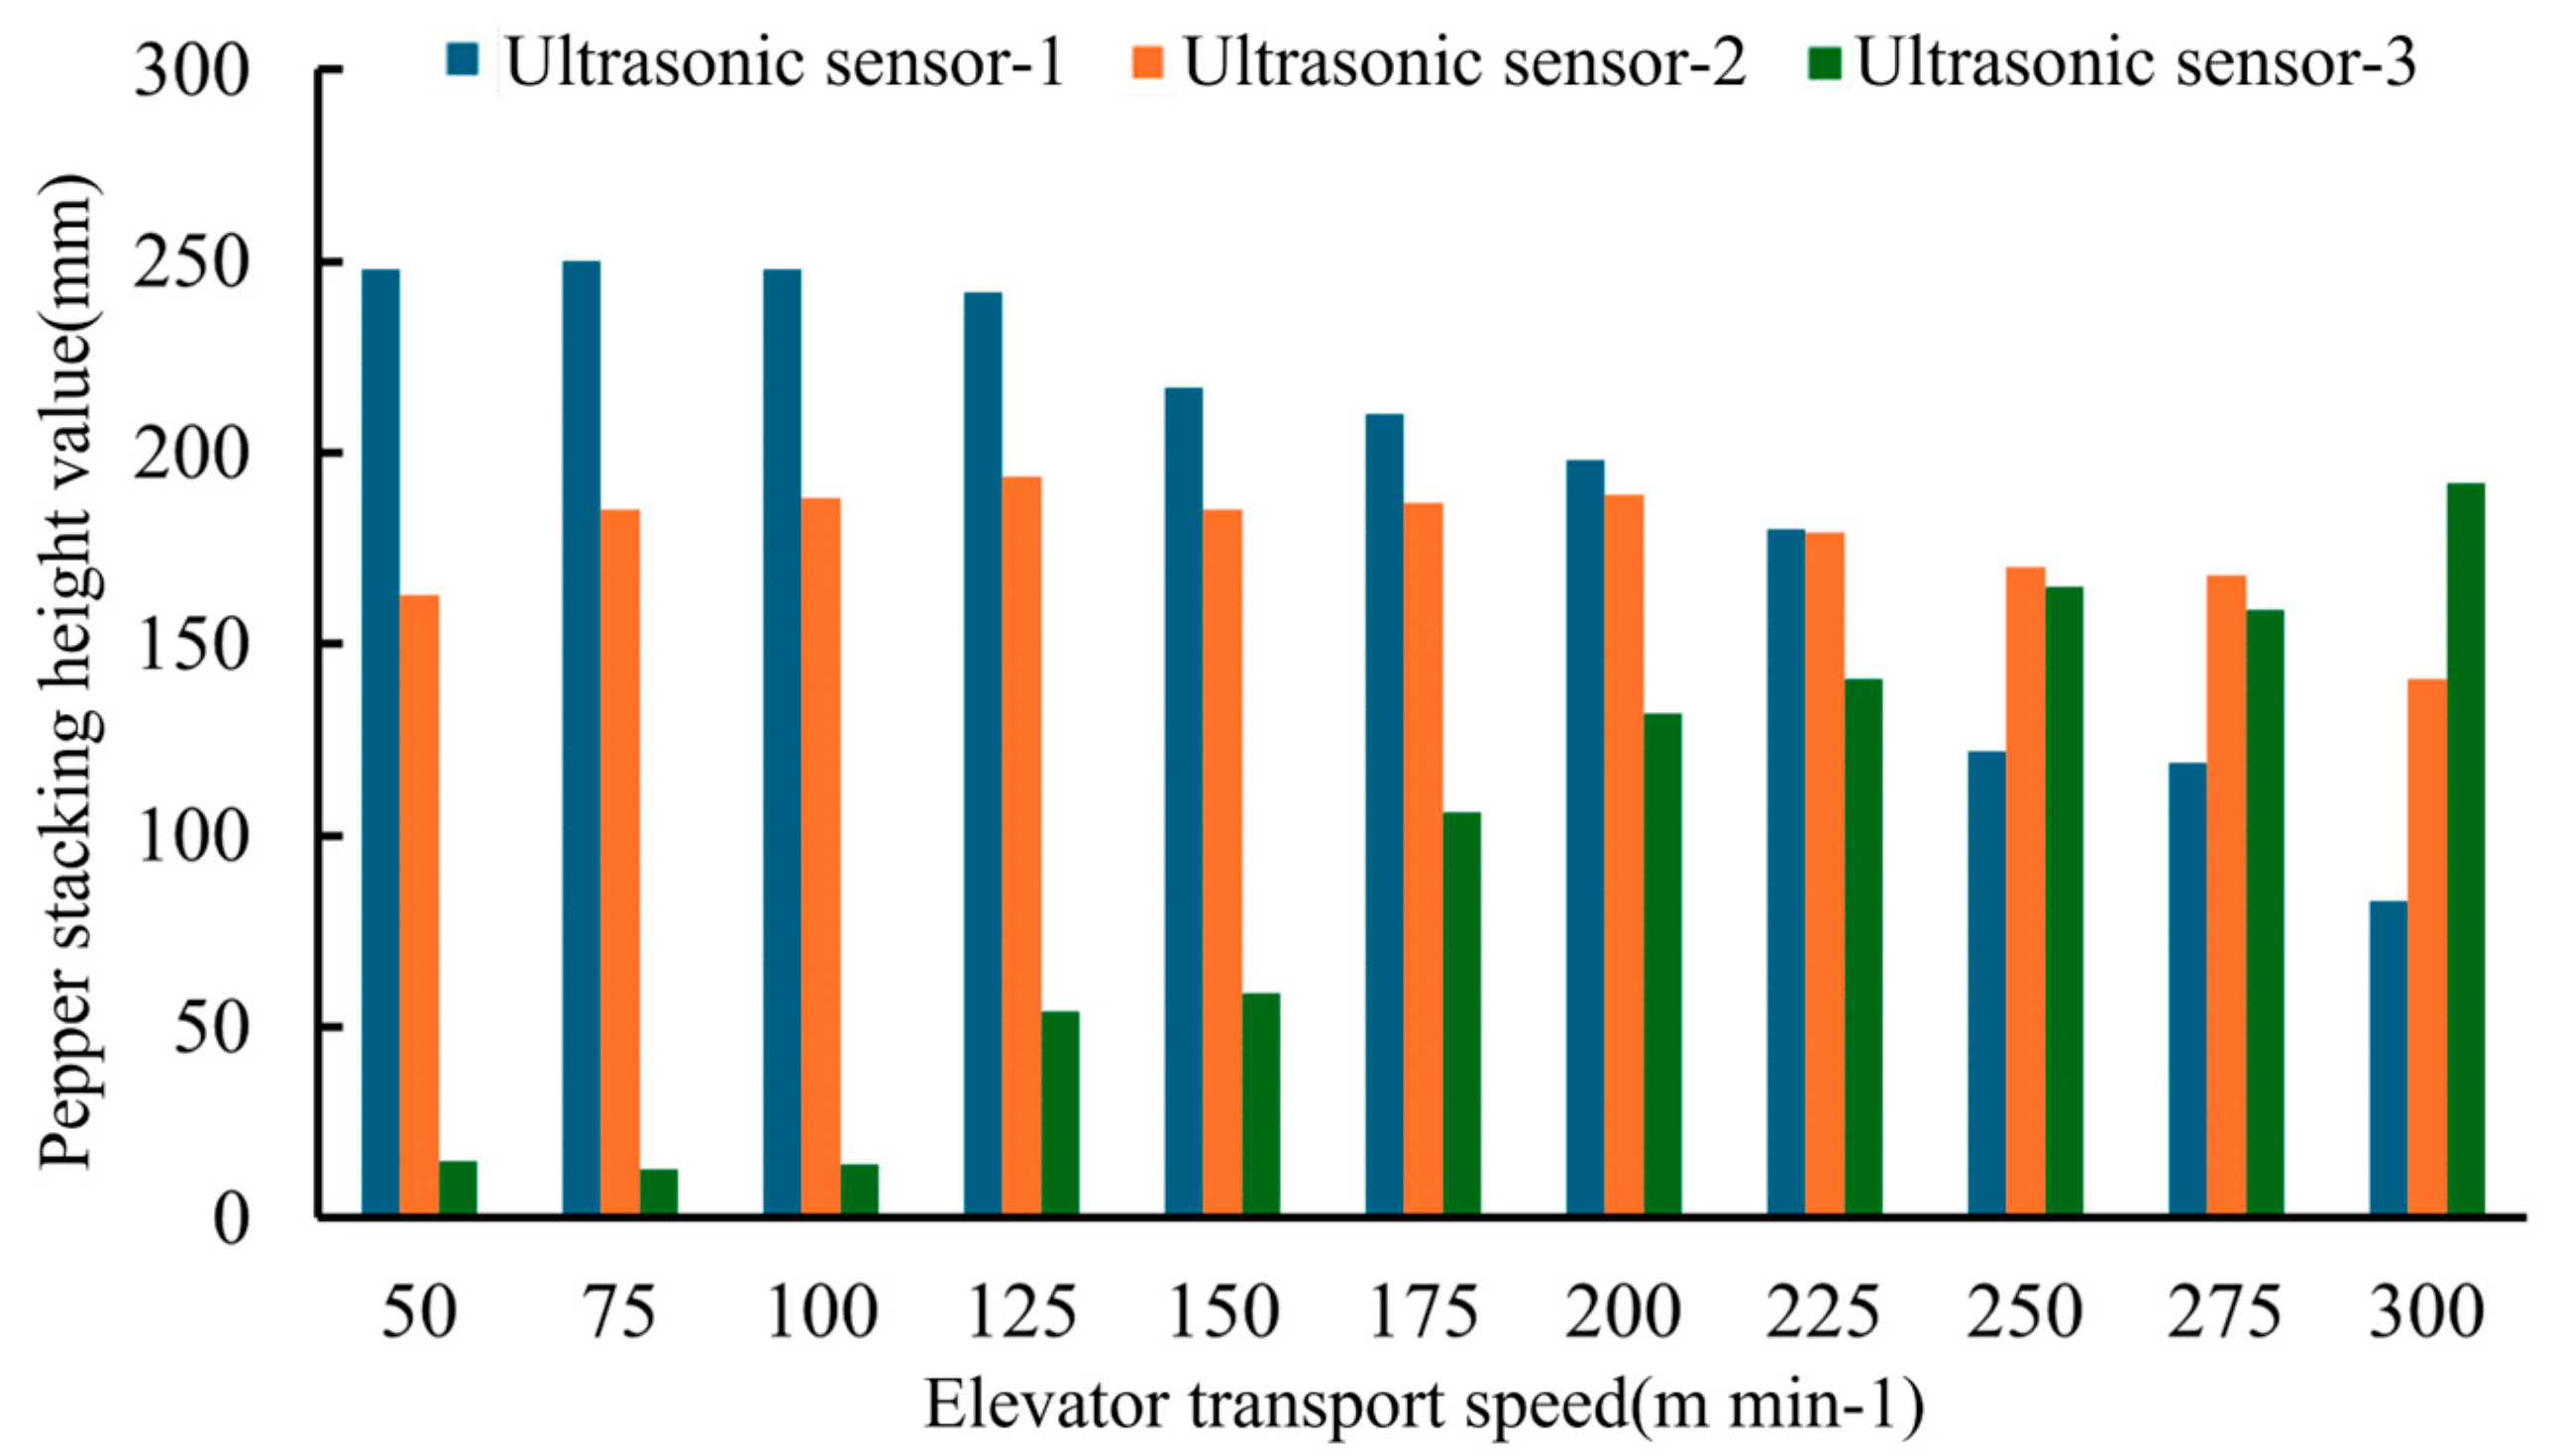
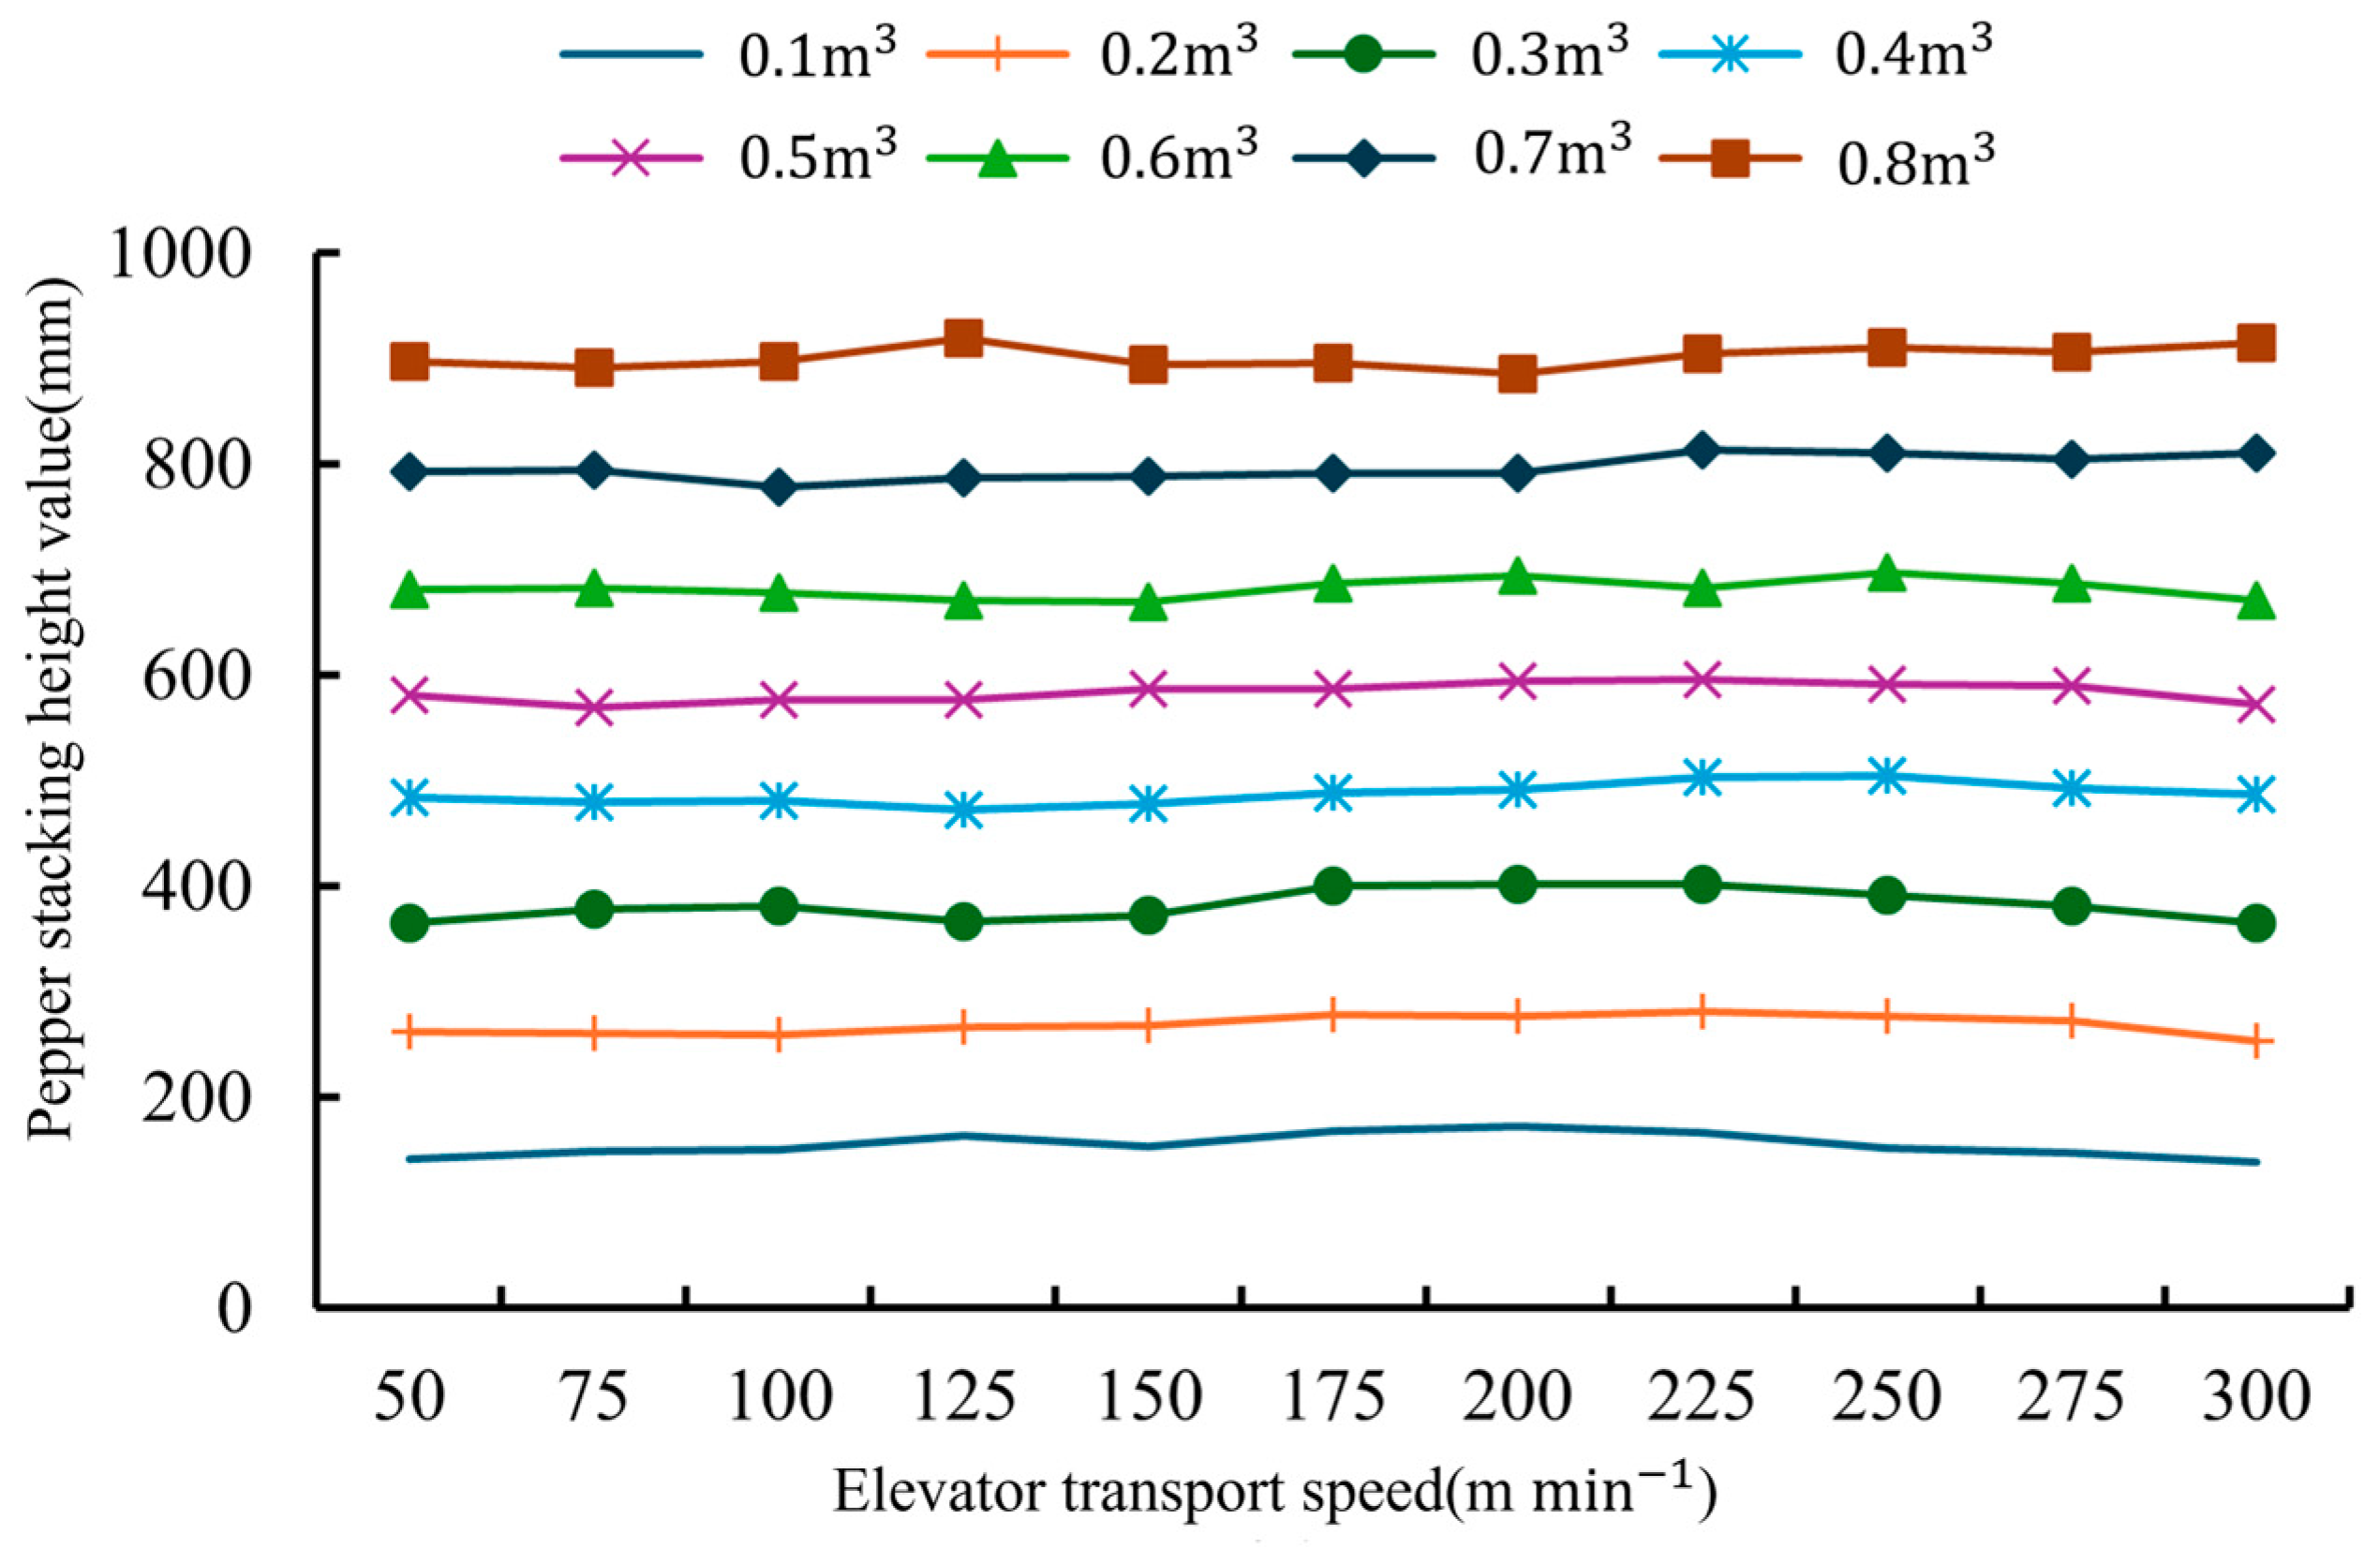
3.2.1. Detection Results of Pepper Stacking Height

In the pepper loading capacity detection tests, ultrasonic sensors were used to measure the stacking height of pepper piles with various volumes at different lifting speeds. Figure 9 shows the stacking states of 0.1 m3 peppers at different lifting speeds, and Table 3 lists the detected pepper stacking heights by the ultrasonic sensors. These data indicate that for a constant lifting speed, the detected values of the pepper stacking height increase with the volume of peppers; however, with a constant volume, the detected values vary with changes in lifting speed.
To evaluate the influence of the mounting locations of the ultrasonic sensors (as shown in Figure 10), and the lifting speed on detection accuracy, the volume of the fed peppers was fixed at 0.1 m3. This setup allowed for a controlled comparison of the detection results from ultrasonic sensors mounted at three different locations under different lifting speeds. As shown in Figure 11, the No. 1 ultrasonic sensor, closest to the lifting device, recorded a decreasing trend in stacking height with increasing speed, while the No. 3 sensor, located farthest from the device, showed an increasing trend. The No. 2 sensor, positioned between the two, exhibited an initial increase in detected height followed by a decrease as the speed continued to rise. The observed trends can be attributed to the inertia of the peppers: higher lifting speeds cause the peppers to have more momentum as they exit the lifting device, resulting in a farther fall. Consequently, sensors positioned differently relative to the pile capture varying heights, which change with the speed of the lifting device.
To mitigate the effect of the lifting speed on the accuracy of the detection model, a combination of multiple ultrasonic sensors was tested. The maximum differences in the average detected values from the combined sensors under the same pepper volume and different lifting speeds are shown in Table 4. When No. 1 and 2 sensors were combined, the maximum standard deviation of the average detected values was 34.1 mm. The highest difference in detected heights was 106.0 mm when the fed pepper volume was 0.1 m3. When No. 1 and 3 sensors were combined, the maximum standard deviation was 16.1 mm, with the highest difference in detected heights being 59.0 mm when the pepper volume was 0.8 m3. When No. 2 and 3 sensors were combined, the maximum standard deviation reached 40.8 mm, and the highest difference in detected heights was 114.0 mm at 0.7 m3. When all three sensors were combined, the maximum standard deviation was 11.5 mm. The highest difference in detected heights was 37.0 mm when the pepper volume was 0.3 m3.
This indicates that asymmetrical sensor combinations (No. 1 and 2, and No. 2 and 3) were more sensitive to variations in the lifting speed. In contrast, the symmetrical sensor combination (No. 1 and 3) exhibited a reduced sensitivity to the lifting speed but showed some vulnerability to abrupt changes, as indicated by a maximum standard deviation of 16.1 mm at 0.3 m3 and 6.9 mm at 0.4 m3.
The optimal setup was achieved using all three sensors simultaneously. This configuration provided consistent detection results across different lifting speeds, minimizing the variability in height measurements., as shown in Figure 12.

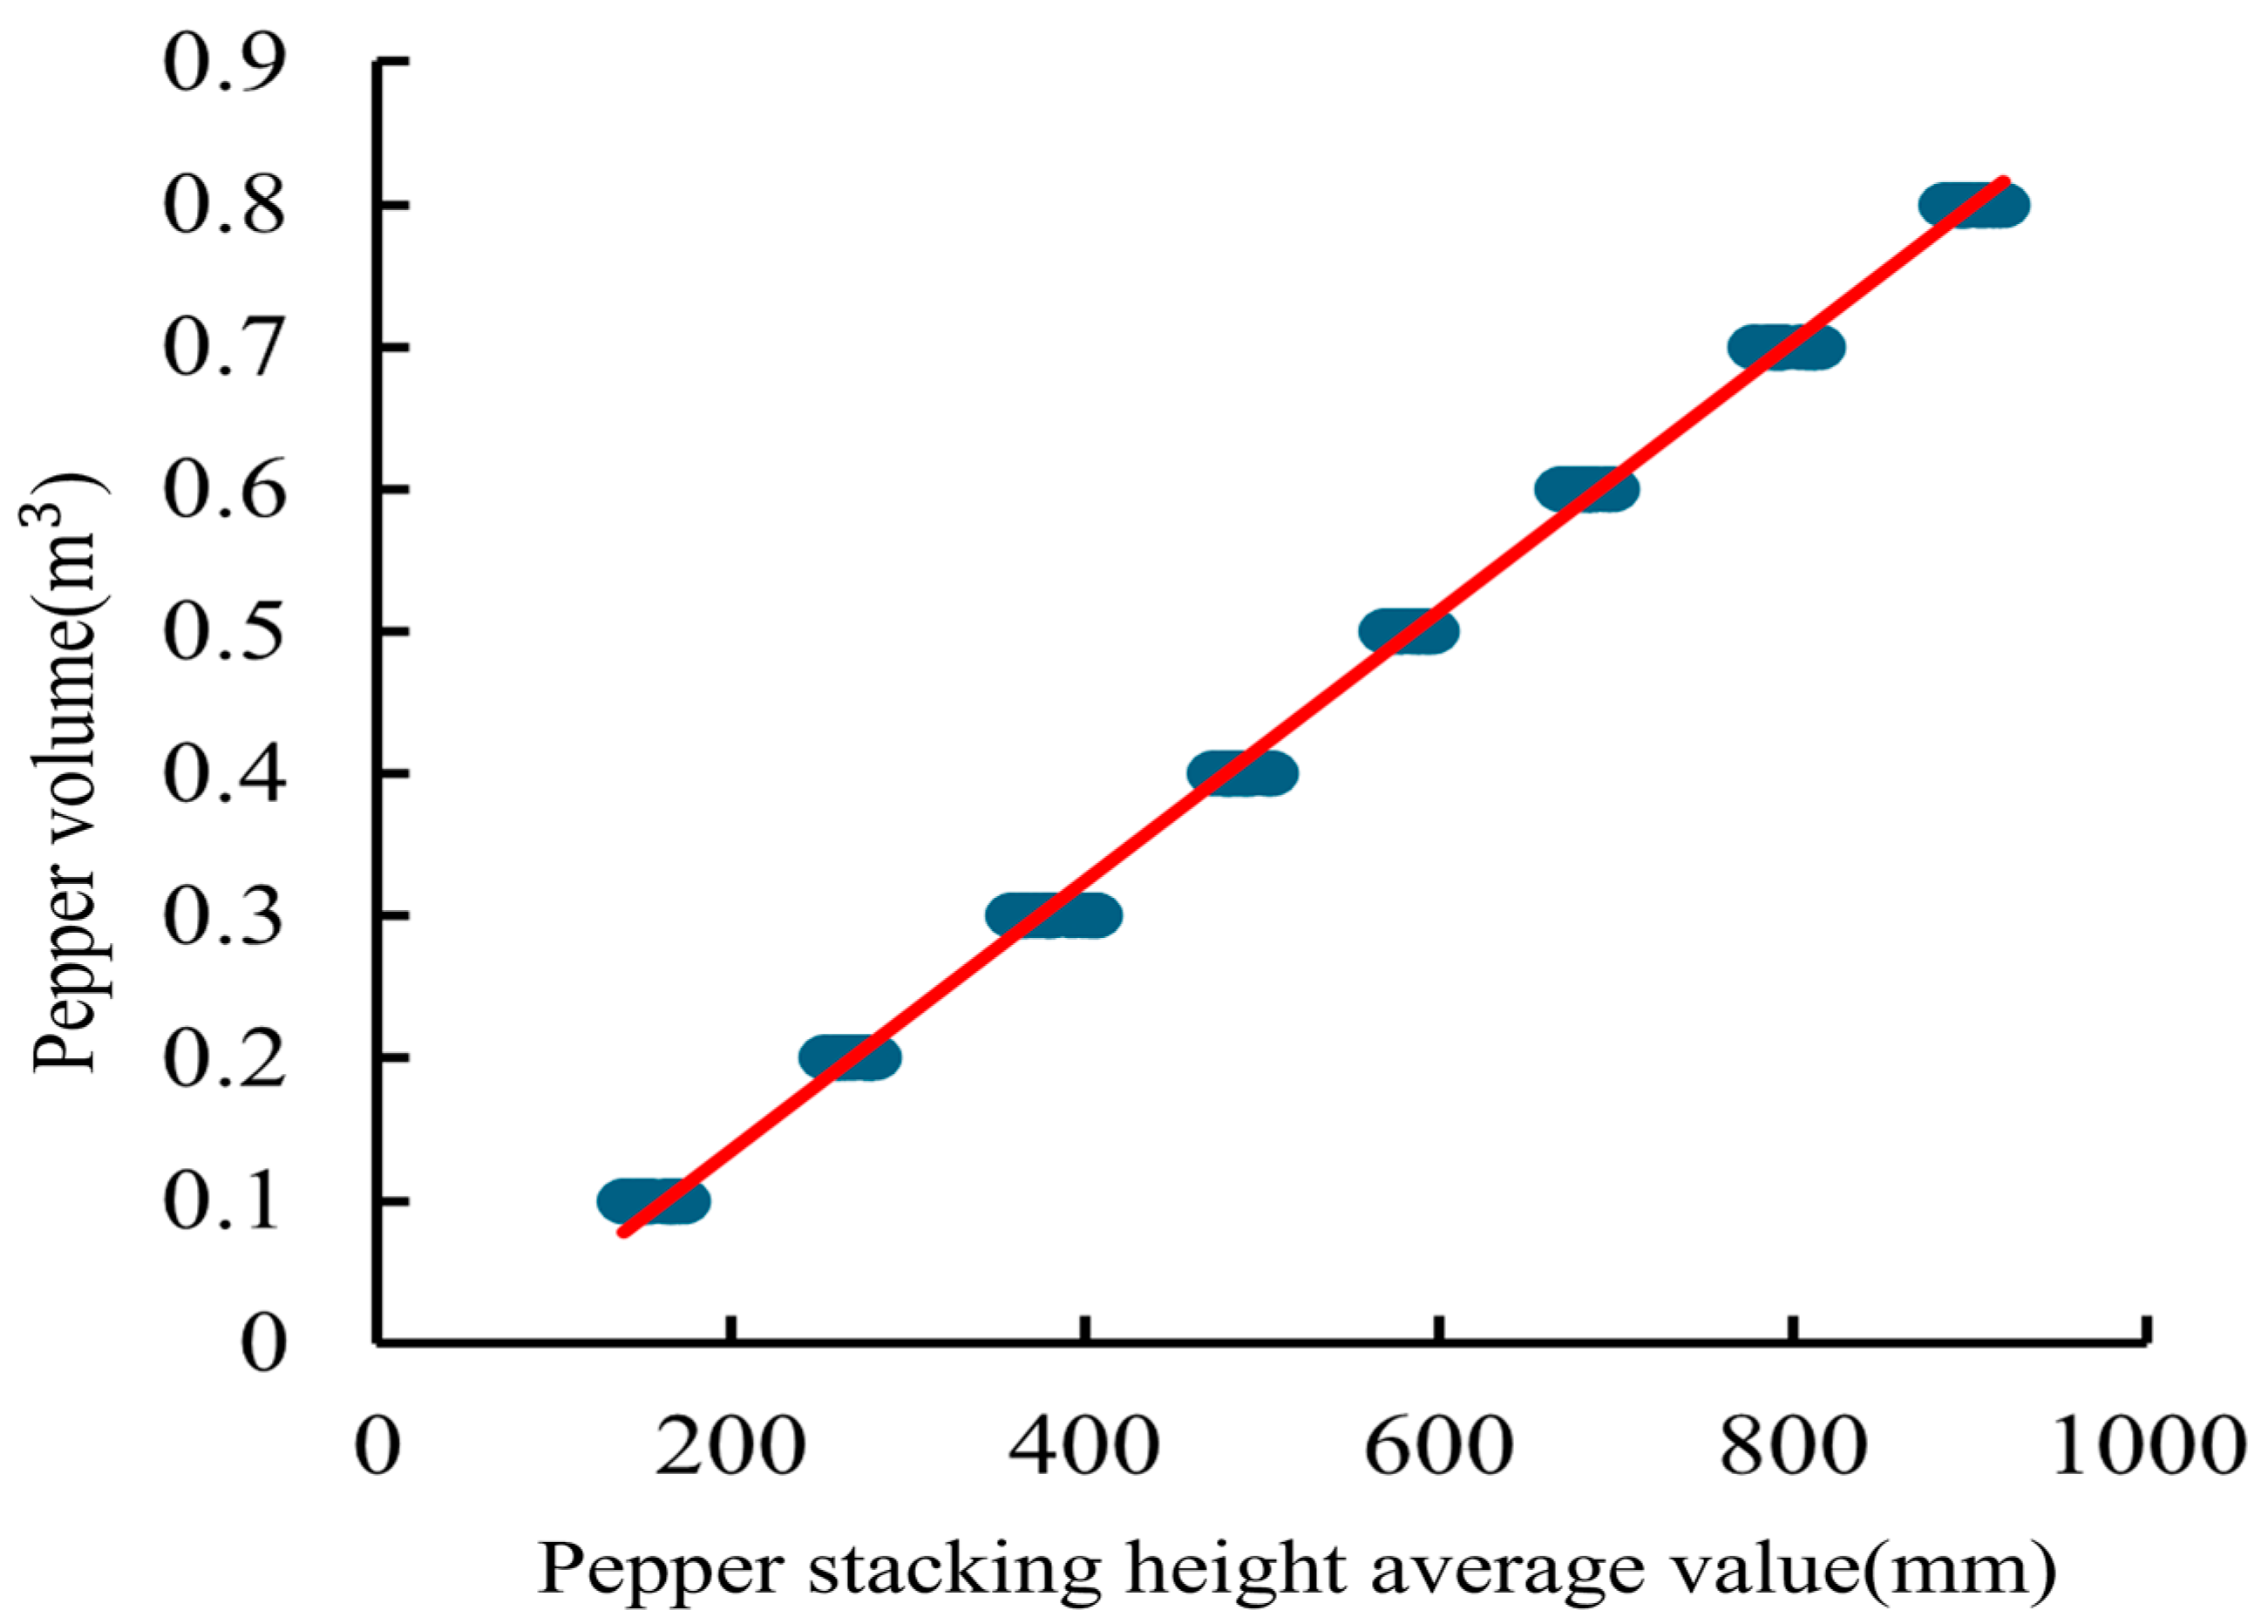
3.2.2. Construction of the Pepper Loading Capacity Detection Model

Using the combined data from the three ultrasonic sensors, a pepper loading capacity detection model was developed by averaging the detected pepper stacking heights from the three ultrasonic sensors across different lifting speeds and corresponding to the same pepper volume (Figure 13). The model is represented by
V = 9.452 10 4 × 1800 y 5.3113 × 10 2 ,
where V is the pepper volume and y is the average detected height from the three ultrasonic sensors. The coefficient of determination, R2, of the detection model is 0.9975, indicating a very strong correlation between the detected stacking height and the pepper volume. This high R2 value suggests that the model is well-fitted.

3.2.3. Validation Results of the Pepper Loading Capacity Detection Model

To validate the accuracy of the pepper loading capacity detection model, validation data were input into the model to obtain the detected pepper volume by the ultrasonic sensors at different speeds. The results are summarized in Table 5. The results show that the lifting speed has a minor impact on the model’s output. The largest error occurs when the volume of fed peppers is 0.1 m3. As the volume of fed peppers increases, the relative error of the model decreases; when the volume of fed peppers exceeds 0.4 m3, the mean relative error of the detection model is less than 2%.
These results are similar to those presented by Chengqian Jin et al. [30], who measured the yield of grain combined harvesters based on duty cycle, avoiding the effect of lifting speed. However, Chengqian Jin et al. only considered three lifting speeds, and their fitted global model needs validation with a broader range of lifting speeds. On the other hand, Hongwei Zeng et al. [31] used a monocular camera to measure the yield of grain combined harvesters and constructed a measurement model that avoided the impact of lifting speed. However, the model by Hongwei Zeng et al. required the lifting speed in the calculation, complicating the overall system. Moreover, the use of images for mechanized harvesting of peppers still requires further research. The model constructed in this study is highly stable in detecting pepper volumes under varying lifting speeds, with minimal error impact. The volume accumulation effect can significantly reduce the overall error and improve the detection accuracy and reliability in actual harvesting. Additionally, the model considers all lifting speeds in mechanized pepper harvesting and does not require the current lifting speed to be included in the calculations.

4. Conclusions

This study compared ultrasonic, infrared distance, and LiDAR sensors to determine their accuracy in detecting pepper stacking height. The results indicated that the standard deviation of detections was 8.5 mm for ultrasonic sensors, 16.2 mm for LiDAR sensors, and 49.6 mm for infrared distance sensors. Among these, the infrared distance sensors exhibited the largest fluctuation range whereas ultrasonic sensors exhibited the smallest fluctuation range, making them the most suitable for detecting pepper stacking height.
This study analyzed the effects of sensor count, mounting locations, and lifting speed on the accuracy of detecting pepper stacking height using ultrasonic sensors. The results show that with only one sensor, the lifting speed significantly affects the detection results, regardless of the sensor’s mounting location. Using two asymmetrically mounted sensors also results in detection variability owing to lifting speed. Even when symmetrically mounted, two sensors still yielded unstable average detections which were susceptible to sudden changes. The combination of three symmetrically mounted sensors minimized the impact of lifting speed, resulting in consistent average detection values, with fluctuations in difference ranging from 26 to 37 mm.
The model, developed using the stacking heights and corresponding volumes detected by three ultrasonic sensors, demonstrated a high accuracy. The mean relative error of the model dropped to less than 2% for pepper volumes exceeding 0.4 m3, even with variations in lifting speed. This detection model aims to provide real time, stable and accurate data for decision-making, scheduling, and coordination in the combined harvesting of peppers, enhancing the efficiency and utilization of agricultural machinery.

Author Contributions

Conceptualization, C.Z. and H.L.; methodology, H.L., C.L. and C.Z.; validation, C.L.; formal analysis, X.W. and J.S.; investigation, H.L., M.C. and C.L.; resources, C.Z. and C.L.; data curation, H.L., J.S. and M.C.; writing—original draft preparation: H.L.; writing—review and editing, C.Z. and C.L.; funding acquisition, C.Z., J.S. and X.W.; supervision, C.Z. and C.L. All authors have read and agreed to the published version of the manuscript.

Funding

This research was funded by the National Key Research and Development Program of China (2022YFD2002001-2) and the Laboratory Construction Project of 2024 National Engineering Research Center for Intelligent Equipment in Agriculture (PT2024-41).

Data Availability Statement

The original contributions presented in the study are included in the article, further inquiries can be directed to the corresponding author/s.

Conflicts of Interest

Author Jian Song was employed by the company Beijing PAIDE Science and Technology Development Co., Ltd. The remaining authors declare that the research was conducted in the absence of any commercial or financial relationships that could be construed as a potential conflict of interest.

References

  1. Hu, S.; Hu, M.; Yan, W.; Zhang, W. Design and Experiment of an Integrated Automatic Transplanting Mechanism for Picking and Planting Pepper Hole Tray Seedlings. Agriculture 2022, 12, 557. [Google Scholar] [CrossRef]
  2. Zou, X.; Ma, Y.; Dai, X.; Li, X.; Yang, S. Spread and Industry Development of Pepper in China. Acta Hortic. Sin. 2020, 47, 1715–1716. [Google Scholar] [CrossRef]
  3. Hernández-Pérez, T.; Gómez-García, M.; Valverde, M.; Paredes-López, O. Capsicum annuum (Hot Pepper): An Ancient Latin-American Crop with Outstanding Bioactive Compounds and Nutraceutical Potential. A Review. Compr. Rev. Food sci. Food saf. 2020, 19, 2972–2993. [Google Scholar] [CrossRef] [PubMed]
  4. Zhang, Q.; Xiao, H.; Yang, X.; Bai, J.; Lou, Z.; Gao, Z. Effects of Pretreatment on Air Impingement Drying Characteristics and Product Color for Line Pepper. Trans. Chin. Soc. Agric. Eng. (Trans. CSAE) 2012, 28, 276–281. [Google Scholar] [CrossRef]
  5. Deng, L.; Liu, T.; Jiang, P.; Qi, A.; He, Y.; Li, Y.; Yang, M.; Deng, X. Design and Testing of Bionic-Feature-Based 3D-Printed Flexible End-Effectors for Picking Horn Peppers. Agronomy 2023, 13, 2231. [Google Scholar] [CrossRef]
  6. Wu, D.; Ma, Z.; Zhang, J.; Xu, W.; He, H.; Li, Z. Simulation Analysis of Working Circuit Performance of Mountain Pepper Harvester Based on Improved Load-Sensitive System. Appl. Sci. 2023, 13, 10008. [Google Scholar] [CrossRef]
  7. Gupta, C.; Tewari, V.K.; Machavaram, R. Evaluation of a Laboratory-Based Prototype of a Comb-Type Picking Mechanism for Chili Pepper Harvester. Biosyst. Eng. 2022, 47, 69–78. [Google Scholar] [CrossRef]
  8. Zhai, Z.; Wang, X.; Wang, L.; Zhu, Z.; Du, Y.; Mao, E. Collaborative Path Planning for Autonomous Agricultural Machinery of Master Slave Cooperation. Trans. Chin. Soc. Agric. Mach. 2021, 52, 542–547. [Google Scholar] [CrossRef]
  9. Yuan, X.; Yang, S.; Jin, R.; Zhao, L.; Dao, E.; Zheng, N.; Fu, W. Design and Experiment of Double Helix Pair Roller Pepper Harvesting Device. Trans. Chin. Soc. Agric. Eng. (Trans. CSAE) 2021, 37, 1–9. [Google Scholar] [CrossRef]
  10. Liu, D.; Wang, Z.; Bai, X.; Zhao, Y. Load Status Detection in Cooperative Operation of Harvester-Grain Cart. J. Agric. Mech. Res. 2021, 43, 254–258. [Google Scholar] [CrossRef]
  11. Li, H.; Yao, G.; Chen, L. Farm Machinery Monitoring and Scheduling System Based on GPS, GPRS, and GIS. Trans. Chin. Soc. Agric. Eng. (Trans. CSAE) 2008, 24, 119–122. [Google Scholar]
  12. Zhang, W.; Zhang, Z.; Zhang, F.; Ding, F.; Hu, L.; Lou, X. Cooperative Autonomous Operation Strategy and Experiment of the Rice Harvester Together with a Rice-Transporting Vehicle. Trans. Chin. Soc. Agric. Eng. (Trans. CSAE) 2022, 38, 1–9. [Google Scholar] [CrossRef]
  13. Jin, C.; Chai, Z.; Ni, Y.; Liu, Z. Research Review on Online Grain Yield Monitoring for Combine Harvester: Yield Sensing, Yield Mapping, and Dynamic Model. J. China Agric. Univ. 2020, 25, 137–152. [Google Scholar] [CrossRef]
  14. Li, C.; Qi, G.; Hang, C. Research on the Measuring Method of the Harvester Grain Yield Based on Weighing. J. Agric. Mech. Res. 2014, 36, 42–45. [Google Scholar] [CrossRef]
  15. Zhang, X.; Hu, X.; Zhang, A.; Zhang, Y.; Yuan, Y. Method of Measuring Grain-Flow of Combine Harvester Based on Weighing. Trans. Chin. Soc. Agric. Eng. (Trans. CSAE) 2010, 26, 125–129. [Google Scholar]
  16. Schrock, M.D.; Oard, D.L.; Taylor, R.K.; Eisele, E.L.; Pringle, J.L. Diaphragm Impact Sensor for Measuring Combine Grain Flow. Appl. Eng. Agric. 1999, 15, 639–642. [Google Scholar] [CrossRef]
  17. Iida, M.; Kaho, T.; Lee, C.K.; Umeda, M.; Suguri, M. Measurement of Grain Yields in Japanese Paddy Field. In Proceedings of the Fourth International Conference on Precision Agriculture, St Paul, MN, USA, 19–22 July 1998; Robert, P.C., Rust, R.H., Larson, W.E., Eds.; Wiley: Hoboken, NJ, USA, 1999; Volume 48, pp. 293–300. [Google Scholar] [CrossRef]
  18. Liu, L.; Du, Y.; Li, X.; Sun, T.; Zhang, W.; Li, G.; Yang, L.; Chen, D.; Mao, E. An Automatic Forage Unloading Method Based on Machine Vision and Material Accumulation Model. Comput. Electron. Agric. 2023, 208, 107770. [Google Scholar] [CrossRef]
  19. Fu, X.; Zhang, Z.; An, X.; Zhao, C.; Li, C.; Yu, J. Development and Performance Experiment on Grain Yield Monitoring System of Combine Harvester Based on Photoelectric Diffuse Reflectance. Trans. Chin. Soc. Agric. Eng. (Trans. CSAE) 2017, 33, 24–30. [Google Scholar] [CrossRef]
  20. Yang, G.; Lei, J.; Liu, C.; Tao, J. Development of Yield Monitoring System with High-Precision Based on Linear Structured Light Source and Machine Vision. Trans. Chin. Soc. Agric. Eng. (Trans. CSAE) 2019, 35, 21–28. [Google Scholar] [CrossRef]
  21. Jiang, X.; Yin, W.; Pu, H.; Hu, F.; Chen, C.; Li, X. Measurement Method of Grain Volume on Screw Conveyor Based on Structured Light of 3D Vision. J. Nanjing Agric. Univ. 2019, 42, 373–381. [Google Scholar] [CrossRef]
  22. Zhao, X.; Zhai, C.; Wang, S.; Dou, H.; Yang, S.; Wang, X.; Chen, L. Sprayer Boom Height Measurement in Wheat Field Using Ultrasonic Sensor: An Exploratory study. Front. Plant Sci. 2022, 13, 1008122. [Google Scholar] [CrossRef]
  23. Dou, H.; Zhai, C.; Chen, L.; Wang, S.; Wang, X. Field Variation Characteristics of Sprayer Boom Height Using a Newly Designed Boom Height Detection System. IEEE Access 2021, 9, 17148–17160. [Google Scholar] [CrossRef]
  24. Zhao, X.; Zheng, S.; Yi, K.; Wang, X.; Zou, W.; Zhai, C. Design and experiment of the target-oriented spraying system for field vegetable considering spray height. Trans. Chin. Soc. Agric. Eng. (Trans. CSAE) 2022, 38, 1–11. [Google Scholar] [CrossRef]
  25. Liu, S.; Wang, J.; Mou, H.; Fan, L.; Fu, S.; Zhu, C. Design and Experiment of Moving Along Ridge Control System for Tobacco Picking Machine. Trans. Chin. Soc. Agric. Eng. (Trans. CSAE) 2015, 31, 83–87. [Google Scholar] [CrossRef]
  26. Wang, L.; Zou, X.; Liu, S.; Chen, B.; Zhu, H.; Zhu, R. Infrared Distance Measurement Used for Cotton Picker Robot. Trans. Chin. Soc. Agric. Mach. 2014, 45, 61–66. [Google Scholar] [CrossRef]
  27. Kumar, N.; Vámossy, Z. Robot Navigation in Unknown Environment with Obstacle Recognition Using Laser Sensor. Int. J. Electr. Comput. Eng. 2019, 3, 1773–1779. [Google Scholar] [CrossRef]
  28. Wen, S.; Chen, X.; Ma, C.; Lam, H.K.; Hua, S. The Q-learning Obstacle Avoidance Algorithm Based on EKF-SLAM for NAO Autonomous Walking Under Unknown Environments. Robot. Auton. Syst. 2015, 72, 29–36. [Google Scholar] [CrossRef]
  29. Ilmi, M.; Azhar, B.; Anderson, C.A.; Hanafiah, Y. Real-Time Obstacle Avoidance for Humanoid-Controlled Mobile Platform Navigation. Procedia Comput. Sci. 2017, 105, 34–39. [Google Scholar] [CrossRef]
  30. Jin, C.; Cai, Z.; Yang, T.; Liu, Z.; Yin, X.; Da, F. Design and Experiment of Yield Monitoring System of Grain Combine Harvester. Trans. Chin. Soc. Agric. Mach. 2022, 53, 125–135. [Google Scholar] [CrossRef]
  31. Zeng, H.; Lei, J.; Tao, J.; Liu, C. Yield Monitoring for Grain Combine Harvester Based on Monocular Vision. Trans. Chin. Soc. Agric. Mach. 2021, 52, 281–289. [Google Scholar] [CrossRef]
Figure 1. Schematic of the pepper loading capacity detection testing system.
Agronomy 14 01955 g001
Figure 2. Software function diagram of the system.
Agronomy 14 01955 g002
Figure 3. Sensor calibration setup.
Agronomy 14 01955 g003
Figure 4. Accuracy comparison tests for the detection of pepper stacking height.
Agronomy 14 01955 g004
Figure 5. Testing platform for detecting the pepper loading capacity.
Agronomy 14 01955 g005
Figure 6. Accuracy of the three types of sensors in detecting the pepper stacking height: (a) ultrasonic sensor; (b) LiDAR sensor; (c) infrared distance sensor.
Agronomy 14 01955 g006aAgronomy 14 01955 g006b
Figure 7. Detection errors of the three types of sensors.
Agronomy 14 01955 g007
Figure 8. Schematic of the fluctuations in detection by the three types of sensors: (a) ultrasonic sensor; (b) LiDAR sensor; (c) infrared distance sensor.
Agronomy 14 01955 g008
Figure 9. Stacking states of 0.1 m3 peppers at different lifting speeds.
Agronomy 14 01955 g009
Figure 10. Schematic of the mounting locations of the sensors.
Agronomy 14 01955 g010
Figure 11. Detection results of individual ultrasonic sensors at different lifting speeds and mounting locations.
Agronomy 14 01955 g011
Figure 12. Detection results using a combination of three ultrasonic sensors at different lifting speeds.
Agronomy 14 01955 g012
Figure 13. Characteristic curve of the pepper loading capacity detection model.
Agronomy 14 01955 g013
Table 1. Sensor calibration results.
SensorsRelational ExpressionsR2
Ultrasonic sensor1 y 1 = 235.21 x 1 − 745.560.9999
2 y 1 = 234.82 x 1 − 746.720.9999
3 y 1 = 234.27 x 1 − 743.860.9999
Infrared distance sensor1 y 2 = 546.82 x 2 − 1.0070.9982
2 y 2 = 558.83 x 2 − 1.0380.9983
3 y 2 = 574.62 x 2 − 1.0370.9987
Table 2. Comparison results of the detection accuracy of the three types of sensors.
SensorsDetection Values (mm)Difference (mm)
MaximumMinimumRMSE
Ultrasonic sensor12094006058031005120714071596179819982196239526002798904.7
220841061180910091208140316061808200622092410261128081138.5
32034006038041002120314011592179819952198239825962800803.4
Laser radar
sensor
1216407613815101012141410160918102010222024212617281123713.7
2227417616816101812111412159718021996219723962591279521212.8
3206419624818101712151419161318142004221124192617281924416.2
Infrared distance sensor12262803634585596657648739811085119413201427150442427.9
223427635945054564074484092310591140128113751446771949.6
323428737847658368878689710071120120613241420151034318.1
Table 3. Detection results of pepper stacking height.
Elevator Transport Speed
(m min−1)
Pepper Volume (m3)Pepper Stacking Height Value (mm)
Ultrasonic Sensor-1Ultrasonic Sensor-2Ultrasonic Sensor-3
500.124816315
0.2377282126
0.3486365244
0.4622479353
0.5698598448
0.6824680544
0.7964772643
0.81049889755
750.125018513
0.2369285129
0.3494394246
0.4612480349
0.5695576441
0.6806723521
0.7936812635
0.81039880756
1000.124818814
0.2346302129
0.3491403250
0.4609488345
0.5679604447
0.6816689531
0.7920780636
0.81033896765
1250.124219454
0.2353293152
0.3469384246
0.4595471350
0.5666621445
0.6792695526
0.7919799643
0.81031900828
1500.121718559
0.2337304164
0.3461394261
0.4574483379
0.5663622478
0.6757685566
0.7902814650
0.81018906758
1750.1210187106
0.2316304218
0.3462428309
0.4573500395
0.5649606505
0.6771711580
0.7892824661
0.81003919767
2000.1198189132
0.2300304226
0.3437422349
0.4556520401
0.5634610541
0.6748722612
0.7857829689
0.8974918765
2250.1180179141
0.2299294250
0.3429415374
0.4526540444
0.5608621560
0.6707718625
0.7851841750
0.8964937815
2500.1122170165
0.2272299260
0.3387418371
0.4513515488
0.5596609570
0.6714729652
0.7823841770
0.8935945853
2750.1119168159
0.2254292271
0.3363394386
0.4465515499
0.5563619589
0.6684710666
0.7806837773
0.8917938867
3000.183141192
0.2225268267
0.3316388373
0.4459506497
0.5542593580
0.6638697679
0.7788831811
0.8908939898
Table 4. Comparison of the detection results by the combination of multiple sensors.
SensorsPepper Volume (m3)Pepper Stacking Height Average Value (mm)Root Mean Squared Error (mm)
MaximumMinimum
1 and 20.121811234.1
0.232924625.1
0.344735228.4
0.455048321.6
0.564856724.2
0.676466826.6
0.787480918.9
0.896992315.1
1 and 30.116513111.7
0.227423710.4
0.340234416.1
0.45004736.9
0.55875559.7
0.66846589.2
0.780477310.7
0.892987013.8
2 and 30.11688928.7
0.228120428.6
0.339530434.7
0.450741137.8
0.560450831.3
0.669061031.9
0.782170740.8
0.891881833.6
1, 2, and 30.117313910.5
0.22812538.8
0.340236511.5
0.45054729.6
0.55965708.7
0.66986698.9
0.781477811.0
0.89198869.8
Table 5. Validation results of the pepper loading capacity detection model.
Actual Volume (m3)Detection Volume (m3)Relative Error (%)
50100150200250300MaximumAverage
0.10.0900.1080.1060.0910.0740.07031.0014.55
0.20.1940.2000.2150.2110.1900.17313.505.41
0.30.2910.2920.3050.3060.2920.2729.333.33
0.40.4010.4020.3950.4040.4060.3805.001.93
0.50.5140.5040.4910.5050.5080.4903.201.50
0.60.5990.5960.5950.6060.6140.6092.301.10
0.70.6990.6970.6940.7020.7100.7021.700.66
0.80.7960.7880.7880.7940.8050.8102.501.07
Disclaimer/Publisher’s Note: The statements, opinions and data contained in all publications are solely those of the individual author(s) and contributor(s) and not of MDPI and/or the editor(s). MDPI and/or the editor(s) disclaim responsibility for any injury to people or property resulting from any ideas, methods, instructions or products referred to in the content.

