
Elucidating Genetic Mechanisms of Summer Stress Tolerance in Chinese Cabbage through GWAS and Phenotypic Analysis

 , ,
, ,
Abstract
1. Introduction
2. Materials and Methods
2.1. Plant Material Selection and Genomic DNA Extraction
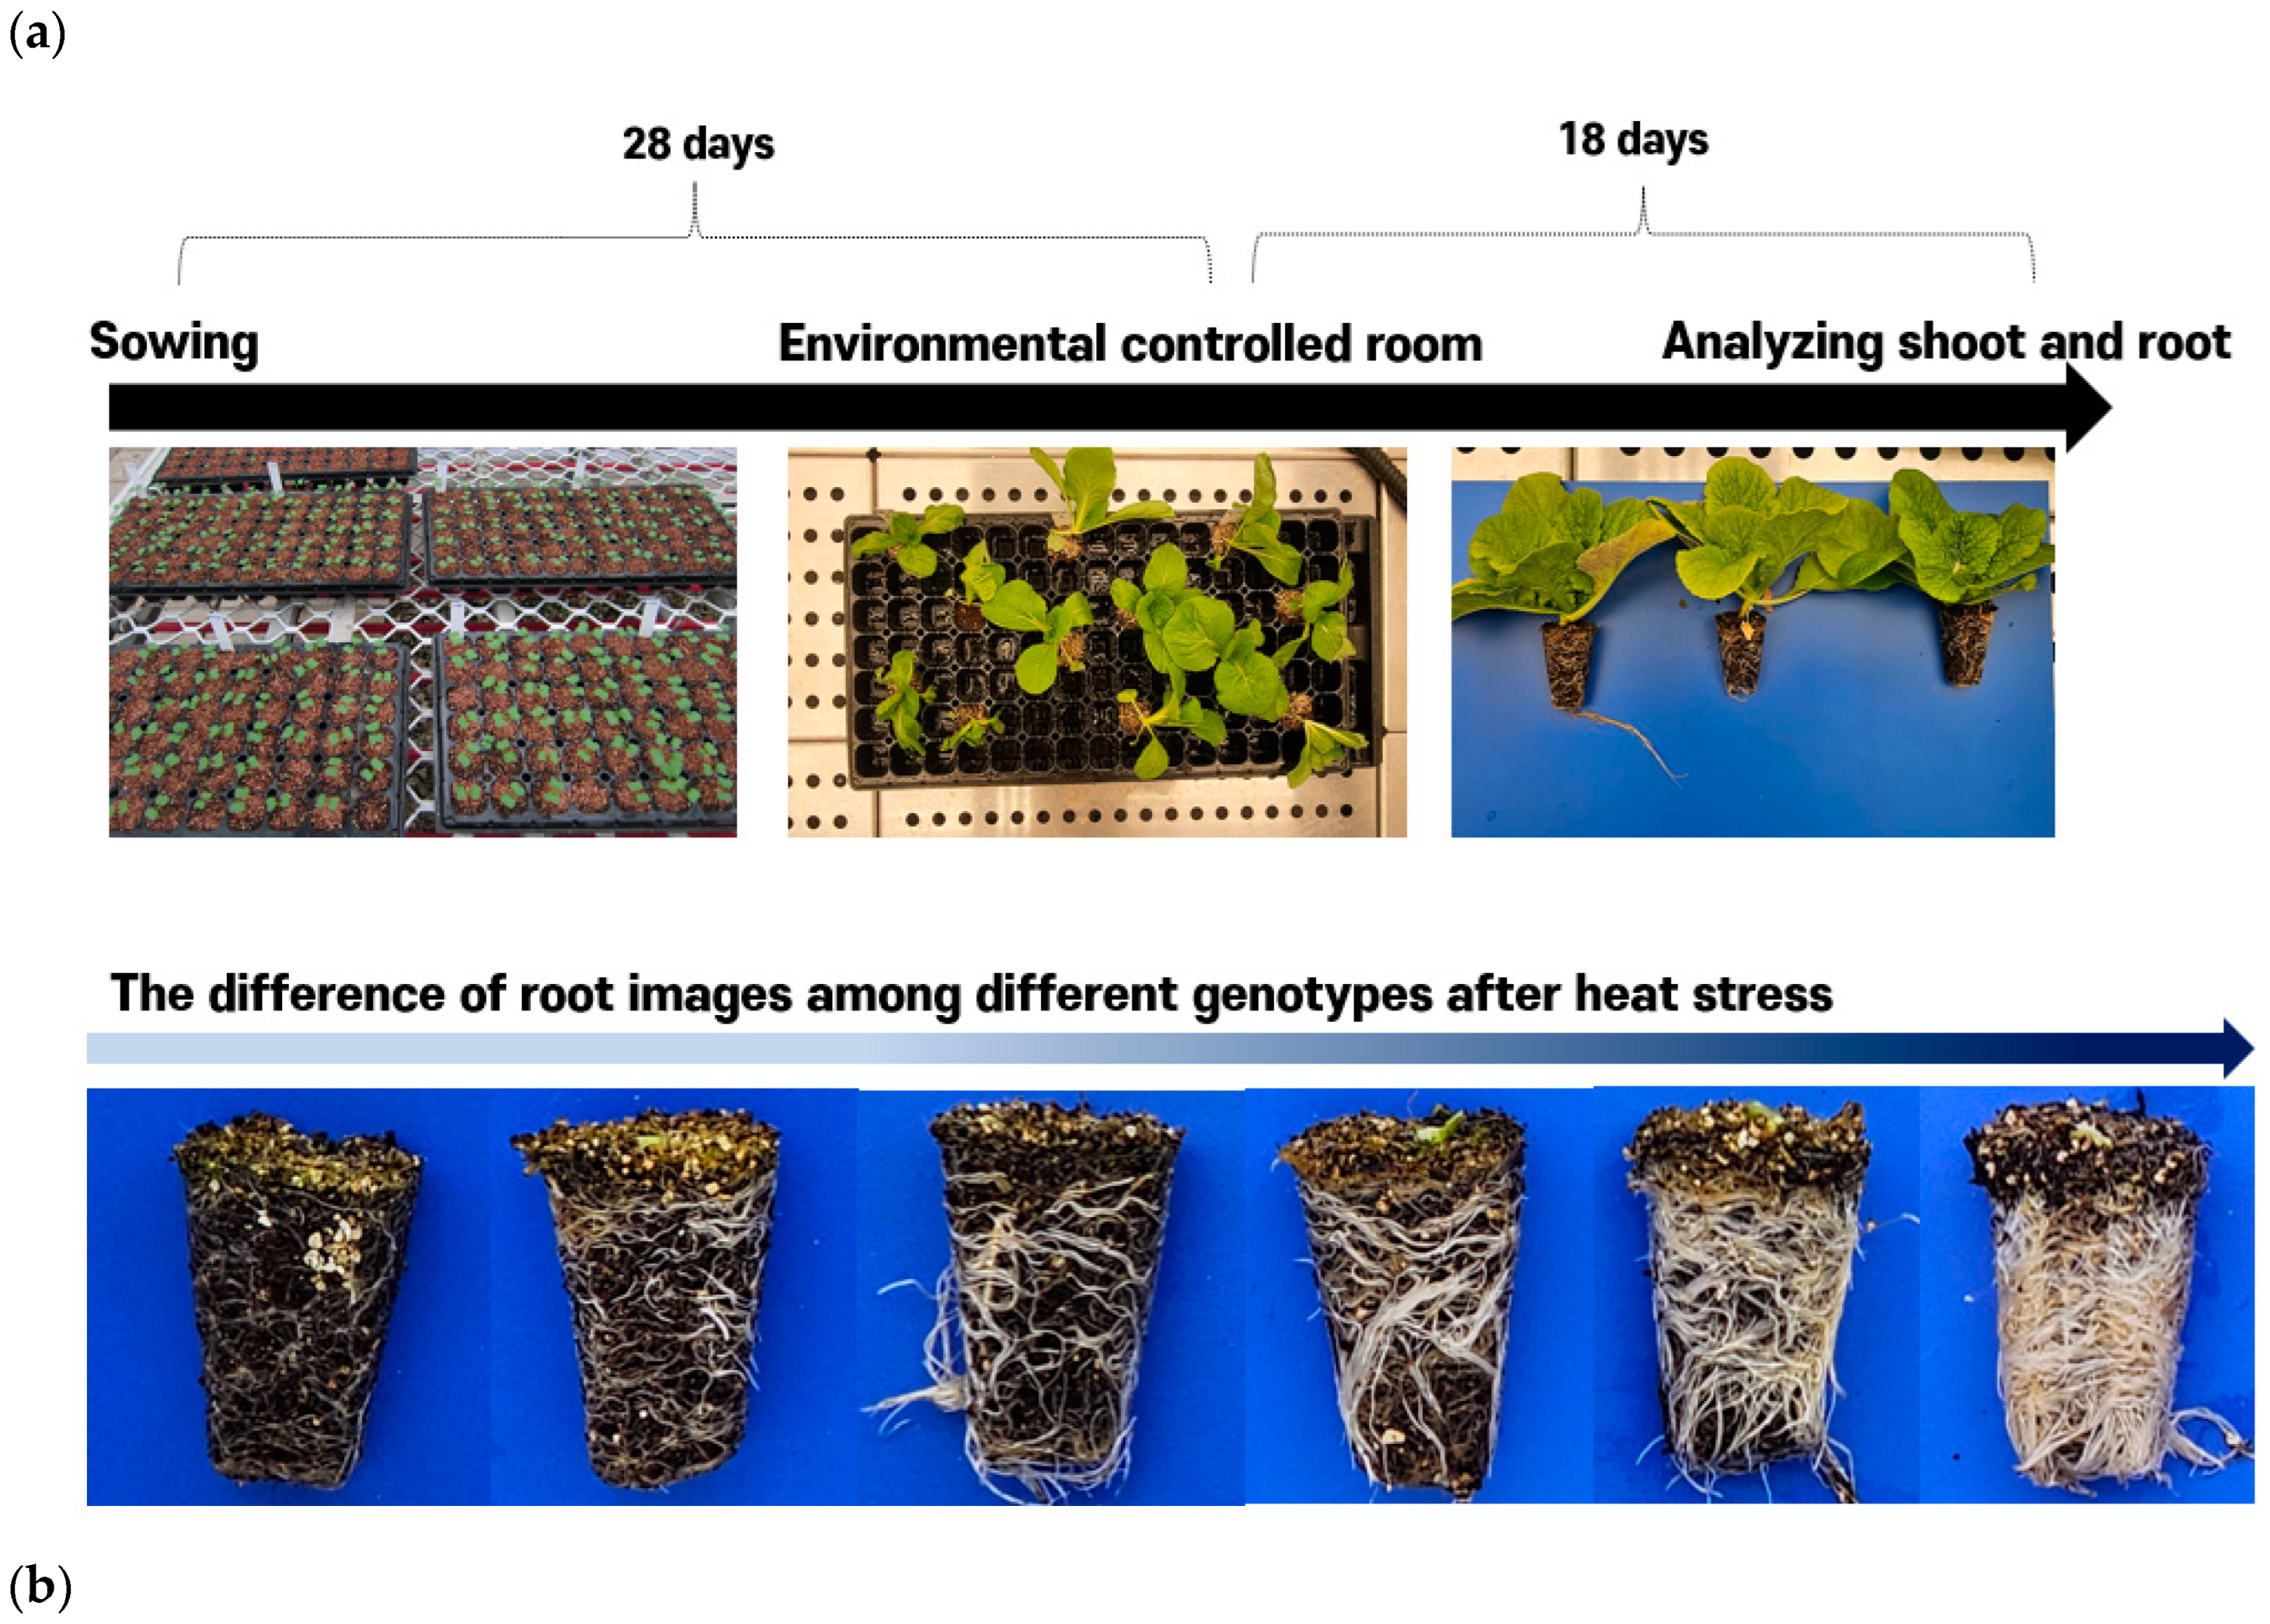
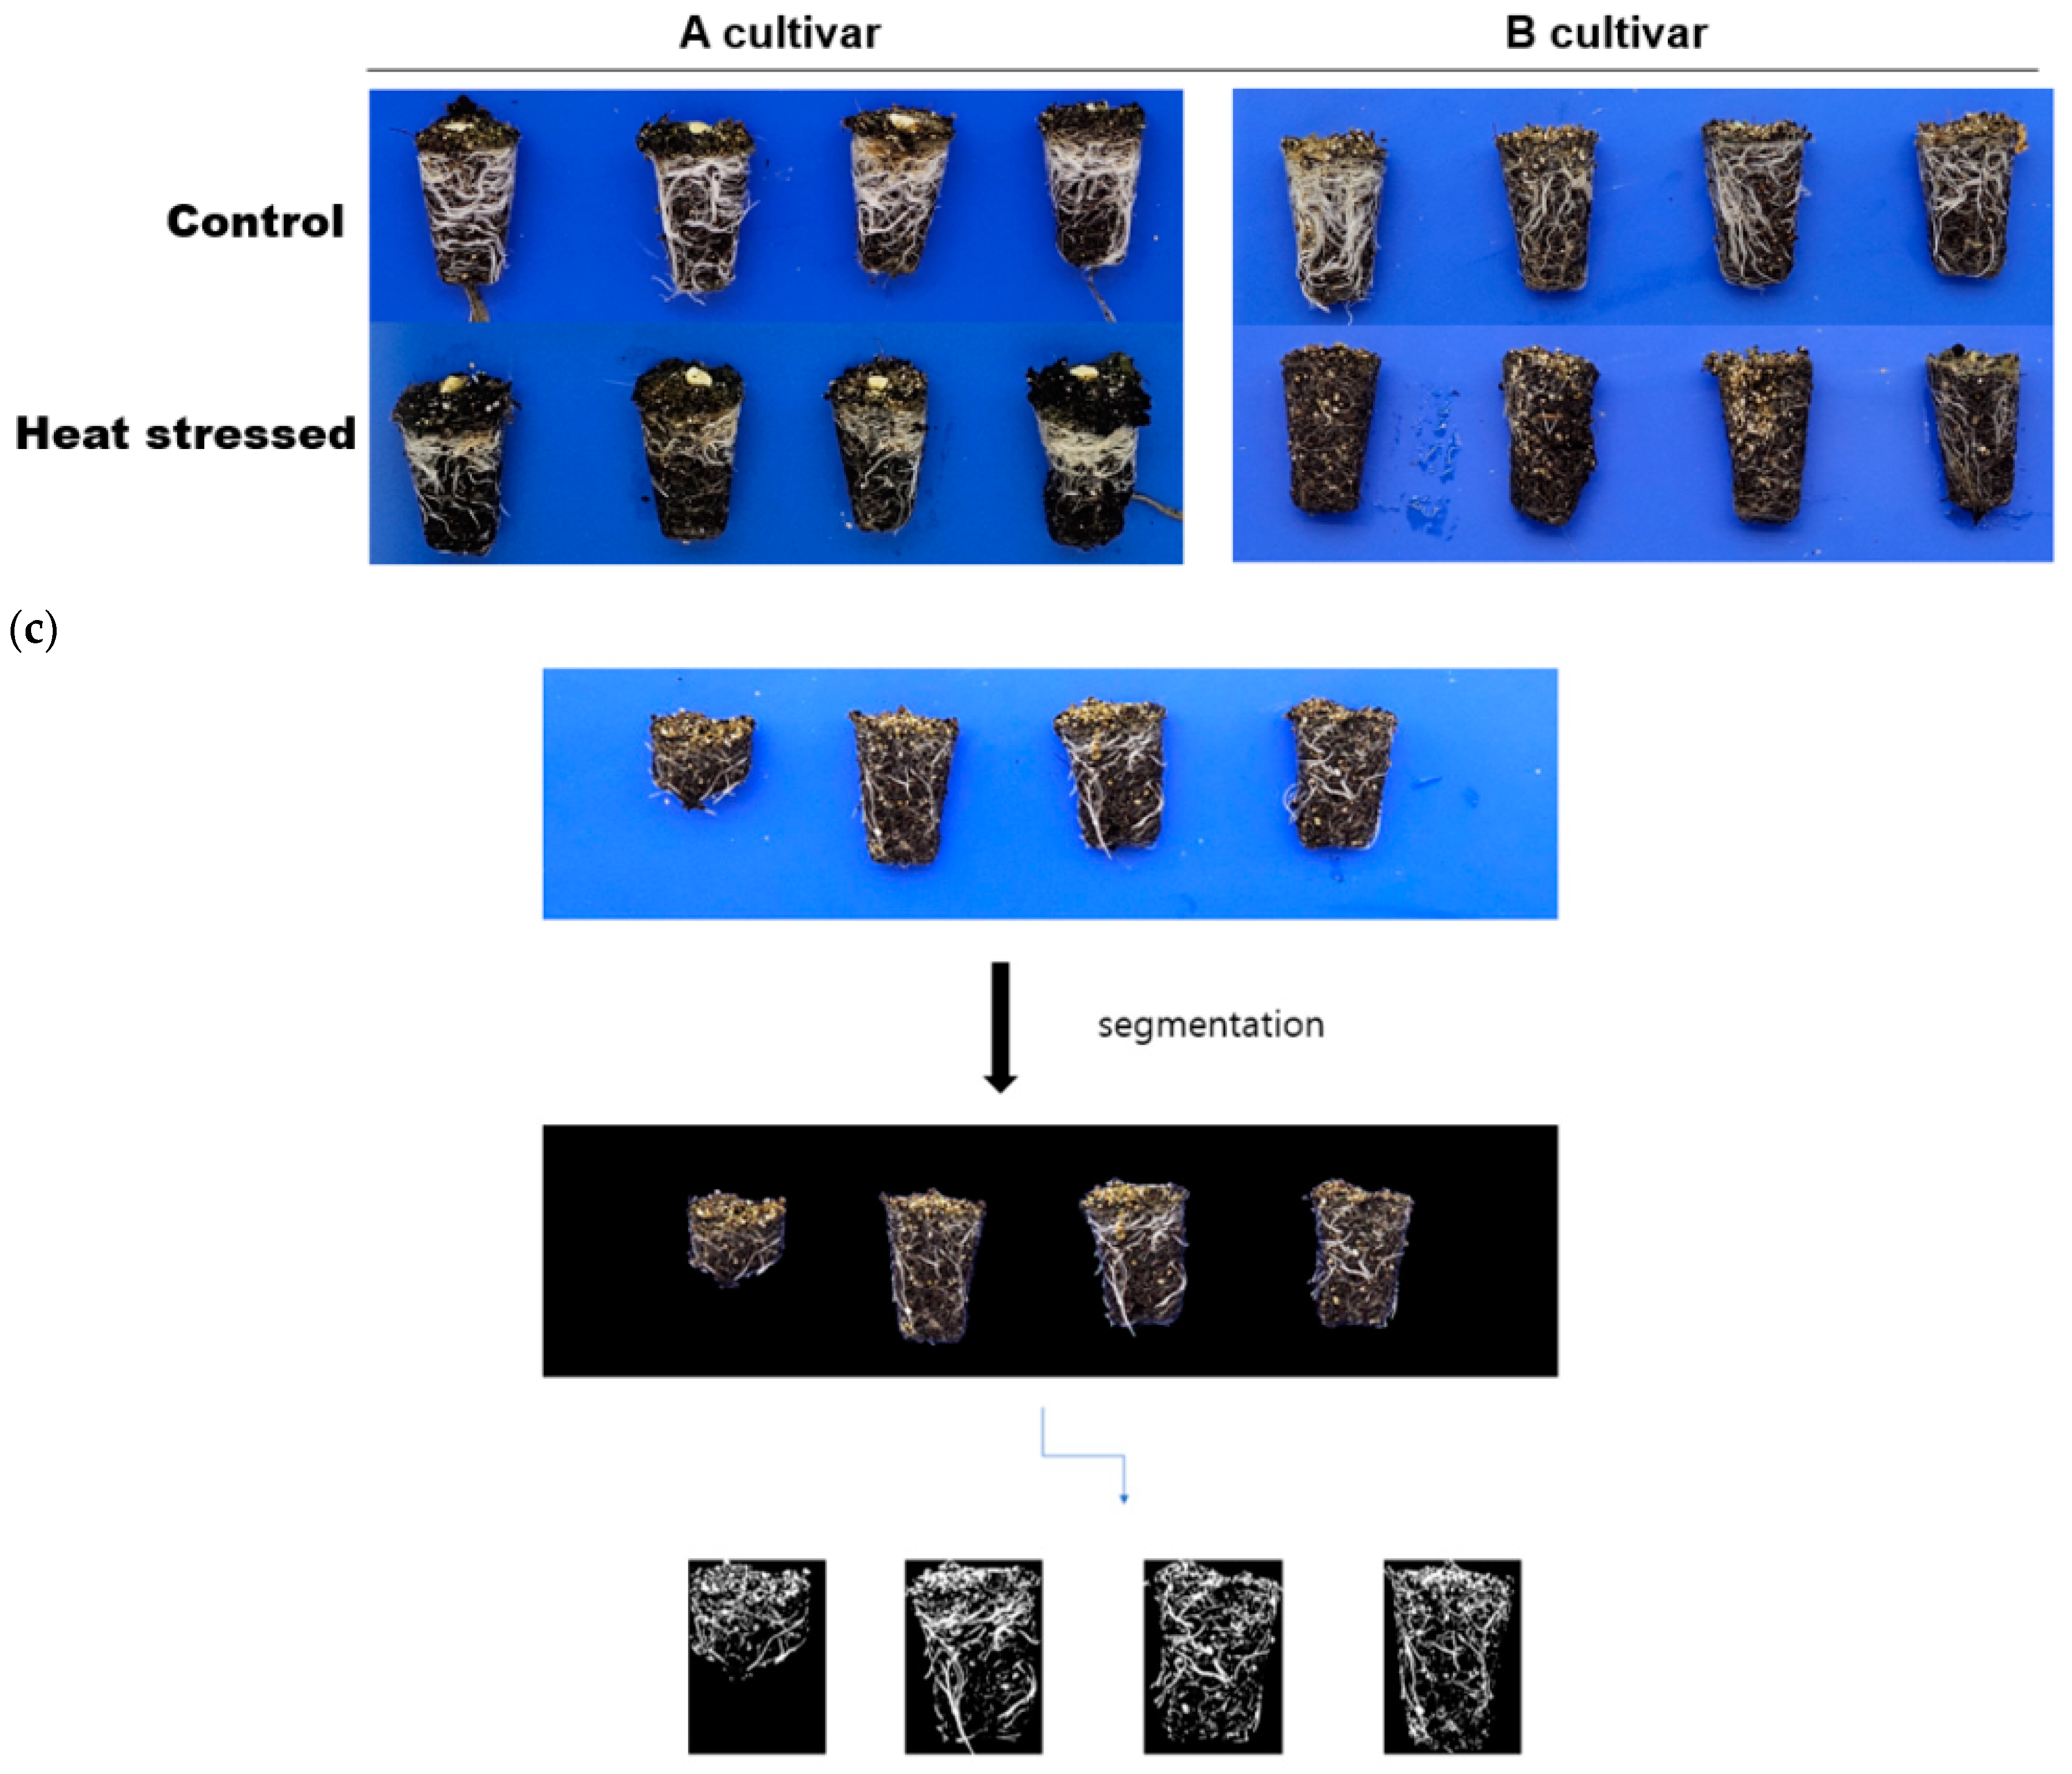
2.2. Phenotyping of Young Chinese Cabbages Using Environmental Control Room
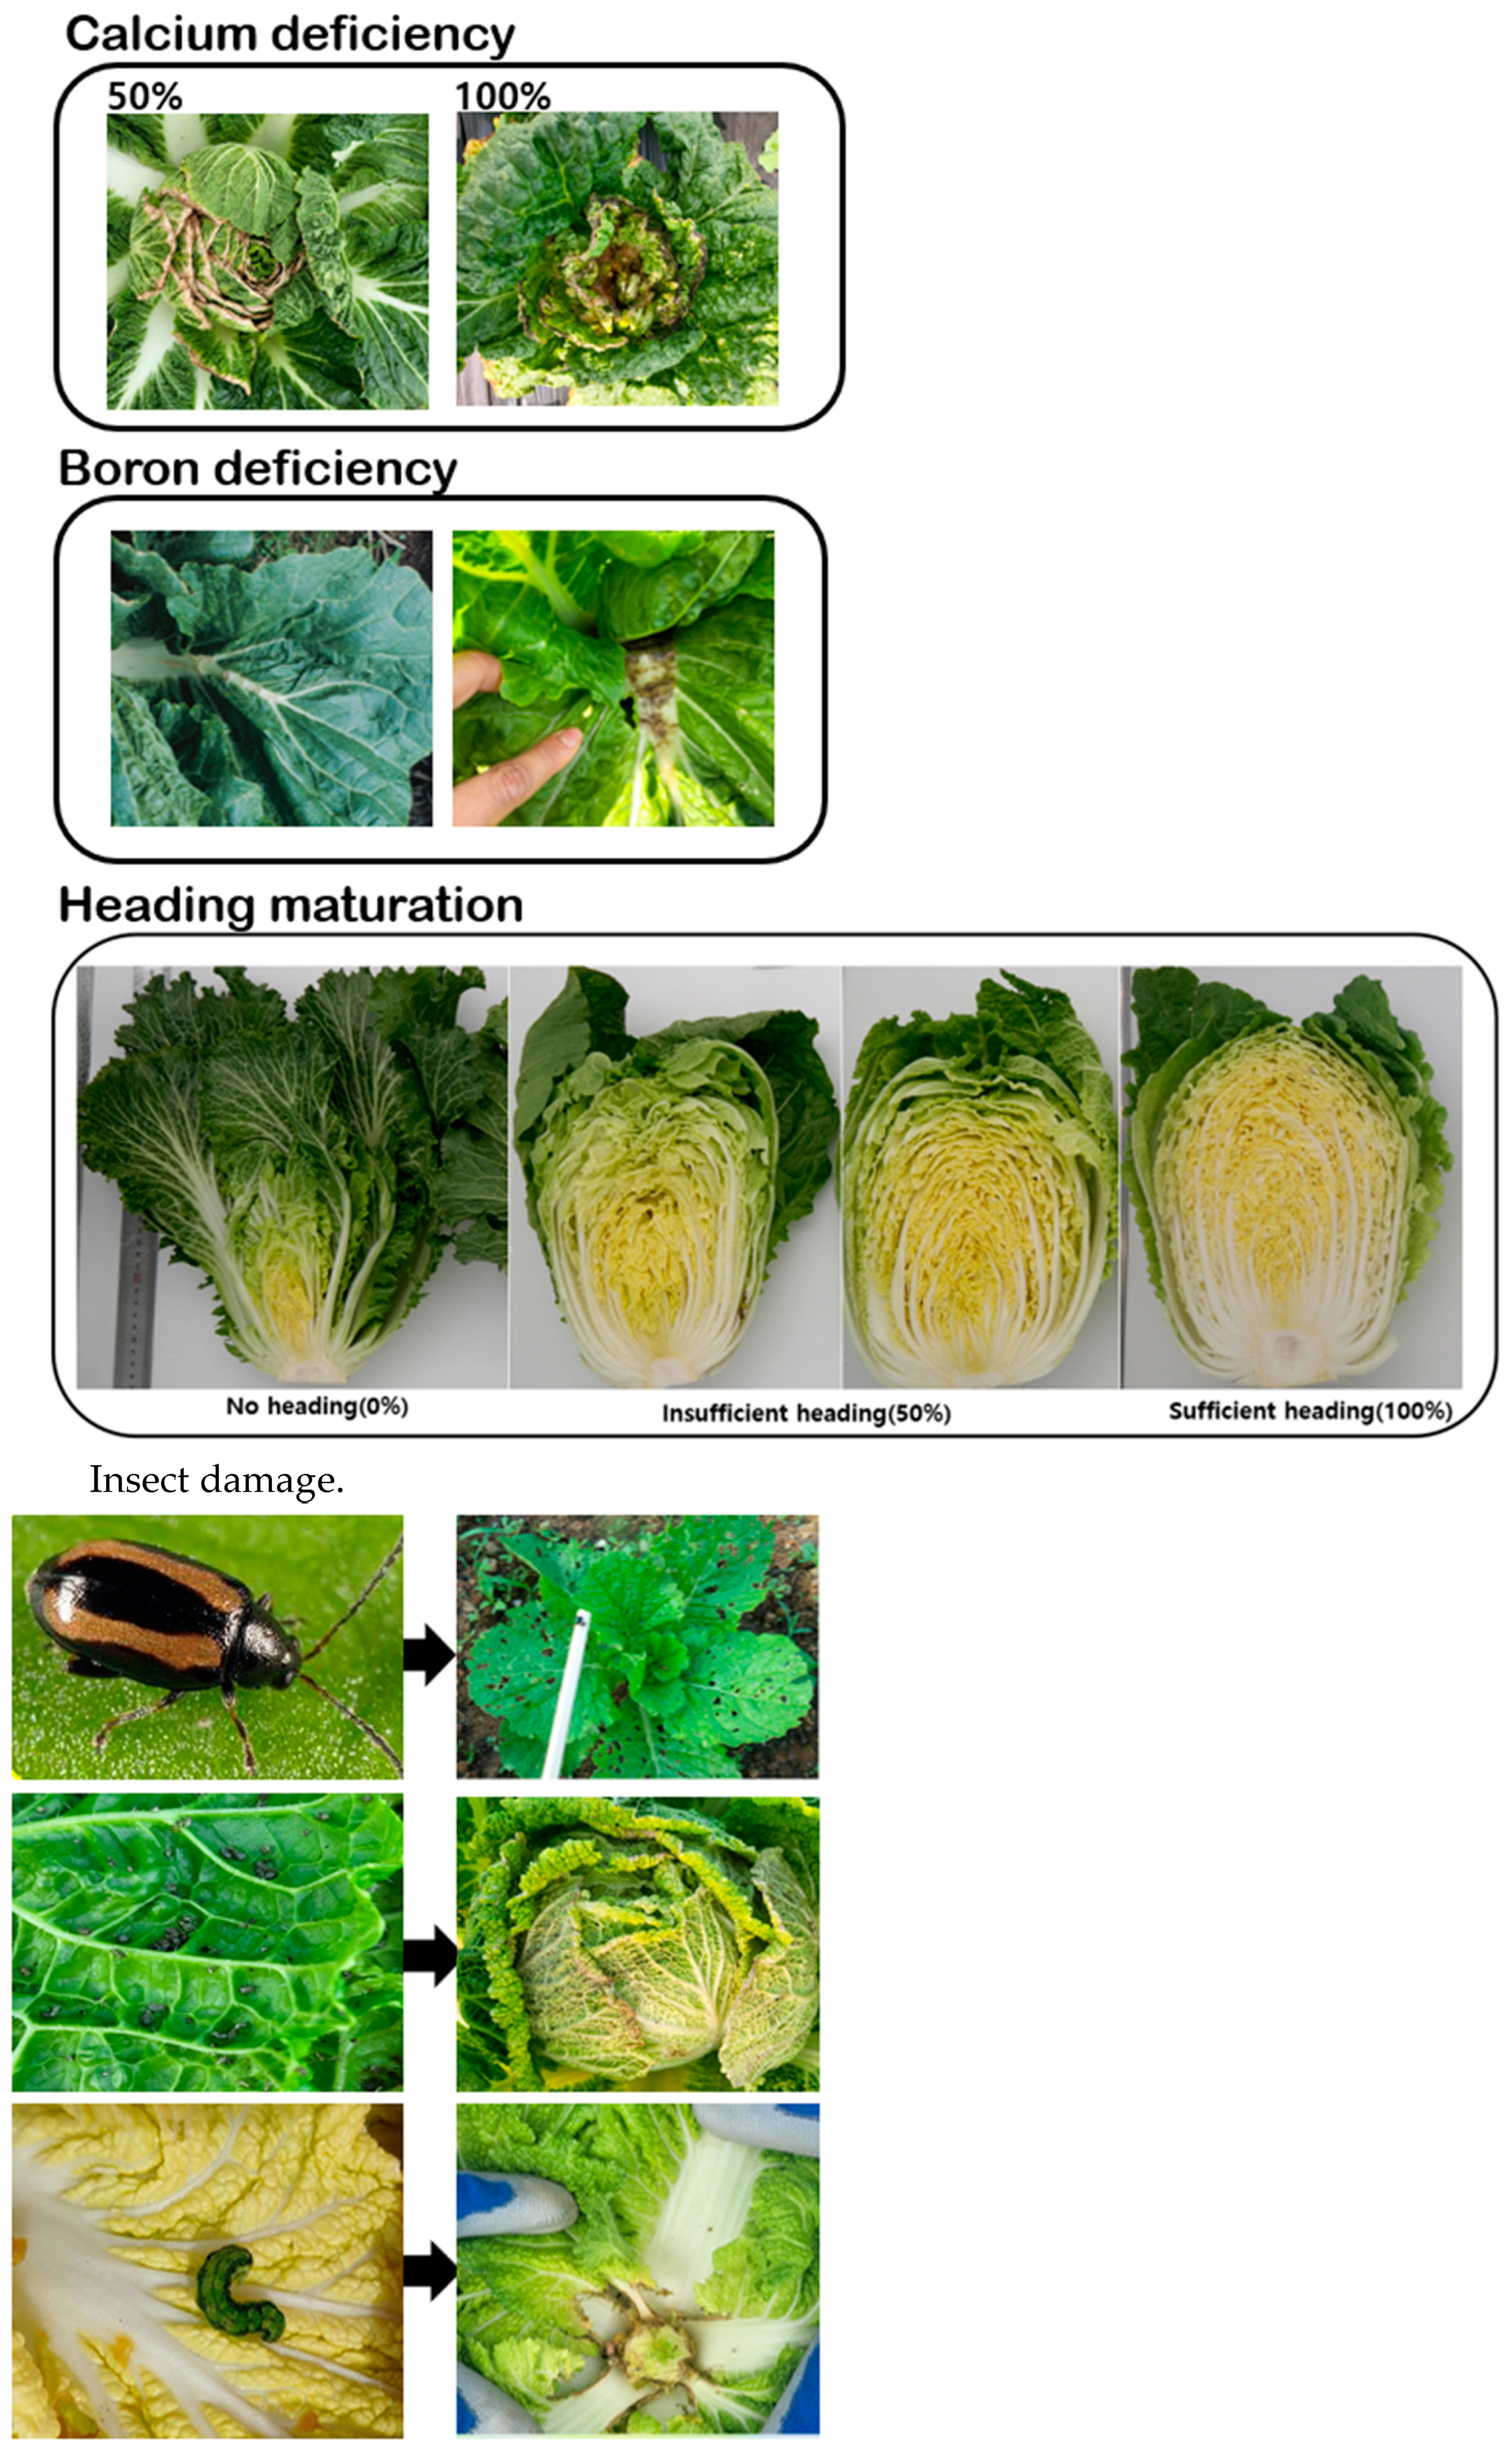
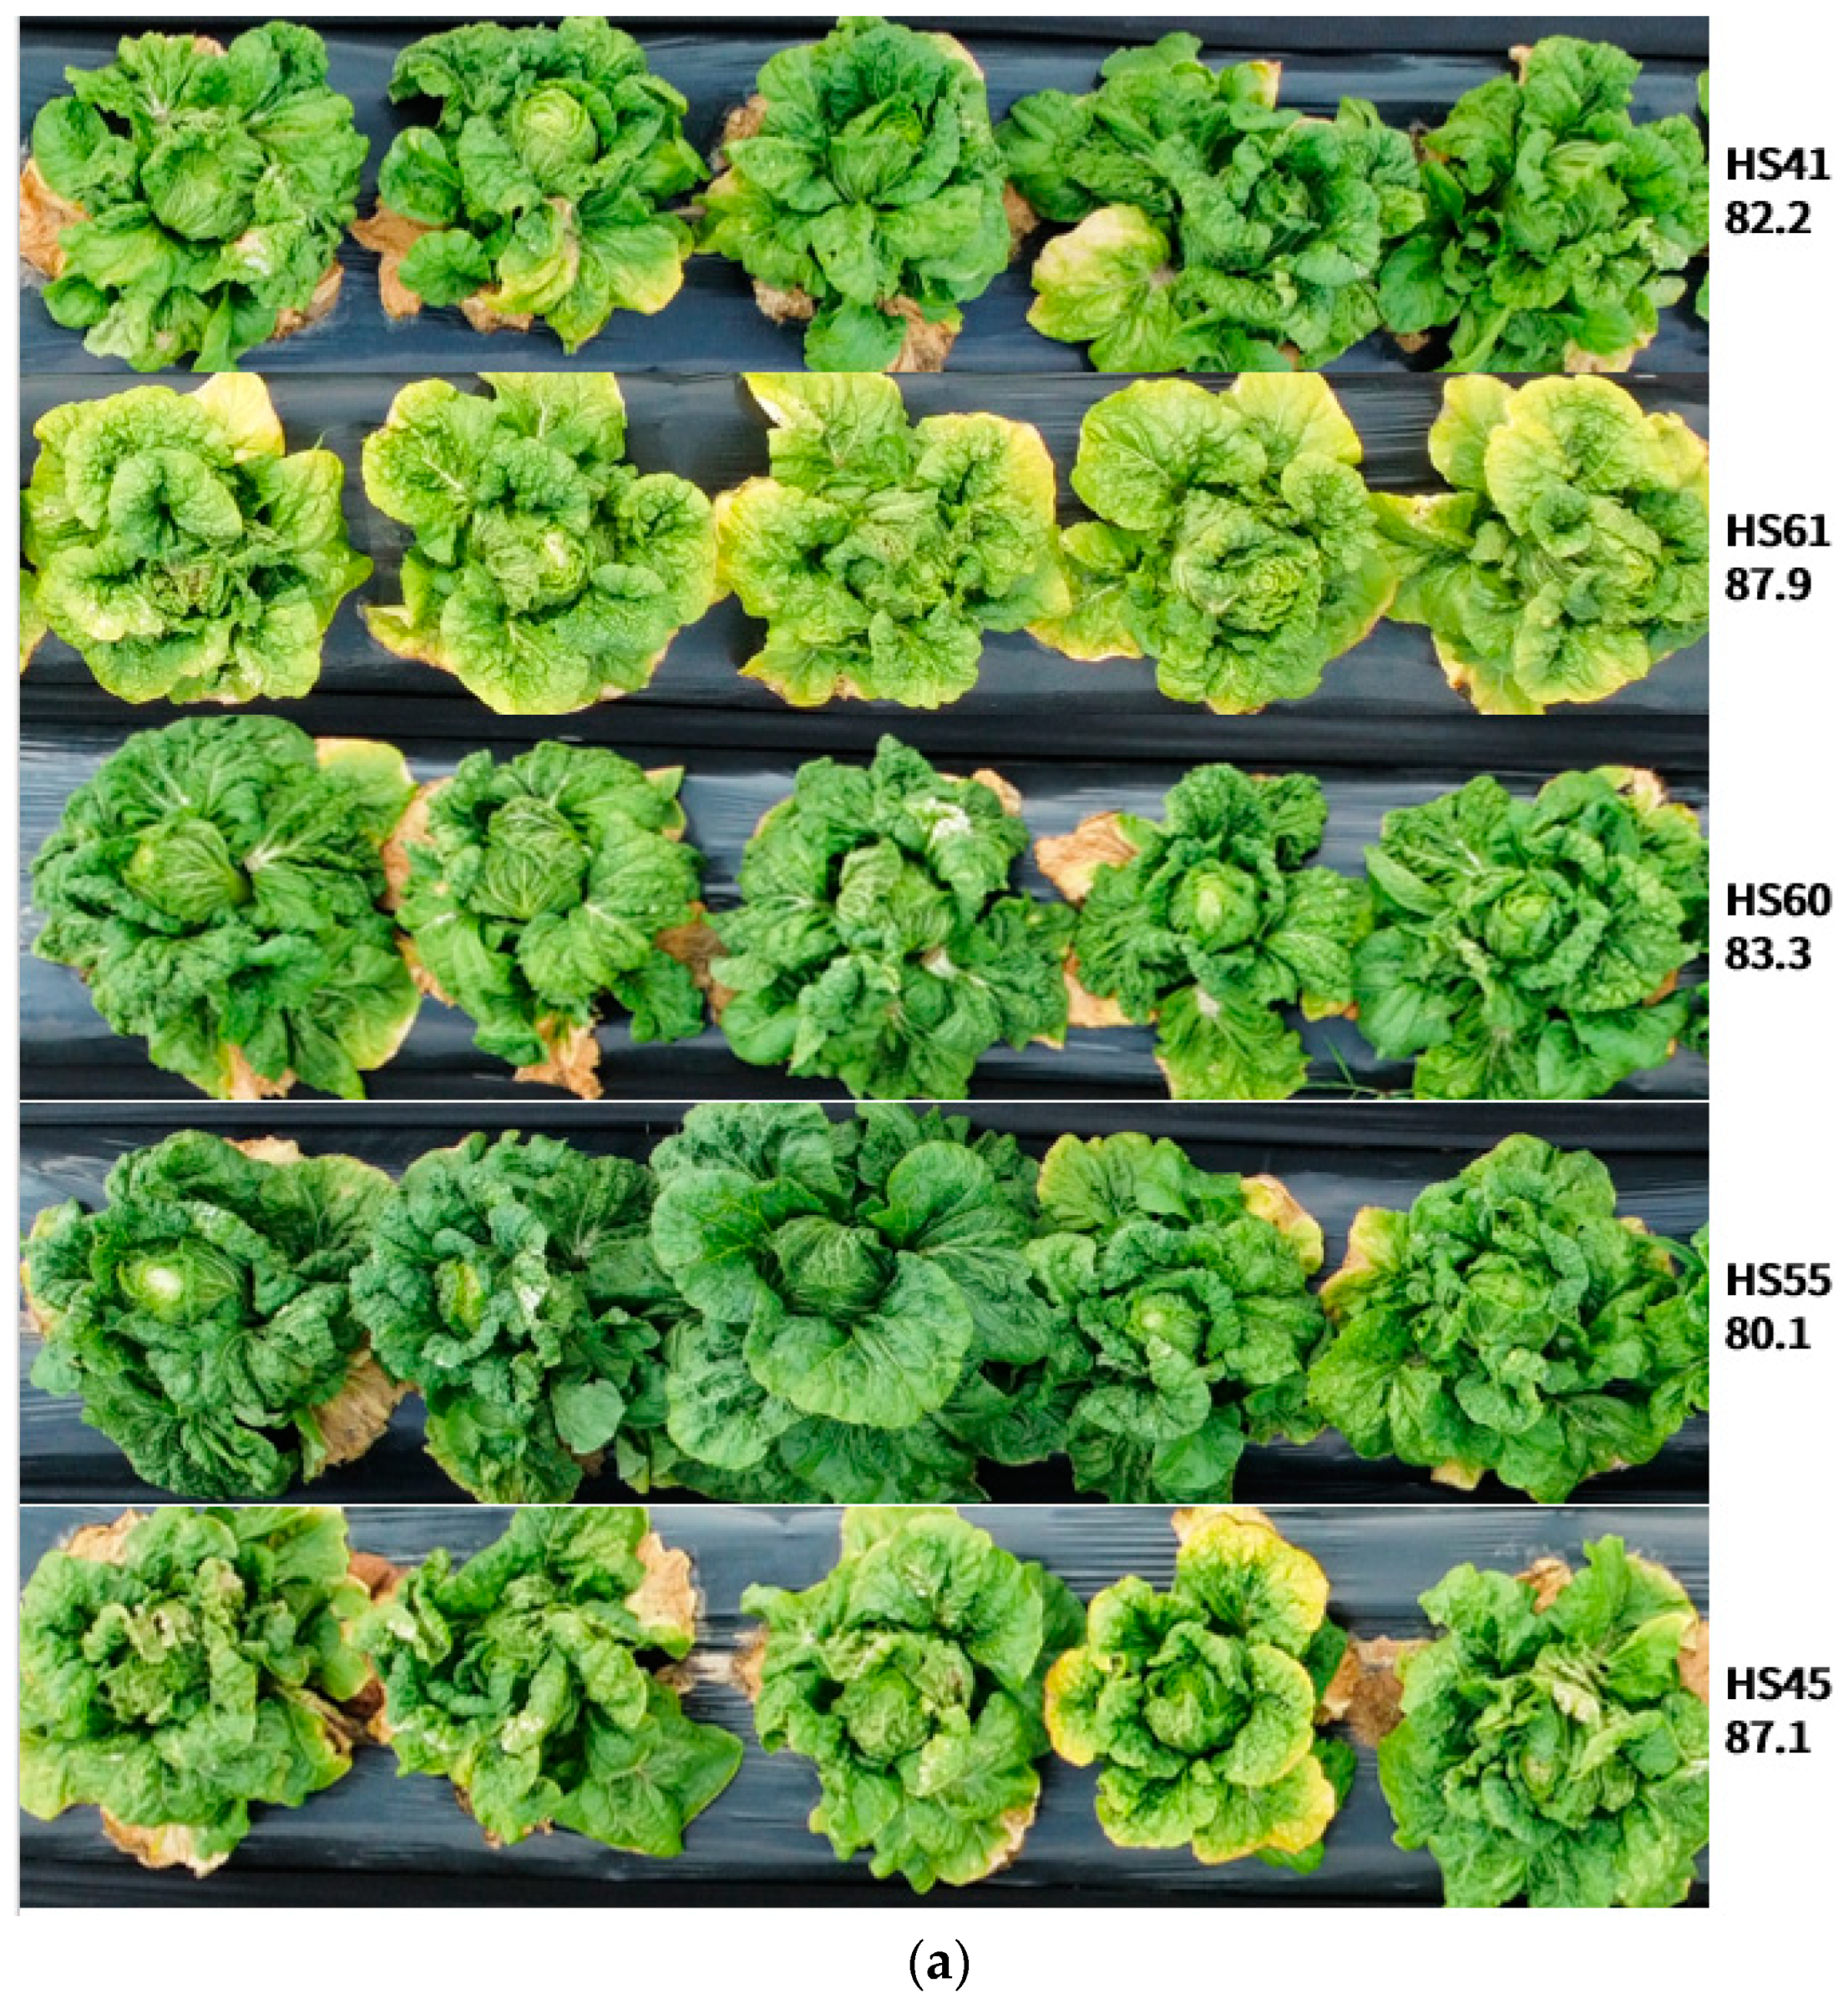
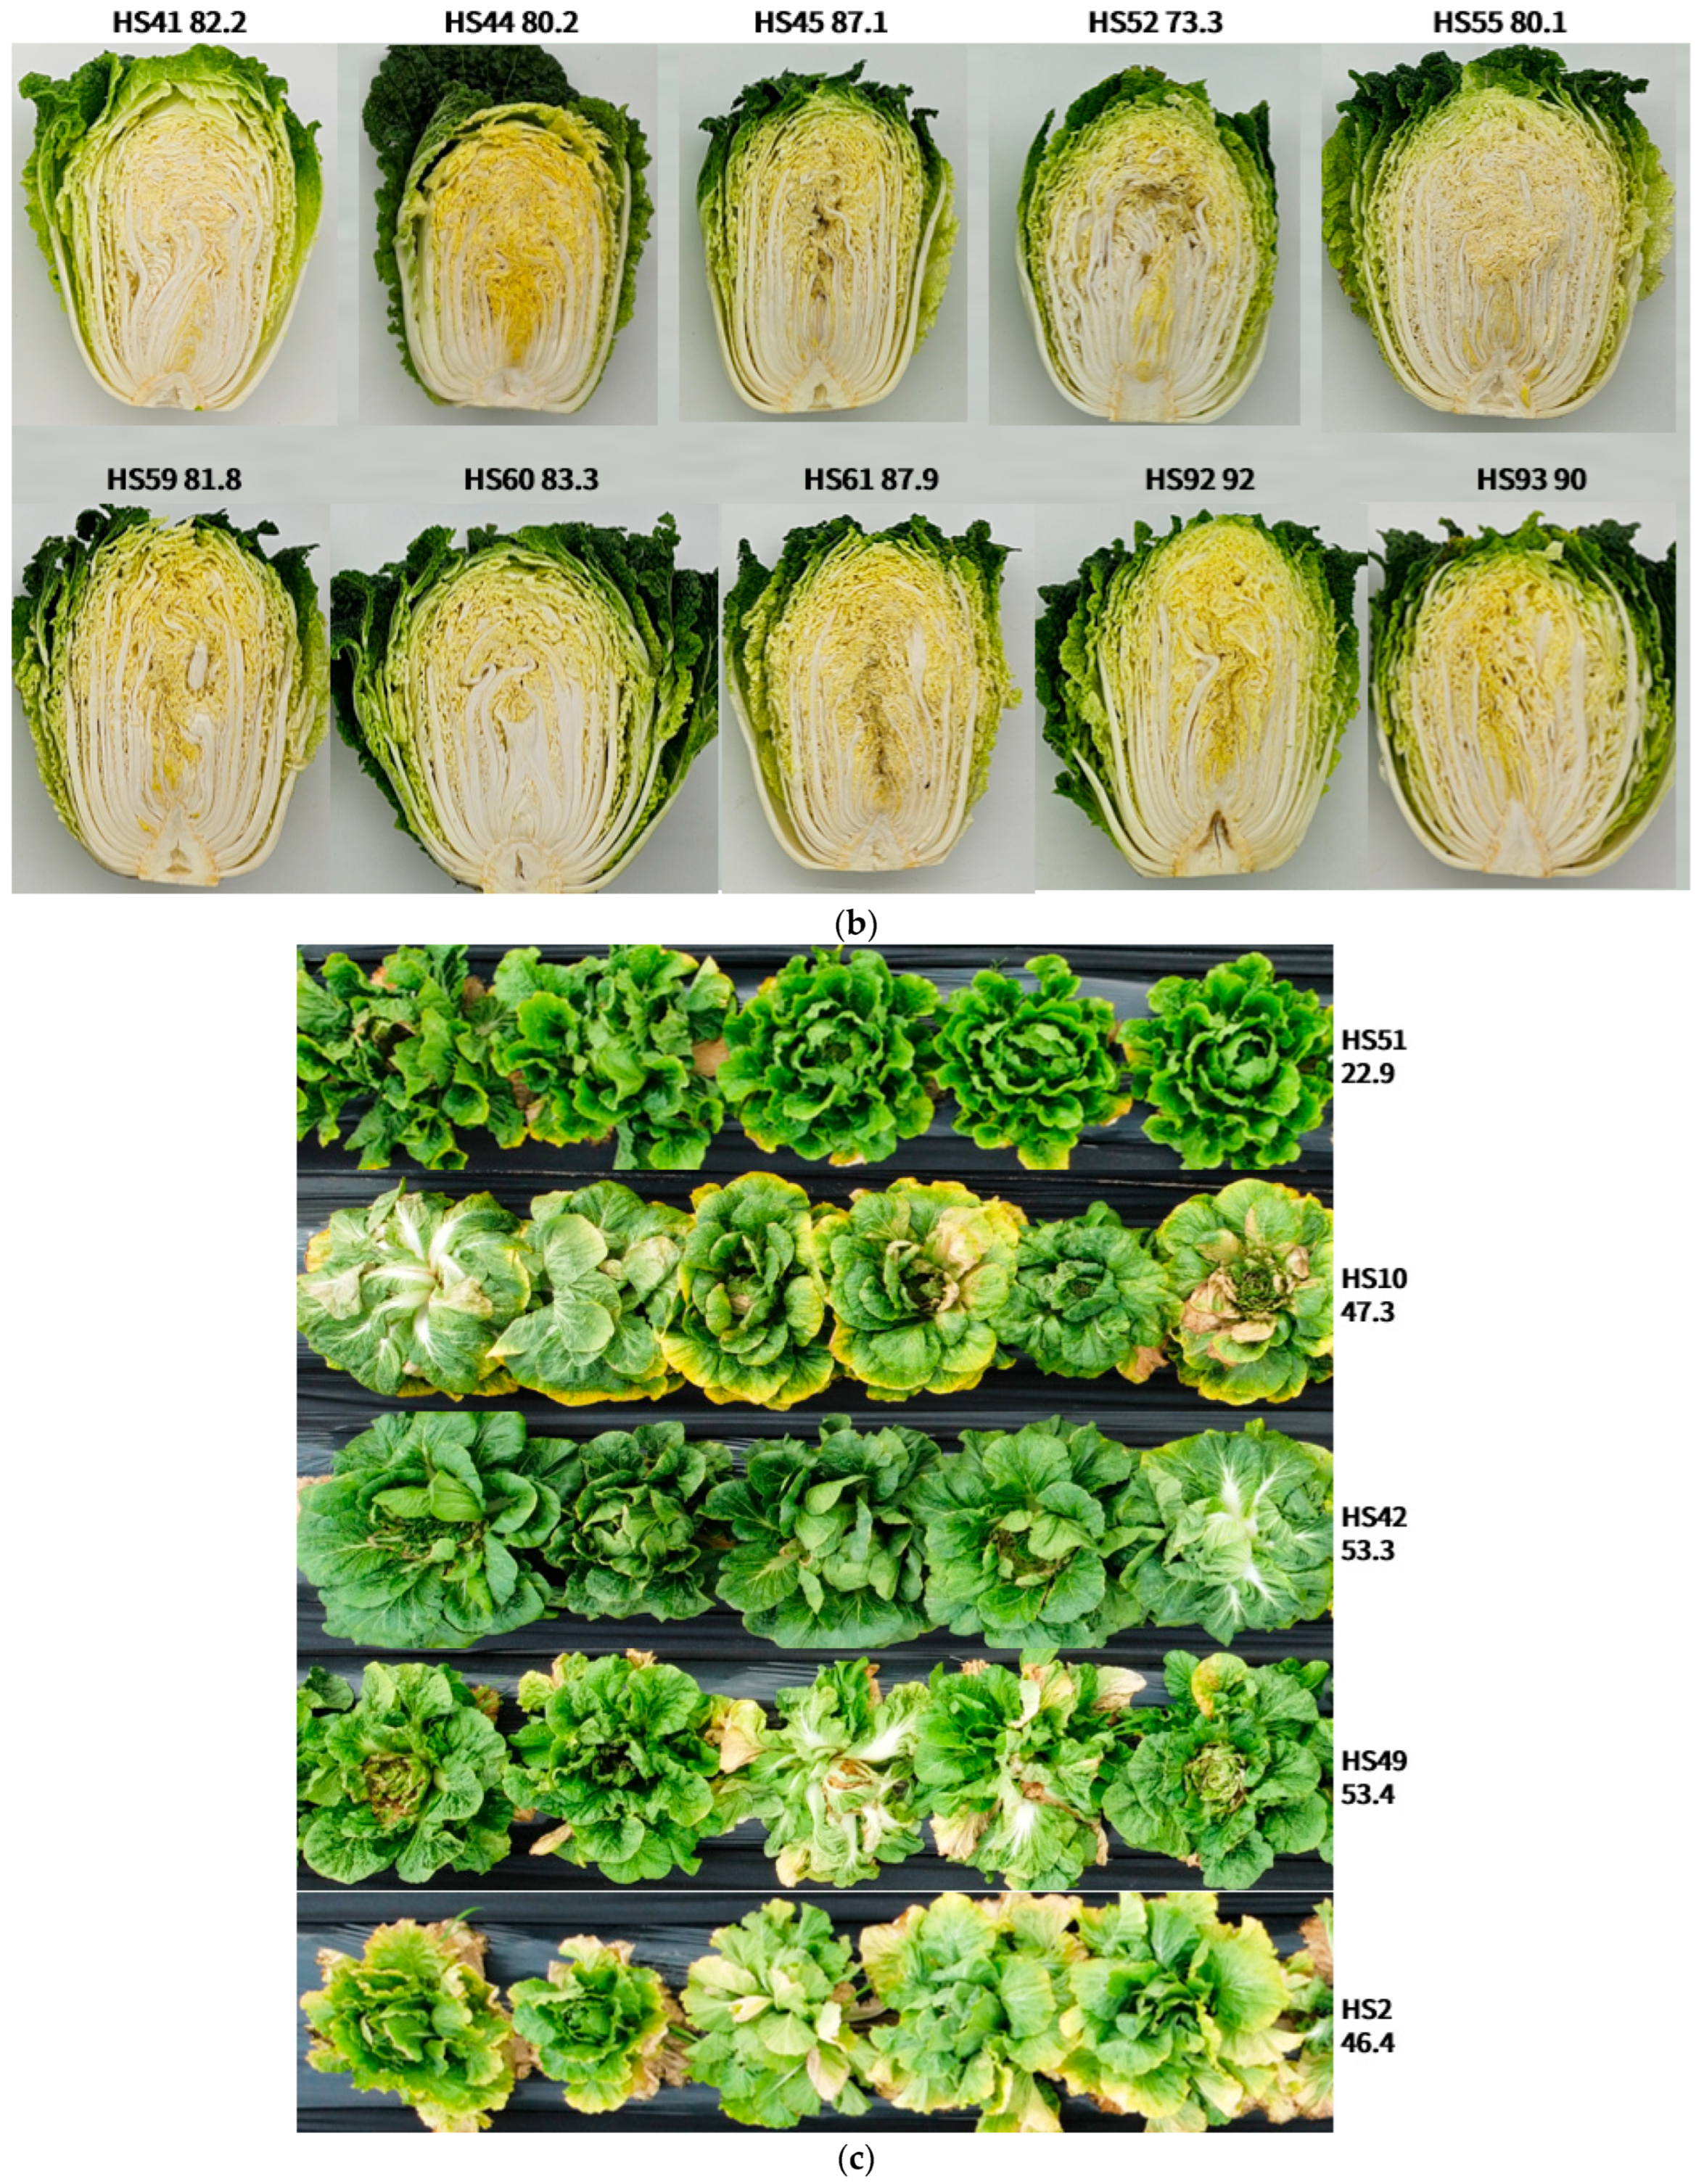
2.3. Phenotyping Mature Chinese Cabbage in the Open Field during the Summer Season
2.4. Preparation of a GBS Library and Sequencing Data Analysis
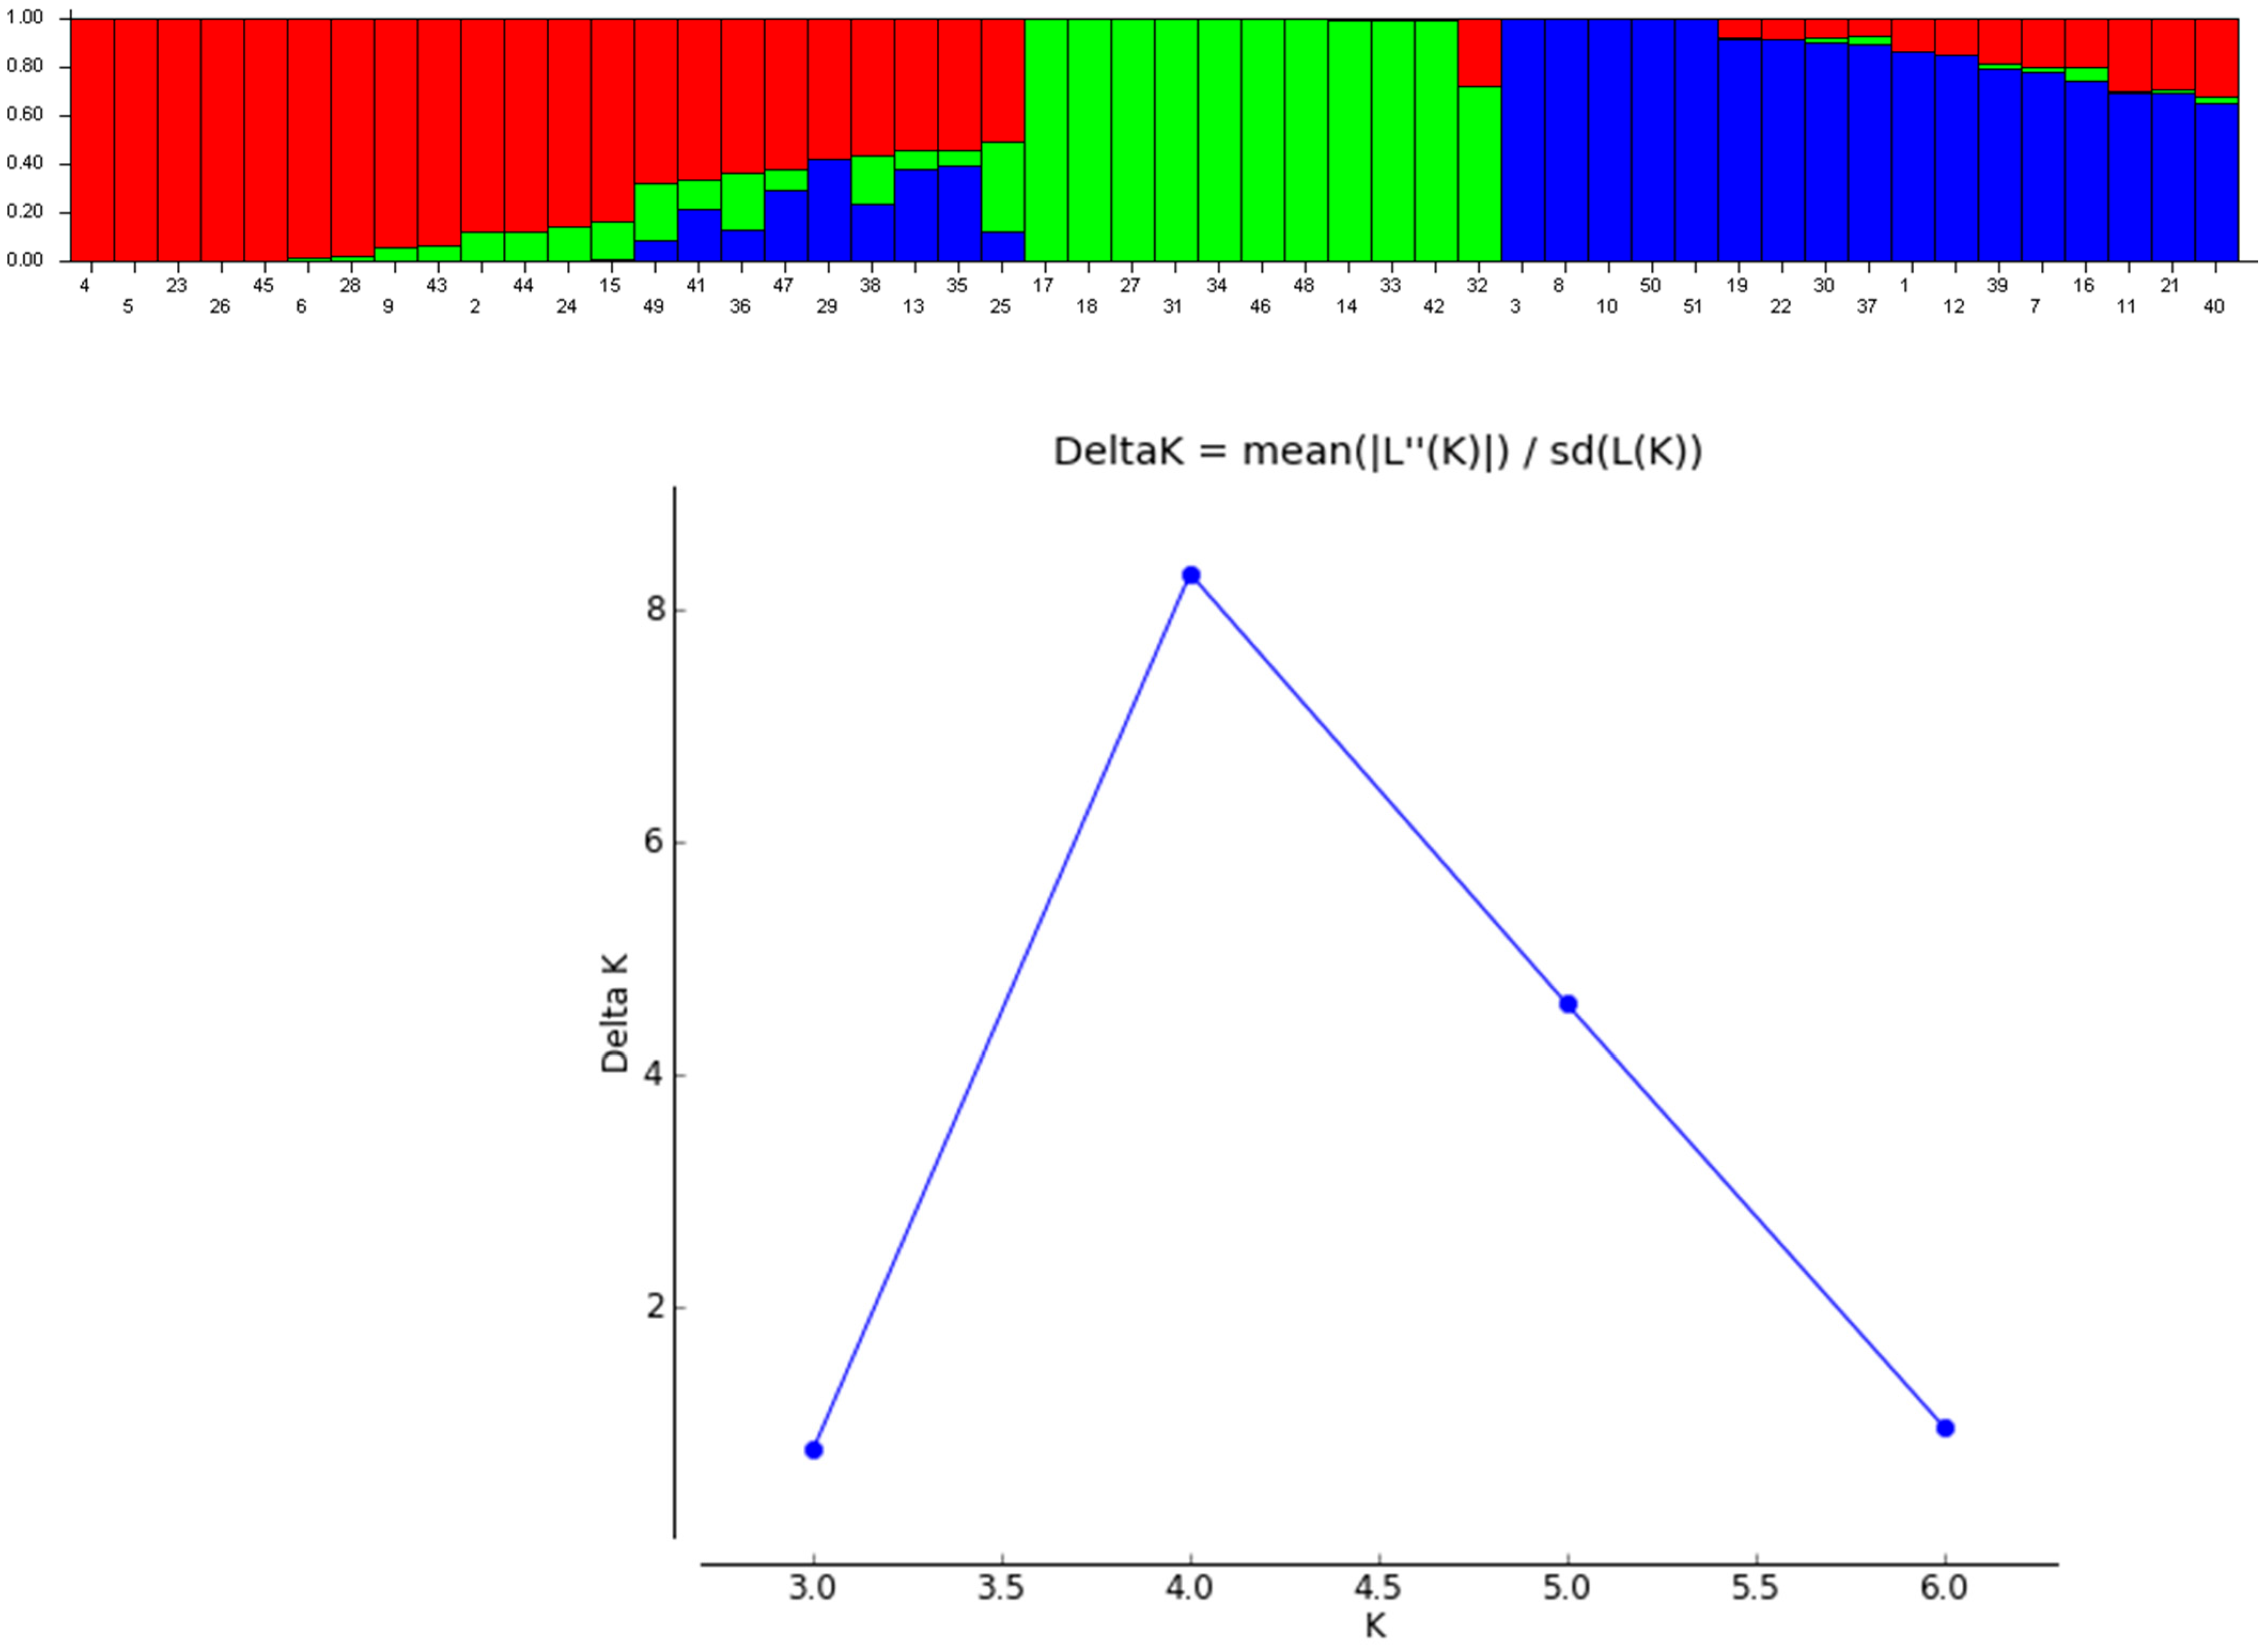
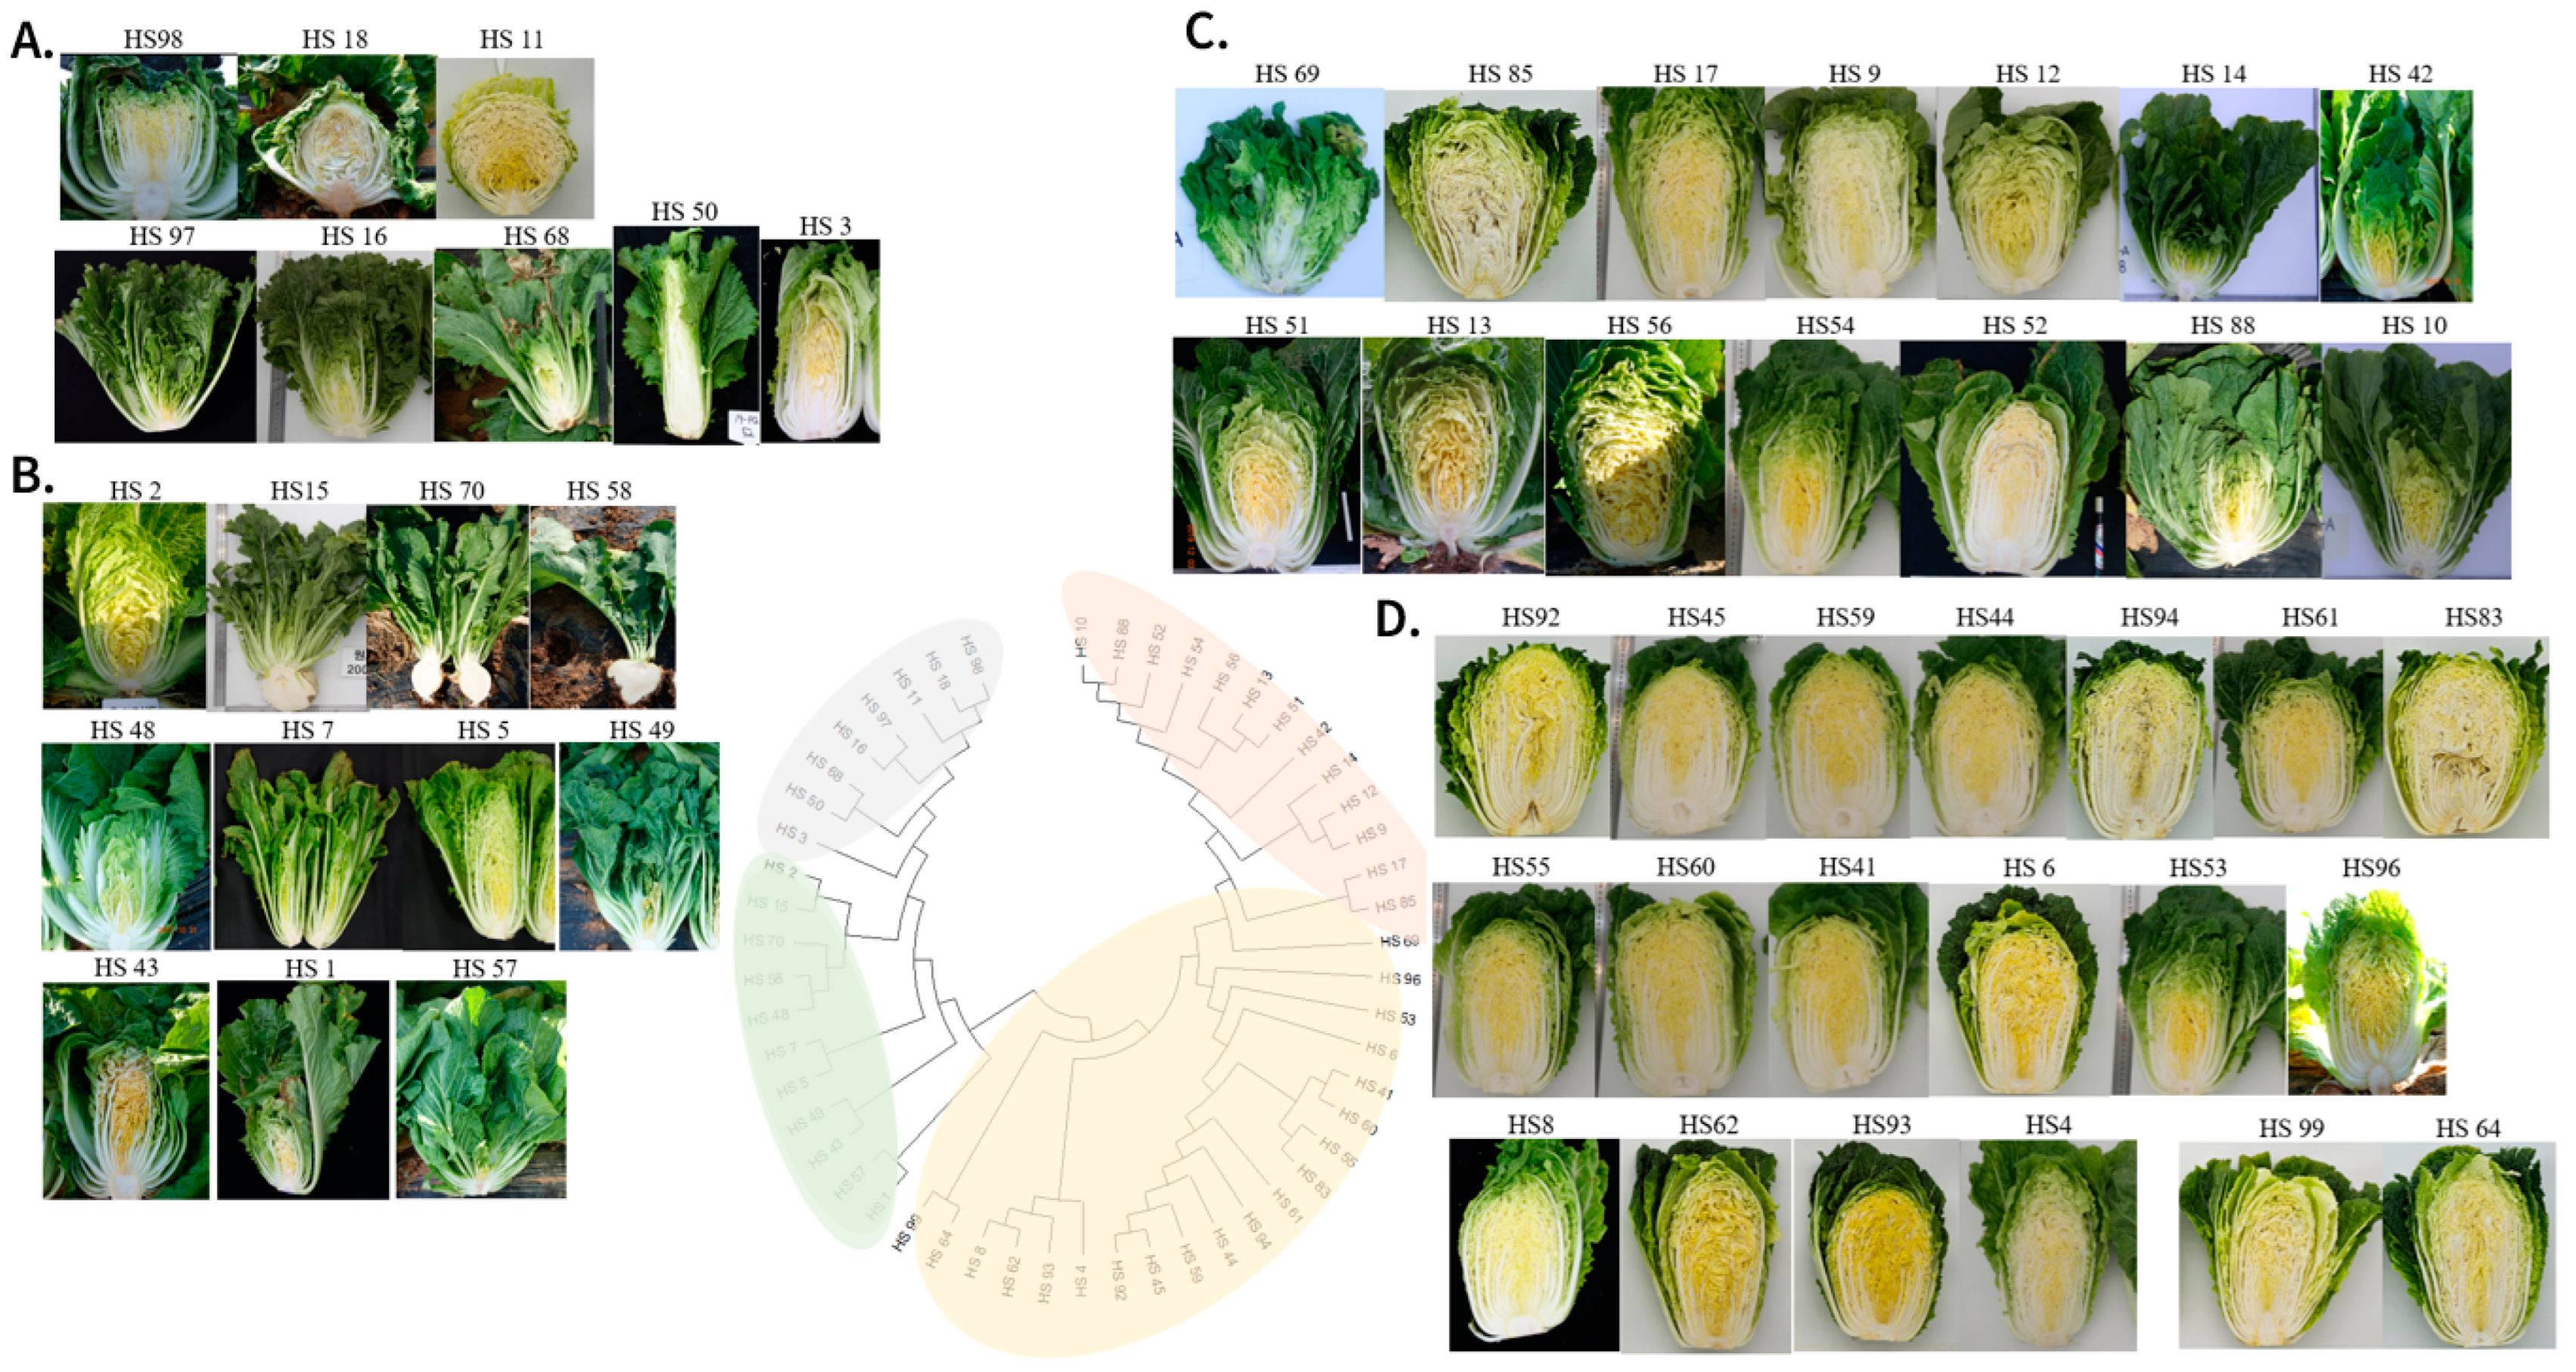
2.5. Clustering Analysis and Structure Analysis
2.6. Genome-Wide Association Study (GWAS) and Candidate Gene Annotation
3. Results
3.1. Evaluation of Phenotypic Data in an Environmentally Controlled Room
3.2. Evaluation of Phenotypic Data in an Open Field during the Summer Season
3.3. Searching Useful SNPs by Genotyping-by-Sequencing
3.4. Structure and Clustering Analysis of Chinese Cabbage Accessions
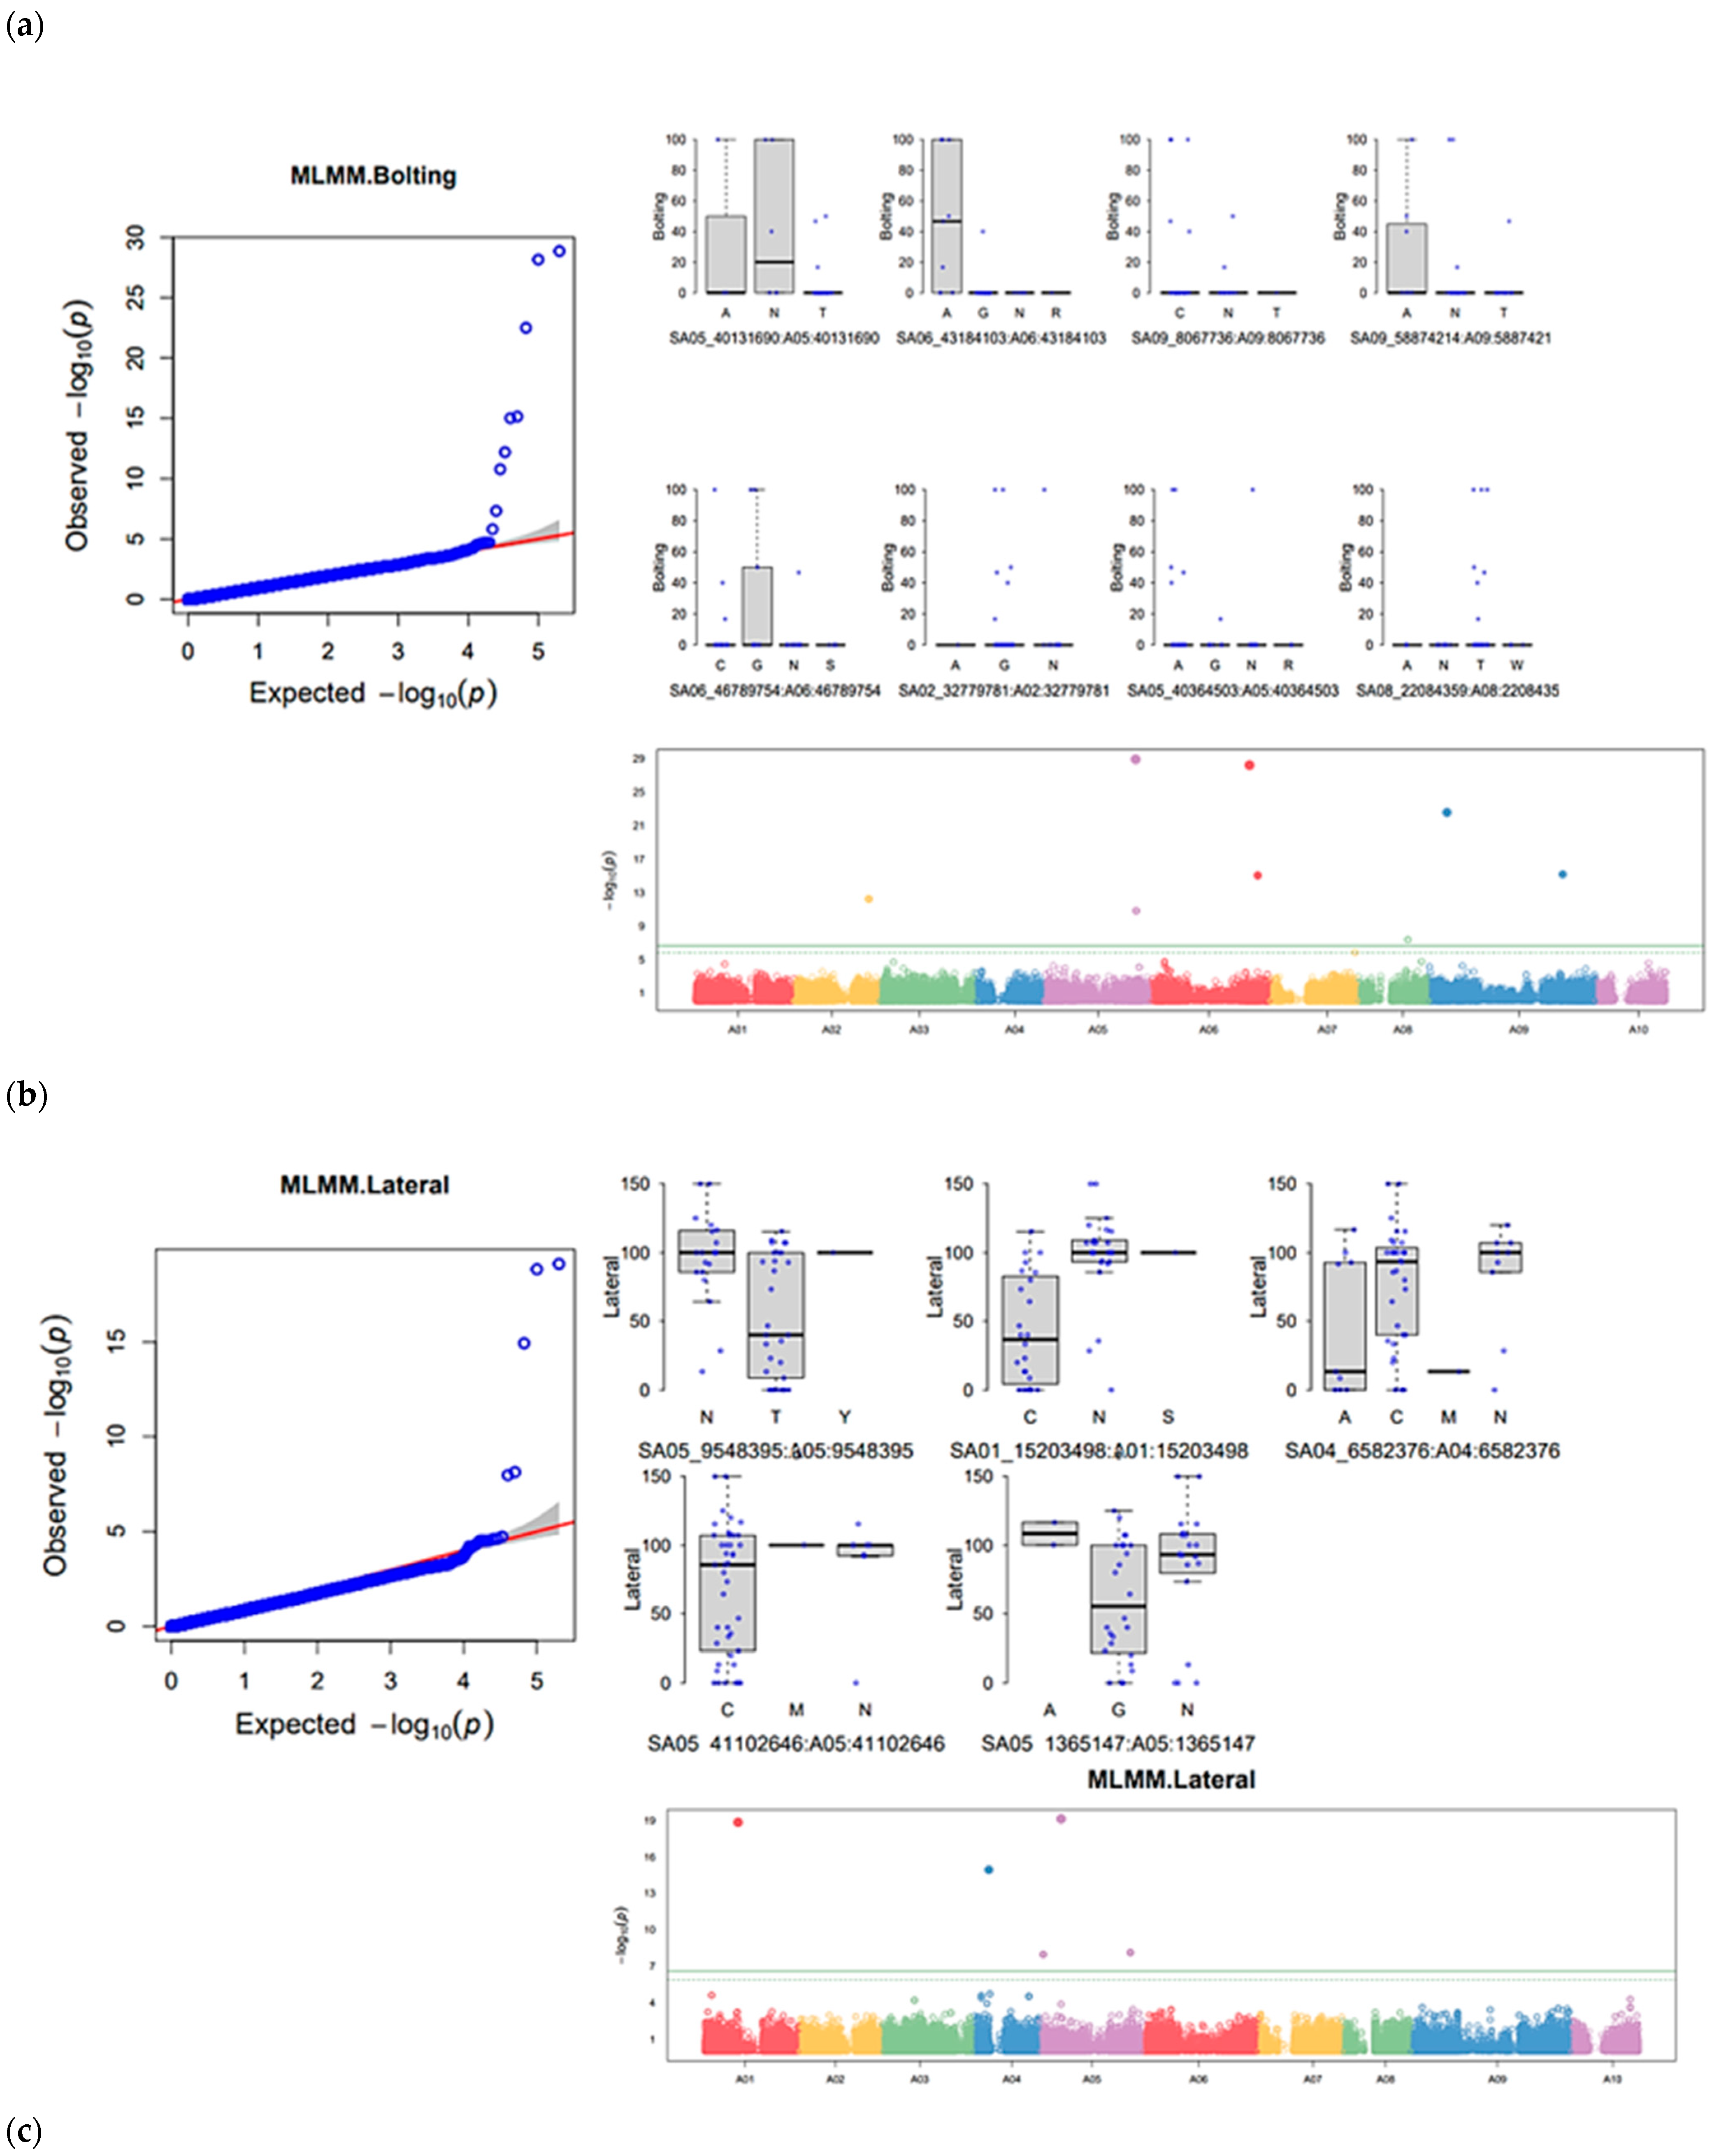
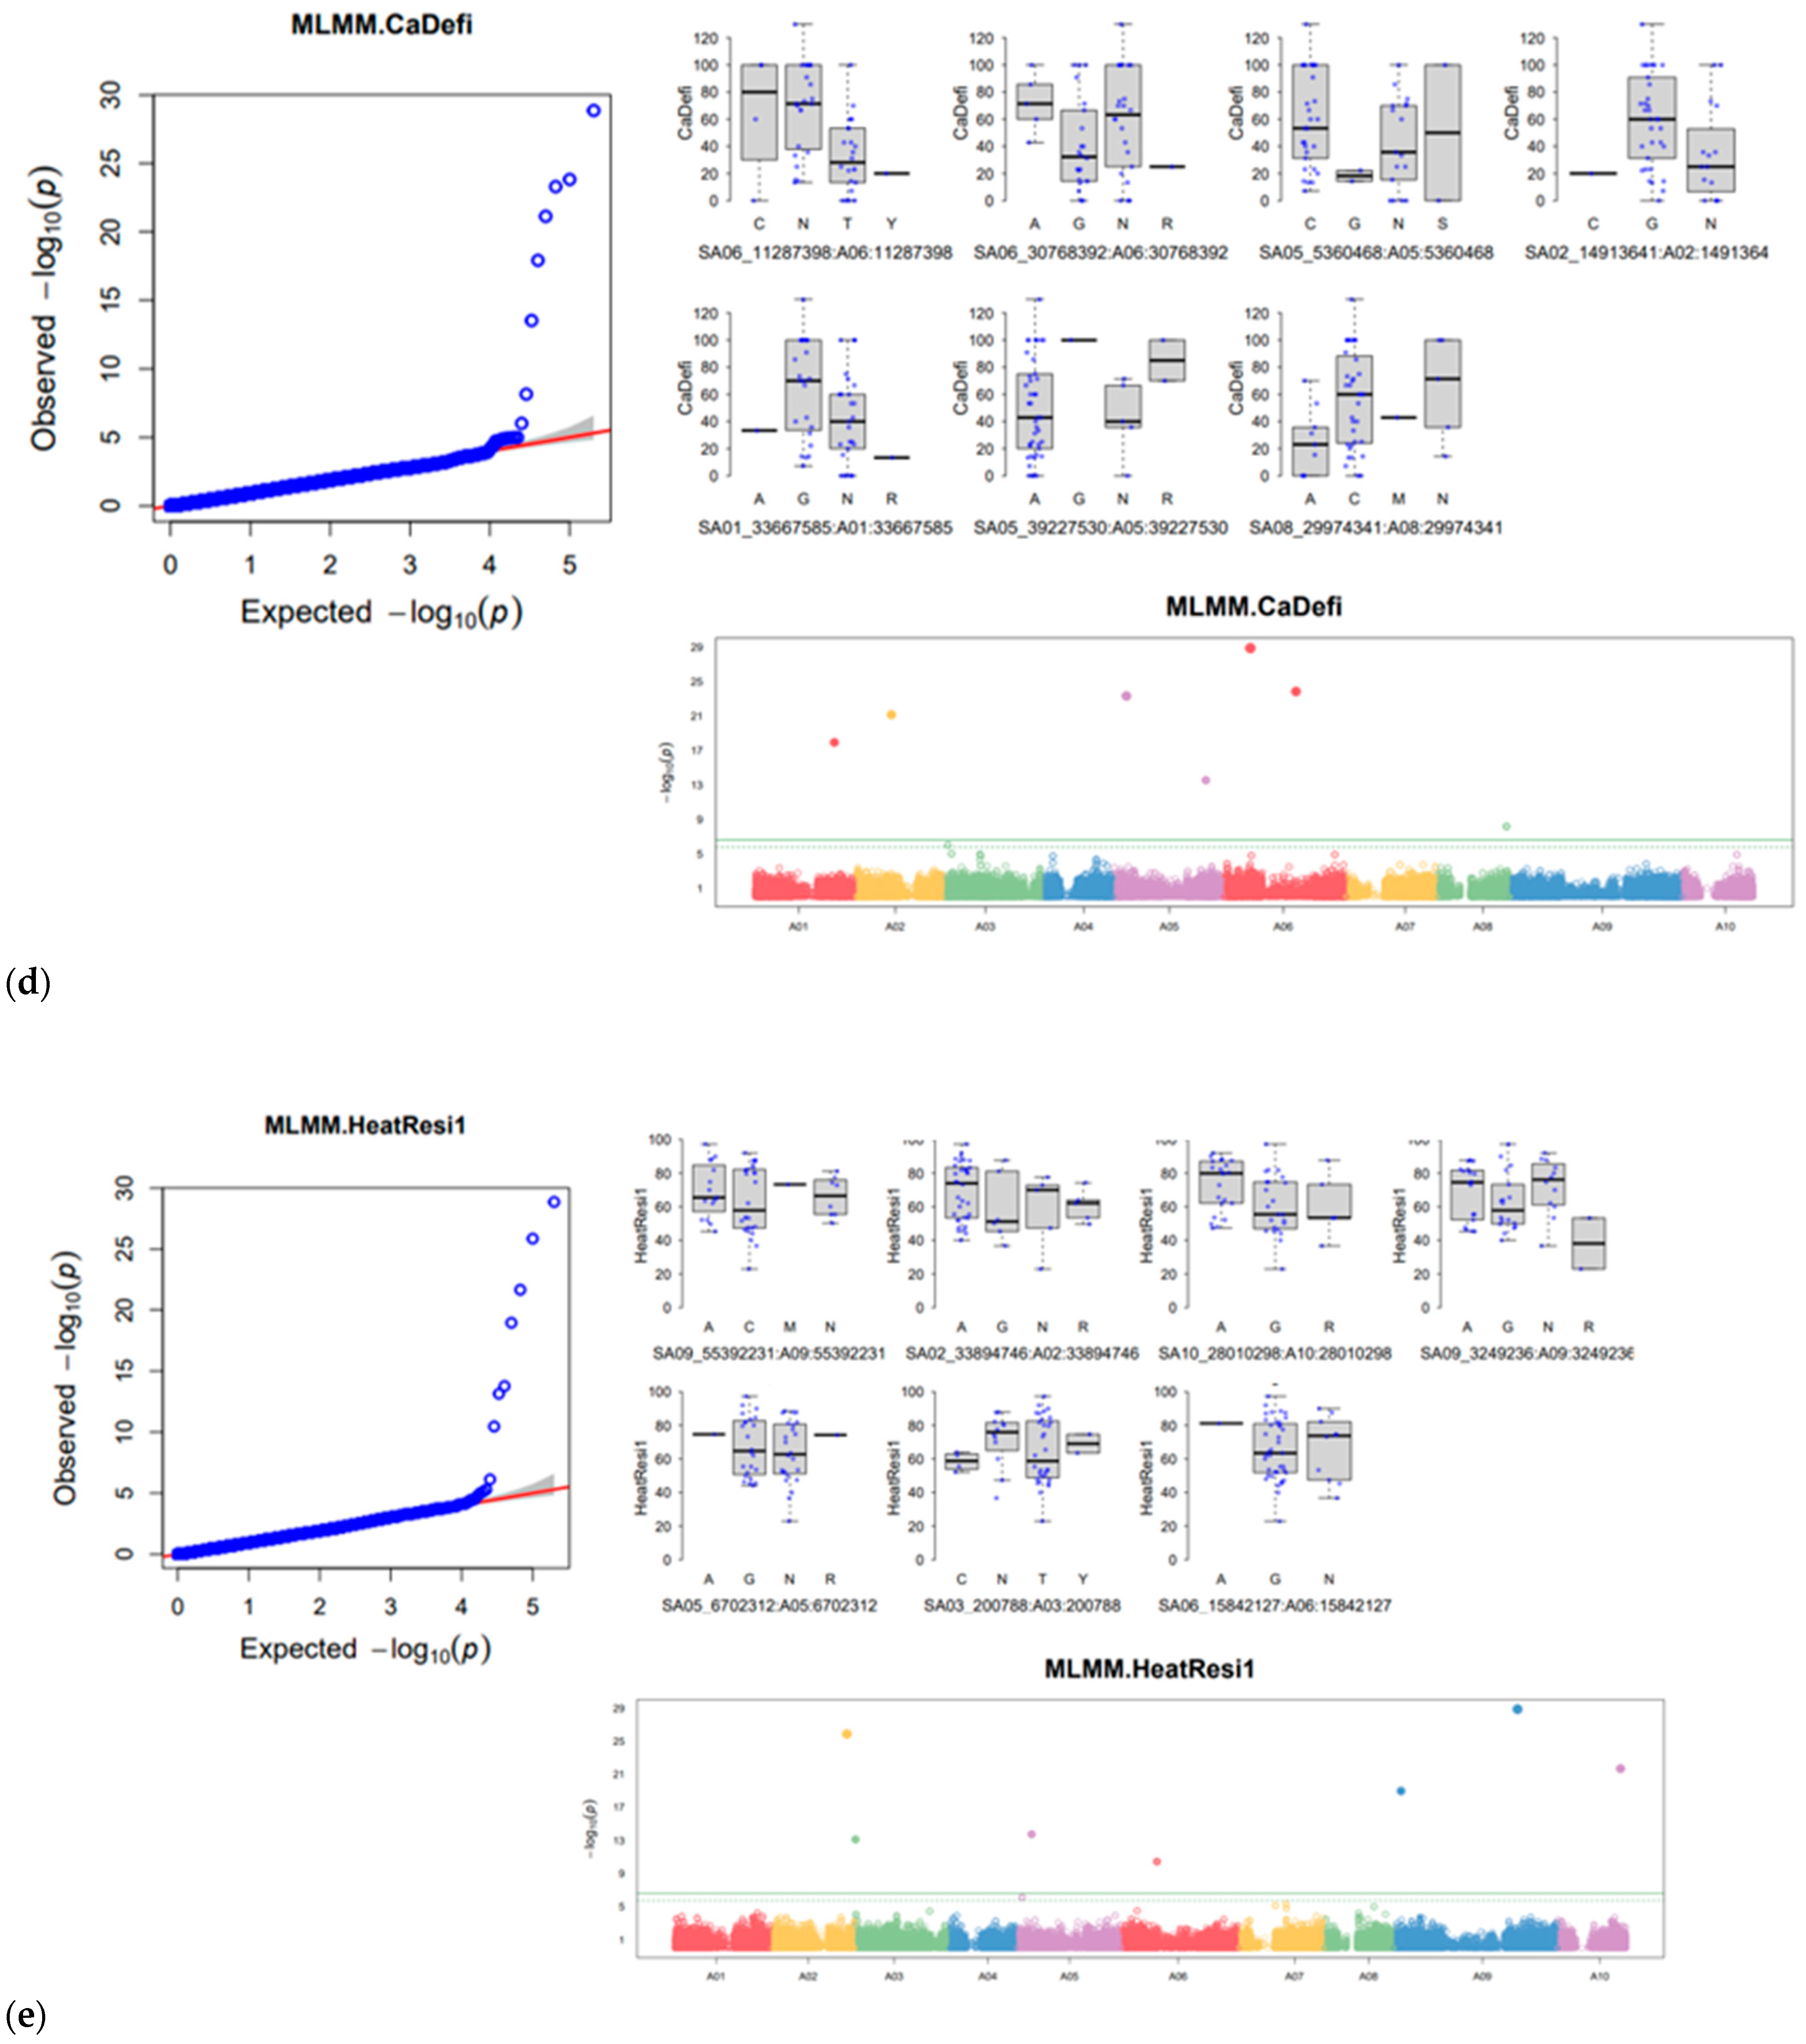
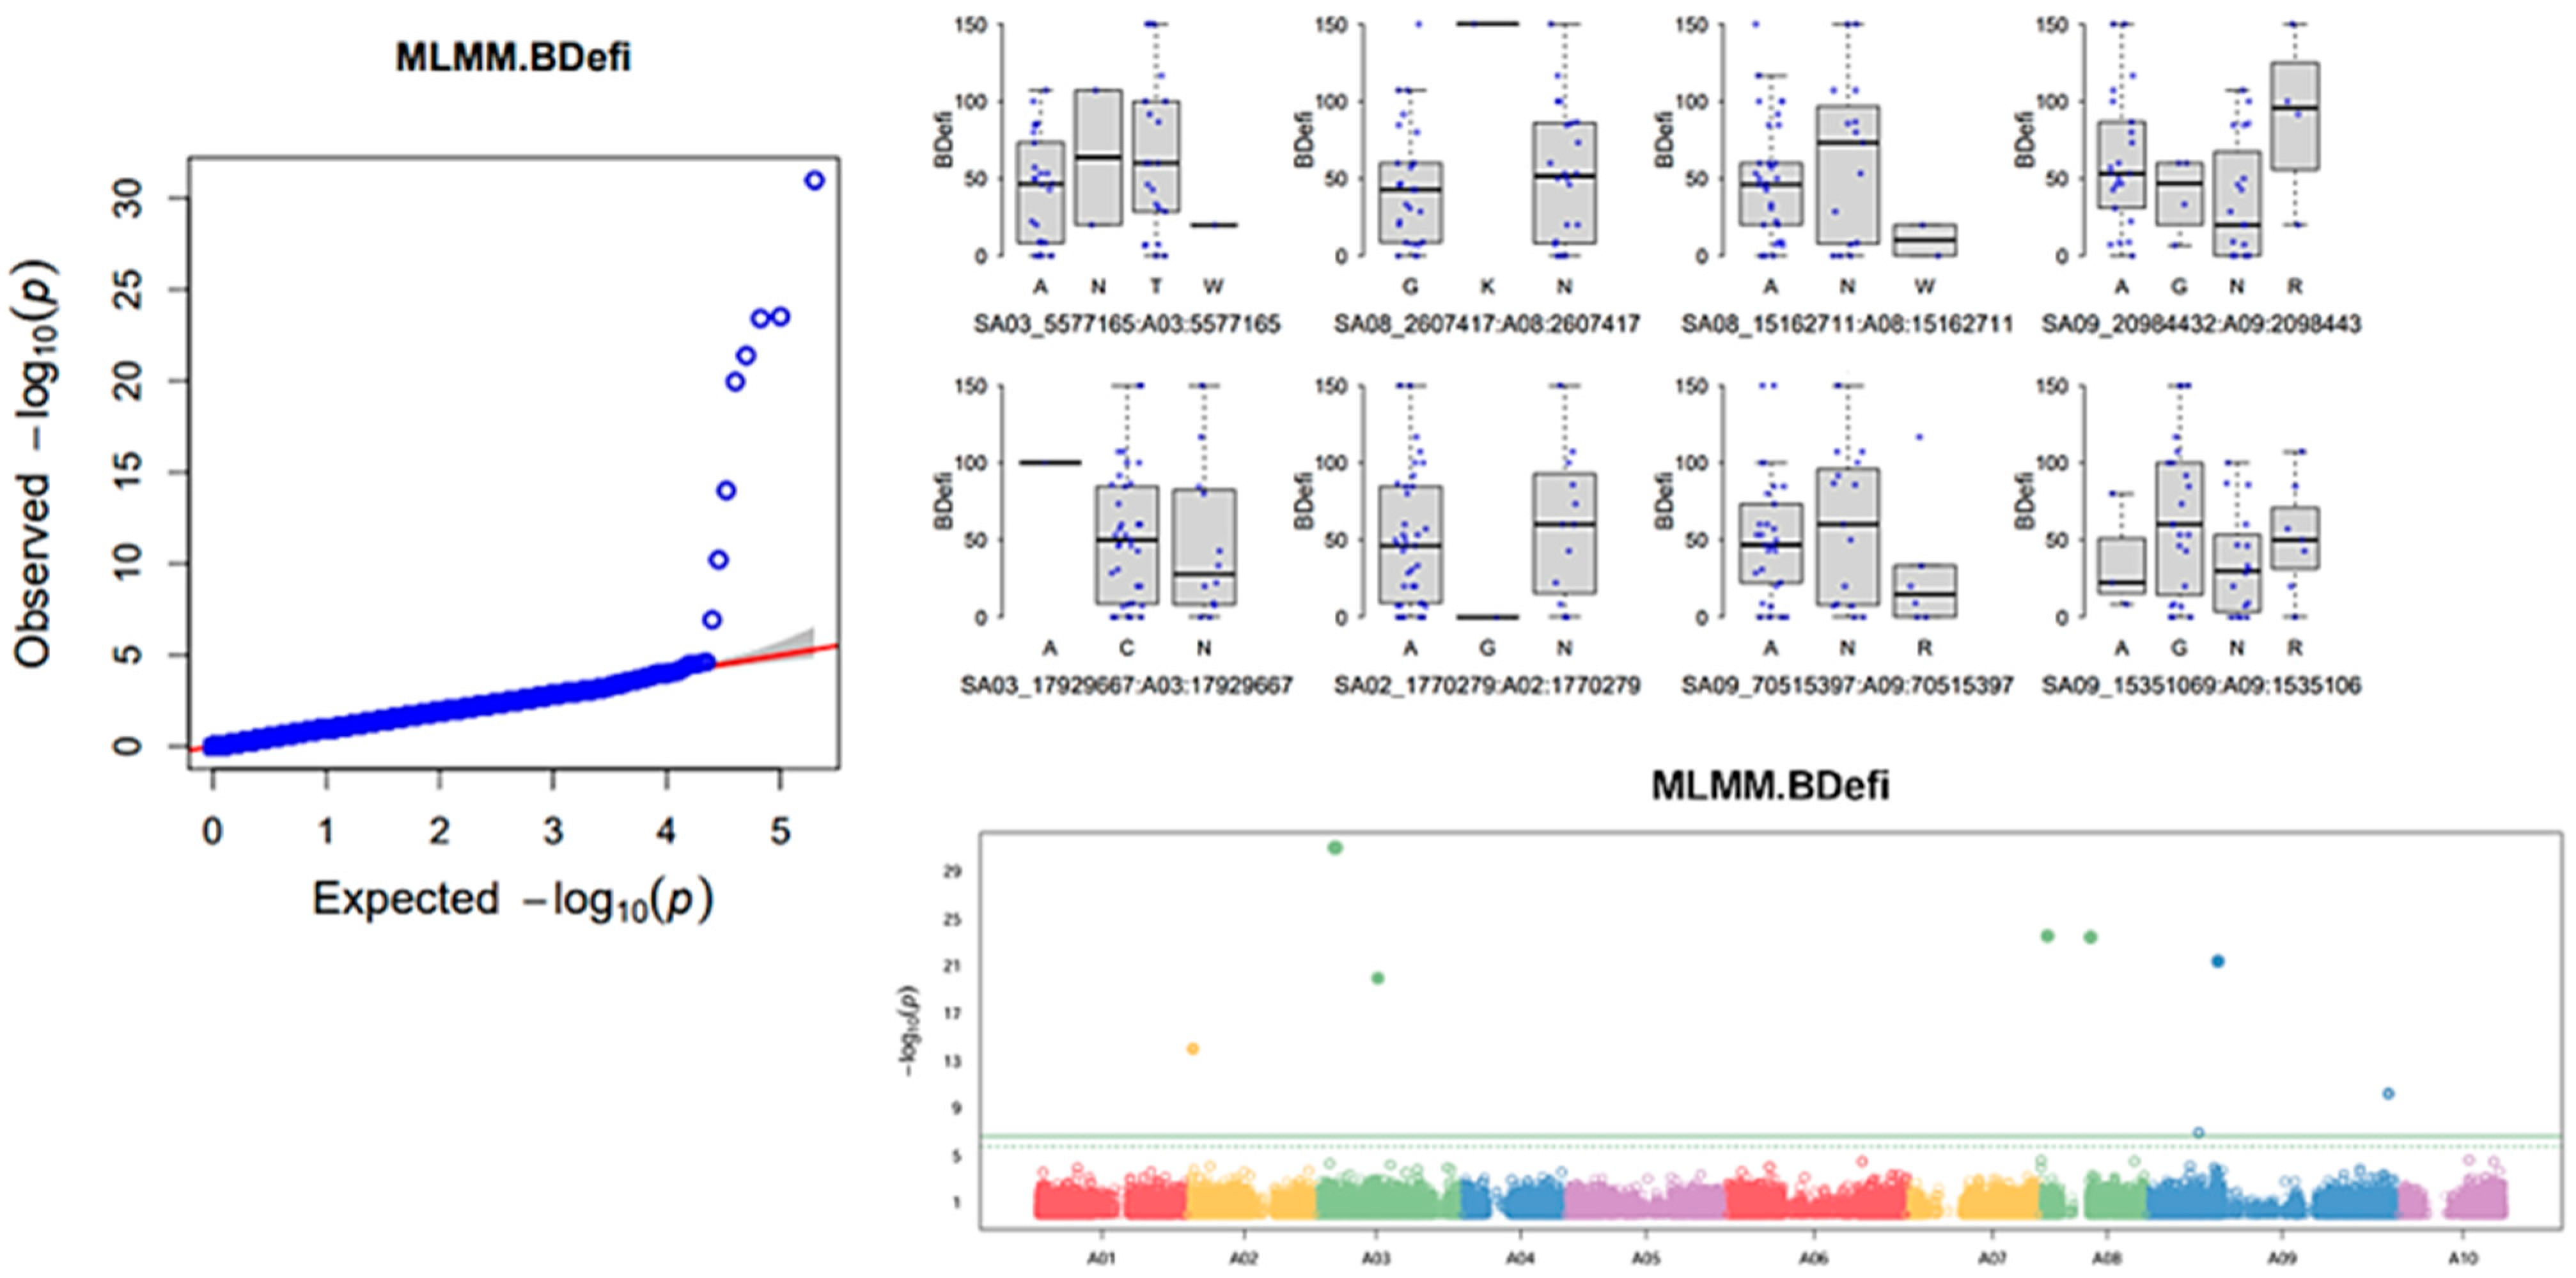
3.5. Genome-Wide Association Study of Six Horticulturally Important Traits
3.6. Assigning Significant SNPs to Potential Candidate Genes
4. Discussion
Supplementary Materials
Author Contributions
Funding
Data Availability Statement
Conflicts of Interest
References
- Cho, H.S. Food and Nationalism: Kimchi and Korean National Identity. Korean J. Int. Stud. 2006, 4, 207–229. [Google Scholar]
- Driedonks, N.; Rieu, I.; Vriezen, W.H. Breeding for plant heat tolerance at vegetative and reproductive stages. Sex. Plant Reprod. 2016, 29, 299–320. [Google Scholar] [CrossRef] [PubMed]
- Jha, U.C.; Bohra, A.; Singh, N.P. Heat stress in crop plants: Its nature, impacts and integrated breeding strategies to improve heat tolerance. Plant Breed. 2014, 133, 679–701. [Google Scholar] [CrossRef]
- Lobell, D.B.; Gourdji, S.M. The influence of climate change on global crop productivity. Plant Physiol. 2012, 160, 1686–1697. [Google Scholar] [CrossRef] [PubMed]
- Hansen, G. The evolution of the evidence base for observed impacts of climate change. Curr. Opin. Environ. Sustain. 2015, 14, 187–197. [Google Scholar] [CrossRef]
- Cossani, C.M.; Reynolds, M.P. Physiological traits for improving heat tolerance in wheat. Plant Physiol. 2012, 160, 1710–1718. [Google Scholar] [CrossRef]
- Wahid, A.; Gelani, S.; Ashraf, M.; Foolad, M.R. Heat tolerance in plants: An overview. Environ. Exp. Bot. 2007, 61, 199–223. [Google Scholar] [CrossRef]
- Porter, J.R.; Semenov, M.A. Crop responses to climatic variation. Philos. Trans. R. Soc. B Biol. Sci. 2005, 360, 2021–2035. [Google Scholar] [CrossRef]
- Mir, R.R.; Reynolds, M.; Pinto, F.; Khan, M.A.; Bhat, M.A. High-throughput phenotyping for crop improvement in the genomics era. Plant Sci. 2019, 282, 60–72. [Google Scholar] [CrossRef]
- Yang, W.; Feng, H.; Zhang, X.; Zhang, J.; Doonan, J.H.; Batchelor, W.D.; Xiong, L.; Yan, J. Crop phenomics and high-throughput phenotyping: Past decades, current challenges, and future perspectives. Mol. Plant 2020, 13, 187–214. [Google Scholar] [CrossRef]
- Maestri, E.; Klueva, N.; Perrotta, C.; Gulli, M.; Nguyen, H.T.; Marmiroli, N. Molecular genetics of heat tolerance and heat shock pro teins in cereals. Plant Mol. Biol. 2002, 48, 667–681. [Google Scholar]
- Gray, D. Effects of temperature on the germination and emergence of lettuce (Lactuca sativa L.) varieties. J. Hortic. Sci. 1975, 50, 349–361. [Google Scholar]
- Hayat, S.; Masood, A.; Yusuf, M.; Fariduddin, Q.; Ahmad, A. Growth of Indian mustard (Brassica juncea L.) in response to salicylic acid under high-temperature stress. Braz. J. Plant Physiol. 2009, 21, 187–195. [Google Scholar] [CrossRef]
- Young, L.W.; Wilen, R.W.; Bonham-Smith, P.C. High temperature stress of Brassica napus during flowering reduces micro- and meg agametophyte fertility, induces fruit abortion, and disrupts seed production. J. Exp. Bot. 2004, 55, 485–495. [Google Scholar] [CrossRef]
- Araus, J.L.; Kefauver, S.C.; Zaman-Allah, M.; Olsen, M.S.; Cairns, J.E. Translating high-throughput phenotyping into genetic gain. Trends Plant Sci. 2018, 23, 451–466. [Google Scholar]
- Orsini, F.; D’Urzo, M.P.; Inan, G.; Serra, S.; Oh, D.H.; Mickelbart, M.V.; Maggio, A. A comparative study of salt tolerance parameters in 11 wild relatives of Arabidopsis thaliana. J. Exp. Bot. 2010, 61, 3787–3798. [Google Scholar] [PubMed]
- Warman, L.; Moles, A.T.; Edwards, W. Not so simple after all: Searching for ecological advantages of compound leaves. Oikos 2011, 120, 813–821. [Google Scholar]
- Juneau, K.J.; Tarasoff, C.S. Leaf area and water content changes after permanent and temporary storage. PLoS ONE 2012, 7, e42604. [Google Scholar] [CrossRef] [PubMed]
- Carins Murphy, M.R.; Jordan, G.J.; Brodribb, T.J. Differential leaf expansion can enable hydraulic acclimation to sun and shade. Plant Cell Environ. 2012, 35, 1407–1418. [Google Scholar]
- Schneider, C.A.; Rasband, W.S.; Eliceiri, K.W. NIH Image to ImageJ: 25 years of image analysis. Nat. Methods 2012, 9, 671–675. [Google Scholar]
- Easlon, H.M.; Bloom, A.J. Easy Leaf Area: Automated digital image analysis for rapid and accurate measurement of leaf area. Appl. Plant Sci. 2014, 2, 1400033. [Google Scholar] [CrossRef]
- Evanno, G.; Regnaut, S.; Goudet, J. Detecting the number of clusters of individuals using the software STRUCTURE: A simulation study. Mol. Ecol. 2005, 14, 2611–2620. [Google Scholar] [CrossRef] [PubMed]
- Earl, D.A.; VonHoldt, B.M. STRUCTURE HARVESTER: A website and program for visualizing STRUCTURE output and imple menting the Evanno method. Conserv. Genet. Resour. 2012, 4, 359–361. [Google Scholar] [CrossRef]
- Huang, H.; Yang, X.; Zheng, M.; Chen, Z.; Yang, Z.; Wu, P.; Zhao, H. An ancestral role for 3-KETOACYL-COA SYNTHASE3 as a negative regulator of plant cuticular wax synthesis. Plant Cell 2023, 35, 2251–2270. [Google Scholar] [CrossRef] [PubMed]
- Zhang, X.; Gou, M.; Guo, C.; Yang, H.; Liu, C.J. Down-regulation of Kelch domain-containing F-box protein in Arabidopsis enhances the production of (poly) phenols and tolerance to ultraviolet radiation. Plant Physiol. 2015, 167, 337–350. [Google Scholar] [CrossRef] [PubMed]
- Lehmann, T.; Pollmann, S. Gene expression and characterization of a stress-induced tyrosine decarboxylase from Arabidopsis thali ana. FEBS Lett. 2009, 583, 1895–1900. [Google Scholar] [CrossRef] [PubMed]
- González-Mendoza, V.M.; Sánchez-Sandoval, M.E.; Castro-Concha, L.A.; Hernández-Sotomayor, S.M.T. Phospholipases C and D and their role in biotic and abiotic stresses. Plants 2021, 10, 921. [Google Scholar] [CrossRef]
- Sagar, S.; Singh, A. Emerging role of phospholipase C mediated lipid signaling in abiotic stress tolerance and development in plants. Plant Cell Rep. 2021, 40, 867–879. [Google Scholar] [CrossRef]
- Chen, Q.; Shi, X.; Ai, L.; Tian, X.X.; Zhang, H.; Tian, J.; Wang, Q.; Zhang, M.Q.; Cui, S.; Yang, C.; et al. Genome-wide identification of genes encoding SWI/SNF components in soybean and the functional characterization of GmLFR1 in drought-stressed plants. Front. Plant Sci. 2023, 14, 1176376. [Google Scholar] [CrossRef]
- Zhao, Q.; Nakashima, J.; Chen, F.; Yin, Y.; Fu, C.; Yun, J.; Dixon, R.A. Laccase is necessary and nonredundant with peroxidase for lignin polymerization during vascular development in Arabidopsis. Plant Cell 2013, 25, 3976–3987. [Google Scholar] [CrossRef]
- Liu, Y.; Liu, Y.; Zhang, L.; Hao, W.; Zhang, L.; Liu, Y.; Chen, L. Expression of Two α-Type Expansins from Ammopiptanthus nanus in Arabidopsis thaliana Enhance Tolerance to Cold and Drought Stresses. Int. J. Mol. Sci. 2019, 20, 3554. [Google Scholar] [CrossRef] [PubMed]
- Wang, X.; Niu, Y.; Zheng, Y. Multiple Functions of MYB Transcription Factors in Abiotic Stress Responses. Int. J. Mol. Sci. 2021, 22, 6125. [Google Scholar] [CrossRef] [PubMed]
- Cao, G.; Gu, H.; Tian, Z.; Shi, G.; Chen, W.; Tian, B.; Wei, X.; Zhang, L.; Wei, F.; Xie, Z. BrDHC1, a Novel Putative DEAD-Box Helicase Gene, Confers Drought Tolerance in Transgenic Brassica rapa. Horticulturae 2022, 8, 707. [Google Scholar] [CrossRef]
- Zhang, L.; Xu, Y.; Liu, X.; Qin, M.; Li, S.; Jiang, T.; Yang, Y.; Jiang, C.Z.; Gao, J.; Hong, B.; et al. The chrysanthemum DEAD-box RNA helicase CmRH56 regulates rhizome outgrowth in response to drought stress. J. Exp. Bot. 2022, 73, 4137–4149. [Google Scholar] [CrossRef] [PubMed]
- Lam, H.M.; Sun, S.S.M.; Shao, G.H. Abiotic Stress Tolerance Conferred by J-Domain Containing Proteins. U.S. Patent No. 7,939,711, 10 May 2011. [Google Scholar]
- Liu, Y.; Yao, X.; Zhang, L.; Lu, L.; Liu, R. Overexpression of DBF-Interactor Protein 6 Containing an R3H Domain Enhances Drought Tolerance in Populus L. (Populus tomentosa). Front. Plant Sci. 2021, 12, 601585. [Google Scholar] [CrossRef] [PubMed]
- Guo, J.; Sun, B.; He, H.; Zhang, Y.; Tian, H.; Wang, B. Current Understanding of bHLH Transcription Factors in Plant Abiotic Stress Tolerance. Int. J. Mol. Sci. 2021, 22, 4921. [Google Scholar] [CrossRef] [PubMed]
- Öncül, A.B.; Çelik, Y.; Ünel, N.M.; Baloglu, M.C. bHLHDB: A Next Generation Database of Basic Helix Loop Helix Transcription Factors Based on Deep Learning Model. J. Bioinform. Comput. Biol. 2022, 20, 2250014. [Google Scholar] [CrossRef]
- Melo, F.V.; Oliveira, M.M.; Saibo, N.J.M.; Lourenço, T. Modulation of Abiotic Stress Responses in Rice by E3-Ubiquitin Ligases: A Promising Way to Develop Stress-Tolerant Crops. Front. Plant Sci. 2021, 12, 640193. [Google Scholar] [CrossRef]
- Zhang, G.; Wang, F.; Li, J.; Ding, Q.; Yihui, Z.; Huayin, L.; Zhang, J.; Gao, J. Genome-Wide Identification and Analysis of the VQ Motif-Containing Protein Family in Chinese Cabbage (Brassica rapa L. ssp. Pekinensis). Int. J. Mol. Sci. 2015, 16, 26127–26145. [Google Scholar] [CrossRef]
- Astudillo, C.; Fernandez, A.C.; Blair, M.W.; Cichy, K.A. The Phaseolus vulgaris ZIP Gene Family: Identification, Characterization, Mapping, and Gene Expression. Front. Plant Sci. 2013, 4, 286. [Google Scholar] [CrossRef]
- Spielmann, J.; Detry, N.; Thiébaut, N.; Jadoul, A.; Schloesser, M.; Motte, P.; Périlleux, C.; Hanikenne, M. ZRT-IRT-Like PROTEIN 6 Expression Perturbs Local Ion Homeostasis in Flowers and Leads to Anther Indehiscence and Male Sterility. Plant Cell Environ. 2021, 44, 3655–3670. [Google Scholar] [CrossRef] [PubMed]
- Fujimoto, S.Y.; Ohta, M.; Usui, A.; Shinshi, H.; Ohme-Takagi, M. Arabidopsis ethylene-responsive element binding factors act as transcriptional activators or repressors of GCC box–mediated gene expression. Plant Cell 2000, 12, 393–404. [Google Scholar] [PubMed]
- Thirumalaikumar, V.P.; Devkar, V.; Mehterov, N.; Ali, S.; Ozgur, R.; Turkan, I.; Mueller-Roeber, B.; Balazadeh, S. NAC transcription factor JUNGBRUNNEN1 enhances drought tolerance in tomato. Plant Biotechnol. J. 2018, 16, 354–366. [Google Scholar] [CrossRef]
- Sun, Y.; Zhang, Y.; Jia, S.; Lin, C.; Zhang, J.; Yan, H.; Peng, B.; Zhao, L.; Zhang, W.; Zhang, C. Identification of a candidate restorer-of-fertility gene Rf3 encoding a pentatricopeptide repeat protein for the cytoplasmic male sterility in soybean. Int. J. Mol. Sci. 2022, 23, 5388. [Google Scholar] [CrossRef] [PubMed]
- Igarashi, K.; Kazama, T.; Toriyama, K. A gene encoding pentatricopeptide repeat protein partially restores fertility in RT98-Type cytoplasmic male-sterile rice. Plant Cell Physiol. 2016, 57, 1456–1463. [Google Scholar] [CrossRef]
- Stotz, H.U.; Spence, B.; Wang, Y. A defensin from tomato with dual function in defense and development. Plant Mol. Biol. 2009, 71, 131–143. [Google Scholar] [CrossRef] [PubMed]
- Mantegazza, O.; Gregis, V.; Mendes, M.A.; Morandini, P.; Alves-Ferreira, M.; Patreze, C.M.; Nardeli, S.M.; Kater, M.M.; Colombo, L. Analysis of the arabidopsis REM gene family predicts functions during flower development. Ann. Bot. 2014, 114, 1507–1515. [Google Scholar] [CrossRef]
- Zhang, Y.; Li, Z.; Ma, B.; Hou, Q.; Wan, X. Phylogeny and Functions of LOB Domain Proteins in Plants. Int. J. Mol. Sci. 2020, 21, 2278. [Google Scholar] [CrossRef]
- Viñegra de la Torre, N.; Vayssières, A.; Obeng-Hinneh, E.; Neumann, U.; Zhou, Y.; Lázaro, A.; Roggen, A.; Sun, H.; Stolze, S.C.; Nakagami, H.; et al. FLOWERING REPRESSOR AAA+ ATPase 1 is a novel regulator of perennial flowering in Arabis alpina. New Phytol. 2022, 235, 1469–1482. [Google Scholar]
- Zhang, P.; Zhang, Y.; Sun, L.; Sinumporn, S.; Yang, Z.; Sun, B.; Xuan, D.; Li, Z.; Yu, P.; Wu, W.; et al. The Rice AAA-ATPase OsFIGNL1 Is Essential for Male Meiosis. Front. Plant Sci. 2017, 8, 1639. [Google Scholar]
- Hu, J.; Li, W.; Liu, Z.; Zhang, G.; Luo, Y. Molecular cloning and functional characterization of tyrosine decarboxylases from galan thamine-producing Lycoris radiata. Acta Physiol. Plant. 2021, 43, 115. [Google Scholar] [CrossRef]
- Burla, B.; Pfrunder, S.; Nagy, R.; Francisco, R.M.; Lee, Y.; Martinoia, E. Vacuolar transport of abscisic acid glucosyl ester is mediated by ATP-binding cassette and proton-antiport mechanisms in Arabidopsis. Plant Physiol. 2013, 163, 1446–1458. [Google Scholar] [CrossRef] [PubMed]
- Yan, J.; Li, X.; Zeng, B.; Zhong, M.; Yang, J.; Yang, P.; Li, X.; He, C.; Lin, J.; Liu, X.; et al. FKF1 F-box protein promotes flowering in part by negatively regulating DELLA protein stability under long-day photoperiod in Arabidopsis. J. Integr. Plant Biol. 2020, 62, 1654–1668. [Google Scholar] [CrossRef] [PubMed]
- Ebert, B.; Birdseye, D.; Liwanag, A.J.M.; Laursen, T.; Rennie, E.A.; Guo, X.; Catena, M.; Rautengarten, C.; Stonebloom, S.; Gluza, P.; et al. The three members of the Arabidopsis Glycosyltransferase Family 92 are functional β-1,4-galactan synthases. Plant Cell Physiol. 2018, 59, 2624–2636. [Google Scholar] [CrossRef] [PubMed]
- Wang, B.; Jin, S.H.; Hu, H.Q.; Sun, Y.G.; Wang, Y.W.; Han, P.; Hou, B.K. UGT87A2, an Arabidopsis glycosyltransferase, regulates flowering time via FLOWERING LOCUS C. New Phytol. 2012, 194, 666–675. [Google Scholar] [CrossRef] [PubMed]
- Tong, C.; Aziz, H.A. Genome-Wide Characterization of Serine/Arginine-Rich Gene Family and Its Genetic Effects on Agronomic Traits of Brassica napus. Front. Plant Sci. 2022, 13, 829668. [Google Scholar]
- Wang, T.; Wang, X.; Wang, H.; Yu, C.; Xiao, C.; Zhao, Y.; Han, H.-N.; Zhao, S.; Shao, Q.; Zhu, J.; et al. Arabidopsis SRPKII family proteins regulate flowering via phosphorylation of SR proteins and effects on gene expression and alternative splicing. New Phytol. 2023, 237, 146–159. [Google Scholar]
- Abdulla, M.F.; Mostafa, K.; Aydin, A.; Kavas, M.; Aksoy, E. GATA transcription factor in common bean: A comprehensive genome-wide functional characterization, identification, and abiotic stress response evaluation. Plant Mol. Biol. 2024, 114, 1–22. [Google Scholar] [CrossRef]
- Du, X.; Lu, Y.; Sun, H.; Duan, W.; Hu, Y.-J.; Yan, Y.-H. Genome-Wide Analysis of Wheat GATA Transcription Factor Genes Reveals Their Molecular Evolutionary Characteristics and Involvement in Salt and Drought Tolerance. Int. J. Mol. Sci. 2022, 24, 27. [Google Scholar] [CrossRef]
- Geisler, M.; Murphy, A.S. The ABC of auxin transport: The role of p-glycoproteins in plant development. FEBS Lett. 2006, 580, 1094–1102. [Google Scholar] [CrossRef]
- Wang, R.; Estelle, M. Diversity and specificity: Auxin perception and signaling through the TIR1/AFB pathway. Curr. Opin. Plant Biol. 2014, 21, 51–58. [Google Scholar] [CrossRef] [PubMed]
- Zhang, H.; Duan, K.; Zhang, Z.; Li, X.; Wang, C. The role of PIN-FORMED auxin efflux carriers in adventitious root formation under stress conditions. Front. Plant Sci. 2021, 12, 625346. [Google Scholar]
- Pandian, B.A.; Sathishraj, R.; Djanaguiraman, M.; Prasad, P.V.V.; Jugulam, M. Role of Cytochrome P450 Enzymes in Plant Stress Response. Antioxidants 2020, 9, 454. [Google Scholar] [CrossRef] [PubMed]
- Han, T.P.; Ong, L. Lignin: A defensive shield halting the environmental stresses—A review. Appl. Ecol. Environ. Res. 2022, 20, 1991–2015. [Google Scholar]
- Chen, Y.; Zhang, B.; Li, C.; Lei, C.; Kong, C.; Yang, Y.; Gong, M. A comprehensive expression analysis of the expansin gene family in potato (Solanum tuberosum) discloses stress-responsive expansin-like B genes for drought and heat tolerances. PLoS ONE 2019, 14, e0219837. [Google Scholar] [CrossRef] [PubMed]
- Al-Saharin, R.; Mooney, S.; Dißmeyer, N.; Hellmann, H. Plant E3 Ligases and Their Role in Abiotic Stress Response. Plant Direct 2022, 6, 890. [Google Scholar] [CrossRef]
- Zhang, X.; Meng, L.; Liu, B.; Hu, Y.; Cheng, F.; Liang, J.; Wu, J. A transposon insertion in FLOWERING LOCUS T is associated with delayed flowering in Brassica rapa. Plant Sci. 2015, 241, 211–220. [Google Scholar] [CrossRef]
- Wei, X.; Rahim, M.A.; Zhao, Y.; Yang, S.; Wang, Z.; Su, H.; Zhang, X. Comparative transcriptome analysis of early-and late-bolting traits in Chinese cabbage (Brassica rapa). Front. Genet. 2021, 12, 590830. [Google Scholar] [CrossRef]
- Kim, J.H.; Jung, W.J.; Kim, M.; Ko, C.S.; Yoon, J.S.; Hong, M.J.; Shin, H.J.; Seo, Y.W. Molecular characterization of wheat floret devel opment-related F-box protein (TaF-box2): Possible involvement in regulation of Arabidopsis flowering. Physiol. Plant. 2022, 174, 58–72. [Google Scholar] [CrossRef]

| Number | Accession ID | Traits |
|---|---|---|
| HS1 | Wongyo20034ho | Light yellow inner leaf, light green outer leaf Semi-opened, not firm head with low leaf number Bumpy top Clubroot race 4 resistance |
| HS2 | Wongyo20035ho | Yellow numerous inner leaf, green outer leaf Semi-opened, firmness in middle Good round-shaped top |
| HS 3 | Wongyo20036ho | The outer leaves are oblong oval in shape and long, the outer leaves are pale green and the inner leaves are light yellow Semi-opened Upright and tall plant stature The length of the outer leaf midrib is long, and the shape of the bulb tip is bumpy |
| HS 4 | Wongyo20037ho | Light green outer leaf and yellow inner leaf Closed, small head type Clubroot race 4 resistance late flowering and high glucosinolate contents |
| HS 5 | Wongyo20038ho | Light yellow inner leaf Unrigid inner head Elongated, big type Clubroot race 4 |
| HS 6 | Wongyo20039ho | Yellow inner leaf Firm, round head Small size, normal kimchi cabbage type Clubroot race 4 resistance Early maturing |
| HS 7 | Wongyo20040ho | Deep green outer leaf and pale yellow inner leaf Opened head type Clubroot race 11 resistance |
| HS 8 | Wongyo20041ho | Golden yellow inner leaf Fully closed head type with numerous inner leaves, small size Clubroot race 11 resistance |
| HS 9 | Wongyo20042ho | The outer leaves are pale green and the inner leaves are yellow Small, firm, closed type head Round top, small leaf size Clubroot race 4 resistance |
| HS 10 | Wongyo20043ho | Green outer leaf and yellow inner leaf Big closed, unrigid head type High glucosinolate contents |
| HS 11 | Wongyo20045ho | The outer leaves are deep green and the inner leaves are light yellow Small, firm, closed type head Round top, small leaf size Clubroot race 4 Early maturing |
| HS 12 | Wongyo20046ho | Yellow inner leaves Closed type head, low firmness Long, narrow shape Clubroot race 9 |
| HS 13 | Wongyo20047ho | Green outer leaves and deep yellow inner leaves Closed type head, low firmness Long, narrow shape High adaptability in heat stress/summer season |
| HS 14 | Wongyo20048ho | Green outer leaves and yellow inner leaves Closed type head, low firmness Small size, erected leaf Early maturing, heat stress resistance |
| HS 15 | Wongyo20049ho | Deep green leaves Open type Thick root, high glucosinolate contents |
| HS 16 | Wongyo20050ho | Deep green leaves Open type Thick leaf, low leaf number High glucosinolate contents |
| HS 17 | Wongyo20051ho | Green outer leaves, yellow inner leaves Firm, closed type, small size Cold tolerance |
| HS 18 | Wongyo20052ho | Light green outer leaves, pale yellow inner leaves Firm, closed type with many leaves, round shape, small size Very early maturing No leaf hair Clubroot race 9 resistance |
| HS 41 | 16-FFB128-2F | Yellow inner leaves Rigid, closed type Normal kimchi cabbage type |
| HS 42 | 17-FC02-1 | Pale yellow inner leaves Half-closed head Heat tolerance |
| HS 43 | 17-FC66-1 | Golden yellow inner leaves Half closed, unrigid Heat tolerance |
| HS 44 | Wongyo20053ho | Small, extremely early maturing Green outer leaves, yellow inner leaves Showing moderate resistance to various kinds of insets and extreme weather events |
| HS 45 | 17-FC69-1 | Closed head, numerous yellow inner leaves, heat tolerance, summer-season adaptability |
| HS 48 | RFC106-2 | Half-closed head, light green outer leaves |
| HS 49 | 17-RFC145-3 | No heading, deep-green-colored outer leaves, light yellow inner leaves |
| HS 50 | 18-BD32 | White inner leaves, green outer leaves, long closed head |
| HS 51 | 18-BD109 | Closed head type, yellow inner leaves, dark green outer leaves, unrigid |
| HS 52 | 19-FQ48 | Closed head type, light yellow inner leaves, green outer leaves |
| HS 53 | 19-FQ49-1 | Yellow inner leaf, small closed head type, unrigid, green outer leaves |
| HS 54 | 19-FQ53 | Small closed head type, yellow inner leaves, green outer leaves |
| HS 55 | 19-FQ55-1 | Yellow inner leaf, dark green leaf, numerous inner leaves, closed head type, adaptable in summer season |
| HS 56 | 19-FQ58 | Yellow inner leaves, unrigid/closed head type, dark green outer leaves |
| HS 57 | 19-FQ108 | Opened head type, green-colored leaves |
| HS 58 | 19-FQ145-1 | Similar to turnip, dark green outer leaves |
| HS 59 | 19-FQ154 | Yellow inner leaf, dark green outer leaf, numerous inner leaves, closed head type, adaptable in summer season |
| HS 60 | 19-FQ155 | Yellow inner leaf, green outer leaves, numerous inner leaves, closed head type, adaptable in summer season Heat tolerance |
| HS 61 | 19-FQ156 | Yellow inner leaf, dark green outer leaf, numerous inner leaves, closed head type Heat tolerance, summer-season adaptability |
| HS 62 | 15-CDYB2-7 | Adaptable in summer season, yellow inner leaves, dark green outer leaf, small closed head type |
| HS 64 | namdo13-2-6 | Yellow inner leaves, dark green outer leaves, closed head type, early maturing, numerous inner leaves, adaptable in summer season |
| HS 68 | 18-BD85 | Half-closed head type, light yellow inner leaves, green outer leaves |
| HS 69 | 15-CDYB3-1(DA180) | Adaptable in summer season, drought tolerance, half-closed head type, light green outer leaves |
| HS 70 | 16-GW06 | Similar turnip, dark green outer leaves |
| HS 83 | 15-FD29 | Light yellow inner leaves, light green outer leaf numerous inner leaves, adaptable in summer season |
| HS 85 | 19-FQ27-2 | Closed head type, light yellow inner leaves, green outer leaves |
| HS 88 | 17-WA10-4 | Half-closed head type, light green inner leaves, light green inner leaves, green outer leaves, numerous inner leaves |
| HS 92 | 18-FH115-1 | Yellow inner leaves, dark green outer leaves, numerous inner leaves, adaptable in summer season, numerous inner leaves |
| HS 93 | 17-FC82-2 | Yellow inner leaves, closed head type, Early–mid maturing Heat tolerance, summer-season adaptability |
| HS 94 | 18-FH119-2 | Light yellow inner leaves, adaptable in summer season, dark green outer leaves, closed head type, early maturing |
| HS 96 | 17-FE101 | Yellow inner leaves, unrigid closed head type, green outer leaves, unrigid |
| HS97 | 17-FE102 | Opened head type, dark green outer leaves, adaptable in summer season |
| HS98 | 13-CAC14-19 | Yellow inner leaves, green outer leaves, half-closed head type, elongated shape |
| HS99 | 15-CDYB7-7 | Yellow inner leaves, green outer leaves, closed head type, adaptable in summer season |
| Accession ID | Year | Plant Death | Internal Rot | Calcium Deficiency | Boron Deficiency | Soft Rot Disease | Insect Invasion | Head Formation | Stress Weakness | Production Stability Score |
|---|---|---|---|---|---|---|---|---|---|---|
| Weighted | 0.2 | 0.1 | 0.2 | 0.1 | 0.1 | 0.1 | 0.2 | |||
| HS1 | 2022 | - | 0% | 79% | 0% | 0% | - | 100% | 47.9 | 52.1 |
| 2023 | 0% | - | 67% | 80% | 0% | 93% | 100% | |||
| Average | 0% | 0% | 73% | 40% | 0% | 93% | 100% | |||
| Sum | 0.0 | 0.0 | 14.6 | 4.0 | 0.0 | 9.3 | 20.0 | |||
| HS2 | 2022 | - | 100% | 100% | 11% | 0% | - | 100% | 53.6 | 46.4 |
| 2023 | 27% | - | 91% | 9% | 27% | 18% | 50% | |||
| Average | 27% | 100% | 95% | 10% | 14% | 18% | 75% | |||
| Sum | 5.4 | 10.0 | 19.0 | 1.0 | 1.4 | 1.8 | 15.0 | |||
| HS3 | 2022 | 0% | 53% | 47% | 0% | - | 100% | 48.3 | 51.7 | |
| 2023 | 20% | - | 33% | 100% | 17% | 75% | 100% | |||
| Average | 20% | 0% | 43% | 74% | 8% | 75% | 100% | |||
| Sum | 4.0 | 0.0 | 8.6 | 7.4 | 0.8 | 7.5 | 20.0 | |||
| HS4 | 2022 | - | 100% | 92% | 0% | 0% | - | 0% | 47.8 | 52.2 |
| 2023 | 33% | - | 70% | 60% | 40% | 50% | 50% | |||
| Average | 33% | 100% | 81% | 30% | 20% | 50% | 25% | |||
| Sum | 6.6 | 10.0 | 16.2 | 3.0 | 2.0 | 5.0 | 5.0 | |||
| HS5 | 2022 | - | 100% | 94% | 17% | 6% | - | 100% | 54.7 | 45.3 |
| 2023 | 7% | - | 100% | 31% | 8% | 8% | 100% | |||
| Average | 7% | 100% | 97% | 24% | 7% | 8% | 100% | |||
| Sum | 1.4 | 10.0 | 19.4 | 2.4 | 0.7 | 0.8 | 20.0 | |||
| HS6 | 2022 | - | 0% | 11% | 84% | 5% | - | 0% | 15.4 | 84.6 |
| 2023 | 13% | - | 23% | 46% | 8% | 23% | 0% | |||
| Average | 13% | 0% | 17% | 65% | 6% | 23% | 0% | |||
| Sum | 2.6 | 0.0 | 3.4 | 6.5 | 0.6 | 2.3 | 0.0 | |||
| HS7 | 2022 | - | 100% | 100% | 100% | 0% | - | 100% | 63.3 | 36.7 |
| 2023 | 0% | - | 100% | 87% | 0% | 40% | 100% | |||
| Average | 0% | 100% | 100% | 93% | 0% | 40% | 100% | |||
| Sum | 0.0 | 10.0 | 20.0 | 9.3 | 0.0 | 4.0 | 20.0 | |||
| HS8 | 2022 | - | 50% | 58% | 16% | 5% | - | 100% | 44.5 | 55.5 |
| 2023 | 0% | - | 67% | 53% | 0% | 33% | 100% | |||
| Average | 0% | 50% | 62% | 35% | 3% | 33% | 100% | |||
| Sum | 0.0 | 5.0 | 12.4 | 3.5 | 0.3 | 3.3 | 20.0 | |||
| HS9 | 2022 | - | 0% | 20% | 100% | 0% | - | 0% | 25.2 | 74.8 |
| 2023 | 7% | - | 86% | 29% | 7% | 14% | 50% | |||
| Average | 7% | 0% | 53% | 64% | 4% | 14% | 25% | |||
| Sum | 1.4 | 0.0 | 10.6 | 6.4 | 0.4 | 1.4 | 5.0 | |||
| HS10 | 2022 | - | 100% | 100% | 73% | 0% | - | 100% | 52.7 | 47.3 |
| 2023 | 7% | - | 71% | 50% | 0% | 29% | 50% | |||
| Average | 7% | 100% | 86% | 62% | 0% | 29% | 75% | |||
| Sum | 1.4 | 10.0 | 17.2 | 6.2 | 0.0 | 2.9 | 15.0 | |||
| HS11 | 2022 | - | 0% | 0% | 20% | 0% | - | 0% | 8.8 | 91.2 |
| 2023 | 0% | - | 53% | 33% | 0% | 7% | 0% | |||
| Average | 0% | 0% | 27% | 27% | 0% | 7% | 0% | |||
| Sum | 0.0 | 0.0 | 5.4 | 2.7 | 0.0 | 0.7 | 0.0 | |||
| HS12 | 2022 | - | 100% | 100% | 100% | 11% | - | 100% | 54.5 | 45.5 |
| 2023 | 0% | - | 60% | 20% | 0% | 20% | 100% | |||
| Average | 0% | 100% | 80% | 60% | 5% | 20% | 100% | |||
| Sum | 0.0 | 10.0 | 16.0 | 6.0 | 0.5 | 2.0 | 20.0 | |||
| HS13 | 2022 | - | 100% | 100% | 100% | 0% | - | 100% | 60.0 | 40.0 |
| 2023 | 0% | - | 100% | 73% | 0% | 13% | 100% | |||
| Average | 0% | 100% | 100% | 87% | 0% | 13% | 100% | |||
| Sum | 0.0 | 10.0 | 20.0 | 8.7 | 0.0 | 1.3 | 20.0 | |||
| HS14 | 2022 | - | 50% | 94% | 100% | 6% | - | 100% | 52.0 | 48.0 |
| 2023 | 0% | - | 100% | 7% | 0% | 20% | 100% | |||
| Average | 0% | 50% | 97% | 53% | 3% | 20% | 100% | |||
| Sum | 0.0 | 5.0 | 19.4 | 5.3 | 0.3 | 2.0 | 20.0 | |||
| HS15 | 2022 | - | 0% | 5% | 100% | 0% | - | 100% | 37.9 | 62.1 |
| 2023 | 0% | - | 0% | 100% | 0% | 73% | 100% | |||
| Average | 0% | 0% | 3% | 100% | 0% | 73% | 100% | |||
| Sum | 0.0 | 0.0 | 0.6 | 10.0 | 0.0 | 7.3 | 20.0 | |||
| HS16 | 2022 | - | 50% | 95% | 95% | 0% | - | 100% | 49.8 | 50.2 |
| 2023 | 0% | - | 60% | 53% | 0% | 20% | 100% | |||
| Average | 0% | 50% | 77% | 74% | 0% | 20% | 100% | |||
| Sum | 0.0 | 5.0 | 15.4 | 7.4 | 0.0 | 2.0 | 20.0 | |||
| HS17 | 2022 | - | 0% | 39% | 17% | 0% | - | 0% | 22.4 | 77.6 |
| 2023 | 7% | 36% | 71% | 7% | 0% | 7% | 0% | |||
| Average | 7% | 18% | 55% | 12% | 0% | 7% | 0% | |||
| Sum | 1.4 | 1.8 | 11.0 | 1.2 | 0.0 | 7.0 | 0.0 | |||
| HS18 | 2022 | - | 50% | 26% | 100% | 11% | - | 0% | 18.8 | 81.2 |
| 2023 | 7% | - | 14% | 7% | 7% | 21% | 0% | |||
| Average | 7% | 50% | 20% | 54% | 9% | 21% | 0% | |||
| Sum | 1.4 | 5.0 | 4.0 | 5.4 | 0.9 | 2.1 | 0.0 | |||
| HS19 | 2022 | - | 0% | 0% | 100% | 11% | - | 0% | 17.8 | 82.2 |
| 2023 | 13% | 0% | 15% | 85% | 0% | 38% | 0% | |||
| Average | 13% | 0% | 8% | 92% | 6% | 38% | 0% | |||
| Sum | 2.6 | 0.0 | 1.6 | 9.2 | 0.6 | 3.8 | 0.0 | |||
| HS20 | 2022 | - | 100% | 68% | 100% | 16% | - | 0% | 46.7 | 53.3 |
| 2023 | 33% | - | 70% | 100% | 10% | 50% | 0% | |||
| Average | 33% | 100% | 69% | 100% | 13% | 50% | 0% | |||
| Sum | 6.6 | 10.0 | 13.8 | 10.0 | 1.3 | 5.0 | 0.0 | |||
| HS21 | 2022 | 100% | - | - | - | 100% | - | 0% | 34.5 | 65.5 |
| 2023 | 40% | - | 22% | 22% | 22% | 78% | 0% | |||
| Average | 70% | - | 22% | 22% | 61% | 78% | 0% | |||
| Sum | 14.0 | - | 4.4 | 2.2 | 6.1 | 7.8 | 0.0 | |||
| HS22 | 2022 | - | 0% | 11% | 100% | 11% | - | 0% | 19.8 | 80.2 |
| 2023 | 7% | 14% | 36% | 57% | 7% | 43% | 0% | |||
| Average | 7% | 7% | 23% | 79% | 9% | 43% | 0% | |||
| Sum | 1.4 | 0.7 | 4.6 | 7.9 | 0.9 | 4.3 | 0.0 | |||
| HS23 | 2022 | - | 0% | 5% | 100% | 5% | - | 0% | 12.9 | |
| 2023 | 7% | 0% | 7% | 43% | 0% | 29% | 0% | |||
| Average | 7% | 0% | 6% | 71% | 3% | 29% | 0% | |||
| Sum | 1.4 | 0.0 | 1.2 | 7.1 | 0.3 | 2.9 | 0.0 | 87.1 | ||
| HS24 | 2022 | - | 0% | 0% | 0% | 0% | - | 100% | 25.7 | |
| 2023 | 0% | - | 13% | 20% | 0% | 33% | 100% | |||
| Average | 0% | 0% | 7% | 10% | 0% | 33% | 100% | |||
| Sum | 0.0 | 0.0 | 1.4 | 1.0 | 0.0 | 3.3 | 20.0 | 74.3 | ||
| HS25 | 2022 | - | 100% | 100% | 53% | 0% | - | 100% | 46.6 | 53.4 |
| 2023 | 0% | - | 100% | 0% | 0% | 40% | 0% | |||
| Average | 0% | 100% | 100% | 26% | 0% | 40% | 50% | |||
| Sum | 0.0 | 10.0 | 20.0 | 2.6 | 0.0 | 4.0 | 10.0 | |||
| HS26 | 2022 | - | 100% | 63% | 100% | 5% | - | 0% | 27.7 | 72.3 |
| 2023 | 0% | - | 40% | 13% | 0% | 13% | 0% | |||
| Average | 0% | 100% | 52% | 57% | 3% | 13% | 0% | |||
| Sum | 0.0 | 10.0 | 10.4 | 5.7 | 0.3 | 1.3 | 0.0 | |||
| HS27 | 2022 | - | 100% | 89% | 100% | 0% | - | 100% | 77.1 | 22.9 |
| 2023 | 33% | - | 100% | 100% | 50% | 90% | 100% | |||
| Average | 33% | 100% | 95% | 100% | 25% | 90% | 100% | |||
| Sum | 6.6 | 10.0 | 19.0 | 10.0 | 2.5 | 9.0 | 20.0 | |||
| HS28 | 2022 | - | 50% | 16% | 100% | 0% | - | 0% | 26.7 | 73.3 |
| 2023 | 20% | 17% | 75% | 92% | 0% | 8% | 0% | |||
| Average | 20% | 33% | 45% | 96% | 0% | 8% | 0% | |||
| Sum | 4.0 | 3.3 | 9.0 | 9.6 | 0.0 | 0.8 | 0.0 | |||
| HS29 | 2022 | - | 0% | 0% | 100% | 0% | - | 0% | 18.1 | 81.9 |
| 2023 | 0% | 13% | 53% | 100% | 0% | 20% | 0% | |||
| Average | 0% | 7% | 27% | 100% | 0% | 20% | 0% | |||
| Sum | 0.0 | 0.7 | 5.4 | 10.0 | 0.0 | 2.0 | 0.0 | |||
| HS30 | 2022 | - | 100% | 53% | 100% | 0% | - | 100% | 55.9 | 44.1 |
| 2023 | 0% | - | 100% | 60% | 0% | 27% | 100% | |||
| Average | 0% | 100% | 76% | 80% | 0% | 27% | 100% | |||
| Sum | 0.0 | 10.0 | 15.2 | 8.0 | 0.0 | 2.7 | 20.0 | |||
| HS31 | 2022 | - | 0% | 0% | 100% | 0% | - | 0% | 19.9 | 80.1 |
| 2023 | 7% | 43% | 100% | 0% | 0% | 14% | 0% | |||
| Average | 7% | 21% | 50% | 50% | 0% | 14% | 0% | |||
| Sum | 1.4 | 2.1 | 10.0 | 5.0 | 0.0 | 1.4 | 0.0 | |||
| HS32 | 2022 | - | 100% | 68% | 100% | 11% | - | 100% | 46.4 | 53.6 |
| 2023 | 0% | - | 53% | 60% | 0% | 7% | 50% | |||
| Average | 0% | 100% | 61% | 80% | 5% | 7% | 75% | |||
| Sum | 0.0 | 10.0 | 12.2 | 8.0 | 0.5 | 0.7 | 15.0 | |||
| HS33 | 2022 | - | 0% | 61% | 0% | 0% | - | 100% | 36.5 | 63.5 |
| 2023 | 7% | - | 43% | 0% | 7% | 43% | 100% | |||
| Average | 7% | 0% | 52% | 0% | 4% | 43% | 100% | |||
| Sum | 1.4 | 0.0 | 10.4 | 0.0 | 0.4 | 4.3 | 20.0 | |||
| HS34 | 2022 | - | 0% | 0% | 0% | 0% | - | 100% | 25.3 | 74.7 |
| 2023 | 0% | - | 0% | 0% | 0% | 53% | 100% | |||
| Average | 0% | 0% | 0% | 0% | 0% | 53% | 100% | |||
| Sum | 0.0 | 0.0 | 0.0 | 0.0 | 0.0 | 5.3 | 20.0 | |||
| HS35 | 2022 | - | 0% | 11% | 100% | 6% | - | 0% | 18.2 | 81.8 |
| 2023 | 7% | 0% | 14% | 100% | 7% | 36% | 0% | |||
| Average | 7% | 0% | 13% | 100% | 6% | 36% | 0% | |||
| Sum | 1.4 | 0.0 | 2.6 | 10.0 | 0.6 | 3.6 | 0.0 | |||
| HS36 | 2022 | - | 0% | 0% | 100% | 7% | - | 0% | 16.7 | 83.3 |
| 2023 | 7% | 0% | 0% | 100% | 0% | 50% | 0% | |||
| Average | 7% | 0% | 0% | 100% | 3% | 50% | 0% | |||
| Sum | 1.4 | 0.0 | 0.0 | 10.0 | 0.3 | 5.0 | 0.0 | |||
| HS37 | 2022 | - | 0% | 0% | 100% | 0% | - | 0% | 12.1 | 87.9 |
| 2023 | 7% | 0% | 0% | 86% | 0% | 14% | 0% | |||
| Average | 7% | 0% | 0% | 93% | 0% | 14% | 0% | |||
| Sum | 1.4 | 0.0 | 0.0 | 9.3 | 0.0 | 1.4 | 0.0 | |||
| HS38 | 2022 | - | 0% | 0% | 37% | 0% | - | 0% | 11.5 | 88.5 |
| 2023 | 8% | 8% | 25% | 8% | 8% | 42% | 0% | |||
| Average | 8% | 4% | 13% | 23% | 4% | 42% | 0% | |||
| Sum | 1.6 | 0.4 | 2.6 | 2.3 | 0.4 | 4.2 | 0.0 | |||
| HS39 | 2022 | - | 50% | 0% | 100% | 0% | - | 100% | 27.1 | 72.9 |
| 2023 | 7% | 0% | 36% | 43% | 7% | 21% | 0% | |||
| Average | 7% | 25% | 18% | 71% | 4% | 21% | 50% | |||
| Sum | 1.4 | 2.5 | 3.6 | 7.1 | 0.4 | 2.1 | 10.0 | |||
| HS40 | 2022 | - | - | - | - | - | - | - | 52.5 | 47.5 |
| 2023 | 13% | - | 100% | 46% | 15% | 38% | 100% | |||
| Average | 13% | - | 100% | 46% | 15% | 38% | 100% | |||
| Sum | 2.6 | - | 20.0 | 4.6 | 1.5 | 3.8 | 20.0 | |||
| HS41 | 2022 | - | 100% | 81% | 100% | 10% | - | 0% | 44.6 | 55.4 |
| 2023 | 33% | - | 60% | 100% | 50% | 10% | 0% | |||
| Average | 33% | 100% | 70% | 100% | 30% | 10% | 0% | |||
| Sum | 6.6 | 10.0 | 14.0 | 10.0 | 3.0 | 1.0 | 0.0 | |||
| HS42 | 2022 | - | - | - | - | - | - | - | 36.0 | 64.0 |
| 2023 | 0% | - | 20% | 33% | 0% | 87% | 100% | |||
| Average | 0% | - | 20% | 33% | 0% | 87% | 100% | |||
| Sum | 0.0 | - | 4.0 | 3.3 | 0.0 | 8.7 | 20.0 | |||
| HS43 | 2022 | - | - | - | - | - | - | - | 20.3 | 79.7 |
| 2023 | 13% | 0% | 23% | 85% | 15% | 31% | 0% | |||
| Average | 13% | 0% | 23% | 85% | 15% | 31% | 0% | |||
| Sum | 2.6 | 0.0 | 4.6 | 8.5 | 1.5 | 3.1 | 0.0 | |||
| HS44 | 2022 | - | - | - | - | - | - | - | 2.7 | 97.3 |
| 2023 | 0% | 0% | 0% | 0% | 0% | 27% | 0% | |||
| Average | 0% | 0% | 0% | 0% | 0% | 27% | 0% | |||
| Sum | 0.0 | 0.0 | 0.0 | 0.0 | 0.0 | 2.7 | 0.0 | |||
| HS45 | 2022 | - | - | - | - | - | - | - | 37.9 | 62.1 |
| 2023 | 0% | - | 73% | 0% | 0% | 33% | 100% | |||
| Average | 0% | - | 73% | 0% | 0% | 33% | 100% | |||
| Sum | 0.0 | - | 14.6 | 0.0 | 0.0 | 3.3 | 20.0 | |||
| HS46 | 2022 | - | - | - | - | - | - | - | 8.0 | 92.0 |
| 2023 | 0% | 0% | 13% | 47% | 0% | 7% | 0% | |||
| Average | 0% | 0% | 13% | 47% | 0% | 7% | 0% | |||
| Sum | 0.0 | 0.0 | 2.6 | 4.7 | 0.0 | 0.7 | 0.0 | |||
| HS47 | 2022 | - | - | - | - | - | - | - | 10.0 | 90.0 |
| 2023 | 0% | 0% | 40% | 0% | 0% | 20% | 0% | |||
| Average | 0% | 0% | 40% | 0% | 0% | 20% | 0% | |||
| Sum | 0.0 | 0.0 | 8.0 | 0.0 | 0.0 | 2.0 | 0.0 | |||
| HS48 | 2022 | - | - | - | - | - | - | - | 12.5 | 87.5 |
| 2023 | 0% | 0% | 31% | 50% | 0% | 13% | 0% | |||
| Average | 0% | 0% | 31% | 50% | 0% | 13% | 0% | |||
| Sum | 0.0 | 0.0 | 6.2 | 5.0 | 0.0 | 1.3 | 0.0 | |||
| HS49 | 2022 | - | - | - | - | - | - | - | 39.9 | 60.1 |
| 2023 | 27% | - | 100% | 0% | 36% | 9% | 50% | |||
| Data | No. of Barcode | No. of Sample | No. of Reads | Total Length (bp) | GC (%) *1 | Q30 (%) *2 | No. of Demultiplexed Reads (%) |
|---|---|---|---|---|---|---|---|
| Total | 96 | 52 | 856,098,684 | 129,270,901,284 | 46 | 93 | 650,426,476 (75.98%) |
| Chr 1 | Chr 2 | Chr 3 | Chr 4 | Chr 5 | Chr 6 | Chr 7 | Chr 8 | Chr 9 | Chr 10 | Total | Average | |
|---|---|---|---|---|---|---|---|---|---|---|---|---|
| SNP numbers | 20,638 | 17,907 | 27,626 | 13,490 | 21,408 | 21,487 | 18,280 | 14,753 | 29,555 | 15,111 | 200,255 | 20,026 |
| Chromosome size (Mb) | 32,850 | 29,510 | 35,350 | 22,750 | 35,020 | 38,650 | 28,860 | 26,880 | 52,890 | 17,990 | ||
| SNP density | 0.63 | 0.61 | 0.78 | 0.59 | 0.61 | 0.56 | 0.63 | 0.55 | 0.56 | 0.84 | 0.64 |
| Place | Field | Environmental Control Room | Field | Field | Field | Field | Field | ||
|---|---|---|---|---|---|---|---|---|---|
| Tolerance against Summer Season | Heat Tolerance of Root | Bolting Rate | Axillary Bud Rate | Calcium Deficiency Rate | Boron Deficiency Rate | Heading Rate | |||
| Plant ID | Data #1 | Data #2 | Data #1 | Data #2 | |||||
| HS 01 | 52.1 | 2 | −0.02 | 1.00 | 100.00 | 100.00 | 66.67 | 80.00 | 100 |
| HS 02 | 46.4 | 2 | 0.01 | 2.00 | 100.00 | 109.09 | 90.91 | 9.09 | 47 |
| HS 03 | 51.7 | 2 | 0.08 | 4.00 | 0.00 | 116.67 | 33.33 | 116.67 | 100 |
| HS 04 | 52.2 | 2 | −0.12 | 1.00 | 0.00 | 150.00 | 70.00 | 60.00 | 26 |
| HS 05 | 45.3 | 1 | 0.04 | 3.00 | 0.00 | 115.38 | 100.00 | 30.77 | 47 |
| HS 06 | 84.6 | 5 | −0.06 | 1.00 | 0.00 | 23.08 | 23.08 | 46.15 | 24 |
| HS 07 | 36.7 | 1 | 0.10 | 5.00 | 0.00 | 100.00 | 100.00 | 86.67 | 47 |
| HS 08 | 55.5 | 3 | −0.02 | 1.00 | 0.00 | 80.00 | 66.67 | 53.33 | 14 |
| HS 09 | 74.8 | 4 | 0.12 | 5.00 | 0.00 | 107.14 | 85.71 | 28.57 | 40 |
| HS 10 | 47.3 | 2 | 0.02 | 2.00 | 0.00 | 35.71 | 71.43 | 50.00 | 40 |
| HS 11 | 91.2 | 6 | 0.03 | 3.00 | 100.00 | 0.00 | 53.33 | 33.33 | 40 |
| HS 12 | 45.5 | 1 | 0.10 | 5.00 | 0.00 | 73.33 | 60.00 | 20.00 | 61 |
| HS 13 | 40 | 1 | 0.07 | 4.00 | 100.00 | 0.00 | 100.00 | 73.33 | 61 |
| HS 14 | 48 | 2 | 0.18 | 6.00 | 0.00 | 86.67 | 100.00 | 6.67 | 100 |
| HS 15 | 62.1 | 3 | 0.04 | 3.00 | 0.00 | 100.00 | 0.00 | 100.00 | 100 |
| HS 16 | 50.2 | 2 | 0.06 | 3.00 | 0.00 | 13.33 | 60.00 | 53.33 | 100 |
| HS 17 | 77.6 | 5 | 0.02 | 2.00 | 0.00 | 28.57 | 71.43 | 7.14 | 33 |
| HS 18 | 81.2 | 5 | 0.03 | 2.00 | 0.00 | 100.00 | 14.29 | 7.14 | 27 |
| HS 41 | 82.2 | 5 | 0.09 | 4.00 | 0.00 | 100.00 | 15.38 | 84.62 | 33 |
| HS 42 | 53.3 | 2 | 0.10 | 5.00 | 0.00 | 120.00 | 70.00 | 150.00 | 33 |
| HS 43 | 65.5 | 3 | 0.19 | 6.00 | 0.00 | 0.00 | 22.22 | 22.22 | 27 |
| HS 44 | 80.2 | 5 | 0.09 | 4.00 | 0.00 | 107.14 | 35.71 | 57.14 | 27 |
| HS 45 | 87.1 | 6 | 0.16 | 6.00 | 0.00 | 64.29 | 7.14 | 42.86 | 27 |
| HS 48 | 74.3 | 4 | 0.07 | 4.00 | 0.00 | 100.00 | 13.33 | 20.00 | 100 |
| HS 49 | 53.4 | 2 | 0.03 | 3.00 | 0.00 | 93.33 | 100.00 | 0.00 | 40 |
| HS 50 | 72.3 | 4 | 0.13 | 6.00 | 0.00 | 0.00 | 40.00 | 13.33 | 33 |
| HS 51 | 22.9 | 1 | 0.20 | 6.00 | 50.00 | 20.00 | 130.00 | 150.00 | 40 |
| HS 52 | 73.3 | 4 | 0.09 | 5.00 | 0.00 | 125.00 | 75.00 | 91.67 | 40 |
| HS 53 | 81.9 | 5 | 0.10 | 5.00 | 0.00 | 100.00 | 53.33 | 100.00 | 33 |
| HS 54 | 44.1 | 1 | 0.06 | 3.00 | 46.67 | 40.00 | 100.00 | 60.00 | 61 |
| HS 55 | 80.1 | 5 | 0.09 | 4.00 | 0.00 | 107.14 | 42.86 | 107.14 | 27 |
| HS 56 | 53.6 | 2 | 0.00 | 2.00 | 0.00 | 40.00 | 53.33 | 60.00 | 40 |
| HS 57 | 63.5 | 3 | 0.10 | 5.00 | 0.00 | 92.86 | 42.86 | 0.00 | 61 |
| HS 58 | 74.7 | 4 | 0.16 | 6.00 | 0.00 | 100.00 | 0.00 | 0.00 | 100 |
| HS 59 | 81.8 | 5 | 0.00 | 1.00 | 0.00 | 85.71 | 14.29 | 107.14 | 27 |
| HS 60 | 83.3 | 5 | 0.05 | 3.00 | 0.00 | 92.86 | 0.00 | 100.00 | 27 |
| HS 61 | 87.9 | 6 | 0.04 | 3.00 | 0.00 | 107.14 | 0.00 | 85.71 | 27 |
| HS 62 | 88.5 | 6 | 0.12 | 5.00 | 0.00 | 0.00 | 25.00 | 8.33 | 40 |
| HS 64 | 72.9 | 4 | 0.09 | 5.00 | 0.00 | 85.71 | 35.71 | 42.86 | 40 |
| HS 68 | 47.5 | 2 | 0.03 | 2.00 | 0.00 | 100.00 | 100.00 | 46.15 | 40 |
| HS 69 | 55.4 | 3 | 0.00 | 1.00 | 0.00 | 150.00 | 60.00 | 150.00 | 100 |
| HS 70 | 64 | 3 | 0.12 | 5.00 | 0.00 | 46.67 | 20.00 | 33.33 | 100 |
| HS 83 | 79.7 | 5 | 0.02 | 2.00 | 0.00 | 115.38 | 23.08 | 84.62 | 27 |
| HS 85 | 97.3 | 6 | 0.08 | 4.00 | 0.00 | 0.00 | 0.00 | 0.00 | 40 |
| HS 88 | 62.1 | 3 | 0.06 | 3.00 | 40.00 | 0.00 | 73.33 | 0.00 | 100 |
| HS 92 | 92 | 6 | 0.00 | 1.00 | 0.00 | 33.33 | 13.33 | 46.67 | 27 |
| HS 93 | 90 | 6 | 0.05 | 3.00 | 0.00 | 0.00 | 40.00 | 0.00 | 40 |
| HS 94 | 87.5 | 6 | 0.11 | 5.00 | 0.00 | 93.75 | 31.25 | 50.00 | 100 |
| HS 96 | 60.1 | 3 | 0.06 | 4.00 | 0.00 | 0.00 | 100.00 | 0.00 | 40 |
| HS 97 | 70 | 4 | 0.01 | 2.00 | 0.00 | 13.33 | 40.00 | 20.00 | 100 |
| HS 98 | 87.7 | 6 | 0.05 | 3.00 | 16.67 | 91.67 | 25.00 | 0.00 | 27 |
| HS 99 | 49.7 | 2 | 0.12 | 5.00 | 0.00 | 8.70 | 100.00 | 8.70 | 100 |
| Trait | SNP | Chromosome | Position | p-Value | Maf | Nobs | Effect | Phenotype_Variance_Explained (%) |
|---|---|---|---|---|---|---|---|---|
| Bolting | SA02_32779781 | 2 | 32,779,781 | 6.32 × 10⁻¹³ | 0.14 | 50 | −6.73902 | 1.567524925 |
| SA02_36125892 | 2 | 36,125,892 | 8.35 × 10⁻¹⁴ | 0.04 | 50 | −39.5783 | 55.43468979 | |
| SA05_1527161 | 5 | 1,527,161 | 1.12 × 10−08 | 0.07 | 36 | NA | 5.23 × 10−09 | |
| SA05_1928956 | 5 | 1,928,956 | 1.33 × 10−09 | 0.13 | 50 | −17.9368 | 11.01177681 | |
| SA05_40364503 | 5 | 40,364,503 | 1.64 × 10⁻¹¹ | 0.29 | 50 | −5.40308 | 1.789144987 | |
| SA05_40519151 | 5 | 40,519,151 | 7.83 × 10−08 | 0.02 | 36 | 0.014316435 | ||
| SA06_38680523 | 6 | 38,680,523 | 2.14 × 10⁻¹¹ | 0.02 | 50 | 58.74881 | 30.46097055 | |
| SA06_46190907 | 6 | 46,190,907 | 7.83 × 10−08 | 0.02 | 36 | NA | 0.000205104 | |
| SA09_8067736 | 9 | 8,067,736 | 3.13 × 10⁻²³ | 0.17 | 50 | −15.5337 | 10.01210093 | |
| SA09_8404885 | 9 | 8,404,885 | 9.86 × 10−08 | 0.06 | 36 | 5.40 × 10−05 | ||
| SA09_56761182 | 9 | 56,761,182 | 7.83 × 10−08 | 0.02 | 36 | 1.87 × 10−05 | ||
| SA09_58874214 | 9 | 58,874,214 | 7.05 × 10⁻¹⁶ | 0.39 | 50 | −6.19219 | 2.085168086 | |
| Heat | SA09_55392231 | 9 | 55,392,231 | 1.39 × 10⁻²⁹ | 0.39 | 50 | −11.6034 | 34.43961 |
| SA09_55392192 | 9 | 55,392,192 | 1.47 × 10−09 | 0.43 | 36 | 0 | ||
| SA10_28010298 | 10 | 28,010,298 | 2.18 × 10⁻²² | 0.49 | 50 | −5.2023 | 6.185935 | |
| SA10_29194037 | 10 | 29,194,037 | 2.71 × 10⁻¹³ | 0.29 | 50 | 0.42079 | 5.04724 | |
| SA09_7986935 | 9 | 7,986,935 | 5.57 × 10−09 | 0.15 | 50 | 0.374991 | 5.990016 | |
| SA09_8108971 | 9 | 8,108,971 | 4.51 × 10−08 | 0.31 | 36 | 1.70 × 10⁻¹¹ | ||
| Boron | SA08_28311462 | 8 | 28,311,462 | 2.17 × 10−07 | 0.16 | 36 | 0.115844 | |
| SA08_15162711 | 8 | 15,162,711 | 3.88 × 10⁻²⁴ | 0.17 | 50 | 35.2342 | 13.48117 |
| Trait | Chr | Position | Searching Range (kb) | Candidate Gene | Reference Referring Gene Function |
|---|---|---|---|---|---|
| Summer tolerance | Chr2 | 33,894,746 | 200 | 3-ketoacyl-CoA synthase 21 | [24] |
| Ch9 | 7,986,935 | 200 | F-box/kelch-repeat protein like | [25] | |
| 200 | tyrosine decarboxylase 1 | [26] | |||
| 200 | phospholipase A2-beta | [27,28] | |||
| Ch10 | 28,010,298 | 200 | SWI/SNF-related matrix-associated actin-dependent regulator | [29] | |
| 200 | laccase-12 | [30] | |||
| 200 | expansin-A2 | [31] | |||
| 200 | transcription factor MYBC1-like | [32] | |||
| 200 | DEAD-box ATP-dependent RNA helicase 18 | [33,34] | |||
| Ch10 | 29,194,037 | 200 | dnaJ homolog subfamily B | [35] | |
| 200 | R3H domain-containing protein 2 | [36] | |||
| 200 | transcription factor bHLH143 | [37,38] | |||
| 200 | E3 ubiquitin-protein ligase ARI16 | [39] | |||
| 200 | VQ motif-containing protein 31 | [40] | |||
| Bolting | A02 | 36,125,892 | 200 | zinc transporter 12 | [41,42] |
| 200 | ethylene-responsive transcription factor ERF114 | [43] | |||
| A05 | 1,928,956 | 200 | transcription factor JUNGBRUNNEN 1 | [44] | |
| 200 | pentatricopeptide repeat-containing protein | [45,46] | |||
| 200 | defensin-like protein 2 | [47] | |||
| 40,364,503 | 200 | B3 domain-containing protein REM7-like | [48] | ||
| 200 | LOB domain-containing protein 22 | [49] | |||
| 200 | AAA-ATPase | [50,51] | |||
| A09 | 8,067,736 | 200 | tyrosine decarboxylase 1 | [52] | |
| 200 | ABC transporter C family member 5 | [53] | |||
| 58,874,214 | 200 | F-box protein | [54] | ||
| 200 | glycosyltransferase family 92 protein | [55,56] | |||
| 200 | serine/arginine-rich splicing factor RSZ21-like | [57,58] | |||
| Boron deficiency | A03 | 5,577,165 | 200 | Brassica rapa GATA transcription factor 21 | [59,60] |
| 200 | auxin efflux carrier component 2 | [61,62,63] | |||
| 200 | transcription factor bHLH35-like | [37,38] | |||
| 200 | cytochrome P450 | [64] | |||
| 200 | VQ motif-containing protein 10 | [40] |
Disclaimer/Publisher’s Note: The statements, opinions and data contained in all publications are solely those of the individual author(s) and contributor(s) and not of MDPI and/or the editor(s). MDPI and/or the editor(s) disclaim responsibility for any injury to people or property resulting from any ideas, methods, instructions or products referred to in the content. |
© 2024 by the authors. Licensee MDPI, Basel, Switzerland. This article is an open access article distributed under the terms and conditions of the Creative Commons Attribution (CC BY) license (https://creativecommons.org/licenses/by/4.0/).
Share and Cite
Kim, J.; Lee, J.; Jang, Y.; Lee, S.; Lee, W.-M.; Wi, S.; Lee, H.; Seo, T.C.; Kim, T.; Yoon, H.I. Elucidating Genetic Mechanisms of Summer Stress Tolerance in Chinese Cabbage through GWAS and Phenotypic Analysis. Agronomy 2024, 14, 1960. https://doi.org/10.3390/agronomy14091960
Kim J, Lee J, Jang Y, Lee S, Lee W-M, Wi S, Lee H, Seo TC, Kim T, Yoon HI. Elucidating Genetic Mechanisms of Summer Stress Tolerance in Chinese Cabbage through GWAS and Phenotypic Analysis. Agronomy. 2024; 14(9):1960. https://doi.org/10.3390/agronomy14091960
Chicago/Turabian StyleKim, Jinhee, Junho Lee, Yoonah Jang, Sangdeok Lee, Woo-Moon Lee, Seunghwan Wi, Hyejin Lee, Tae Cheol Seo, Taebok Kim, and Hyo In Yoon. 2024. "Elucidating Genetic Mechanisms of Summer Stress Tolerance in Chinese Cabbage through GWAS and Phenotypic Analysis" Agronomy 14, no. 9: 1960. https://doi.org/10.3390/agronomy14091960
APA StyleKim, J., Lee, J., Jang, Y., Lee, S., Lee, W.-M., Wi, S., Lee, H., Seo, T. C., Kim, T., & Yoon, H. I. (2024). Elucidating Genetic Mechanisms of Summer Stress Tolerance in Chinese Cabbage through GWAS and Phenotypic Analysis. Agronomy, 14(9), 1960. https://doi.org/10.3390/agronomy14091960