Article

Productive Performance of Biomass Sorghum (Sorghum bicolor (L.) Moench) and Cowpea (Vigna unguiculata (L.) Walp) Cultivars in Different Cropping Systems and Planting Times

by
Layana Alves do Nascimento
1,
Welson Lima Simões
2,
Anderson Ramos de Oliveira
2,
Alessandra Monteiro Salviano
2,
Juliane Rafaele Alves Barros
3,
Weslley Oliveira da Silva
1,
Kaio Vinicius Fernandes Barbosa
1,
Italla Mikaelly Barbosa
4 and
Francislene Angelotti
2,*
1
Campus Petrolina, University of Pernambuco, Petrolina 56328-900, Pernambuco, Brazil
2
Embrapa Semi-arid, Petrolina 56302-970, Pernambuco, Brazil
3
Foundation for the Support of Science and Technology of the State of Pernambuco (FACEPE), Recife 50720-001, Pernambuco, Brazil
4
Federal Institute of Sertão Pernambucano, Campus Petrolina, Petrolina 56302-970, Pernambuco, Brazil
*
Author to whom correspondence should be addressed.
Agronomy 2024, 14(9), 1970; https://doi.org/10.3390/agronomy14091970 (registering DOI)
Submission received: 10 July 2024 / Revised: 10 August 2024 / Accepted: 19 August 2024 / Published: 31 August 2024
(This article belongs to the Section Innovative Cropping Systems)

Abstract

:
Global projections indicate that the demand for fresh water, energy, and food will increase significantly in the coming decades under the pressure of population growth, economic development, climate change, and other factors. Faced with this, technologies that promote sustainable development through the use of clean energy will be imperative. That way, this study aimed at evaluating the productive performance of biomass sorghum and cowpea cultivars in different cropping systems and planting seasons. The experiment was conducted at the Caatinga Experimental Field at Embrapa Semiarid, Petrolina—PE. Four cowpea (BRS Itaim, BRS Gurguéia, BRS Guariba, and BRS Carijó) and two biomass sorghum cultivars (BRS 716 and AGRI-002E) were used in intercropping and monoculture systems. The cultivars were sown during two different seasons: June (season 1—winter) and December (season 2—summer) of 2021. The biometric and productive parameters and land equivalent ratios (LERs) of sorghum and cowpea were evaluated. The data were subjected to multivariate analysis. The productive performance of biomass sorghum cultivars Agri-002E and BRS 716 was higher when planted in December, with an increase of 37% due to the planting season. Cowpea productivity was not influenced by sowing seasons or the cultivation system. Based on the calculation of efficient land use, the intercropping between biomass sorghum cultivar BRS 716 and cowpea cultivars BRS Gurguéia, BRS Guariba, and BRS Carijó was advantageous when compared to monocultures planted in the hottest season. This study showed the importance of cultivar selection, the planting time, and land use efficiency in intercropping systems.

1. Introduction

Climate change represents an alert as the increase in temperature and changes in the pattern of precipitation directly impact agricultural production [1]. In this sense, the implementation of climate-smart agriculture tools, with more efficient and cleaner forms of energy, and optimization of land use with integrated production systems such as crop rotation and intercropping, among others, will be imperative to face climate change [2,3]. These technologies stand out as adaptation measures that can contribute to carbon sequestration [2].
Monocultures are characterized by the oversimplification of the cultivation system, compromising natural renewal and the maintenance of soil fertility. Thus, systems such as monoculture have less plasticity, ecological imbalances, and the need for external intervention for adequate production levels. As a result, monoculture can contribute to the emission of greenhouse gases due to the emissions associated with energy consumption, irrigation, agricultural operations, and the use of fertilizers [4,5]. To achieve sustainability, intercropping interspersing plants that can be used for human consumption with plants used as biomass presents itself as a strategy to ensure food and energy security [6], notably in more vulnerable regions such as the Brazilian semi-arid region. Thus, biomass sorghum [Sorghum bicolor (L.) Moench] stands out as a promising alternative for energy generation and replacing the use of firewood from the Caatinga [7].
Sorghum has a high biomass production and can reach 6.0 m in height, with green mass production ranging from 120 to 150 t ha−1 and a cycle of 180 days, on average, showing potential for burning in boilers of large power plants or thermoelectric plants [8]. Cowpea (Vigna unguiculata L.) can be grown intercropped with sorghum, with strategic importance due to its socioeconomic value for the northeast of Brazil. Moreover, it is a basic food component of the population and source of protein and carbohydrates, being considered a key crop in terms of food security [9].
The intercropping of sorghum with cowpea has been achieved in semiarid regions, indicating advantages in yield and efficiency in the use of natural resources, with improvements in soil quality, a lower incidence of pests and diseases, and economic gains [10,11]. However, the planting season and the cultivar used can impact the productive potential of the intercropping [12,13]. There is no record of work on which sorghum and cowpea cultivars are most suitable for an intercropping system and on their performance at different planting times in a semi-arid environment. The sorghum and cowpea cultivars used in this work were selected from studies of cultivars tolerant to high temperatures as a relevant alternative for greater productive stability, reducing the risk of agricultural losses resulting from climate uncertainties [14,15].
Therefore, this study aimed to evaluate the productive performance of biomass sorghum and cowpea cultivars in different cropping systems and sowing seasons.

2. Materials and Methods

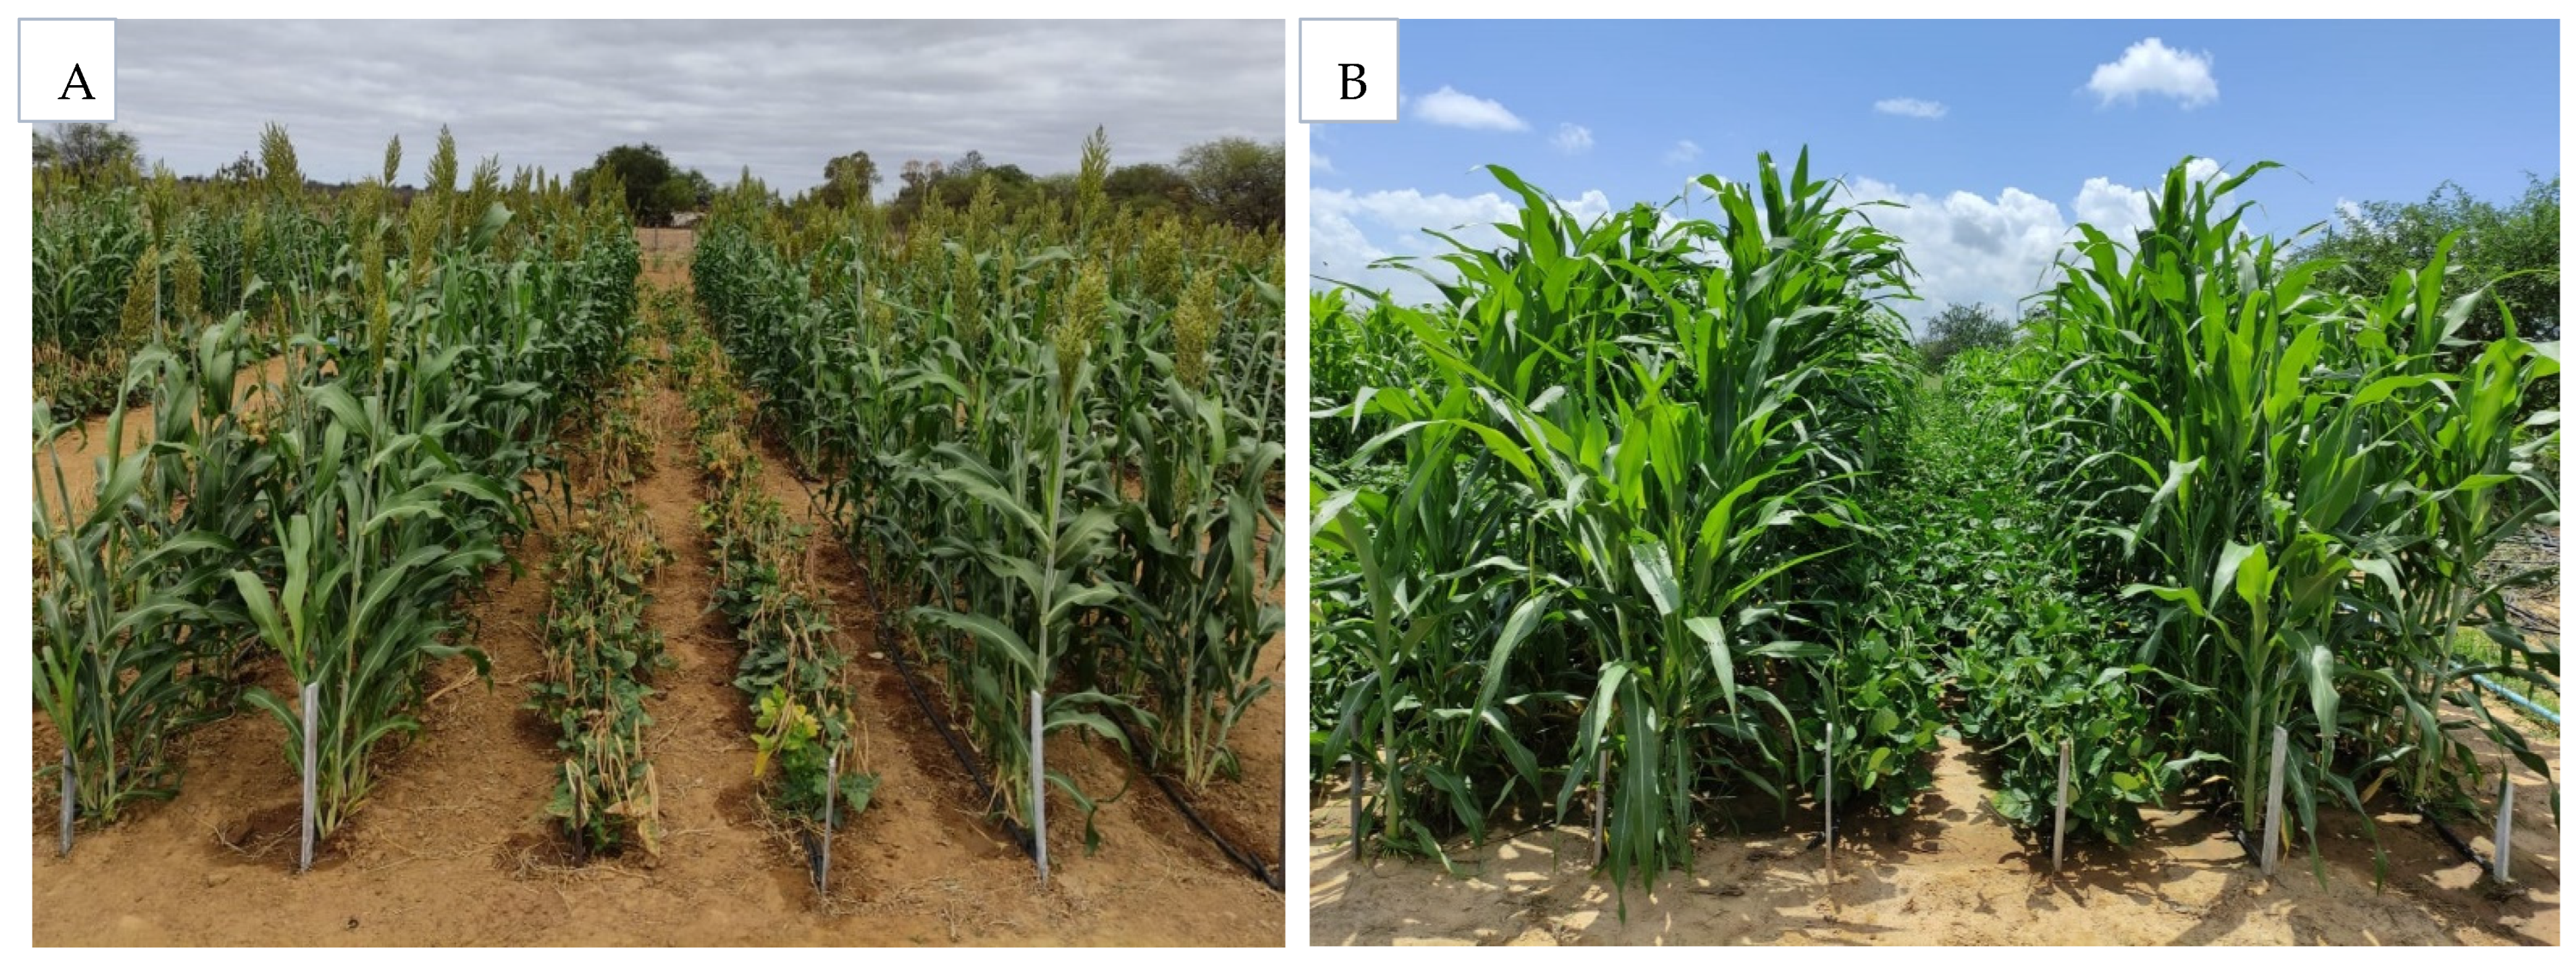
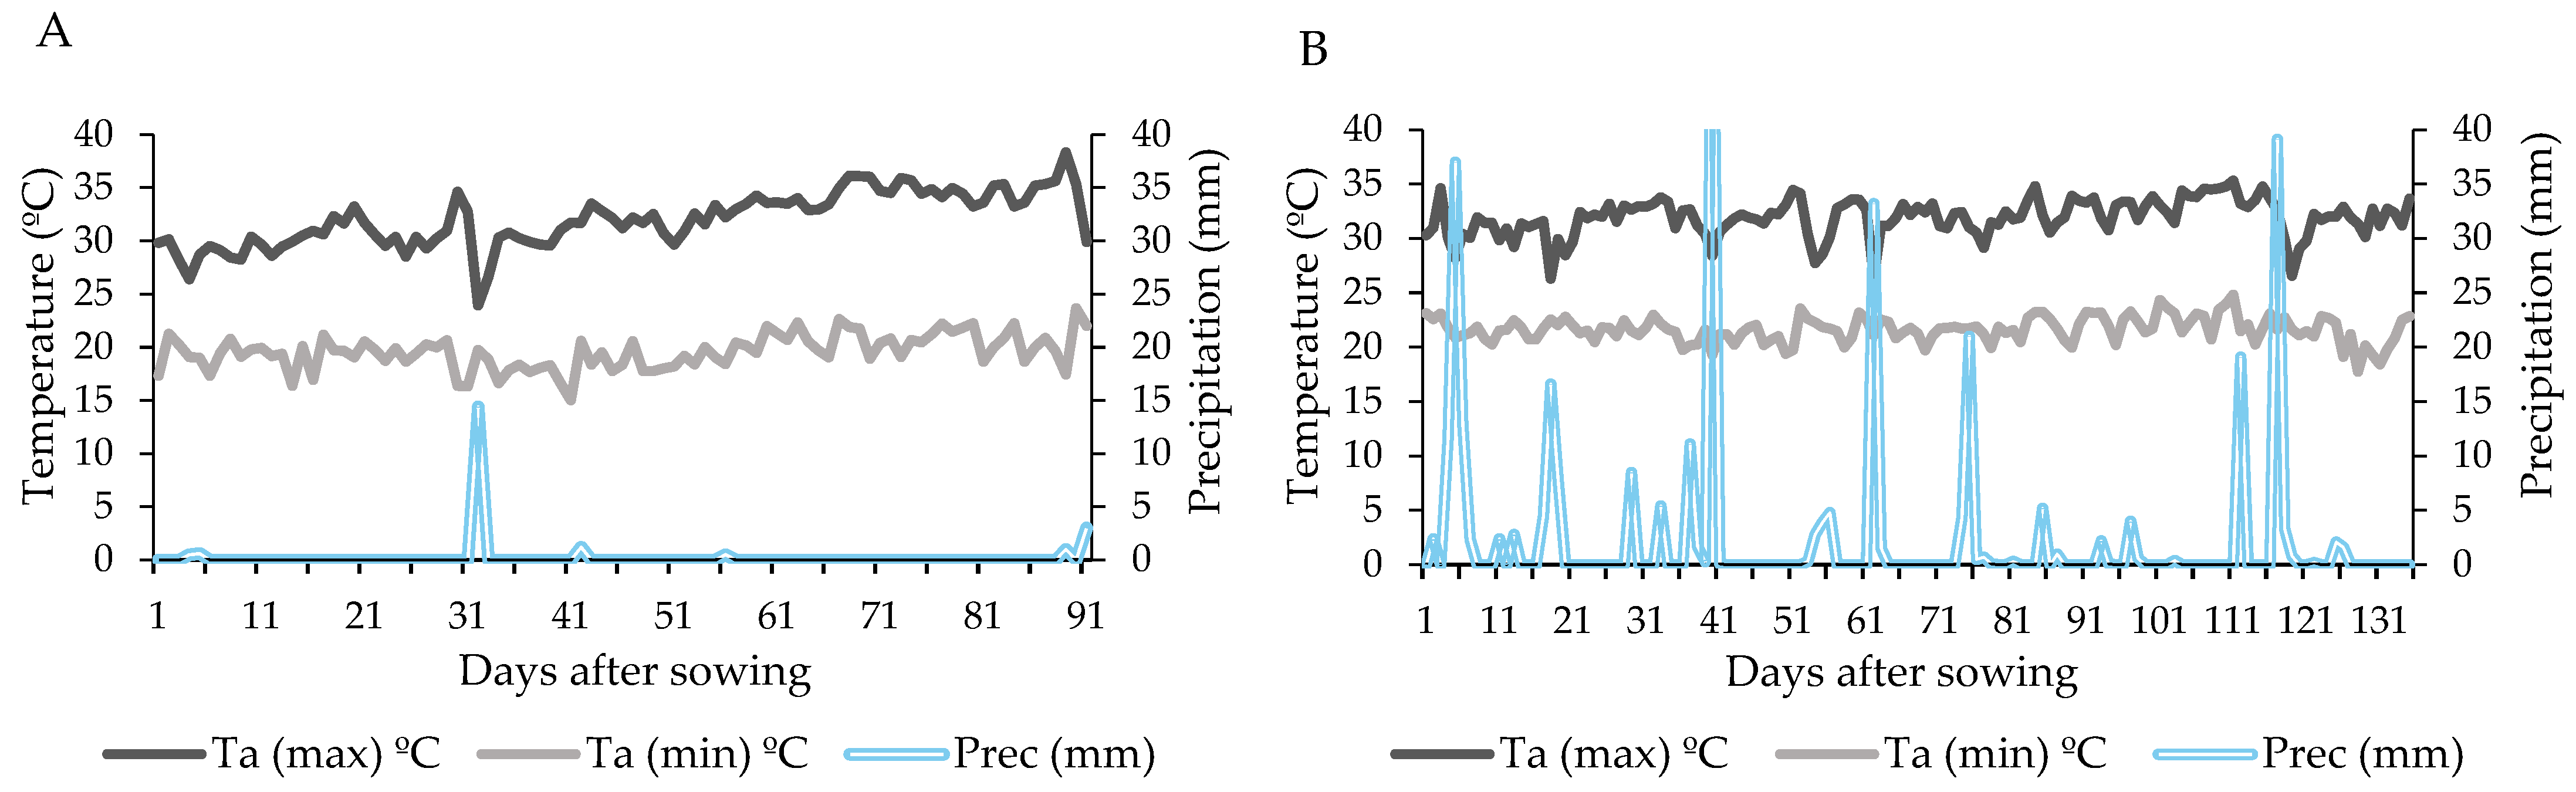
2.1. Experiment Location

The experiment was conducted in the city of Petrolina, Pernambuco (PE), Brazil in the sub-medium region of the São Francisco Valley (latitude 9°8′8.9″ S, longitude 40°18′33.6″ altitude 373 m), with average annual precipitation of 400 mm, average relative humidity of 67.8%, and average air temperature of 26.5 °C (Figure 1). The regional climate is classified as semi-arid (BSh) according to the Köppen classification. The soil in the experimental area is classified as a medium-textured Red–Yellow Argisol [16] corresponding to Haplic Acrisol (IUSS Working Group WRB, 2022), with flat relief.
Figure 2 shows the climate data during the experimental period, obtained by an automatic meteorological monitoring station located at the Brazilian Agricultural Research Corporation (Embrapa) (Brasília, Brazil) Semi-Arid (Figure 2).

2.2. Experimental Design

The experimental design used comprised randomized blocks with three replications. The treatments consisted of associations between four cowpea cultivars (BRS Itaim, BRS Gurguéia, BRS Guariba, and BRS Carijó) and two biomass sorghum cultivars (BRS 716 and Agri-002E) grown in monoculture and intercropped with each other, totaling 14 treatments (Table 1).
The choices for cowpea and sorghum biomass cultivars were based on the indication of cultivars tolerant to high temperatures [14,15]. The experiment was set up during two different sowing seasons (June and December 2021) wherein season 1 (June) corresponds to the beginning of winter in the Southern Hemisphere and season 2 (December) the beginning of summer. Planting at two different periods allows the identification of cultivars tolerant to increased temperature and the recommendation of the best planting time.
The plots of intercropped treatments consisted of eight rows of 3.0 m in length and with 0.70 m between rows, with a total area of 16.80 m2 (3.0 m × 5.6 m). The treatments were interspersed within the plots so that two rows of sorghum were sown for every two rows of cowpea.
The cowpea plots in the monoculture treatments consisted of three 3.0 m long rows with a total area of 6.20 m2 (3.0 m × 2.1 m) while sorghum plots had a total area of 16.80 m2 (3.0 m × 5.6 m). The total area of the experiment was 1016 m2.

2.3. Crop Implementation and Management

The preparation of the area was completed through harrowing and was based on the results of the soil analysis (Table 2). The sorghum received sowing fertilization, according to the recommendations of [17], using 28 kg ha−1 of N, 98 kg ha−1 of P2O5, and 56 kg ha−1 of K2O, and in top-dressing, 110 and 50 kg ha−1 of N were applied 20 and 30 days after sowing, respectively. For the cowpea, 30 kg ha−1 of N, 60 kg ha−1 of P2O5, and 10 kg ha−1 of K2O were applied to the sowing according to the recommendations of [18].
The cultivars were sown manually on 30 June 2021 for season 1 and on 21 December 2021, for season 2. Fourteen seeds were sown per linear meter of both crops. Thinning was performed 15 days after sowing, leaving seven plants per linear meter. Irrigation was performed by dripping, with a spacing of 30 cm between drippers, and managed according to the water demand of each crop.
Biometric and productivity analyses of fresh and dry sorghum biomass were performed using two linear meters in the central area of each plot, with a dimension of 4 m2, to avoid the border effect. Sorghum was harvested when 50% or more of the grains were at the hard dough stage while cowpea was harvested when the pods were dry [19,20].

2.4. Agronomic Characteristics Evaluated

The following biometric and productivity variables were evaluated for sorghum: plant height (m)—measured from the ground to the insertion of the last open leaf using a graduated measuring tape; stem diameter (mm)—two measurements were taken between the second and third internodes using a digital caliper, which generated an average, whose value was used in the analyses; number of leaves—obtained by simple counting of expanded leaves; and fresh shoot biomass—the plant was cut close to the soil using pruning shears and separated into three components (leaves, stem, and panicle) to determine the fresh biomass (kg) using an analytical balance. The dry biomass was determined by placing the samples in a forced-air-circulation oven at a temperature of 60 °C until reaching a constant weight (±72 h), followed by weighing on an analytical balance.
The following variables were evaluated for cowpea: total number of pods per plant (simple counting), pod length (cm) (using a graduated ruler), pod diameter (mm) (using a caliper), number of grains (simple counting), average pod mass (g) (on an analytical balance), and average grain mass (g) (on an analytical balance).

2.5. Statistical Analysis

The variables were analyzed to verify whether the data presented normality, using the Shapiro–Wilk test (p < 0.05), and homoscedasticity of variances, using the Levene test (p < 0.05), and to identify outliers and the Pearson’s correlation matrix (p < 0.05), which, according to [21,22,23], are assumptions for conducting principal component analysis (PCA). Hypotheses of data normality were verified using the Shapiro–Wilk test (p < 0.05).
The correlation coefficient is a dimensionless value ranging from −1 to 1, with a value equal to zero representing the lack of a linear relationship between the variables. These coefficients allow for the classification of the correlations as null (r = 0), weak (0 < r < 0.3), medium (0.30 < r < 0.60), strong (0.60 < r < 0.90), very strong (0.90 < r < 1), and perfect (r = 1) [24]. In addition, they can be considered as indicating direct relationship when positive and as indicating an inverse relationship when there is a trend for one characteristic to increase while there is a reduction in the other, represented by negative coefficients. The data were standardized with mean of zero and variance of 1 to reduce errors due to scales and units of variables.
The standardized data were subjected to principal component analysis (PCA) and cluster analysis (CA). The cluster analysis followed the hierarchical method, using the Euclidean distance as a measure of similarity between the records and Ward’s method as a clustering strategy. Next, the Fenon Line was drawn horizontally to determine the number of formed groups. Statistical analyses of the data were performed using the statistical software Statistica 14.0.0.15. Multivariate analysis was performed with the F-test, comparing the formed groups in the cluster according to their characteristics.

2.6. Land Equivalent Ratio (LER)

Finally, the Land Equivalent Ratio (LER) index, which represents the relative cultivated area in monoculture required to provide the yields achieved in intercropping, was calculated. The LER of cropping systems was calculated using the formula LER = (Yab/Yaa) + (Yba/Ybb), in which a represents the main crop and b is the secondary crop while the values of Yab and Yaa correspond to the yields of the main crop in the intercropping and monoculture, respectively. Meanwhile, Yba and Ybb correspond to the productivity of the secondary crop in the intercropping and monoculture systems, respectively. Thus, LER > 1 means an advantage of intercropping relative to monoculture. However, LER = 1 shows no productive advantage and LER < 1 represents a disadvantage when intercropping [25].

3. Results

The sorghum and cowpea cycles lasted 90 and 79 days, respectively, for the sowing on 30 June 2021. For sowing on 21 December 2021, the sorghum and cowpea cycles lasted 135 and 77 days, respectively. The temperature varied between 15.04 and 38.33 °C and 17.75 and 35.33 °C for the first and second sowing seasons, respectively. Accumulated precipitation values were 21.20 mm and 340.90 mm for the first and second sowing seasons, respectively (Figure 2).

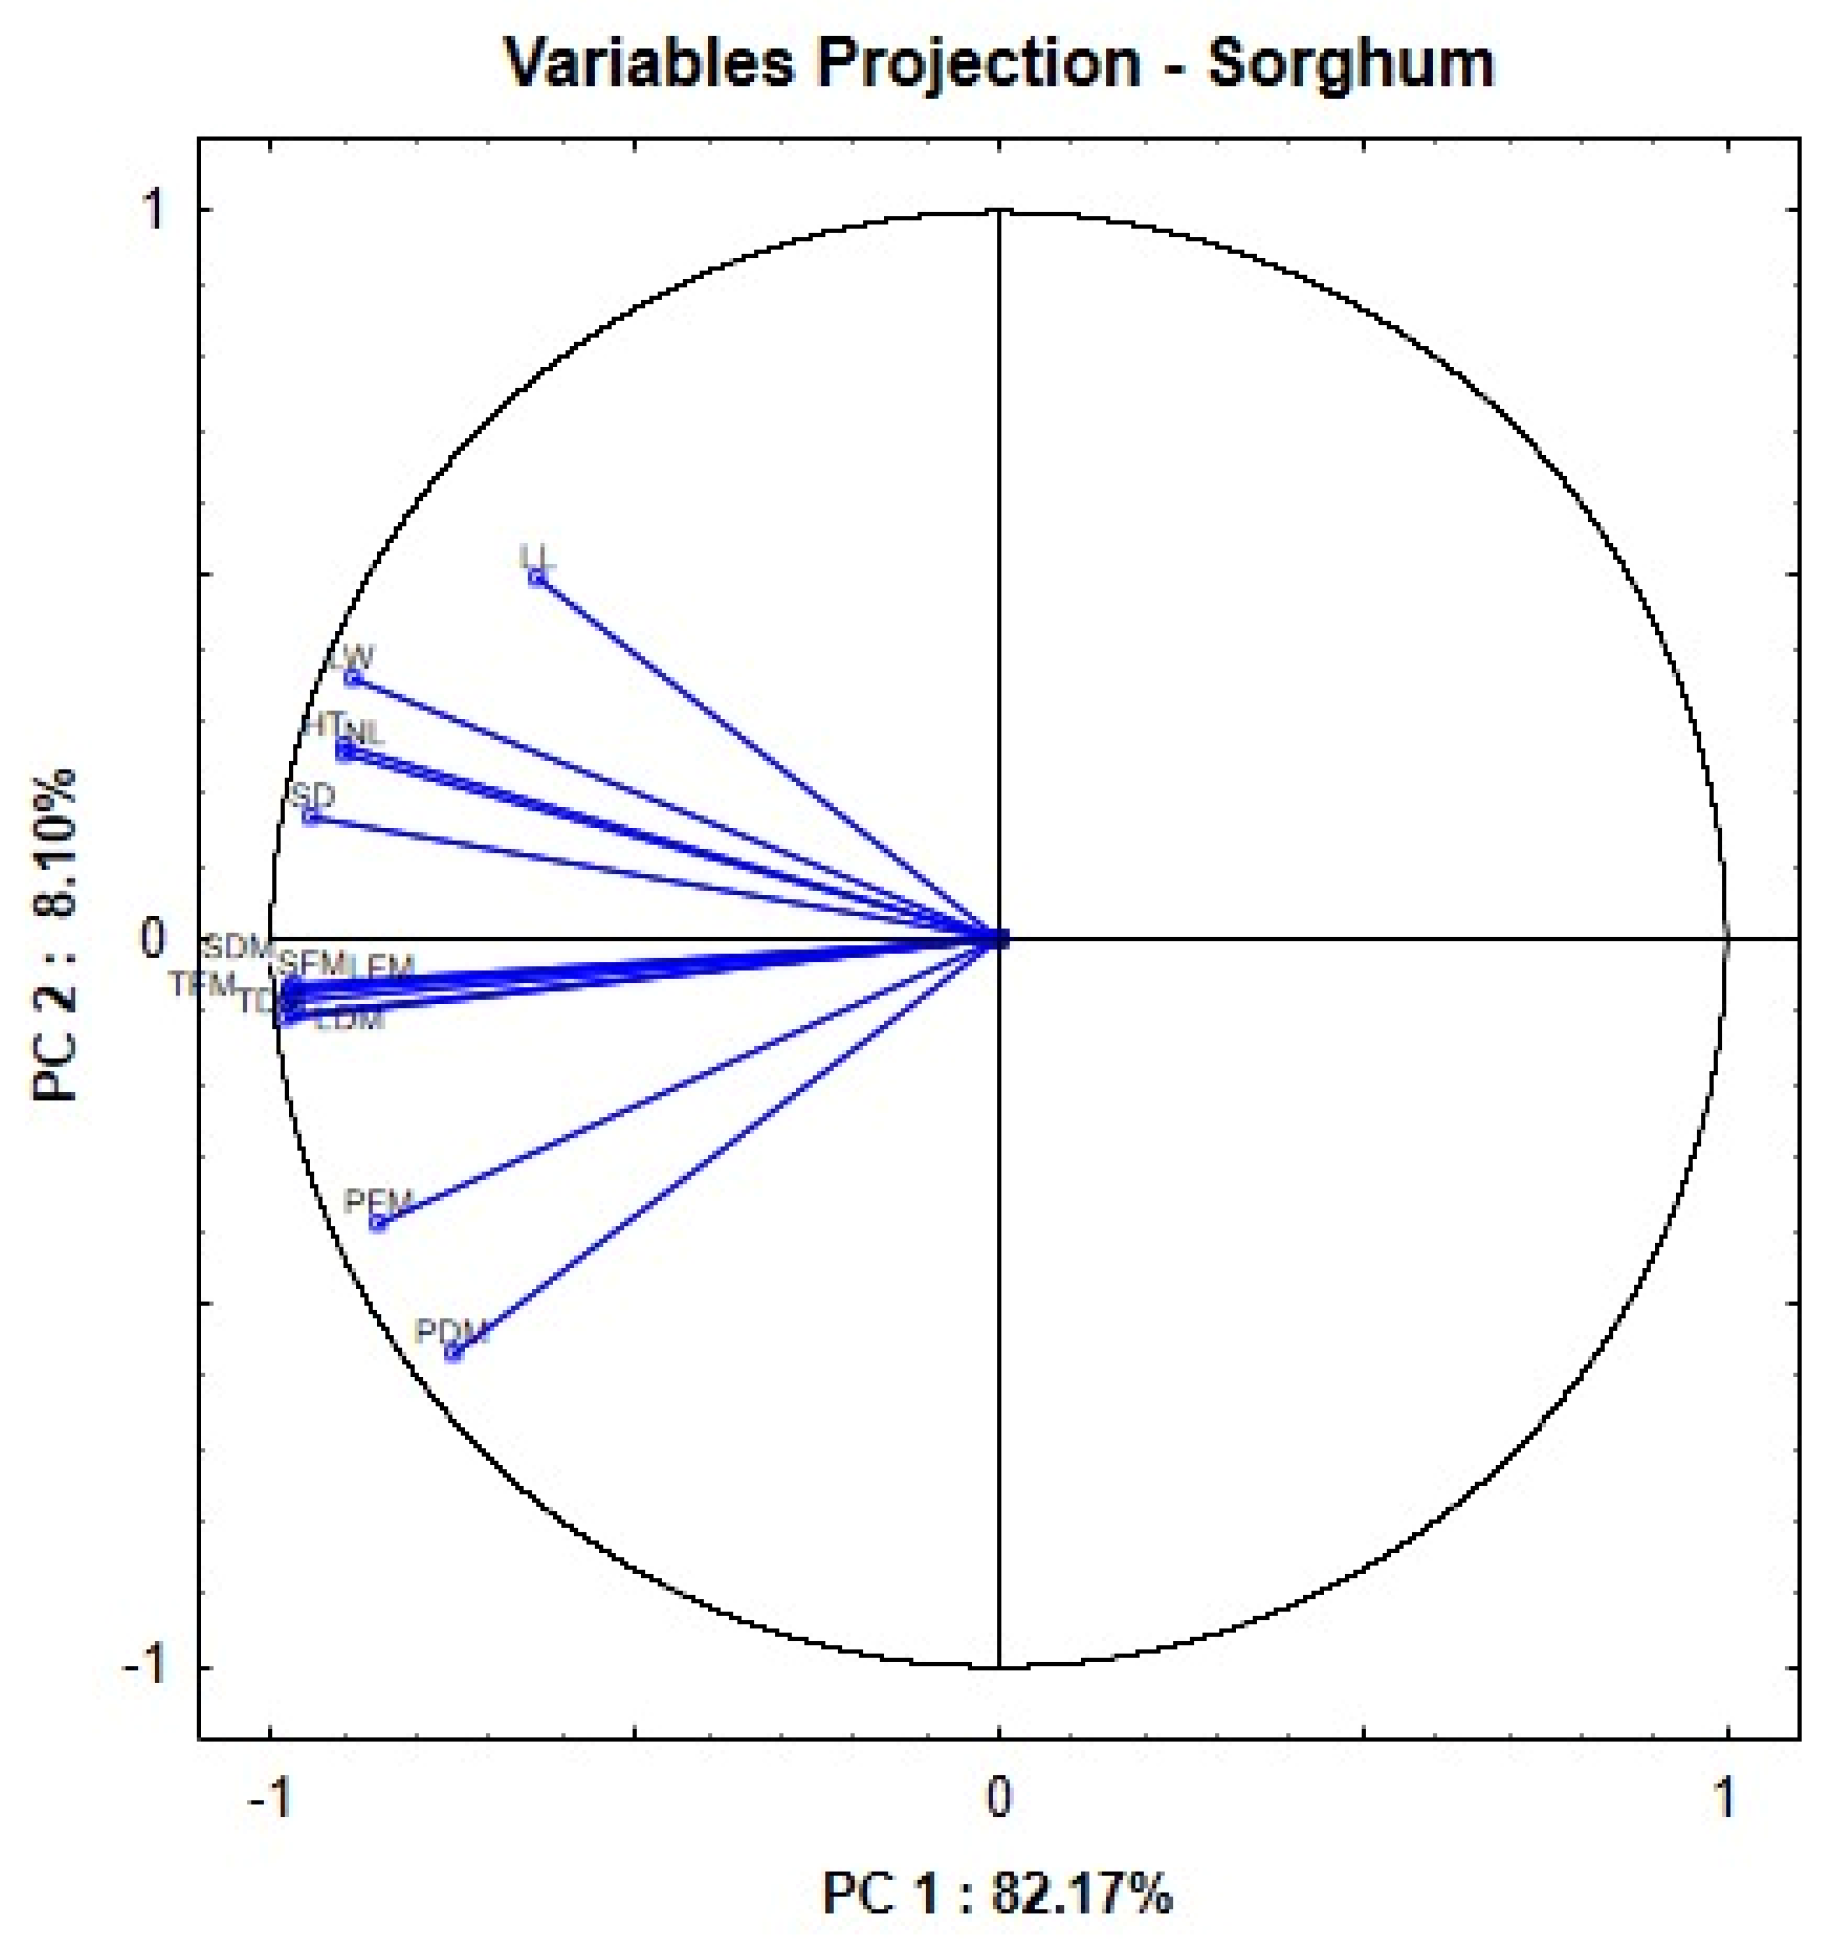
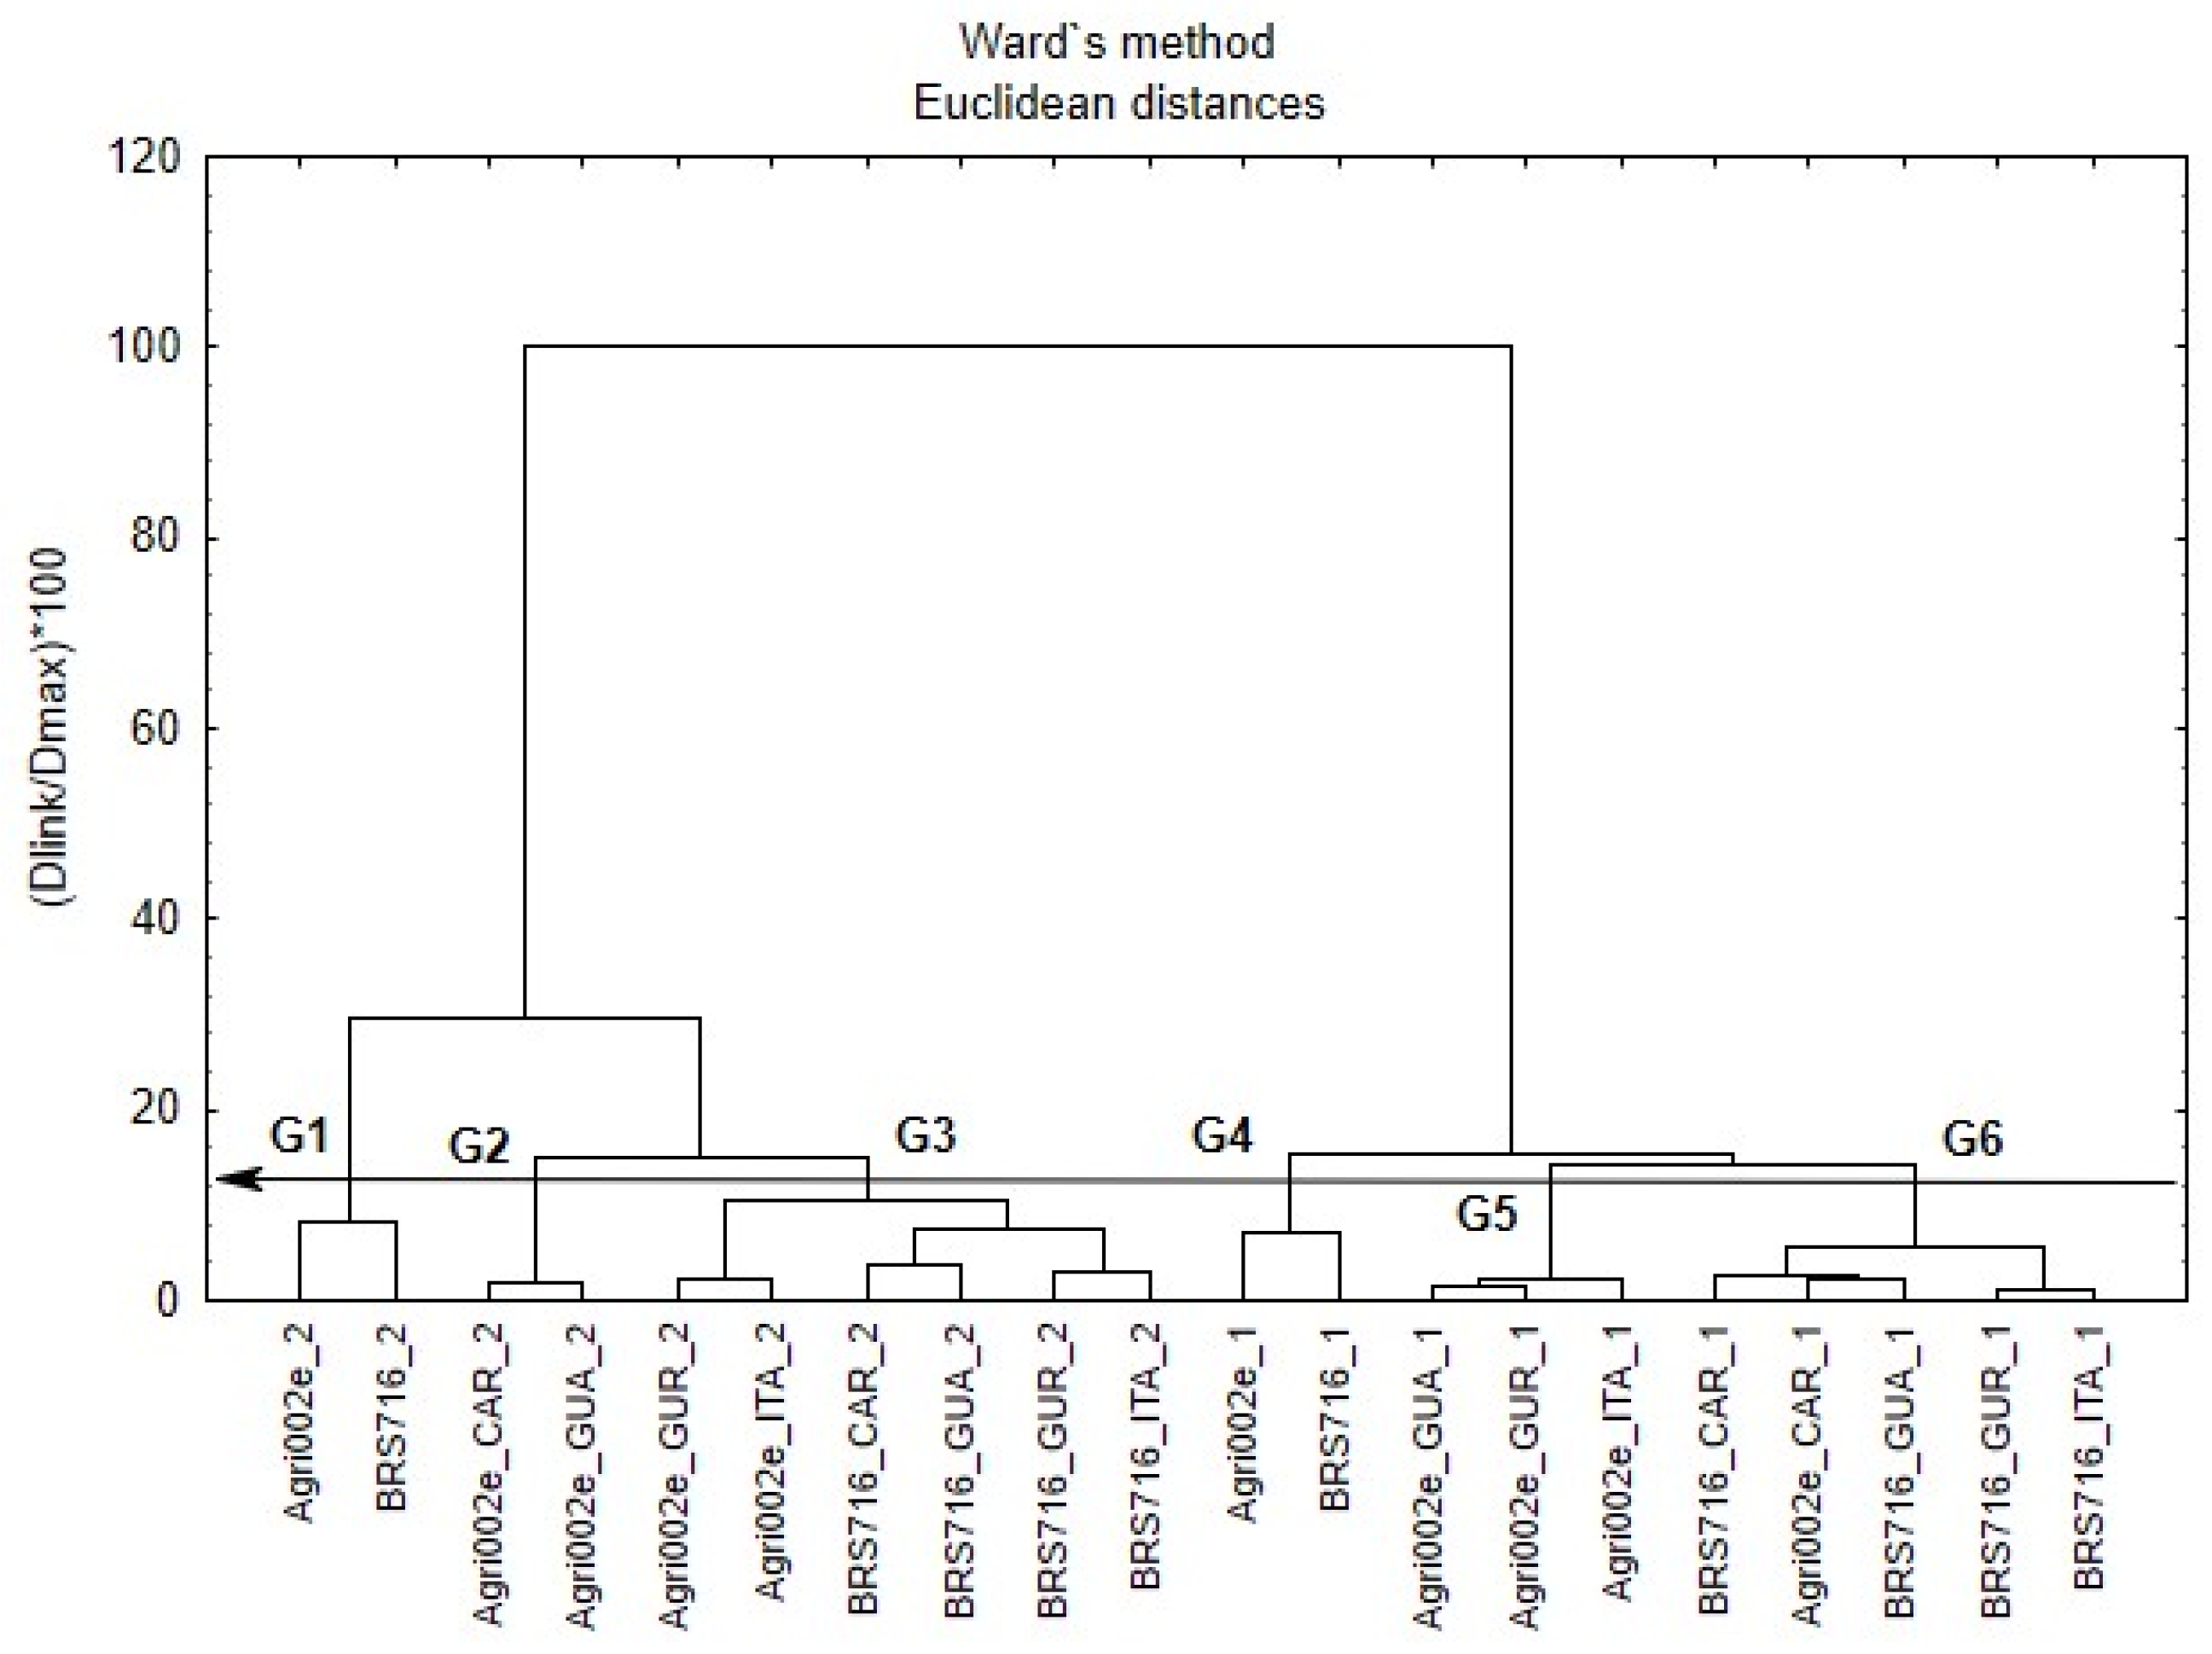
3.1. Biomass Sorghum

The general correlations between the variables for sorghum were classified as strong, very strong, and direct with positive coefficient values above 0.60. The correlations between stem diameter and stem fresh mass (SD-SFM) (0.97), stem diameter and total fresh mass (SD-TFM) (0.97), stem fresh mass and total fresh mass (SFM-TFM) (1.00), and stem dry mass and total dry mass (SDM-TDM) (1.00) stood out. Therefore, cultivars with larger stem diameters also had higher stem and total biomass productivity. A positive and very strong correlation was also observed between the variables height and stem fresh mass (HT-SFM) (0.96) and between height and total fresh mass (HT-TFM) (0.94) (Table 3).
The principal component analysis allowed for the extraction of two components. The first principal component (PC1) was responsible for explaining 82.17% of the data variability, with variables of higher weight (>0.65) for the biomass productivity (leaf, panicle, and stem fresh and dry biomass production and total production). The second principal component (PC2) explained 8.10% of the data variability and was represented by the biometric variables, plant height, and leaf width. The two components together explained 90.27% of the total data variance (Figure 3).
The variables with higher weight within each component, which best characterized the data variability, allowed for separating the sets of treatments with higher similarities through cluster analysis using the hierarchical method, grouping the treatments into six specific groups: G1, G2, G3, G4, G5, and G6 (Figure 4).
The groups had the cropping system (monoculture and intercropping) and sowing seasons (1 and 2) as the main standards of separation (Figure 4). This confirms that the cropping system and sowing season were the preponderant factors for generating the data variability, thus being responsible for the separation of these groups. Notably, the closer the treatments were within each group and between groups, the more similar their characteristics were. Alternatively, the more distant they were, the more contrasting their characteristics were.
For biomass sorghum, group 1 was formed by the monoculture of the cultivars Agri-002E and BRS 716 in season 2. Group 2 consisted of the intercropping of sorghum Agri-002E with the cowpea cultivars Carijó and Guariba in season 2. Group 3 was formed by the intercropping of the BRS 716 cultivar with the four cowpea cultivars, in addition to the intercropping of sorghum Agri-002E with the cultivars Itaim and Gurguéia, all in season 2. Group 4 consisted of the monoculture of sorghum cultivars Agri-002E and BRS 716 in season 1. Group 5 was formed by the intercropping of Agri-002E with the cultivars Guariba, Gurguéia, and Itaim in season 1. Group 6 was formed by the intercropping of Agri-002E with the cultivar Carijó, together with the grouping of the intercropping of sorghum cultivar BRS 716 in season 1.
The difference between groups was verified using the multivariate analysis of variance of the Wilks test, with the corresponding F-value, comparing the groups and confirming that the formed groups were different from each other (Table 4). This analysis granted the identification of the effect of cropping systems and sowing seasons on the performance of the cultivars.
Importantly, the groups represented by monocultures G1 and G4 stood out for biomass productivity in each growing season. Group 1, formed by monocultures set up in season 2, had better growth performance and productivity of the leaf, stem, and total fresh and dry biomass, with a dry biomass percentage of 37% higher than that of sorghum planted in season 1 (June). According to Table 4, dry biomass productivity in season 2 was 57,969.73 t ha−1 compared to that in season 1, which was 21,418.37 t ha−1.
Group 2, formed by the cultivar Agri-002E, in contrast to group 3, largely formed by the intercropping of the cultivar BRS 716, had higher productivity and was influenced by the relationship between the biometric variables NL, SD, LL, and LW and productive variables LFM, LDM, SFM, SDM, PFM, PDM, TFM, and TDM. This pattern was also observed in season 1, in which group 5, consisting of the intercropping of the cultivar Agri-002E, had higher productivity than group 6, consisting of a large part of the intercropping of BRS 716. This difference between groups showed that the cultivar Agri-002E obtained the best productive response relative to the cultivar BRS 716 in both cropping systems, regardless of the growing season. The relationship between the biometric and productive variables in growing season 2 showed the highest productivity of cultivars for this planting period.

3.2. Cowpea

Correlations for cowpea were considered weak and direct with positive values above 0.30 (Table 5). The correlations between the total number of pods and pod weight (TNP-PW) (0.46) and the total number of pods and pod grain weight (TNP-PGW) (0.43) stood out. The presence of medium and strong negative coefficient values was observed, including for the total number of pods and pod diameter (TNP-PD) (−0.44) and for pod diameter and the number of pod grains (PD-NPG) (−0.75), respectively. Pod weight and pod grain weight (PW-PGW) (0.99) presented the best positive, direct, and very strong correlation.
The principal component analysis allowed for the extraction of two components. The first component (PC1) was responsible for explaining 45.28% of the data variability whereas the second component (CP2) explained 30.08% of the variation, thus reaching 75.36% of the total data variance (Figure 5). The smallest explanation of the data variability for cowpea indicates that the cultivars had similar performances under the conditions in which they were grown.
The variables with the highest weight (>0.65) within PC1 were pod weight (PW) and pod grain weight (PGW). These variables presented the highest variability within the database, being the most important to separate the sets of treatments with the highest differences. The number of grains per pod (NGP) was the only significant variable in PC2.
The cluster analysis was performed after PCA using the hierarchical method, removing the variables with the lowest factorial load and obtaining the formation of six specific groups: G1, G2, G3, G4, G5, and G6 (Figure 6). The groups presented the cropping systems as a standard of separation (Figure 5).
The multivariate analysis with the Wilks test to compare the formed groups enabled the confirmation of the difference between groups, and most cultivars were affected not by sowing times but by the cropping system (Table 6). Groups 1 and 2 were formed by the cultivars grown in the monoculture system regardless of the growing season. Groups 4, 5, and 6 followed the grouping pattern according to the intercropping regardless of the growing season.
The cultivars BRS Guariba and BRS Itaim had similar behaviors, being grouped both in group 1 and group 6. Also, the comparison between groups showed that group 3, formed by the cultivar BRS Carijó in the intercropping system, presented the highest grain weight. This result may have been influenced by the biometric variable pod length (PL), which obtained the highest average between groups.
Group 4, consisting of the cultivar BRS Gurguéia, differed from the others as it had the highest number of grains per pod (NGP). Group 5, formed mostly by intercropping sorghum Agri-002E with the cultivars Guariba, Gurguéia, and Itaim in season 1, presented a lower grain production (PGW). This result may have been influenced by the total number of pods (TNP), with the lowest average between groups.
Group 6, consisting of the intercropping of Agri-002E with the cultivars Guariba and Itaim, regardless of the growing season, showed lower grain production than group 5, composed of the intercropping of BRS 716 with the cultivars Carijó, Guariba, and Itaim. Therefore, the association between cowpea cultivars and the cultivar BRS 716 is more advantageous than the association with Agri-002E.
The flowering stage of the analyzed cowpea cultivars presented daily temperatures between 18.38 and 32.58 °C and 20.22 and 31.82 °C in seasons 1 and 2, respectively. Therefore, the productive parameters of the cultivars BRS Carijó, BRS Guariba, BRS Gurguéia, and BRS Itaim did not differ from each other as the temperatures did not show high variation during the flowering stage and were below 33 °C (Figure 2).

3.3. Land Equivalent Ratio (LER)

The efficient land use showed that the intercropping of the cowpea cultivar BRS Carijó with sorghum BRS 716 and Gurguéia with Agri-002E, with an index of 1.00, had no advantages over the monoculture system in the sowing in June (season 1). However, the intercropping of the cultivars BRS Gurguéia, BRS Guariba, and BRS Carijó with sorghum BRS 716 reached indices of 1.03, 1.02, and 1.17 in the sowing in December (season 2), respectively, demonstrating that intercropping was advantageous over monoculture. Monoculture was the most advantageous system for values below 1 (Table 7).

4. Discussion

The positive correlation between two variables can promote gains through the selection of materials in the other associated variable [26]. Biomass sorghum showed a strong positive correlation between the components SD-SFM, SD-TFM, SFM-TFM, and SDM-TDM. Thus, the variable stem diameter had great relevance in the production processes of the cultivars as increases in this variable were also reflected in other variables. In this case, the SD can be an important variable in the development of models to estimate the productivity of these biomass sorghum cultivars.
Oliveira et al. [27], when analyzing the correlations between characters and path analysis in sweet sorghum genotypes, found strong and positive correlations between plant height (0.75) and fresh mass production (0.74) and strong and moderate correlations for dry mass production (0.88) with stem diameter (0.89) and average number of leaves (0.60). Stem diameter in sorghum plants can directly and proportionally influence plant weight and, consequently, forage mass production [28]. Thus, stem diameter is an important variable for fresh and dry mass production in sorghum plants, with the stem representing an important storage organ for reserve substances in plants, and the larger its larger diameter is, the higher its photoassimilate storage capacity will be [29].
Other positive and strong correlations between biomass sorghum variables were found for height with stem fresh mass and height with total fresh mass. The high and strong positive correlation of plant height with fresh mass allowed taller genotypes to produce a higher forage volume per hectare [30]. Plant height was also an important trait as it was positively correlated with fresh and dry matter production and could be used as an indicator of dry matter production in photoperiod-sensitive sorghum hybrids [31].
In addition to height, the number of leaves also acts directly on sorghum productivity as the plant depends on leaves, which act as the main photosynthetic organs. Thus, the plant growth rate depends on both the leaf area expansion rate and the photosynthesis rate per unit of leaf area [32].
The analysis of the sowing time through the average of the formed groups showed that the biomass sorghum cultivars Agri-002E and BRS 716 reached the highest biomass production when sown in December as the cultivars were sensitive to the photoperiod [31]. Photoperiod-sensitive sorghum cultivars are induced to flower on days shorter than 12 h and twenty minutes [33]. Significant effects on the biomass production of photoperiod-sensitive genotypes have been reported elsewhere [34,35].
In addition to the photoperiod, temperature also directly affects plant growth and development. The ideal temperature for sorghum development ranges from 21 to 38 °C [15,36,37]. The sowing of biomass sorghum in June coincided with minimum temperatures of 15 °C and 23.7 °C, with values below 20 °C for 56 days (Figure 2). This may have influenced the reduction in biomass production for the cultivars Agri-002E and BRS 716 [15]. The performance of sorghum cultivars under different temperature regimes and the biometric and productive parameters of the cultivars Agri-002E and BRS 716 were lower at temperatures between 20 and 33 °C compared to plants maintained at temperatures ranging from 24.8 to 39.3 °C. Photosynthetic efficiency in C4 metabolism plants increases under high temperatures and light conditions, promoting higher growth rates and biomass production [38].
In addition to the photoperiod and temperature, the accumulated precipitation (340.90 mm) throughout season 2 (December to May) (Figure 2) may also have favored the accumulation of biomass in sorghum plants. The water demand of sorghum varies according to the cultivar and the crop’s development phase, but in general, biomass sorghum cultivars require between 400 and 750 mm of water during the growth cycle [39].
Thus, the higher biomass accumulation in sorghum hybrids is explained by the growing season, type of genetic material, and cultivation site [40], which directly interfere with the vegetative period, higher leaf area rate, and higher radiation interception and use efficiency (C4 plant) [32]. Moreover, the sowing season stands out for biomass production as it is related to sorghum vegetative development. Higher gains in biomass will always be desirable in the cultivation of this sorghum from an economic point of view and management must be performed to allow the plants to grow vegetatively for longer periods before harvesting [32].
Cowpea grain yield is highly correlated with production components, i.e., the number of pods per plant, the number of grains per plant. and seed weight [41].
Some production components may increase and others decrease depending on the environmental conditions, altering the maintenance of productive stability [42]. The number of pods per area was the trait most correlated with grain yield for the productive performance of cowpea cultivars of different sizes regardless of the type of plant size. Environmental conditions, including temperature and water availability, affect the number of produced pods as they are key elements for pollen viability and the proportion of flowers that develop into mature pods [14]. In this study, cowpea plants were not affected by temperatures above 33 °C, with no physiological or metabolic impairment.
Pod length was also a determining factor for the productive performance of the analyzed cultivars. The strong and positive correlation between pod length and the number of grains per pod allows us to infer that selection to increase the pod length leads to an increase in the number of seeds per pod and, consequently, an increase in production [43,44].
Regarding the temperature for the potential performance of cowpea, the flowering stage is a critical period as it affects the final pod production and, consequently, the yield [14]. The authors observed that temperatures above 33 °C during cowpea flowering negatively interfere with grain production due to the direct impact on pollen grain viability and flower abortion. Therefore, in this study, the temperature had no negative effect on cowpea production as it did not reach the maximum tolerable limit at the reproductive stage.
The efficiency of the cropping system depends on the synergistic effects of the species chosen for the intercropping as the plants compete with each other for growth and production factors (light, CO2, water, and mineral nutrients) when grouped in the field, which may interfere with their performance [45].
The results show that the sorghum biomass and cowpea had an advantage over the monoculture for the combinations of the sorghum cultivar BRS 716 with the cowpea cultivars BRS Carijó, BRS, Guariba, and BRS Gurguéia for the sowing in December. The LER > 1 represents that combinations of the sorghum cultivar BRS 716 with the cowpea cultivars BRS Carijó, BRS, Guariba, and BRS Gurguéia were 2–17% more efficient in using the available land. Meanwhile, in contrast, the sorghum/cowpea cultivar combinations, planted in June, resulted in an LER < 1, demonstrating that the choice of planting time and cultivar combination in cereals/legumes are important.
LER indices of 1.4, 1.8, 1.5, 1.7, and 1.9 were observed for the intercropping of sorghum and cowpea [46]; indices of 1.61, 1.53, and 1.19 were noted for sorghum–clover [47] and cowpea intercropped with maize, sorghum, and maize, with average ratios of 1.42  ±  0.47, 1.26  ±  0.35, and 1.30  ±  0.32, respectively [48].
The literature emphasizes that satisfactory productivity and greater resilience in intercropping depend on the choice of species that complement each other, plant arrangement, spacing, and population density [49]. However, this study showed that the choice of cultivar within the chosen species and the sowing seasons must also be considered so that the crop reaches its productive potential. Recent studies highlight that cultivars’ productive performance in monoculture may differ when used in intercropping, and it is important to select specific cultivars for future mixed cropping systems based on their performance in intercropping [50,51].
Although it is not an easy task, due to the complexity of the multiple interactions that determine the final performance of intercropping [51], conducting studies that increase complementarity and the understanding of the responses of different combinations of cultivars under different growing seasons is strategic for sustainable development.

5. Conclusions

The productive performance of biomass sorghum cultivars Agri-002E and BRS 716 was higher when planted in December and the cowpea productivity was not influenced by sowing seasons and cultivation systems. Based on the calculation of efficient land use, the intercropping between the biomass sorghum cultivar BRS 716 and the cowpea cultivars BRS Gurguéia, BRS Guariba, and BRS Carijó was advantageous over monoculture when planted in the hottest season. This study showed the importance of cultivar selection and planting time in land use efficiency in intercropping systems since the performance of cultivars in monoculture is not necessarily correlated with the performance in intercropping. Thus, even without a significant increase in production, the use of intercropping systems can have a positive effect on the efficient use of land, contributing to the functioning of the agroecosystem, with a better use of environmental resources. Therefore, the final performance of intercropping depends on the interaction between the cultivars and the environment.

Author Contributions

Methodology, formal analysis, validation, investigation, data curation, and writing—original draft preparation, L.A.d.N.; conceptualization, methodology, formal analysis, and writing—review and editing, W.L.S. and A.M.S.; methodology, formal analysis, and writing—review and editing, J.R.A.B., methodology and formal analysis, W.O.d.S., K.V.F.B. and I.M.B.; conceptualization, supervision, project administration, financing acquisition, methodology, and writing—review and editing, A.R.d.O. and F.A. All authors have read and agreed to the published version of the manuscript.

Funding

The authors would like to thank Higher Education Personnel Improvement Coordination—Brazil (CAPES) for funding a postdoctoral fellowship (PROCESS No.: 001 and 88887.616175/2021-00) and the Foundation for the Support of Science and Technology of the State of Pernambuco—FACEPE (BFP-0113-5.01/21).

Data Availability Statement

The data that support the findings of this study are available from the corresponding author upon reasonable request.

Conflicts of Interest

The authors declare no conflicts of interest.

References

  1. IPCC. Climate Change 2021: The Physical Science Basis. International Panel on Climate Change; IPCC: Geneva, Switzerland, 2021. [Google Scholar]
  2. Angelotti, F.; Giongo, V. Mitigation and adaptation actions in the face of climate change. In Rain-Dependent Family Farming in the Semi-Arid Region; Melo, R.F., Voltolini, T.V., Eds.; Embrapa: Brasília, Brazil, 2019; pp. 445–467. [Google Scholar]
  3. Giongo, V.; Salviano, A.M.; Angelotti, F.; Taura, T.; Leite, L.F.C.; Cunha, T.J.F. Low Carbon Technologies for Agriculture in Dryland: Brazilian Experience. In Climate Resilient Agriculture—Strategies and Perspectives; Rao, C.S., Shanker, A.K., Shanker, C., Eds.; InTech: London, UK, 2018; pp. 105–127. [Google Scholar] [CrossRef]
  4. Pereira, B.J.; Cecílio Filho, A.B.; Scala, N.L.J. Greenhouse gas emissions and carbon footprint of cucumber, tomato and lettuce production using two cropping systems. J. Clean. Prod. 2021, 282, 124517. [Google Scholar] [CrossRef]
  5. Sun, T.; Feng, X.; Lal, R.; Cao, T.; Guo, J.; Deng, A.; Zheng, C.; Zhang, J.; Song, Z.; Zhang, W. Crop diversification practice faces a tradeoff between increasing productivity and reducing carbon footprints. Agric. Ecosyst. Environ. 2021, 321, 107614. [Google Scholar] [CrossRef]
  6. Maitra, S.; Hossain, A.; Brestic, M.; Skalicky, M.; Ondrisik, P.; Guitarra, H.; Brahmachari, K.; Shankar, T.; Bhadra, P.; Palai, J.B.; et al. Intercropping—A Low Input Agricultural Strategy for Food and Environmental Security. Agronomy 2021, 11, 343. [Google Scholar] [CrossRef]
  7. Angelotti, F.; Oliveira, A.R.; Giongo, V.; Barros, J.R.A.; Guimarães, M.J.M. Sustainable agriculture as an adaptation measure for Araripe Plaster Pole. In Public Policies for Adapting Agriculture to Climate Change in Semi-Arid Northeast Brazil; Sabourin, E., Oliveira, L.M.R., Goulet, F., Martins, E.S., Eds.; E-papers: Rio de Janeiro, Brazil, 2022; pp. 61–76. [Google Scholar]
  8. May, A.; Parrella, R.A.C.; Damasceno, C.M.B.; Simeone, M.L.F. Sorghum as raw material for bioenergy production: Ethanol and cogeneration. Sorgo Inovações Tecnológicas 2014, 35, 73–81. [Google Scholar]
  9. Abebe, B.K.; Alemayehu, M.T. A review of the nutritional use of cowpea (Vigna unguiculata L. Walp) for human and animal diets. J. Agric. Res. 2022, 10, 100383. [Google Scholar] [CrossRef]
  10. Oliveira, K.C.L.; Santos, T.F.S.; Rosa, C.R.J.; Vieira, R.C.; Rodrigues, D.J.; Guedes, S.F.; Weber, L.S. Change in soil microbial biodiversity due to agricultural cultivation: A review Cambio en la biodiversidad microbiana del suelo debido al cultivo agrícola: Una revisión. Res. Soc. Dev. 2022, 11, 15. [Google Scholar] [CrossRef]
  11. Choudhary, V.K.; Choudhury, B.U. A Staggered maize–legume intercrop arrangement influences yield, weed smothering and nutrient balance in the eastern himalayan region of India. Exp. Agric. 2018, 54, 2. [Google Scholar] [CrossRef]
  12. Raseduzzaman, M.; Jensen, E.S. Does intercropping enhance yield stability in arable crop production? A meta-analysis. Eur. J. Agron. 2017, 91, 25–33. [Google Scholar] [CrossRef]
  13. Fletcher, A.L.; Kirkegaard, J.A.; Peoples, M.B.; Robertson, M.J.; Whish, J.; Swan, A.D. Prospects to utilise intercrops and crop variety mixtures in mechanised, rain-fed, temperate cropping systems. Crop Pasture Sci. 2016, 67, 12. [Google Scholar] [CrossRef]
  14. Barros, J.R.A.; Guimarães, M.J.M.; Simoes, W.L.; Melo, N.F.D.; Angelotti, F. Temperature: A major climatic determinant of cowpea production. Acta Sci. Agron. 2023, 45, e56812. [Google Scholar] [CrossRef]
  15. Nascimento, G.S.G.; Oliveira, G.M.; Silva, E.G.F.; Barros, J.R.A.; Guimarães, M.J.M.; Oliveira, A.R.; Angelotti, F. The Increase in Air Temperature and its Interference in the Emergence and Initial Growth of Sorghum Cultivars. Glob. J. Sci. Front. Res. D Agric. Vet. 2023, 23, 1. [Google Scholar]
  16. Empresa Brasileira de Pesquisa Agropecuária—Embrapa. Brazilian System of Soil Classification, 5th ed.; Embrapa: Brasília, Brazil, 2018. [Google Scholar]
  17. Cavalcanti, F.J.A. Fertilizers. In Fertilization Recommendations for the State of Pernambuco: 2a. Approximation, 3rd ed.; Messias, A.S., Silva, D.J., Freire, F.J., Silva, M.C.L., Eds.; IPA: Revista Recife, Brazil, 2008; pp. 89–103. [Google Scholar]
  18. Santos, F.C.d.; Resende, A.V.; Coelho, A.M. Nutritional requirements and fertilizer. In Sorghum: The Producer Asks, Embrapa Responds; Pereira Filho, I.A., Rodrigues, J.A.S., Eds.; Coleção 500 Perguntas, 500 Respostas; Embrapa: Brasília, Brazil, 2015; pp. 81–97. Available online: https://ainfo.cnptia.embrapa.br/digital/bitstream/item/126260/1/Exigencias-nutricionais-adubacao.pdf (accessed on 1 July 2024).
  19. Khalilian, M.E.; Habibi, D.; Golzardi, F.; Aghayari, F.; Khazaei, A. Effect of maturity stage on yield, morphological characteristics, and feed value of sorghum [Sorghum bicolor (L.) Moench] cultivars. Cereal Res. Commun. 2022, 50, 4. [Google Scholar] [CrossRef]
  20. Ribeiro, N.D.; Santos, G.G.; Maziero, S.M.; Steckling, S.M. Phenological, Plant Architecture, and Grain Yield Traits on Common Bean Lines Selection. Rev. Caatinga 2018, 31, 3. [Google Scholar] [CrossRef]
  21. Pestana, M.H.; Gageiro, J.N. Data Analysis for Social Sciences: The Complementarity of SPSS, 4th ed.; Edições Sílabo: Lisbon, Portugal, 2005. [Google Scholar]
  22. Hair, J.F.J.; Black, W.C.; Anderson, R.E.; Tatham, R.L. Multivariate Data Analysis, 6th ed.; Bookman: Porto Alegre, Brazil, 2009. [Google Scholar]
  23. Ho, R. Handbook of Univariate and Multivariate Data Analysis and Interpretation with SPSS, 1st ed.; Chapman e Hall: Boca Raton, FL, USA, 2006. [Google Scholar]
  24. Field, A.P. Discovering Statistics Using IBM SPSS Statistics, 5th ed.; Sage: Newbury Park, CA, USA, 2018. [Google Scholar]
  25. Mead, R.; Willey, R.W. The Concept of a ‘Land Equivalent Ratio’ and Advantages in Yields from Intercropping. Exp. Agric. 1980, 16, 217–228. [Google Scholar] [CrossRef]
  26. Oliveira, T.C.; Barelli, A.A.; Silva, V.P.; Azevedo, R.F.; Gonçalves, D.L.; Santos, P.R.J.; Poletine, J.P.; Galbiati, C.; Tardin, F.D. Correlations between characters and path analysis in sweet sorghum (Sorghum bicolor (L.) Moench) genotypes for juice production. Aust. J. Crop Sci. 2021, 15, 2. [Google Scholar] [CrossRef]
  27. Oliveira, A.J.; Almici, M.S.; Santos, A.A.C.; Silva, V.P.; Pires, A.S.C.; Tardin, F.D. Yield components in sweet sorghum genotypes. Res. Soc. Dev. 2021, 10, 2525–3409. [Google Scholar] [CrossRef]
  28. Castro, F.M.R.; Bruzi, A.T.; Nunes, J.A.R.; Parrella, R.A.C.; Lombardi, G.M.R.; Albuquerque, C.J.B.; Lopes, M. Agronomic and Energetic Potential of Biomass Sorghum Genotypes. Am. J. Plant Sci. 2015, 6, 11. [Google Scholar] [CrossRef]
  29. Andrade, I.O.J.; Santos, S.R.; Kondo, M.K.; Oliveira, P.M.; Rocha, V.R.J. Response of forage sorghum to water availability in a typic quartzipsamment. Rev. Caatinga 2019, 32, 4. [Google Scholar] [CrossRef]
  30. Habyarimana, E.; Franceschi, P.; Ercisli, S.; Baloch, F.S.; Dall’Agata, M. Genome-Wide Association Study for Biomass Related Traits in a Panel of Sorghum bicolor and S. bicolor × S. halepense Populations. Front. Plant Sci. 2020, 11, 551305. [Google Scholar] [CrossRef]
  31. Delgado, I.D.; Gonçalves, F.M.A.; Parrella, R.A.C.; Castro, F.M.R.; Nunes, J.A.R. Genotype by environment interaction and adaptability of photoperiod-sensitive biomass sorghum hybrids. Bragantia 2019, 78, 4. [Google Scholar] [CrossRef]
  32. Chavez, J.C.; Ganjegunte, G.K.; Jeong, J.; Rajan, N.; Zapata, S.D.; Ruiz-Alvarez, O.; Enciso, J. Radiation Use Efficiency and Agronomic Performance of Biomass Sorghum under Different Sowing Dates. Agronomy 2022, 12, 6. [Google Scholar] [CrossRef]
  33. Packer, D.J.; Rooney, W.L. High-parent heterosis for biomass yield in photoperiod-sensitive sorghum hybrids. Field Crops Res. 2014, 167, 153–158. [Google Scholar] [CrossRef]
  34. Naoura, G.; Emendack, Y.; Sawadogo, N.; Djirabaye, N.; Tabo, R.; Laza, H.; Atchozou, E. Assessment of Photoperiod Sensitivity and the Effect of Sowing Date on Dry-Season Sorghum Cultivars in Southern Chad. Agronomy 2023, 13, 932. [Google Scholar] [CrossRef]
  35. Schetter, A.; Lin, C.H.; Zumpf, C.; Jang, C.; Hoffmann, L.J.; Rooney, W.; Lee, D. Genotype-Environment-Management Interactions in Biomass Yield and Feedstock Composition of Photoperiod-Sensitive Energy Sorghum. Bioenergy Res. 2022, 15, 1017–1032. [Google Scholar] [CrossRef]
  36. Chadalavada, K.; Kumari, B.D.R.; Kumar, T.S. Sorghum mitigates climate variability and change on crop yield and quality. Planta 2021, 253, 113. [Google Scholar] [CrossRef]
  37. Silva, W.O.; Barros, J.R.A.; Simoes, W.L.; Oliveira, A.R.; Nascimento, L.A.; Angelotti, F. Water availability and growing season temperatureon the performance of sorghum cultivars. Rev. Bras. Ciênc. Agrar. 2024, 19, 2. [Google Scholar] [CrossRef]
  38. Simpson, K.J.; Bennett, C.; Atkinson, R.R.L.; Mockford, E.J.; McKenzie, S.; Freckleton, R.P.; Thompson, K.; Rees, M.; Osborne, C.P. C4 photosynthesis and the economic spectra of leaf and root traits independently influence growth rates in grasses. J. Ecol. 2020, 108, 1899–1909. [Google Scholar] [CrossRef]
  39. Monteiro, J.S.; Havrland, B.; Ivanova, T. Sweet Sorghum (Sorghum bicolor (L.) Moench) Bioenergy Value—Importance for Portugal. Agric. Trop. Subtrop. 2012, 45, 1. [Google Scholar] [CrossRef]
  40. Meki, M.N.; Ogoshi, R.; Kiniry, J.R.; Crow, S.E.; Youkhana, A.H.; Nakahata, M.H.; Littlejohn, K. Performance evaluation of biomass sorghum in Hawaii and Texas. Ind. Crops Prod. 2017, 103, 257–266. [Google Scholar] [CrossRef]
  41. Freitas, T.G.G.; Silva, P.S.L.; Dovale, J.C.; Silva, I.N.; Silva, E.M. Grain yield and path analysis in the evaluation of cowpea landraces. Rev. Caatinga 2019, 32, 2. [Google Scholar] [CrossRef]
  42. Owusu, E.Y.; Karikari, B.; Kusi, F.; Haruna, M.; Amoah, R.A.; Attamah, P.; Adazebra, G.; Sie, E.K.; Issahaku, M. Genetic variability, heritability and correlation analysis among maturity and yield traits in Cowpea (Vigna unguiculata (L.) Walp) in Northern Ghana. Heliyon 2021, 7, 2. [Google Scholar] [CrossRef]
  43. Meira, A.L.; Santana, T.M.; Amorim, Y.F.; Silva, J.O.; Miguel, D.L.; Amaral, C.L.F. Genetic parameters in the selection of cowpea under water stress in protected cultivation. Acta Iguazu 2020, 9, 81–98. [Google Scholar] [CrossRef]
  44. Pessoa, M.A.S.; Bertini, C.H.C.M.; Castro, E.B.L.; Freitas, L.M.; Araújo, L.B.R. Genetic parameters and selection indices of cowpea genotypes for green grain production. Rev. Caatinga 2023, 36, 2. [Google Scholar] [CrossRef]
  45. Yang, A.T.; Siddique, B.K.H.M.; Liu, A.K. Cropping systems in agriculture and their impact on soil health—A review. Glob. Ecol. Conserv. 2020, 23, e01118. [Google Scholar] [CrossRef]
  46. Mogale, T.E.; Ayisi, K.K.; Munjonji, L.; Kifle, Y.G. Yield Responses of Grain Sorghum and Cowpea in Binary and Sole Cultures under No-Tillage Conditions in Limpopo Province. Agriculture 2022, 12, 5. [Google Scholar] [CrossRef]
  47. Ashoori, N.; Abdi, M.; Golzardi, F.; Ajalli, J.; Ilkaee, M.N. Forage potential of sorghum-clover intercropping systems in semi-arid conditions. Bragantia 2021, 80, e1421. [Google Scholar] [CrossRef]
  48. Namatsheve, T.; Cardinael, R.; Corbeels, M.; Chikowo, R. Productivity and biological N2-fixation in cereal-cowpea intercropping systems in sub-Saharan Africa. A review. Agron. Sustain. Dev. 2020, 40, 30. [Google Scholar] [CrossRef]
  49. Demie, D.T.; Doring, T.F.; Finckh, M.R.; Werf, W.; Enjalbert, J.; Seidel, S.J. Mixture × Genotype Effects in Cereal/Legume Intercropping. Front. Plant Sci. 2022, 13, 846720. [Google Scholar] [CrossRef]
  50. Louarn, G.; Barillot, R.; Combes, D.; Escobar-Gutiérrez, A. Towards intercrop ideotypes: Non-random trait assembly can promote overyielding and stability of species proportion in simulated legume-based mixtures. Ann. Bot. 2020, 126, 671–685. [Google Scholar] [CrossRef]
  51. Paul, M.R.; Demie, D.T.; Seidel, S.J.; Döring, T.F. Evaluation of multiple spring wheat cultivars in diverse intercropping systems. Eur. J. Agron. 2024, 152, 127024. [Google Scholar] [CrossRef]
Figure 1. (A) Biomass sorghum and cowpea consortium at 79 days after planting in season 1—June to September 2021. (B) Biomass sorghum and cowpea consortium at 60 days after planting in season 2—December to May 2022.
Agronomy 14 01970 g001
Figure 2. (A): Season 1—June to September 2021. (B): Season 2—December to May 2022. Maximum temperature (Ta (max) (°C)), minimum temperature (Ta (min) (°C)), precipitation (Prec (mm)), and sorghum biomass and cowpea cycle (sowing to harvest) of two sowing seasons (season 1 and season 2) from June to September 2021 and December to May 2022 are shown.
Agronomy 14 01970 g002
Figure 3. PCA analysis. Variables of sorghum biomass grown in the intercropping and monoculture systems during two sowing seasons (June to September 2021 and December 2021 to May 2022) are shown. HT: height (cm); NL: number of leaves; SD: stem diameter (mm); LL: leaf length (cm); LW: leaf width (cm); LFM: leaf fresh mass (kg ha−1); LDM: leaf dry mass (kg ha−1); SFM: stem fresh mass (kg ha−1); SDM: stem dry mass (kg ha−1); PFM: panicle fresh mass (kg ha−1); PDM: panicle dry mass (kg ha−1); TFM: total fresh mass (kg ha−1); TDM: total dry mass (kg ha−1).
Agronomy 14 01970 g003
Figure 4. Dendrogram showing the hierarchy of groups for variables of sorghum (Agri-002E and BRS 716) grown in the intercropping and monoculture systems during two sowing seasons (June to September 2021 and December 2021 to May 2022) resulting from the cluster analysis by the hierarchical method. CAR: BRS Carijó; GUA: BRS Guariba; GUR: BRS Gurguéia; ITA: BRS Itaim; 1: season 1; 2: season 2.
Agronomy 14 01970 g004
Figure 5. PCA analysis. Variables and treatments are shown. TNP: total number of pods; PL: pod length (cm); PD: pod diameter (mm); NGP: number of grains per pod; PW: pod weight (kg ha−1); PGW: pod grain weight (kg ha−1) of cowpea (BRS Carijó, BRS Guariba, BRS Gurguéia, and BRS Itaim) grown in the intercropping and monoculture systems during two sowing seasons (June to September 2021 and December 2021 to May 2022).
Agronomy 14 01970 g005
Figure 6. Dendrogram showing the hierarchy of groups between variables of cowpea (BRS Carijó, BRS Guariba, BRS Gurguéia, and BRS Itaim) grown in the intercropping and monoculture systems during two sowing seasons (June to September 2021 and December 2021 to May 2022), resulting from the cluster analysis by the hierarchical method. Agri: Agri-002E; BRS: BRS 716; CAR: BRS Carijó; GUA: BRS Guariba; GUR: BRS Gurguéia; ITA: BRS Itaim; 1: season 1; 2: season 2.
Agronomy 14 01970 g006
Table 1. Treatments used in the experiment.
MonocultureConsortium
T1: BRS Itaim (cowpea)T7: BRS Itaim + BRS 716
T2: BRS Gurguéia (cowpea)T8: BRS Itaim + AGRI-002E
T3: BRS Guariba (cowpea)T9: BRS Gurguéia + BRS 716
T4: BRS Carijó (cowpea)T10: BRS Gurguéia + AGRI-002E
T5: BRS 716 (biomass sorghum)T11: BRS Guariba + BRS 716
T6: AGRI-002E (biomass sorghum)T12: BRS Guariba + AGRI-002E
T13: BRS Carijó + BRS 716
T14: BRS Carijó + AGRI-002E
Table 2. Soil chemical analysis (0–20 cm deep) during two sowing seasons (June to September 2021 and December 2021 to May 2022).
SeasonM.OpH H2OPS-SO−4Ca2+Mg2+K+H+AlV
g kg−1 mg dm−3cmolc dm−3%
Season 121.85.71.32.41.871.050.310.9776.84
Season 24.36.811.66.71.720.450.321.1169.57
Table 3. Pearson’s linear correlation matrix (p < 0.05) including the biometric and productivity variables evaluated in monoculture and intercropped sorghum cultivars (Agri-002E and BRS 716) during two sowing seasons (June to September 2021 and December 2021 to May 2022).
VariablesHT NLSD LLLWLFMLDMSFMSDMPFMPDMTFMTDM
HT1.00
NL0.951.00
SD0.940.941.00
LL0.470.480.531.00
LW0.780.790.870.731.00
LFM0.880.900.940.610.921.00
LDM0.920.930.960.580.900.991.00
SFM0.960.950.970.500.860.950.971.00
SDM0.930.930.950.540.870.940.960.981.00
PFM0.540.630.640.330.600.680.670.650.661.00
PDM0.400.510.520.230.510.580.560.520.520.951.00
TFM0.940.950.970.520.870.970.981.000.980.690.571.00
TDM0.920.930.960.540.890.960.970.991.000.710.590.991.00
Bolded values were significant at the 5% probability level. HT: height (cm); NL: number of leaves; SD: stem diameter (mm); LL: leaf length (cm); LW: leaf width (cm); LFM: leaf fresh mass (t ha−1); LDM: leaf dry mass (t ha−1); SFM: stem fresh mass (t ha−1); SDM: stem dry mass (t ha−1); PFM: panicle fresh mass (t ha−1); PDM: panicle dry mass (t ha−1); TFM: total fresh mass (t ha−1); TDM: total dry mass (t ha−1).
Table 4. Averages followed by the standard deviation of the clusters formed in the multivariate analysis of the variables of biomass sorghum cultivars, grown in the intercropping and monoculture systems during two sowing seasons (June to September 2021 and from December 2021 to May 2022), resulting from the cluster analysis by the hierarchical method.
Group 1Group 2Group 3Group 4Group 5Group 6
VariablesAverageSDAverageSDAverageSDAverageSDAverageSDAverageSD
HT388.9715.32353.4014.12361.9318.67157.8914.18162.7612.63143.2713.19
NL17.101.0217.700.8616.112.117.570.477.440.557.401.13
SD28.592.4628.541.9625.982.1717.161.2716.680.9916.001.03
LL85.846.4893.931.7680.8710.2777.5811.9283.897.4065.847.18
LW10.540.9711.020.3410.250.938.670.768.640.897.930.47
LFM26,698.987121.3416,442.861755.8912,198.242625.238027.723018.724495.24878.782842.721008.38
LDM10,631.631780.585931.46475.434689.97853.313007.991243.201627.89265.281204.49356.23
SFM136,600.3518,996.2070,821.4311,433.1266,198.988957.3331,317.1810,892.6717,203.973189.8912,137.963727.37
SDM42,494.227082.0223,946.093333.3222,069.673268.8914,554.086760.207090.931844.794698.781764.54
PFM9754.761309.579362.931010.916128.001964.957052.04649.513359.07767.513978.981115.29
PDM4843.88467.944283.16379.492804.82801.693856.29487.791808.05445.822414.29610.80
TFM173,054.0925,399.6896,627.2112,942.9384,525.2311,974.3046,396.9414,029.1325,058.284582.0518,959.665080.48
TDM57,969.738727.9434,160.723576.6929,564.464421.6921,418.377875.9610,526.872268.818317.552045.72
Test FG1 × G2G1 × G3G1 × G4G1 × G5G1 × G6G2 × G3G2 × G4G2 × G5G2 × G6G3 × G4G3 × G5G3 × G6
201.28 **169.95 **495.77 **365.17 **516.23 **150.71 **244.86 **122.05 **377.71 **236.75 **274.24 **434.55 **
G4 × G5G4 × G6G5 × G6
30.82 **43.67 **53.78 **
SD: standard deviation; HT: height (cm); NL: number of leaves; SD: stem diameter (mm); LL: leaf length (cm); LW: leaf width (cm); LFM: leaf fresh mass (t ha−1); LDM: leaf dry mass (t ha−1); SFM: stem fresh mass (t ha−1); SDM: stem dry mass (t ha−1); PFM: panicle fresh mass (t ha−1); PDM: panicle dry mass (t ha−1); TFM: total fresh mass (t ha−1); TDM: total dry mass (t ha−1). ** 1% significance.Groups 1, 2, and 3 were represented by the growing season in December (season 2), which presented a maximum temperature of 35.33 °C and precipitation of 340.90 mm. Meanwhile, groups 4, 5, and 6 covered season 1, with a maximum temperature of 38.33 °C and precipitation of 21.20 mm. Groups 1, 2, and 3 showed the best performance for biometric and yield variables (Table 4), except for leaf length (LL) and panicle fresh mass (PFM), which were not significant for grouping treatments.
Table 5. Pearson’s linear correlation matrix (p < 0.05) involving variables of cowpea (BRS Carijó. BRS Guariba, BRS Gurguéia, and BRS Itaim) grown in the intercropping and monoculture systems during two sowing seasons (June to September 2021 and December 2021 to May 2022).
VariablesTNPPLPDNGPPWPGW
TNP1.00
PL0.041.00
PD−0.44−0.331.00
NGP0.330.54−0.751.00
PW0.460.290.030.151.00
PGW0.430.290.030.110.991.00
Bolded values were significant at the 5% probability level. TNP: total number of pods; PL: pod length (cm); PD: pod diameter (mm); NGP: number of grains per pod; PW: pod weight (t ha−1); PGW: pod grain weight (t ha−1).
Table 6. Averages followed by the standard deviations of the groups formed in the multivariate analysis of variables of cowpea grown in the intercropping and monoculture systems during two sowing seasons (June to September 2021 and December 2021 to May 2022) resulting from the cluster analysis by the hierarchical method.
Group 1Group 2Group 3Group 4Group 5Group 6
VariablesAverageSDAverageSDAverageSDAverageSDAverageSDAverageSD
TNP12.631.4012.171.6911.402.6113.222.858.811.1111.132.21
PL16.331.2816.800.7617.331.1116.440.5216.030.9415.361.14
PD7.660.326.550.256.650.216.210.347.480.567.280.42
NGP8.811.2812.632.4610.041.1614.220.428.411.028.210.87
PW3217.40434.792887.16499.011579.53377.501405.92309.58782.39226.431129.87340.37
PGW2554.12326.632312.60520.131319.06353.971072.75269.73662.47193.76910.08242.09
Test FG1 × G2G1 × G3G1 × G4G1 × G5G1 × G6G2 × G3G2 × G4G2 × G5G2 × G6G3 × G4G3 × G5G3 × G6
78.52 *77.20 *876.29 **817.51 **2858.71 **49.96 *461.23 *11,604.27 **10,469.53 **4867.24 **123.99 **5566.20 **
G4 × G5G4 × G6G5 × G6
1122.30 **2625.23 **1031.21 **
SD: standard deviation; TNP: total number of pods; PL: pod length (cm); PD: pod diameter (mm); NGP: number of grains per pod; PW: pod weight (t ha−1); PGW: pod grain weight (t ha−1). ** 1% and * 5% significance.
Table 7. Efficient land use (ELU) of biomass sorghum and cowpea cultivars in the intercropping and monoculture systems during two sowing seasons (season 1 and season 2).
SeasonsTreatmentsELU
1BRS 716 + BRS Itaim0.79
BRS 716 + BRS Gurguéia0.97
BRS 716 + BRS Guariba0.86
BRS 716 + BRS Carijó1.00
Agri-002E + BRS Itaim0.72
Agri-002E + BRS Gurguéia1.00
Agri-002E + BRS Guariba0.59
Agri-002E + BRS Carijó0.88
2BRS 716 + BRS Itaim0.97
BRS 716 + BRS Gurguéia1.03
BRS 716 + BRS Guariba
BRS 716 + BRS Carijó
1.02
1.17
Agri-002E + BRS Itaim0.89
Agri-002E + BRS Gurguéia0.81
Agri-002E + BRS Guariba
Agri-002E + BRS Carijó
0.75
0.94
ELU: efficient use of land. Bolded values are equal to or higher than 1.0.
Disclaimer/Publisher’s Note: The statements, opinions and data contained in all publications are solely those of the individual author(s) and contributor(s) and not of MDPI and/or the editor(s). MDPI and/or the editor(s) disclaim responsibility for any injury to people or property resulting from any ideas, methods, instructions or products referred to in the content.

