Article

Assessing the Capabilities of UV-NIR Spectroscopy for Predicting Macronutrients in Hydroponic Solutions with Single-Task and Multi-Task Learning

Institute of Facility Agriculture, Guangdong Academy of Agricultural Science, Guangzhou 510640, China
*
Author to whom correspondence should be addressed.
Agronomy 2024, 14(9), 1974; https://doi.org/10.3390/agronomy14091974 (registering DOI)
Submission received: 1 July 2024 / Revised: 22 July 2024 / Accepted: 29 August 2024 / Published: 1 September 2024
(This article belongs to the Special Issue The Application of Near-Infrared Spectroscopy in Agriculture)

Abstract

:
Macronutrients, including nitrogen (N), phosphorus (P), potassium (K), calcium (Ca), magnesium (Mg), and sulfur (S), are the most basic nutrient elements in the solution for the hydroponic system. However, the current management of hydroponic nutrient solutions usually depends on EC and pH sensors due to the lack of accurate specific macronutrient sensing equipment, which easily leads to nutritional imbalance for the cultivated plant. In this study, the UV-NIR absorption spectroscopy (200–1100 nm) was used to predict six macronutrients in hydroponic solutions; two kinds of single-task learning algorithms, including partial least squares (PLS) and least absolute shrinkage and selection operator (LASSO), and two kinds of multi-task learning algorithms, including dirty multi-task learning (DMTL) and robust multi-task learning (RMTL), were investigated to develop prediction models and assess capabilities of UV-NIR. The results showed that N and Ca could be quantitatively predicted by UV-NIR with the ratio of performance to deviation (RPD) more than 2, K could be qualitatively predicted (1.4 < RPD < 2), and P, Mg, and S could not be successfully predicted (RPD < 1.4); the RMTL algorithm outperformed others for predicting K and Ca benefit from the underlying task relationships with N; and predicting P, Mg, and S were identified as irrelevant (outlier) tasks. Our study provides a potential approach for predicting several macronutrients in hydroponic solutions with UV-NIR, especially using RMTL to improve model prediction ability.

1. Introduction

The hydroponic culture provides a more accurate control of environmental conditions to allow a more efficient use of water and fertilizers that may increase production and improve the quality of crops [1,2]. Increasingly, the nutrient solutions are recirculated and reused to reduce environmental pollution and economic costs [3]. Due to the lack of in-situ accurate detection methods of nutrients in the hydroponic system, the current existing mode of nutrient solution management system usually depends on an EC (electric conductivity) sensor [4,5], which is an indicator of total ion concentrations, and pH sensor, which is used to adjust to the suitable acid and alkali environment [6]. Consequently, the EC-based nutrient measurement mode couldn’t provide the concentrations of individual nutrients in the solution, which easily leads to nutritional imbalance for the cultivated plant [7], and may result in the development of toxicity or deficiency symptoms and ultimately impair productivity [8].
Macronutrients, including nitrogen (N), phosphorus (P), potassium (K), calcium (Ca), magnesium (Mg), and sulfur (S) are the most basic nutrient elements in the solution for the hydroponic system, and the plant productivity [1,9]. Usually, macronutrients dissolved in water in ionic form, including nitrate NO3, ammonium NH4+, phosphate(PO43−,HPO42−,H2PO4), potassium ion K+, calcium ion Ca2+, magnesium ion Mg2+, and sulfate SO42−, with the characteristics of low content of concentrations, easy solubility in water, and having an ion state that is easily disturbed by environmental variables such as temperature and pH [4]. Thus, the hydroponic solution is a multi-component mixture with constantly changing parameters caused by crop growth and environment change, and macronutrients should be precisely and individually measured online for optimal management and supplement, and better in real time. Recently, ion-selective electrode (ISE) technology has been investigated by researchers to detect macronutrients in hydroponic solutions in situ and individually [10,11,12]; however, the problems of having an ion interference effect, being drift-prone, and having a short lifespan limit the application of ISE in the actual hydroponic work site [13,14].
Alternatively, with the advantages of rapid, direct, cost-effective, and effective online monitoring, the absorption spectroscopy analytical approach could be used in chemometrics to construct mathematical models for predicting the concentrations of macronutrients in hydroponic solutions [15]. UV-NIR absorption spectroscopy (200–1100 nm) has been widely used to directly detect nitrate [16,17,18], chemical oxygen demand [16,19,20], dissolved organic carbon [17,21,22], and other water attributes [15]. With respect to macronutrients in the hydroponic solutions, a UV-VIS spectroscopy (190–650 nm) based sensing system was designed to quantify the presence of N, P, and K, and the results showed that the self-learning artificial intelligence algorithm can find interference modes among a spectral database and perform feasible predictions [23]. Researchers extended their work to investigate the interferences within a complex matrix orthogonal test solution samples; quantitative results for N and K and qualitative results for P were obtained [24]. Spectroscopic IoT systems ranging from 410 nm to 940 nm were also proven as usable in monitoring N in nutrient solutions with an R2 of more than 0.9 [25]. To improve the prediction of P, the cobalt electrochemical data and the principle component of near infrared (NIR, 900–1700 nm) spectral data were fused to build an artificial neural network (ANN) estimation model, which can yield an R2 of 0.89 [26]. A modified molybdenum colorimetric method was proposed to obtain the visible range spectrum (400–800 nm), and the ANN model achieves an R2 of 0.86 [27]. In addition to the two mentioned methods that coupled with chemical technique, the machine learning models based on hybrid ensemble were also proved that could effectively increase the accuracy of UV-NIR for classifying the concentrations of P [28]. The predictions of Ca, Mg, and S using a spectroscopy analytical approach still need to be researched.
As mentioned above, the hydroponic solution is a kind of mixture composed of several inorganic salts; however, to the best of our knowledge, almost no nutrient has direct absorption wavebands except nitrate, which has been proven with several significant sensitive bands ranging from 200 to 300 nm [15,16,17,18,23]. The existence of interferences and overlapping signals between different nutrients may increase the misevaluation for the spectral chemometric prediction models [24], as commonly used intelligent learning algorithms treat the calibration and prediction of specific macronutrients independently as a single modeling task [23,27,28], which may lose sight of underlying cross-relatedness between different nutrients. As we proved before, multi-task learning could take advantage of underlying correlations to improve the prediction performance of regression models for predicting soil properties [29]. Thus, it is feasible to assume that the tasks of predicting macronutrients in hydroponic solutions are related.
The overarching aim of the study was to assess the capabilities of UV-NIR spectroscopy for predicting the individual concentrations of six macronutrients in hydroponic solutions with single-task and multi-task learning algorithms. The specific objectives are threefold: (1) investigate the predictive ability of UV-NIR spectroscopy to predict N, P, K, Ca, Mg, and S in hydroponic solutions; (2) compare the prediction performance of two selected multi-task learning algorithms with two traditional single-task ones; and (3) study the prediction mechanism and underlying correlations between different attributes of hydroponic solutions.

2. Materials and Methods

2.1. Sample Preparation

In this study, 5 basic nutritional formulations (NFs), that were used to plant tomato, sweet potato, lettuce, grape, and watermelon, respectively, in the Baiyun test base of Guangdong Academy of Agricultural Sciences were selected to produce the nutrient solution samples, shown in Table 1. The used chemical reagents of basic NFs included potassium nitrate (KNO3), magnesium sulfate heptahydrate (MgSO4·7H2O), ammonium dihydrogen phosphate (NH4H2PO4), potassium dihydrogen phosphate (KH2PO4), and calcium nitrate tetrahydrate (Ca(NO3)2·4H2O).
The application amounts of chemical reagents were changed to obtain more samples with different concentrations, specifically: for each chemical reagent of each basic NF, the application amount was evenly decreased by a 10 arithmetic series, to obtain 10 sub-NFs; and 10 random numbers generated between the min and max values of the just produced arithmetic sequences, were used as application amounts to obtain another 10 sub-NFs. Thus, 10 evenly varied sub-NFs and 10 randomly varied sub-NFs were derived from each of the five basic NFs, that is to say, a total of 100 sub-NFs with different application amounts, which can be seen in the Supplementary Materials, were used to make nutrient solution samples. The mixing and stirring for each sub-NF was operated under a stable indoor condition of 24 °C. The pH and EC values were measured with online detectors (Mettler-Toledo, Billerica, MA, USA) to assist in analysis after the homogeneous mixture of sample solutions. The descriptive statistics and the Pearson correlation coefficients (r) of the concentrations of six macronutrients and pH and EC values were used for statistical analyses.

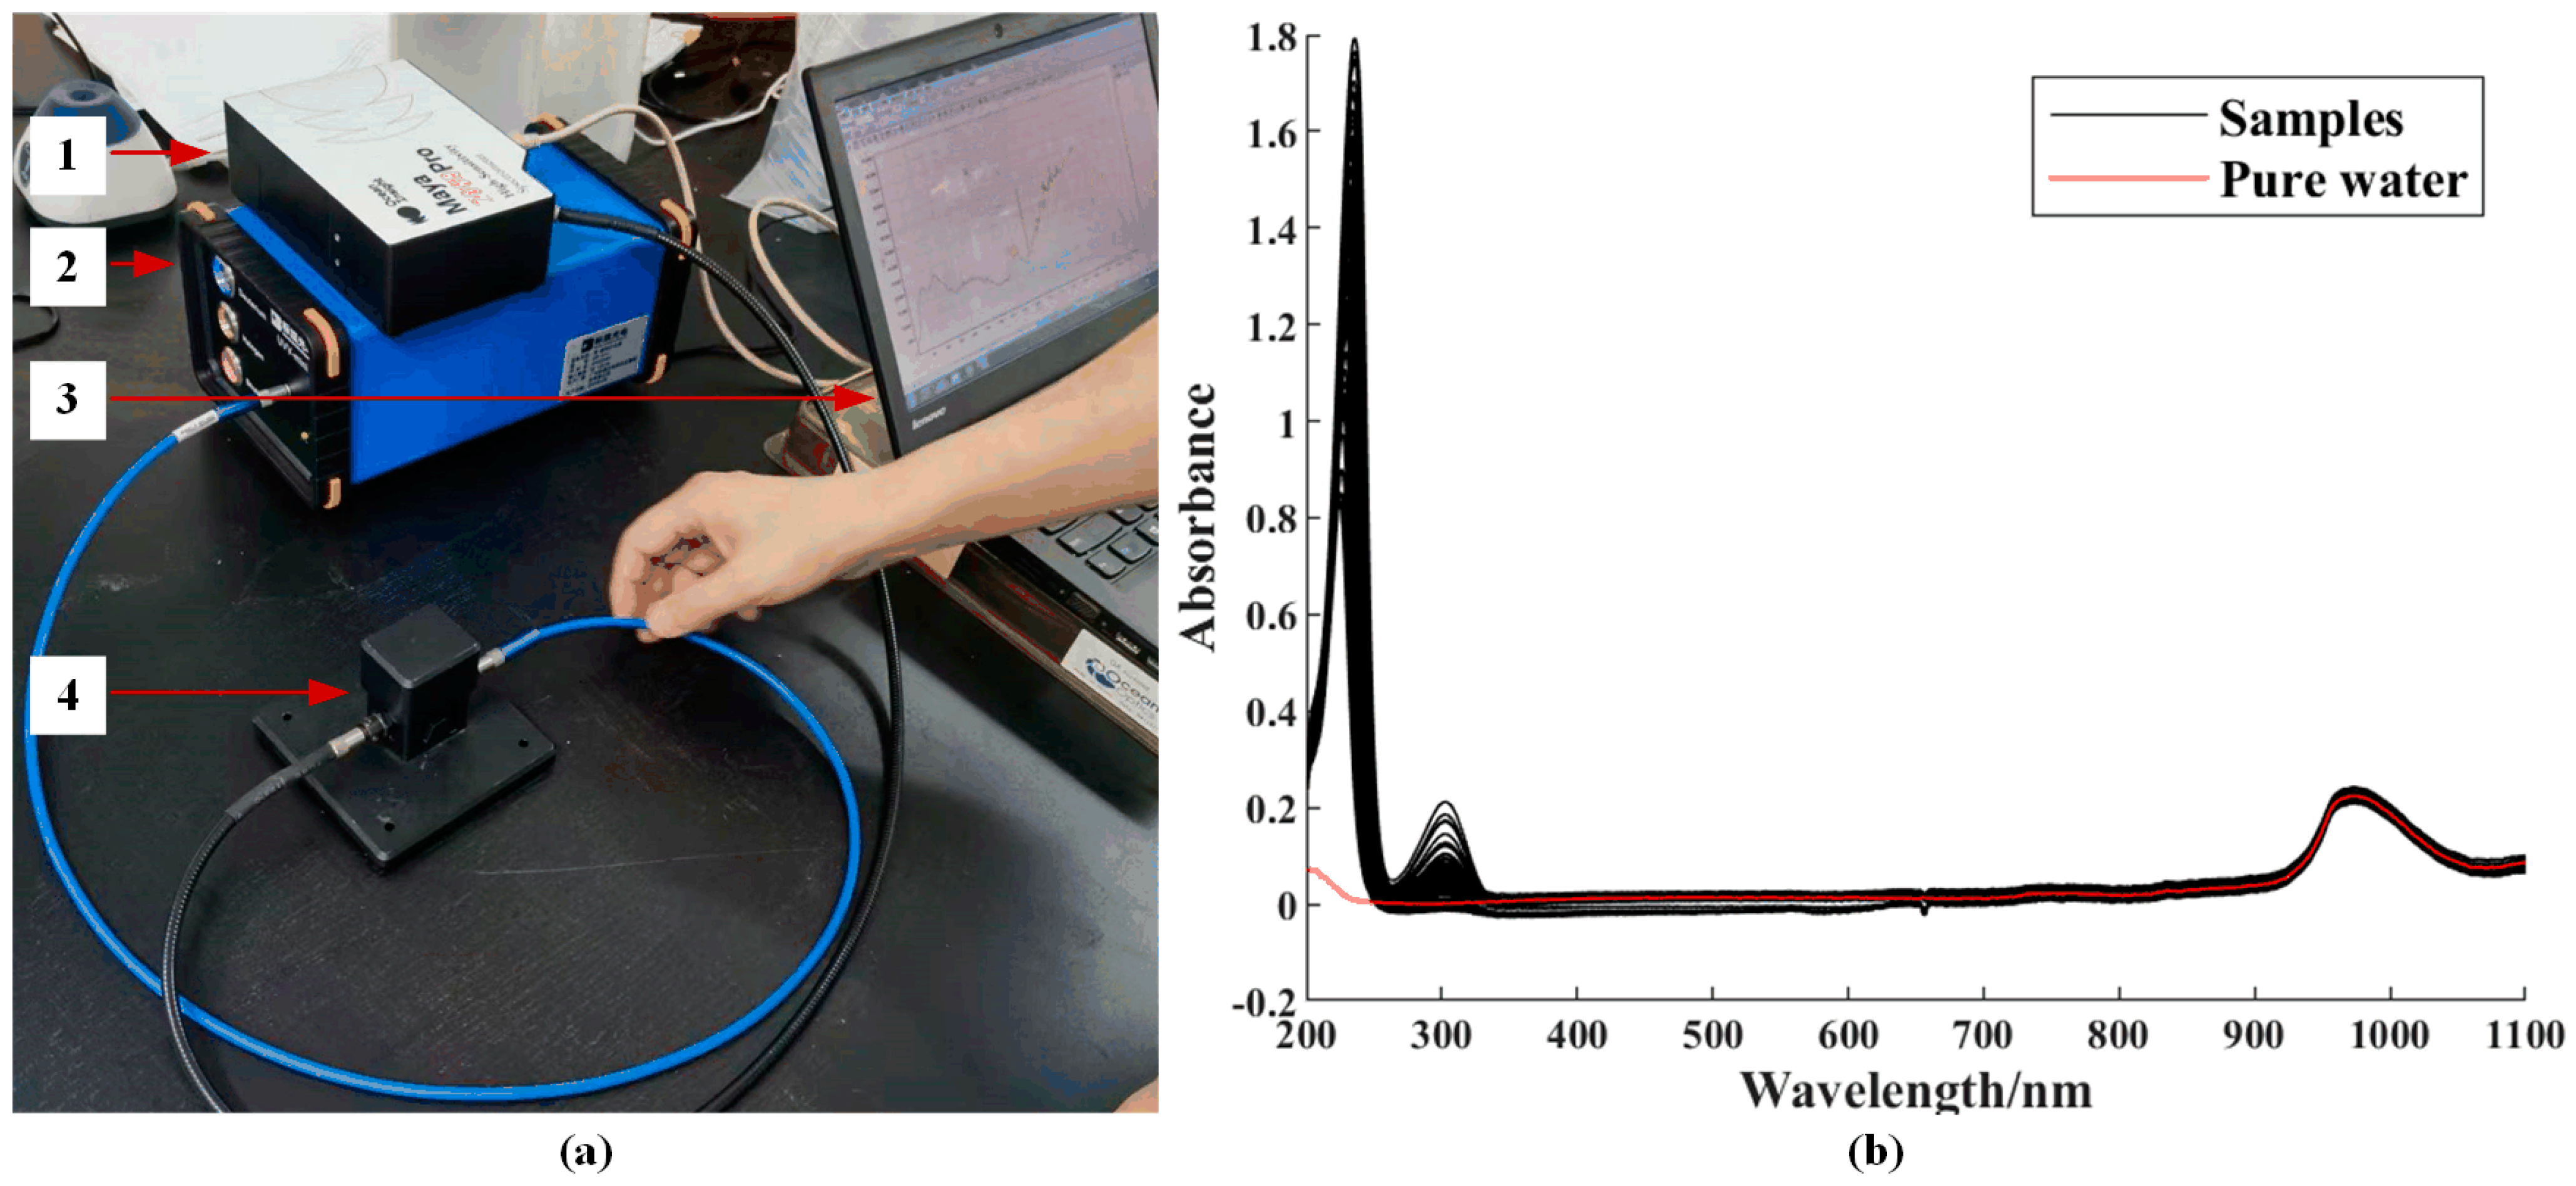
2.2. Spectral Collection and Preprocessing

During each spectral collection, the hydroponic solution sample was filled in an optical-grade quartz cell with a path length of 10 mm, which was placed in a specific holder with shading cover under a stable indoor environment. A combined deuterium and halogen light source was used to generate transmission spectra for the samples, and the transmission spectra were collected with a UV-VNIR (200–1100 nm) spectrometer (Maya2000Pro, Ocean Optics, Orlando, FL, USA) and a laptop with data collection software. Figure 1a shows the experiment conducted in action. Each sample was measured 100 times and averaged as the final spectra to reduce spectral noise. After the sample spectral collections, the reference and dark intensity of radiation were collected by an empty quartz cell with or without a light source, individually [16]. The absorbance of samples was calculated with transmission spectra based on reference and dark intensity of radiation [30], and the absorbance of pure water was also collected for analysis, as shown in Figure 1b. In order to further look into spectral response, the significant specific absorption peaks along the UV-VNIR were plotted and analyzed.
Spectral preprocessing and transformation have been proven to be an effective methodology to correct for non-linearity, measurement and sample variations, and noisy spectra [31,32]. In this study, we resampled the original spectral band to 1 nm along the entire spectral region of 200–1100 nm, and the Savitzky–Golay filtering algorithm with a second-order polynomial was selected to smooth the resampled absorption spectra [33]; the standard normal variate was performed to correct additive and multiplicative effects [34], and the first derivative was conducted to remove the baseline and improve the linear trends [35].

2.3. Learning Algorithms

In this study, the modeling tasks of 6 macronutrients share the same input independent variables, i.e., the preprocessed spectral matrix of 100 samples, which includes 898 wavebands, that is, high-dimensional data with multi-collinearity and redundancy inside [36]. The commonly used linear learning algorithms in spectral chemometrics usually overcome the problem of overfitting and improve the generalization performance by dimensionality reduction or feature selection. For linear single-task learning, the typical algorithms are partial least squares (PLS) (e.g., [26,27]) and least absolute shrinkage and selection operator (LASSO) (e.g., [37,38]), respectively. The PLS algorithm decomposes independent variables and dependent variables by linear combinations to extract latent variables (LVs, or components) and builds the regression model based on the LVs instead of the original input independent variables [39]. The LASSO algorithm defines a continuous shrinking operation using L 1 -norm regularization that can produce coefficients that are exactly zero, and hence retain the good characteristics of both subset selection and ridge regression, which can provide a sparse and interpretable model [40].
Multi-task learning aims to improve the performance of multiple related learning tasks by leveraging useful information among them [41,42]. Typically, with respect to linear learning algorithms, the dirty multi-task learning (DMTL) algorithm decomposes the regression coefficient matrix W (features × tasks) into a block-sparse matrix W B (corresponding to the shared features) and an elementwise sparse matrix W E (corresponding to the non-shared features) [43,44], that can take advantage of the shared feature structure (block-sparse) between each task and model all the tasks simultaneously with L 1 / L block-sparse regularization [45,46]. Mathematically, the object function is
min W i = 1 t W i T X i Y i F 2 + λ B W B 1 , + λ E W E 1
s u b j e c t   t o : W = W B + W E
where X i is the spectral matrix of task i that is the same for each task in this study, Y i is the predicted variable of task i , and λ B and λ E are regularization parameters to control the degree of penalty on W B and W E , respectively.
In addition to shared features, linear multi-task learning can also capture the task relationship by constraining the tasks share a low-dimensional subspace, i.e., W is of low rank, and the trace norm regularization has been widely used to replace and solve the rank minimization problem (e.g., [47,48]). Usually, the assumption that all models share a common low-rank structure is restrictive in many real-world applications. Thus, the robust multi-task learning (RMTL) algorithm was proposed to identify the irrelevant (outlier) tasks as well as learn multiple tasks simultaneously [49]. Similar to DMTL, RMTL also decomposes the W into two parts, i.e., a low-rank structure W L (obtained by trace norm regularization) to capture the task relationships, and a group-sparse structure W S (obtained by L 2,1 norm regularization) to identify the outlier tasks [44]. RMTL is formulated as
min W i = 1 t W i T X i Y i F 2 + λ L W L * + λ S W S 1,2
s u b j e c t   t o : W = W L + W S
where X i is the spectral matrix of task i that is the same for each task in this study, Y i is the predicted variable of task i , and λ L and λ S are regularization parameters to control the degree of penalty on W L and W S , respectively.

2.4. Modelling and Evaluation

The Kennard–Stone algorithm [50] was applied to the original spectral matrix data to divide the total 100 samples into calibration and validation sets with a split ratio of 0.7 to 0.3. Thus, 70 samples were selected as the calibration set (also used for cross-validation during training) and the remaining 30 as the validation set (independent testing for the established model). As different predicting variables (macronutrients) vary in numerical ranges, to make every variable contribute equally to the regression analysis, both the calibration and validation sets were standardized by scaling their mean and standard deviations to 0 and 1 [51], respectively. To avoid overfitting or underfitting, a 10-fold cross-validation based on the smallest mean squared error with 100 hundred random repetitions was individually used in model calibrations to determine the optimal parameters of the used learning algorithms, including the number of LVs of PLS and the regularization parameters of LASSO, DMTL, and RMTL.
According to the regression evaluation framework that we proposed before [31], the prediction accuracy of the regression models was validated and compared with the ratio of performance to deviation (RPD): category A (RPD > 2.0) with good accuracy indicating quantitative prediction ability; category B (1.4 < RPD < 2.0) with moderate accuracy indicating qualitative prediction ability; and category C (RPD < 1.4) with poor accuracy indicating ineffective prediction ability [52]. The ratio between the interpretable sum squared deviation and the total sum squared deviation (SSR/SST) was also used to assist evaluation; usually, the SSR/SST should be greater than 0.5 to ensure the interpretability of the calibration model [53]. The RPD and SSR/SST are calculated as
RPD = SD / RMSE = m i = 1 m y i y ¯ 2 / i = 1 m f x i y i 2 / m 1
SSR / SST = i = 1 m f x i y ¯ 2 / i = 1 m y i y ¯ 2
In order to further explore the prediction capabilities and mechanism of UV-NIR for predicting six macronutrients in hydroponic solutions, the regression coefficients of sparse models built by LASSO were used to distinguish essential wavebands for predicting specific macronutrients [38,46]. The variable importance for projection (VIP) scores obtained by PLS was applied to identify important wavebands for predicting models when the score was greater than 1 [54]. For the DTML and RMTL models, we also plotted the regression coefficient matrixes to analyze the shared features and the correlated or outlier tasks.
All mathematical analysis methods mentioned above were conducted in MATLAB R2021b (MathWorks, Natick, MA, USA). The processes of multi-task learning were carried out with MALSAR Version 1.1 [44].

3. Results and Discussion

3.1. Characteristics of the Content of Nutrients

Table 2 shows the descriptive statistics of the concentrations of six macronutrients and pH and EC values of the 100 samples used for calibrating and validating the regression models. The results showed high variation with a significant range of change in all six macronutrients, indicating that the data could be used for the regression analysis. The STD of pH was significantly small, indicating the pH values in the sample dataset were relatively consistent. Among the macronutrients, the concentrations of N, K, and Ca were higher, with mean values of more than 100 mg/L.
Table 3 shows the Pearson correlation coefficients (r) between different variables. Bold underlined values indicate strong positive correlations (r ≥ 0.8) [55], which were found between EC and N/K/Ca, N and K/Ca, and Mg and S. Bold italic values indicate moderately positive correlations (0.6 ≤ r < 0.8), which were found between EC and P/Mg, N and P/Mg, P and K/Ca/Mg, K and Ca, Ca and Mg. In addition, it was found that pH has significant negative correlations with all other detecting variables, especially with P, which is an element that occurs in forms that are strongly dependent on environment pH [1].

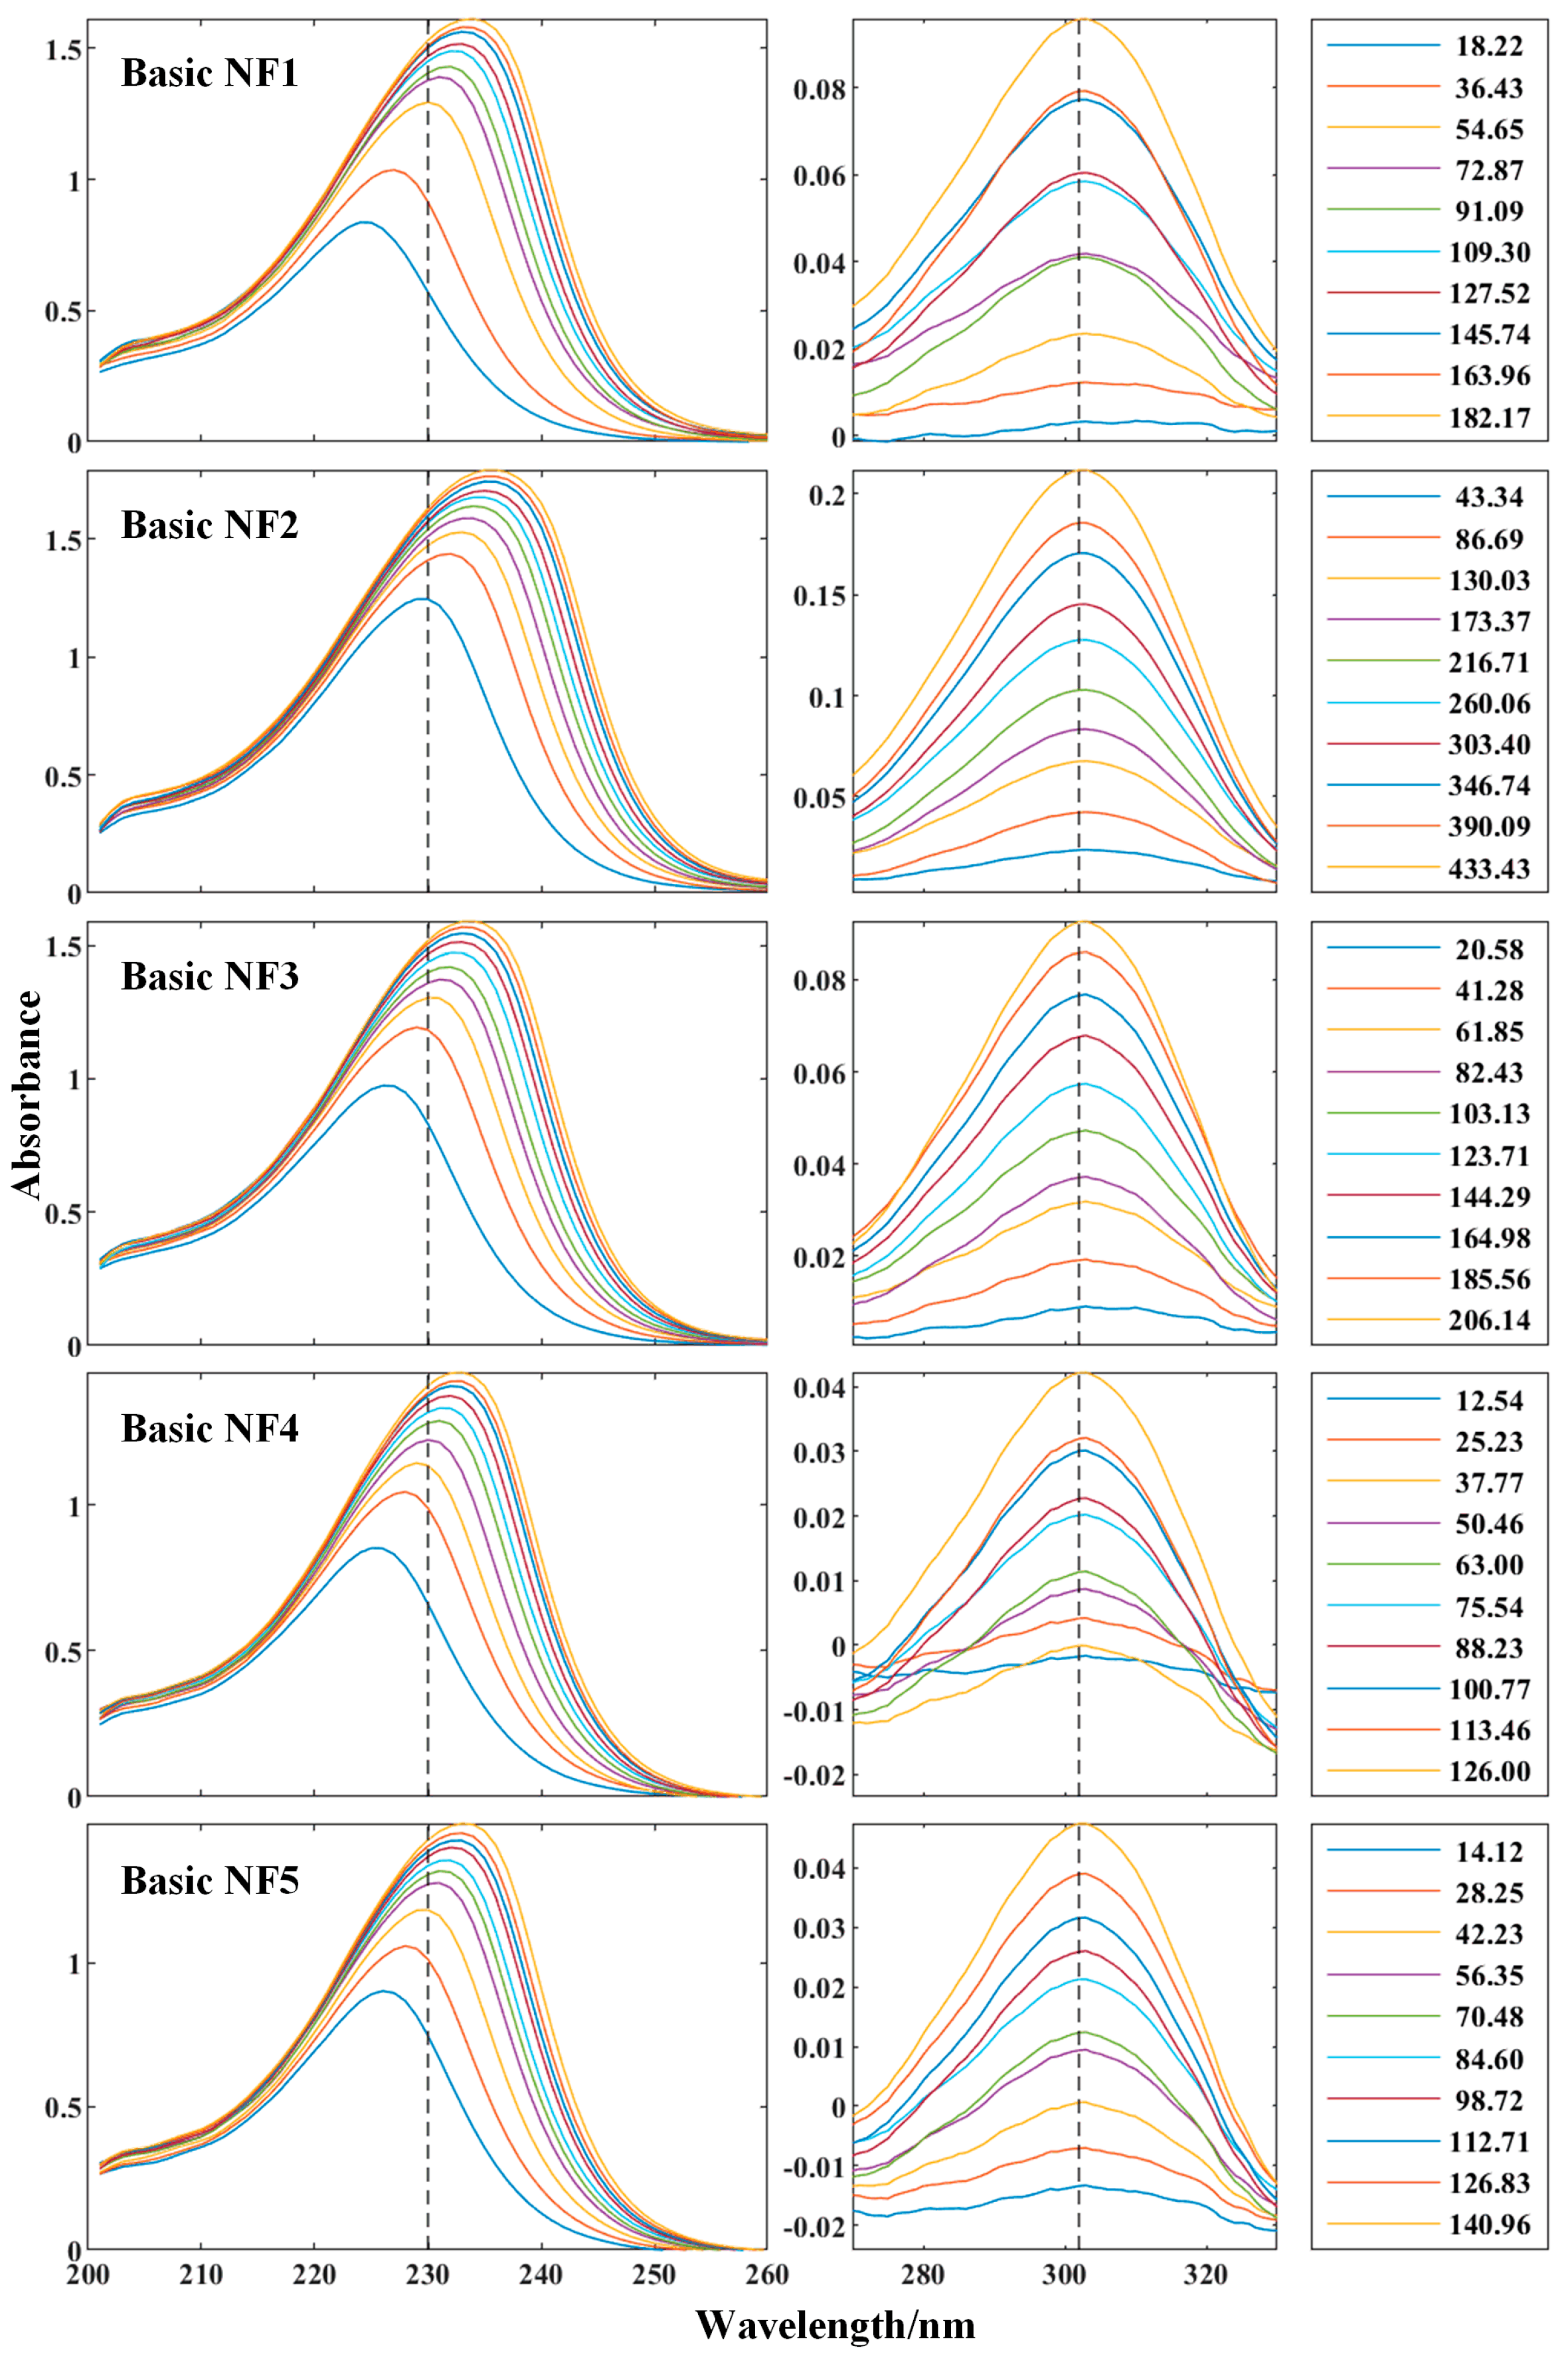
3.2. Spectral Response

Figure 1b shows the absorbance along the UV-NIR range of 100 hydroponic solution samples and pure water. As seen, three significant absorption peaks showed around 230 nm, 302 nm, and 975 nm for the samples. Particularly, the absorption peaks around 230 nm and 302 nm of the evenly decreased 10 samples of five basic NFs are presented in Figure 2, and the absorbance of both peaks became significantly larger with the increase in N’s concentrations; in addition, the first one moved from 225 nm to 236 nm and the second one with a stable center of 302 nm, which was proven to be generated by nitrate in the samples [15,16,17,18,23], and thus pure water had no response. The absorption peak around 975 nm is one of the water absorption bands [30,56], and thus both samples and pure water have similar absorption characteristics.

3.3. Model Performance

3.3.1. Prediction Results

To comprehensively evaluate the selected four learning algorithms, the indicators including the used parameters, the numbers of used features, and prediction results of PLS, LASSO, DMTL, and RMTL models for predicting six macronutrients were employed and are presented in Table 4. The numbers of LVs and the regularization parameters were determined via 10-fold cross-validation during model calibration. We assessed the capabilities of UV-NIR for predicting macronutrients by RPD and SSR/SST values regarding the independent validation set. The prediction accuracies of N and Ca with four learning algorithms were categorized as A (RPD > 2) for RPDs ranging from 7.50 to 9.89 with SSR/SSTs more than 0.84, indicating good prediction ability. The prediction accuracies of K were categorized as B (1.4 < RPD < 2) with RPD ranging from 1.45 to 1.68 for four models, and SSR/SSTs more than 0.76, indicating moderate prediction ability. However, the prediction accuracies of P, Mg, and S were categorized as C with RPDs < 1.4, confirming ineffective prediction ability. In addition, the best prediction of N was obtained by LASSO with RPD = 10.12 and SSR/SST = 0.9, the best prediction of Ca was obtained by RMTL with RPD = 4.35 and SSR/SST = 0.81, and the best prediction of K was also obtained by RMTL with RPD = 1.73 and SSR/SST = 0.93.

3.3.2. Comparison of Different Algorithms

In this study, two kinds of single-task learning algorithms, including PLS and LASSO, and two kinds of multi-task learning algorithms, including DMTL and RMTL, were investigated to develop prediction models for six macronutrients in hydroponic solutions. For the calibration set, the single-task models of PLS for predicting S and LASSO for predicting Mg and S were invalid with RPDs < 1.4 or SSR/SSTs less than 0.5. However, all six macronutrients gained high prediction accuracies that could be categorized as A (RPD > 2) with the multi-task models of DMTL and RMTL; the prediction ability of P, Mg, and S were especially significantly improved, which showed as invalid or moderate with single-task models. In addition, what needs to be illustrated is that all of the four algorithms had the same accuracy categories for six macronutrients of the validation set; the best RPD value of N was obtained by LASSO, and the best RPD values of K and Ca were obtained by RMTL. It could be concluded that the multi-task learning algorithms usually had a stronger learning ability, benefiting from the underlying relevant information compared to single-task learning algorithms. However, significant overfitting could be seen in multi-task models of DMTL and RMTL, and the performance of generalization ability still needs to be optimized.
The PLS models were calibrated based on LVs extracted from the preprocessed spectra and the RMTL were calibrated based on shared low-rank structure, and thus PLS and RMTL have the common characteristic of dimensionality reduction that can produce derived models [53], and all of the 898 wavebands were used as model input. However, the LASSO models and DMTL models were calibrated based on feature selection, and only parts of wavebands were used, which can produce sparse models. The difference in feature distribution between derived models and sparse models can be seen in Figure 3 and Figure 4. In addition, the SSR/SST values of derived models were higher than sparse models of N, K, and Ca for the validation set (shown in Table 4), indicating stronger explanatory power. This result might be because the feature selection removed useful information and resulted in the low explanatory power of sparse models.

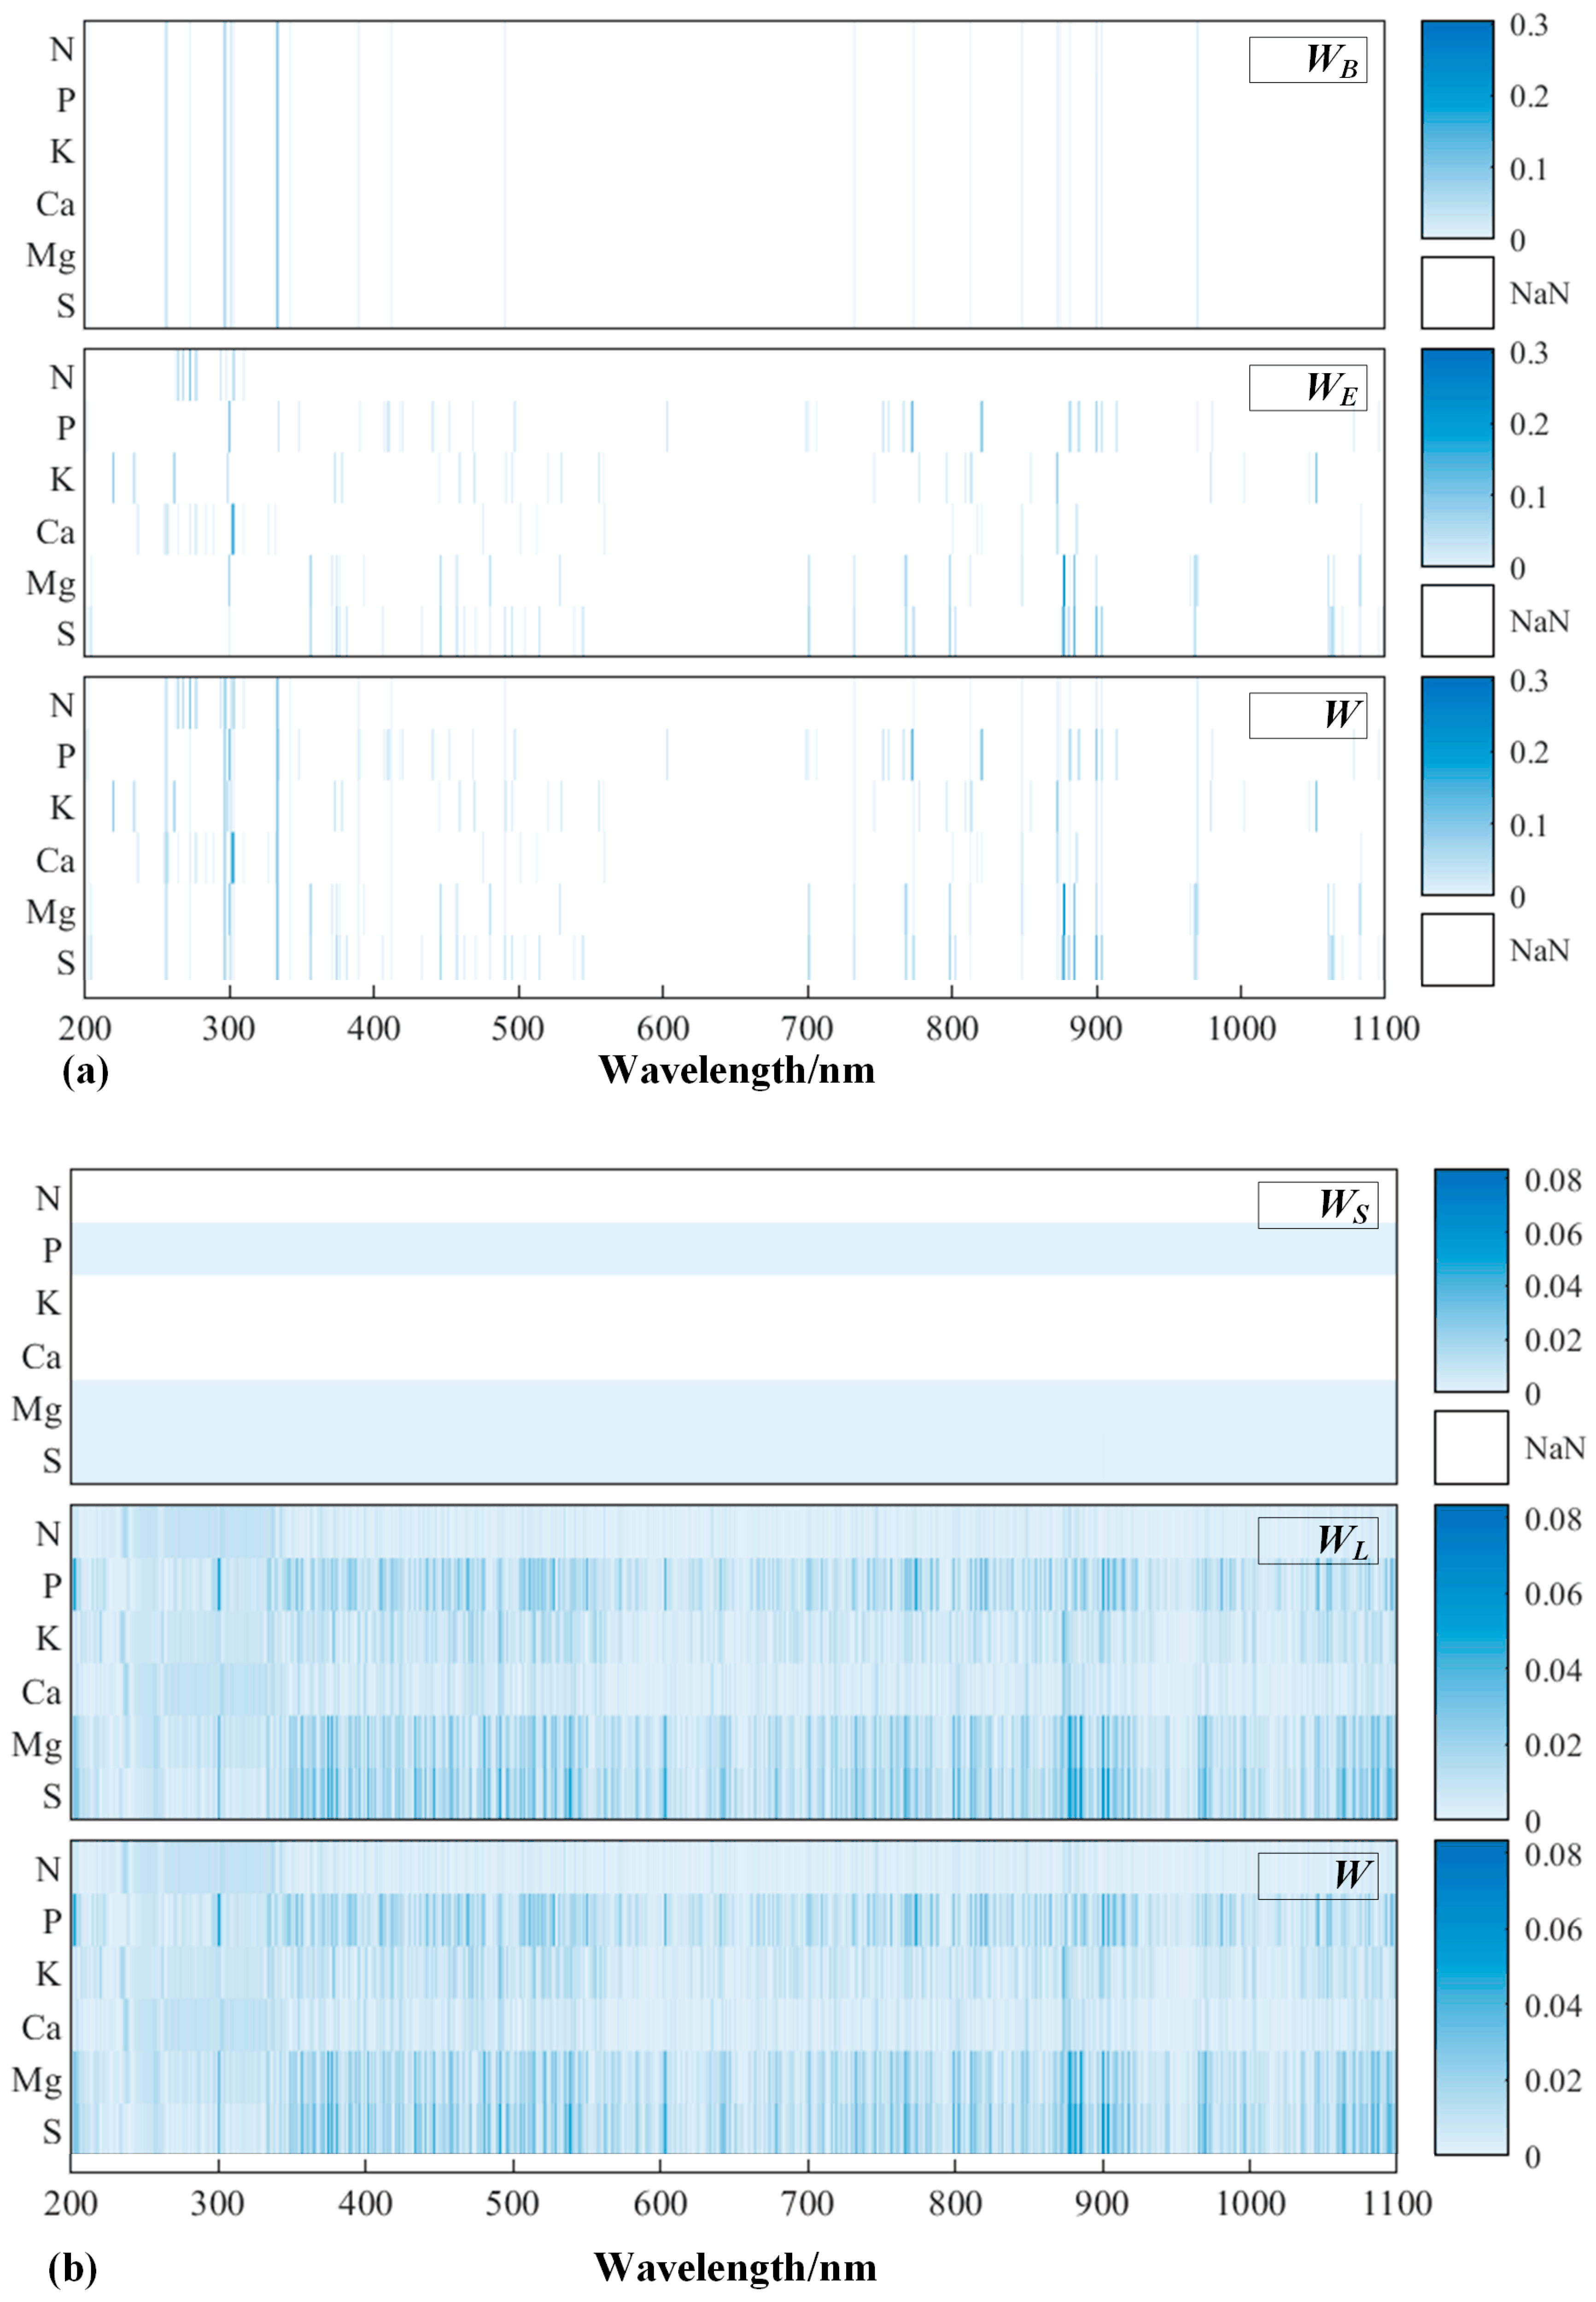
3.3.3. Interpretation of the Prediction Mechanism

Figure 3 shows the distributions of the VIP scores over the entire UV-NIR wavelength range of the PLS models for predicting six macronutrients; when the score was greater than 1, the waveband is important for the specific macronutrient prediction model and the distributions of the regression coefficients of the LASSO models; when the coefficient was nonzero, the waveband was selected as the model’s input feature. As can be seen, the distributions of the important wavebands of PLS models and selected features of the LASSO models showed similar characteristics, and most of them were concentrated in the UV region (200–380 nm) or the short-wave NIR region (780–1100 nm). Particularly, the N was accurately predicted by LASSO with 12 wavebands and the significant features, including 280 nm, 276 nm, and 306 nm, were all around the absorption peak of 302 nm, which is the index of nitrate (Figure 2); the K was predicted by LASSO with 18 wavebands and the significant features included 277 nm, 1053 nm, 337 nm, 237 nm, 265 nm, etc.; the Ca was accurately predicted by LASSO with 25 wavebands and the significant features were 306 nm, 305 nm, 280 nm, 269 nm, 874 nm, etc. These three sets of significant features obtained by LASSO models were also recognized as the important wavebands by the corresponding PLS models. Furthermore, it is worth mentioning that several specific significant features were shared among six macronutrients, especially for N, K, and Ca, with good or moderate prediction ability, including 276 nm or 277 nm, which were shared by N and K, 280 nm shared by N and Ca, and 306 nm shared by N and Ca. However, P, Mg, and S did not have significant shared features with N, and thus the predictions were unsuccessful.
Figure 4a shows the nonzero regression coefficients of the block-sparse matrix W B , the elementwise sparse matrix W E , and the combined regression coefficient matrix W of DMTL models. Accordingly, 23 shared features for predicting six macronutrients were obtained by W B , and significant shared features included 300 nm, 336 nm, 337 nm, 260 nm, 304 nm, 971 nm, 259 nm, 901 nm, 850 nm, 876 nm, 306 nm, etc. Regrettably, only five of them were shared by the N, K, and Ca of the LASSO models, including 337 nm shared by K, 850 nm shared by Ca, 306 nm shared by N and Ca, 276 nm shared by N and K, and 874 shared by K and Ca. Most other shared features were shared by the other three macronutrients with low prediction ability, and thus it is hard to improve the prediction abilities for P, Mg, and S with the DMTL algorithm, and the prediction abilities for N, K, and Ca were not outstanding compared to the single-task models.
Figure 4b shows the regression coefficients of the low-rank structure W L , the group-sparse structure W S , and the combined regression coefficient matrix W of RMTL models. It can be seen clearly that the regression coefficients of the group-sparse structure W S for predicting P, Mg, and S were nonzero, which means regression modeling for predicting P, Mg, and S were identified as outlier tasks. On the other hand, regression modeling for predicting N, K, and Ca were correlated tasks that might caused by shared features, and Pearson correlation coefficients also proved strong positive correlations of N, K, and Ca (Table 3). As a result, the underlying task relationships could improve the prediction ability of K and Ca regarding RPD values, as illustrated in Table 4. In addition, the RPD of RMTL for predicting N was slightly decreased compared to LASSO, which might be due to the overall smallest mean squared error during the parameters optimization.
Based on the above-shown analysis, it can be inferred that, for the six macronutrients, K and Ca have significant shared features with N for the LASSO and PLS models, and regression modeling for predicting N, K, and Ca were also identified as correlated tasks by the RMTL algorithm. Thus, the benefit from the significant spectral absorptions of N in the UV-NIR, N, K, and Ca could be nicely or moderately predicted, but P, Mg, and S could not.

3.3.4. Comparison with Previous Studies

Our results demonstrated that N and Ca could be quantitatively predicted by UV-NIR, K could be qualitatively predicted, and P, Mg, and S could not be successfully predicted.
Previous studies have made great efforts to improve the capabilities of spectral regression models for predicting macronutrients in hydroponic solutions. Specifically, N could be easily and quantitatively predicted [23,24,25], as with our results. P has received more attention; artificial intelligence algorithms (e.g., [23]) and those coupled with chemical techniques (e.g., [26]) are commonly used methods that can achieve quantitative prediction for P. K could also be quantitatively predicted based on artificial intelligence algorithms [23,24]. The prediction capabilities of P and K in previous studies outperform our results, except for the use of chemical techniques, which is possibly due to the linear learning algorithm or the volume of the sample set that we used, which could have limited the capabilities of UV-NIR. However, the underlying correlations and prediction mechanism that we found could be the base of artificial intelligence algorithms for future research.
In addition, this study is the first attempt to use spectral regression for predicting the concentrations of Ca, Mg, and S, which are also important macronutrients in hydroponic solutions.

4. Conclusions

The results of single-task and multi-task models illustrate the capability of UV-NIR for predicting macronutrients in hydroponic solutions; specifically, the following conclusions could be drawn in this study:
  • N and Ca could be predicted with good accuracy (RPD > 2), K could be predicted with moderate accuracy (1.4 < RPD < 2), and P, Mg, and S could not be successfully predicted (RPD < 1.4);
  • Significant spectral absorptions mainly caused by N could be found around 230 nm and 302 nm, and regression features were thereby generated. Other macronutrients did not show any obvious absorption characteristic along UV-NIR, but K and Ca have significant shared features with N;
  • Multi-task algorithms usually showed stronger learning ability compared to single-task algorithms, especially with RMTL, which could improve prediction performance for relevant tasks, namely predicting K and Ca and identifying the irrelevant (outlier) tasks—predicting P, Mg, and S.
Future work should evaluate the practical use of nonlinear artificial intelligence multi-task algorithms and long-wave NIR region (1100–2500 nm) for improving the prediction capability of macronutrients in hydroponic solutions, especially for P, Mg, and S, and more in situ hydroponic solution samples should be used to calibrate more robust prediction models for achieving scientific and precise management of hydroponic culture.

Supplementary Materials

The following supporting information can be downloaded at: https://www.mdpi.com/article/10.3390/agronomy14091974/s1, Table S1: The application amounts of chemical reagents of 100 sub-NFs (nutritional formulations) used for making nutrient solution samples.

Author Contributions

Conceptualization, H.Q. and X.Z.; methodology, H.Q. and B.L.; software, H.Q.; validation, Y.L., B.L. and X.Z.; formal analysis, H.Q. and Y.L.; investigation, J.N.; resources, J.N.; data curation, H.Q. and Y.Y.; writing—original draft preparation, H.Q.; writing—review and editing, H.Q. and X.Z.; visualization, H.Q. and Y.Y.; funding acquisition, H.Q. and X.Z. All authors have read and agreed to the published version of the manuscript.

Funding

This research was funded by the National Natural Science Foundation of China (62405066), Special Project for Science and Technology Innovation Strategy (Construction of Agricultural Research Main Force) (R2023PY-JX013), Special Fund Project for Introducing Scientific and Technological Talents of Guangdong Academy of Agricultural Sciences (R2022YJ-YB2002), and Special Fund for Rural Revitalization of Guangdong Province (2024TS-1-3).

Data Availability Statement

Data are available upon request due to restrictions.

Conflicts of Interest

We confirm that the manuscript has been read and approved by all named authors and that there are no other persons who satisfied the criteria for authorship but are not listed. We further confirm that the manuscript has been approved by all authors.

References

  1. Trejo-Téllez, L.I.; Gómez-Merino, F.C. Nutrient Solutions for Hydroponic Systems. In Hydroponics—A Standard Methodology for Plant Biological Researches; IntechOpen: London, UK, 2012; ISBN 978-953-51-0386-8. [Google Scholar]
  2. Sambo, P.; Nicoletto, C.; Giro, A.; Pii, Y.; Valentinuzzi, F.; Mimmo, T.; Lugli, P.; Orzes, G.; Mazzetto, F.; Astolfi, S.; et al. Hydroponic Solutions for Soilless Production Systems: Issues and Opportunities in a Smart Agriculture Perspective. Front. Plant Sci. 2019, 10, 923. [Google Scholar] [CrossRef] [PubMed]
  3. Bugbee, B. Nutrient Management in Recirculating Hydroponic Culture. In Proceedings of the South Pacific Soilless Culture Conference, Palmerston North, New Zealand, 10–13 February 2003; Acta Hort: Brussels, Belgium, 2004; Volume 648, pp. 99–112. [Google Scholar]
  4. Son, J.E.; Kim, H.J.; Ahn, T.I. Chapter 20—Hydroponic systems. In Plant Factory, 2nd ed.; Kozai, T., Niu, G., Takagaki, M., Eds.; Academic Press: Cambridge, MA, USA, 2020; pp. 273–283. ISBN 978-0-12-816691-8. [Google Scholar]
  5. Surantha, N. Intelligent Monitoring and Controlling System for Hydroponics Precision Agriculture. In Proceedings of the 2019 7th International Conference on Information and Communication Technology (ICoICT), Kuala Lumpur, Malaysia, 24–26 July 2019; pp. 1–6. [Google Scholar]
  6. Wada, T. Chapter 1.1—Theory and Technology to Control the Nutrient Solution of Hydroponics. In Plant Factory Using Artificial Light; Anpo, M., Fukuda, H., Wada, T., Eds.; Elsevier: Amsterdam, Netherlands, 2019; pp. 5–14. ISBN 978-0-12-813973-8. [Google Scholar]
  7. Cho, W.-J.; Kim, H.-J.; Jung, D.-H.; Kim, D.-W.; Ahn, T.I.; Son, J.-E. On-Site Ion Monitoring System for Precision Hydroponic Nutrient Management. Comput. Electron. Agric. 2018, 146, 51–58. [Google Scholar] [CrossRef]
  8. Bamsey, M.; Graham, T.; Thompson, C.; Berinstain, A.; Scott, A.; Dixon, M. Ion-Specific Nutrient Management in Closed Systems: The Necessity for Ion-Selective Sensors in Terrestrial and Space-Based Agriculture and Water Management Systems. Sensors 2012, 12, 13349–13392. [Google Scholar] [CrossRef]
  9. Asao, T. (Ed.) Hydroponics: A Standard Methodology for Plant Biological Researches; InTech: London, UK, 2012; ISBN 978-953-51-0386-8. [Google Scholar]
  10. Kim, H.-J.; Kim, D.-W.; Kim, W.K.; Cho, W.-J.; Kang, C.I. PVC Membrane-Based Portable Ion Analyzer for Hydroponic and Water Monitoring. Comput. Electron. Agric. 2017, 140, 374–385. [Google Scholar] [CrossRef]
  11. Jung, D.-H.; Kim, H.-J.; Cho, W.-J.; Park, S.H.; Yang, S.-H. Validation Testing of an Ion-Specific Sensing and Control System for Precision Hydroponic Macronutrient Management. Comput. Electron. Agric. 2019, 156, 660–668. [Google Scholar] [CrossRef]
  12. Xu, K.; Kitazumi, Y.; Kano, K.; Shirai, O. Automatic Management of Nutrient Solution for Hydroponics—Construction of Multi-ion Stat-. Anal. Sci. 2020, 36, 1141–1144. [Google Scholar] [CrossRef] [PubMed]
  13. Ban, B.; Ryu, D.; Lee, M. Machine Learning Approach to Remove Ion Interference Effect in Agricultural Nutrient Solutions. In Proceedings of the 2019 International Conference on Information and Communication Technology Convergence (ICTC), Jeju Island, Korea, 16–18 October 2019; pp. 1156–1161. [Google Scholar]
  14. Kim, H.-J.; Kim, W.-K.; Roh, M.-Y.; Kang, C.-I.; Park, J.-M.; Sudduth, K.A. Automated Sensing of Hydroponic Macronutrients Using a Computer-Controlled System with an Array of Ion-Selective Electrodes. Comput. Electron. Agric. 2013, 93, 46–54. [Google Scholar] [CrossRef]
  15. Guo, Y.; Liu, C.; Ye, R.; Duan, Q. Advances on Water Quality Detection by UV-Vis Spectroscopy. Appl. Sci. 2020, 10, 6874. [Google Scholar] [CrossRef]
  16. Chen, X.; Yin, G.; Zhao, N.; Gan, T.; Yang, R.; Xia, M.; Feng, C.; Chen, Y.; Huang, Y. Simultaneous Determination of Nitrate, Chemical Oxygen Demand and Turbidity in Water Based on UV-Vis Absorption Spectrometry Combined with Interval Analysis. Spectrochim. Acta A Mol. Biomol. Spectrosc. 2021, 244, 118827. [Google Scholar] [CrossRef]
  17. Causse, J.; Thomas, O.; Jung, A.-V.; Thomas, M.-F. Direct DOC and Nitrate Determination in Water Using Dual Pathlength and Second Derivative UV Spectrophotometry. Water Res. 2017, 108, 312–319. [Google Scholar] [CrossRef]
  18. Karlsson, M.; Karlberg, B.; Olsson, R.J.O. Determination of Nitrate in Municipal Waste Water by UV Spectroscopy. Anal. Chim. Acta 1995, 312, 107–113. [Google Scholar] [CrossRef]
  19. Li, J.; Tong, Y.; Guan, L.; Wu, S.; Li, D. Optimization of COD Determination by UV-Vis Spectroscopy Using PLS Chemometrics Algorithms. Optik 2018, 174, 591–599. [Google Scholar] [CrossRef]
  20. Brito, R.S.; Pinheiro, H.M.; Ferreira, F.; Matos, J.S.; Lourenço, N.D. In Situ UV-Vis Spectroscopy to Estimate COD and TSS in Wastewater Drainage Systems. Urban Water J. 2014, 11, 261–273. [Google Scholar] [CrossRef]
  21. Shi, W.; Zhuang, W.-E.; Hur, J.; Yang, L. Monitoring Dissolved Organic Matter in Wastewater and Drinking Water Treatments Using Spectroscopic Analysis and Ultra-High Resolution Mass Spectrometry. Water Res. 2021, 188, 116406. [Google Scholar] [CrossRef]
  22. Cook, S.; Peacock, M.; Evans, C.D.; Page, S.E.; Whelan, M.J.; Gauci, V.; Kho, L.K. Quantifying Tropical Peatland Dissolved Organic Carbon (DOC) Using UV-Visible Spectroscopy. Water Res. 2017, 115, 229–235. [Google Scholar] [CrossRef] [PubMed]
  23. Monteiro-Silva, F.; Jorge, P.A.S.; Martins, R.C. Optical Sensing of Nitrogen, Phosphorus and Potassium: A Spectrophotometrical Approach toward Smart Nutrient Deployment. Chemosensors 2019, 7, 51. [Google Scholar] [CrossRef]
  24. Silva, A.F.; Löfkvist, K.; Gilbertsson, M.; Os, E.V.; Franken, G.; Balendonck, J.; Pinho, T.M.; Boaventura-Cunha, J.; Coelho, L.; Jorge, P.; et al. Hydroponics Monitoring through UV-Vis Spectroscopy and Artificial Intelligence: Quantification of Nitrogen, Phosphorous and Potassium. Chem. Proc. 2021, 5, 88. [Google Scholar] [CrossRef]
  25. Stevens, J.D.; Murray, D.; Diepeveen, D.; Toohey, D. Development and Testing of an IoT Spectroscopic Nutrient Monitoring System for Use in Micro Indoor Smart Hydroponics. Horticulturae 2023, 9, 185. [Google Scholar] [CrossRef]
  26. Jung, D.-H.; Kim, H.-J.; Kim, H.; Choi, J.; Kim, J.; Park, S. Fusion of Spectroscopy and Cobalt Electrochemistry Data for Estimating Phosphate Concentration in Hydroponic Solution. Sensors 2019, 19, 2596. [Google Scholar] [CrossRef]
  27. Han, H.; Jung, D.-H.; Kim, H.-J.; Lee, T.S.; Kim, H.S.; Kim, H.-Y.; Park, S.H. Application of a Spectroscopic Analysis-Based Portable Sensor for Phosphate Quantitation in Hydroponic Solutions. J. Sens. 2020, 2020, 9251416. [Google Scholar] [CrossRef]
  28. Sulaiman, R.; Azeman, N.H.; Mokhtar, M.H.H.; Mobarak, N.N.; Abu Bakar, M.H.; Bakar, A.A.A. Hybrid Ensemble-Based Machine Learning Model for Predicting Phosphorus Concentrations in Hydroponic Solution. Spectrochim. Acta A Mol. Biomol. Spectrosc. 2024, 304, 123327. [Google Scholar] [CrossRef] [PubMed]
  29. Qi, H.; Paz-Kagan, T.; Karnieli, A.; Li, S. Linear Multi-Task Learning for Predicting Soil Properties Using Field Spectroscopy. Remote Sens. 2017, 9, 1099. [Google Scholar] [CrossRef]
  30. Curcio, J.A.; Petty, C.C. The Near Infrared Absorption Spectrum of Liquid Water. JOSA 1951, 41, 302–304. [Google Scholar] [CrossRef]
  31. Qi, H.; Paz-Kagan, T.; Karnieli, A.; Jin, X.; Li, S. Evaluating Calibration Methods for Predicting Soil Available Nutrients Using Hyperspectral VNIR Data. Soil Tillage Res. 2018, 175, 267–275. [Google Scholar] [CrossRef]
  32. Rinnan, Å.; Van Den Berg, F.; Engelsen, S.B. Review of the Most Common Pre-Processing Techniques for near-Infrared Spectra. TrAC Trends Anal. Chem. 2009, 28, 1201–1222. [Google Scholar] [CrossRef]
  33. Savitzky, A.; Golay, M.J.E. Smoothing and Differentiation of Data by Simplified Least Squares Procedures. Anal. Chem. 1964, 36, 1627–1639. [Google Scholar] [CrossRef]
  34. Helland, I.S.; Næs, T.; Isaksson, T. Related Versions of the Multiplicative Scatter Correction Method for Preprocessing Spectroscopic Data. Chemom. Intell. Lab. Syst. 1995, 29, 233–241. [Google Scholar] [CrossRef]
  35. Duckworth, J. Mathematical Data Preprocessing. In Near-Infrared Spectroscopy in Agriculture; John Wiley & Sons, Ltd.: Hoboken, NJ, USA, 2004; pp. 113–132. ISBN 978-0-89118-236-8. [Google Scholar]
  36. Westad, F.; Martens, H. Variable Selection in near Infrared Spectroscopy Based on Significance Testing in Partial Least Squares Regression. J. Infrared Spectrosc. 2000, 8, 117–124. [Google Scholar] [CrossRef]
  37. Yu, H.; Chang, G.; Zhang, S.; Zhu, Y.; Yu, Y. Application of Sparse Regularization in Spherical Radial Basis Functions-Based Regional Geoid Modeling in Colorado. Remote Sens. 2023, 15, 4870. [Google Scholar] [CrossRef]
  38. Pan, T.; Li, M. Feature Extraction From Spectroscopy Using LASSO and Net Analyte Signal. IEEE Sens. J. 2022, 22, 12997–13004. [Google Scholar] [CrossRef]
  39. Wold, S.; Ruhe, A.; Wold, H.; Dunn, W.J., III. The Collinearity Problem in Linear Regression. The Partial Least Squares (PLS) Approach to Generalized Inverses. SIAM J. Sci. Stat. Comput. 1984, 5, 735–743. [Google Scholar] [CrossRef]
  40. Tibshirani, R. Regression Shrinkage and Selection Via the Lasso. J. R. Stat. Soc. Ser. B Methodol. 1996, 58, 267–288. [Google Scholar] [CrossRef]
  41. Zhang, Y.; Yang, Q. An Overview of Multi-Task Learning. Natl. Sci. Rev. 2018, 5, 30–43. [Google Scholar] [CrossRef]
  42. Thung, K.-H.; Wee, C.-Y. A Brief Review on Multi-Task Learning. Multimed. Tools Appl. 2018, 77, 29705–29725. [Google Scholar] [CrossRef]
  43. Jalali, A.; Sanghavi, S.; Ruan, C.; Ravikumar, P. A Dirty Model for Multi-task Learning. In Proceedings of the Advances in Neural Information Processing Systems, Vancouver, BC, Canada, 6–9 December 2010; Curran Associates, Inc.: New York, NY, USA, 2010; Volume 23. [Google Scholar]
  44. Zhou, J.; Chen, J.; Ye, J. MALSAR: Multi-Task Learning via Structural Regularization. Available online: https://jiayuzhou.github.io/MALSAR/ (accessed on 12 February 2024).
  45. Negahban, S.; Wainwright, M.J. Joint Support Recovery under High-Dimensional Scaling: Benefits and Perils of L1,∞-regularization. In Proceedings of the Advances in Neural Information Processing Systems, Vancouver, BC, Canada, 8–10 December 2008; Curran Associates, Inc.: New York, NY, USA, 2008; Volume 21. [Google Scholar]
  46. Zhang, C.-H.; Huang, J. The Sparsity and Bias of the Lasso Selection in High-Dimensional Linear Regression. Ann. Stat. 2008, 36, 1567–1594. [Google Scholar] [CrossRef]
  47. Liu, W. Improved Bounds for Multi-Task Learning with Trace Norm Regularization. In Proceedings of the Thirty Sixth Conference on Learning Theory, Bangalore, India, 12–15 July 2023; PMLR: London, UK, 2023; pp. 700–714. [Google Scholar]
  48. Boursier, E.; Konobeev, M.; Flammarion, N. Trace Norm Regularization for Multi-Task Learning with Scarce Data. In Proceedings of the Thirty Fifth Conference on Learning Theory, London, UK, 2–5 July 2022; PMLR: London, UK, 2022; pp. 1303–1327. [Google Scholar]
  49. Chen, J.; Zhou, J.; Ye, J. Integrating Low-Rank and Group-Sparse Structures for Robust Multi-Task Learning. In Proceedings of the 17th ACM SIGKDD International Conference on Knowledge Discovery and Data Mining, San Diego, CA, USA, 21–24 August 2011; Association for Computing Machinery: New York, NY, USA, 2011; pp. 42–50. [Google Scholar]
  50. Kennard, R.W.; Stone, L.A. Computer Aided Design of Experiments. Technometrics 1969, 11, 137–148. [Google Scholar] [CrossRef]
  51. Jiao, Y.; Li, Z.; Chen, X.; Fei, S. Preprocessing Methods for Near-Infrared Spectrum Calibration. J. Chemom. 2020, 34, e3306. [Google Scholar] [CrossRef]
  52. Chang, C.-W.; Laird, D.A.; Mausbach, M.J.; Hurburgh, C.R. Near-Infrared Reflectance Spectroscopy–Principal Components Regression Analyses of Soil Properties. Soil Sci. Soc. Am. J. 2001, 65, 480–490. [Google Scholar] [CrossRef]
  53. Hastie, T.; Friedman, J.; Tibshirani, R. The Elements of Statistical Learning; Springer Series in Statistics; Springer: New York, NY, USA, 2001; ISBN 978-1-4899-0519-2. [Google Scholar]
  54. Wold, S.; Sjöström, M.; Eriksson, L. PLS-regression: A Basic Tool of Chemometrics. Chemom. Intell. Lab. Syst. 2001, 58, 109–130. [Google Scholar] [CrossRef]
  55. Malgady, R.G.; Krebs, D.E. Understanding Correlation Coefficients and Regression. Phys. Ther. 1986, 66, 110–120. [Google Scholar] [CrossRef]
  56. Matcher, S.J.; Cope, M.; Delpy, D.T. Use of the Water Absorption Spectrum to Quantify Tissue Chromophore Concentration Changes in Near-Infrared Spectroscopy. Phys. Med. Biol. 1994, 39, 177. [Google Scholar] [CrossRef] [PubMed]
Figure 1. (a) Physical picture of spectral collection experiment: 1, spectrometer, 2, light source, 3, laptop with data collection software, and 4 holder with the sample inside; (b) absorbance spectra of samples and pure water.
Agronomy 14 01974 g001
Figure 2. The absorption peaks around 230 nm and 302 nm of the evenly decreased 10 samples of each basic nutritional formulation (NFs). Legends: the concentrations of nitrogen (N), mg/L.
Agronomy 14 01974 g002
Figure 3. Variable importance for projection (VIP) scores of the partial least squares (PLS) models (blue) and regression coefficients of the least absolute shrinkage and selection operator (LASSO) models (red) for predicting nitrogen (N), phosphorous (P), potassium (K), calcium (Ca), magnesium (Mg) and sulfur (S). Dashed line: y = 1 for VIP scores.
Agronomy 14 01974 g003
Figure 4. (a) Block-sparse matrix W B , elementwise sparse matrix W E , and the combined regression coefficient matrix W (features × tasks) of dirty multi-task learning (DMTL) models; (b) low-rank structure W L , group-sparse structure W S , and the combined regression coefficient matrix W of the robust multi-task learning (RMTL) models for predicting nitrogen (N), phosphorous (P), potassium (K), calcium (Ca), magnesium (Mg), and sulfur (S). NaN: the coefficients are exactly zero and the wavebands are not used as a feature.
Agronomy 14 01974 g004
Table 1. The five basic nutritional formulations (NFs) used for making nutrient solution samples.
Mother SolutionChemical ReagentsApplication Amounts (mg/L)
Basic NF1/
Tomato
Basic NF2/
Sweet Potato
Basic NF3/
Lettuce
Basic NF4/
Grape
Basic NF5/
Watermelon
AKNO3500750600404238
MgSO4·7H2O300450433246500
NH4H2PO45075133--
KH2PO4150225-136185
BCa(NO3)2·4H2O9002700900590910
Table 2. Descriptive statistics of pH, EC, and the concentrations of six macronutrients.
UnitsMeanSTDMinMedianMax
pH 6.96 0.31 6.17 6.95 7.59
ECµS/cm288.95 149.66 72.09 257.90 864.00
Nmg/L111.81 80.89 12.54 91.91 433.43
Pmg/L24.08 15.84 0.46 22.11 71.50
Kmg/L122.00 74.00 2.70 115.82 354.13
Camg/L103.77 86.20 3.05 86.95 457.63
Mgmg/L20.86 14.03 0.17 18.13 64.75
Smg/L24.19 14.47 0.23 22.85 57.55
Abbreviations used: pH, electrical conductivity (EC), nitrogen (N), phosphorous (P), potassium (K), calcium (Ca), magnesium (Mg), and sulfur (S).
Table 3. Pearson correlation coefficients between the seven soil properties.
pHECNPKCaMgS
pH1.00
EC−0.721.00
N−0.660.991.00
P−0.850.660.611.00
K−0.670.880.860.651.00
Ca−0.640.950.970.600.731.00
Mg−0.610.760.700.620.56 0.711.00
S−0.52 0.57 0.48 0.45 0.40 0.47 0.901.00
Abbreviations used: pH, electrical conductivity (EC), nitrogen (N), phosphorous (P), potassium (K), calcium (Ca), magnesium (Mg), and sulfur (S). Underlined values indicate strong positive correlations (r ≥ 0.8), and italic values indicate moderately positive correlations (0.6 ≤ r < 0.8).
Table 4. The used parameters, the numbers of used features, and the prediction results of the partial least squares (PLS), least absolute shrinkage and selection operator (LASSO), dirty multi-task learning (DMTL), and robust multi-task learning (RMTL) models for predicting six macronutrients.
AlgorithmMacronutrientParameter 1N 2CalibrationValidationAccuracy Category
RPDSSR/SSTRPDSSR/SST
PLSN589811.16 0.99 9.46 0.91 A
P28981.60 0.61 1.04 0.41 C
K48983.16 0.90 1.70 0.87 B
Ca58986.94 0.98 3.93 0.86 A
Mg28981.46 0.52 1.08 0.38 C
S28981.35 0.44 0.91 0.59 C
LASSON0.03129.62 0.93 10.12 0.90 A
P0.08212.38 0.59 1.03 0.35 C
K0.09182.98 0.70 1.66 0.68 B
Ca0.03256.33 0.90 3.27 0.72 A
Mg0.2101.57 0.33 1.32 0.19 C
S0.16131.58 0.35 0.96 0.30 C
DMTLN297318.28 0.90 7.50 0.84 A
P512.90 0.69 1.04 0.40 C
K494.02 0.80 1.68 0.82 B
Ca444.82 0.85 3.43 0.69 A
Mg462.84 0.67 1.15 0.45 C
S592.80 0.64 0.95 0.55 C
RMTLN52189851.06 0.99 8.58 0.91 A
P89840.49 0.99 1.07 0.49 C
K89837.65 0.98 1.73 0.93 B
Ca89844.03 0.99 4.35 0.81 A
Mg89838.76 1.00 1.28 0.44 C
S89832.09 1.03 1.09 0.58 C
1 Note: The parameter for PLS is the number of latent variables; for LASSO, is the regularization parameter; for DMTL and RMTL, there are two regularization parameters. 2 Note: n is the number of features used in the model. Category A: RPD > 2.0, Category B: 1.4 < RPD < 2.0, Category C: RPD < 1.4. Abbreviations used: nitrogen (N), phosphorous (P), potassium (K), calcium (Ca), magnesium (Mg), sulfur (S), the ratio of performance to deviation (RPD), the ratio between the interpretable sum squared deviation and the total sum squared deviation (SSR/SST).
Disclaimer/Publisher’s Note: The statements, opinions and data contained in all publications are solely those of the individual author(s) and contributor(s) and not of MDPI and/or the editor(s). MDPI and/or the editor(s) disclaim responsibility for any injury to people or property resulting from any ideas, methods, instructions or products referred to in the content.

