Abstract
Considering the demand for the optimization of the technical factors of spraying for a greater area coverage and minimal drift, field tests were carried out to determine the interaction between the area coverage, number of droplets per cm2, droplet diameter, and drift. The studies were conducted with two different types of sprayers (axial and radial fan) in an apple orchard and a vineyard. The technical factors of the spraying interactions were nozzle type (ISO code 015, code 02, and code 03), working speed (6 and 8 km h−1), and spraying norm (250–400 L h−1). The airflow of both sprayers was adjusted to the plantation leaf mass and the working pressure was set for each repetition separately. A method using water-sensitive paper and a digital image analysis was used to collect data on coverage factors. The data from the field research were processed using four machine learning models: quantile random forest (QRF), support vector regression with radial basis function kernel (SVR), Bayesian Regularization for Feed-Forward Neural Networks (BRNN), and Ensemble Machine Learning (ENS). Nozzle type had the highest predictive value for the properties of number of droplets per cm2 (axial = 69.1%; radial = 66.0%), droplet diameter (axial = 30.6%; radial = 38.2%), and area coverage (axial = 24.6%; radial = 34.8%). Spraying norm had the greatest predictive value for area coverage (axial = 43.3%; radial = 26.9%) and drift (axial = 72.4%; radial = 62.3%). Greater coverage of the treated area and a greater number of droplets were achieved with the radial sprayer, as well as less drift. The accuracy of the machine learning model for the prediction of the treated surface showed a satisfactory accuracy for most properties (R2 = 0.694–0.984), except for the estimation of the droplet diameter for an axial sprayer (R2 = 0.437–0.503).
1. Introduction
With the increasing pressure of intensive agriculture on the amount of pesticides used in direct production, there is a need to minimize the consumption of pesticides, i.e., to ration the amounts used with the best possible biological effect, which many efforts are being directed towards. These demands are prompting scientists worldwide to investigate measures and methods to minimize losses in the form of drift [1,2] and to better deposit and distribute the targeted flow in the tree canopy [3,4]. This is achieved with various models and the optimization of the technical factors of spraying: working pressure, nozzle type, movement speed, air flow speed, spray volume, droplet diameter, etc. [5,6,7,8]. There are a considerable number of different studies in the literature that provide data on the optimal calibration of these technical factors and provide results on how to achieve the best possible coverage of the treated area with the lowest possible losses. However, the over-application of pesticides wastes resources and causes pollution [9]. This type of research provides the answer to the question of how to ration the use of pesticides and bring production in line with regulatory requirements when it comes to production in the EU [10]. From all this, it can be concluded that the efficient management of pests and diseases in precision spraying requires thorough coverage of the leaf surface [11]. With the development of modern technologies, such as artificial intelligence and machine learning, the above-mentioned problem of optimizing the technical factors of spraying is coming back into focus, as new scientific methods provide even more accurate predictions and results. This means that traditional research and conventional approaches rely on field research and empirical information, which can be costly, time-consuming, and narrow in scope.
Machine learning provides a data-driven replacement for predicting spray coverage based on technical factors related to the target crop and spraying method [12]. Achieving the optimal spray coverage requires a thorough understanding of the complex interactions between various technical parameters and their effects on leaf surface penetration, droplet deposition, and canopy spread. Predictive modeling is increasingly relying on machine learning techniques, as traditional empirical approaches are often unable to capture the complex relationships between leaf surface coverage factors and the technical factors of spraying [13]. Advanced machine learning techniques such as random forests, support vector machines, and neural networks are often used in a similar way to efficiently model and predict various aspects of crop monitoring and management [14,15]. By utilizing the combined advantages of multiple machine learning models, the ensemble approach of machine learning reduces the respective disadvantages of individual models [16]. One of the most important advantages of ensemble machine learning is its ability to minimize overfitting by averaging the biases and errors across multiple models. Ensembles can improve generalization capabilities by using multiple methods or versions of the same approach with different training data or parameters, especially with noisy or heterogeneous datasets [17]. In addition, ensemble approaches combine predictions from multiple sources, making them more stable and resistant to outliers by reducing the influence of unusual data points [18]. Despite encouraging developments, there are still obstacles to fully exploiting the potential of machine learning for leaf surface spraying coverage prediction. A crucial aspect is the need for extensive and high-quality training data covering a wide range of technical parameters, crop types, and environmental conditions, which is still a research gap in the literature.
2. Materials and Methods
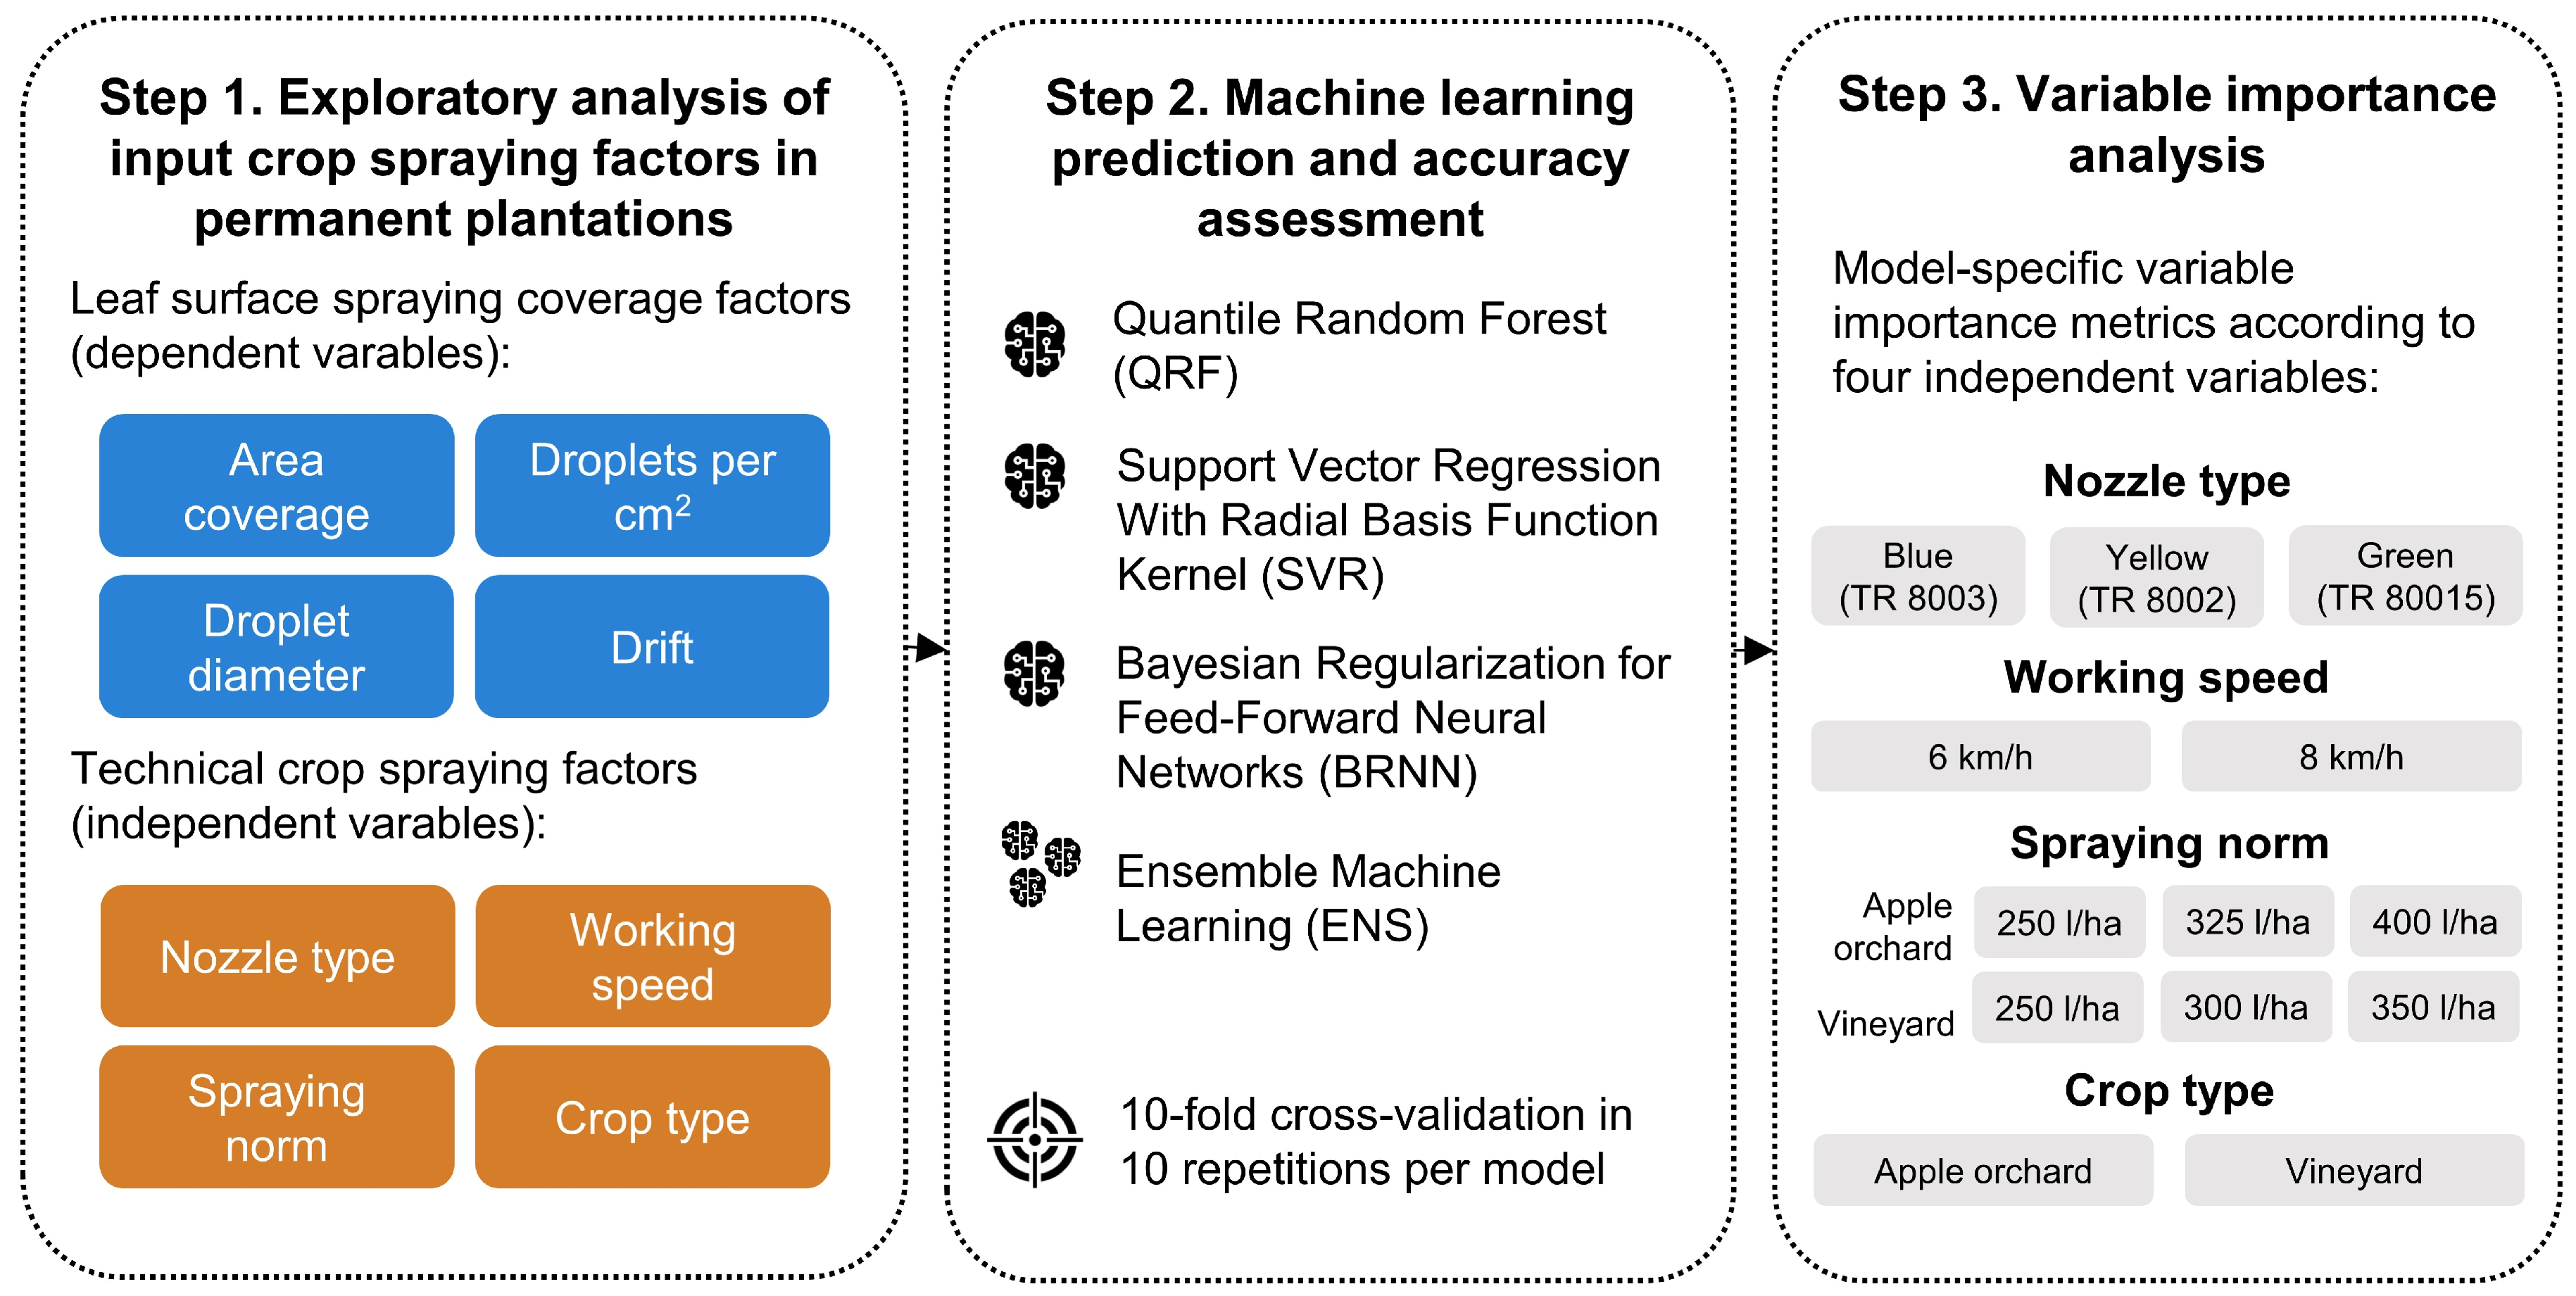
The workflow of the proposed leaf spraying coverage prediction approach based on ensemble machine learning was conducted in three primary steps (Figure 1):
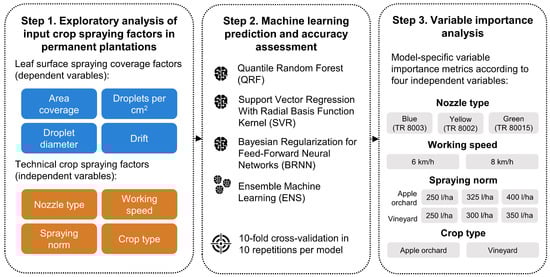
Figure 1.
The workflow of the proposed leaf spraying coverage prediction based on an ensemble machine learning approach.
- (1)
- An exploratory analysis of four input crop spraying coverage factors according to four independent technical factors of spraying: nozzle type, working speed, spraying norm, and crop type;
- (2)
- An ensemble machine learning prediction of these leaf surface spraying coverage factors and an accuracy assessment based on 10-fold cross-validation in 10 repetitions per model;
- (3)
- A relative variable importance assessment according to the independent technical factors of crop spraying used for prediction.
2.1. Field Research and Adjustment of Technical Factors of Spraying
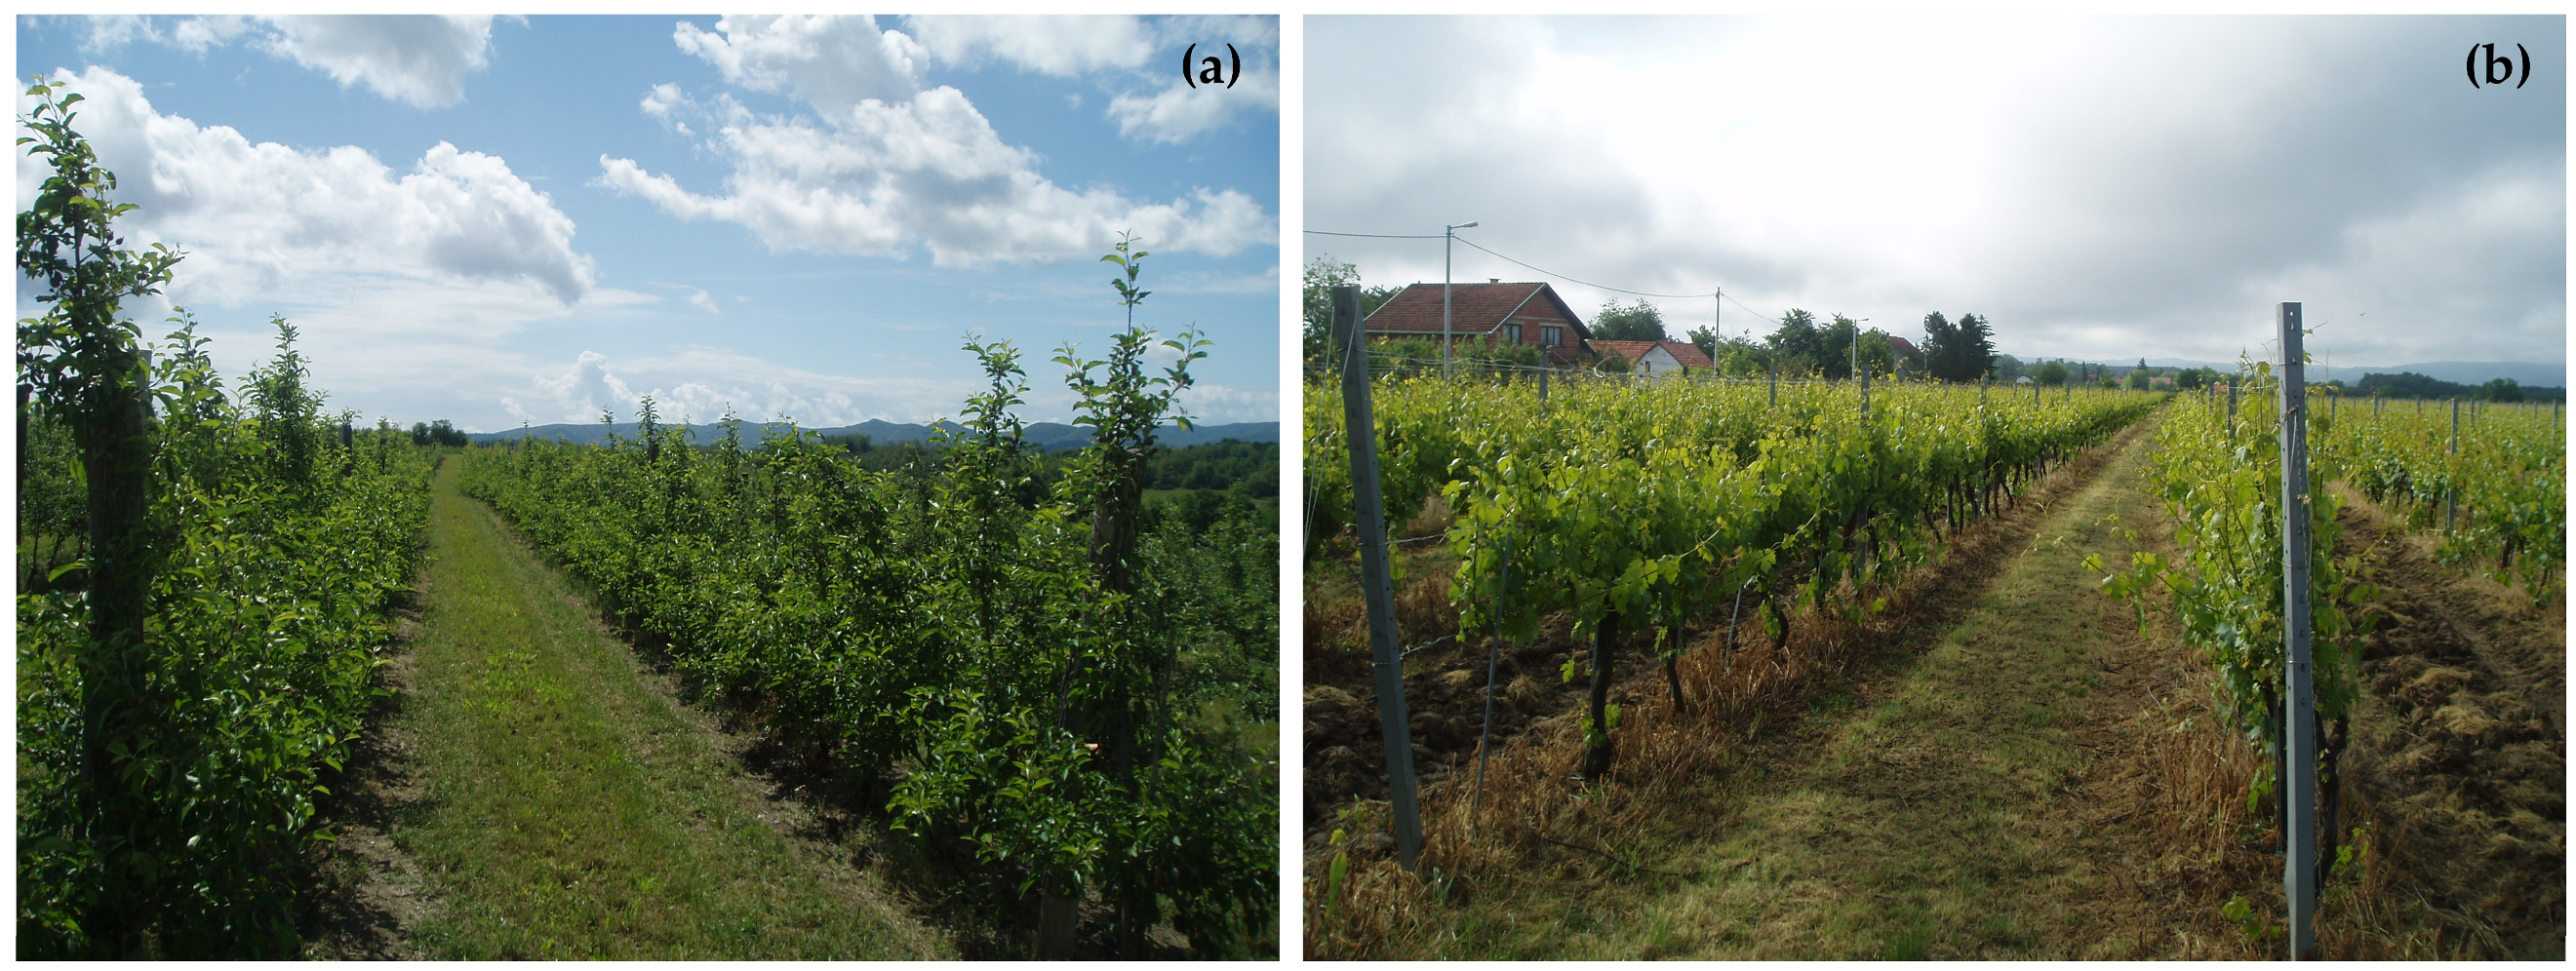
The study was carried out in a five-year-old apple orchard (45°22′37″ N and 17°37′23″ E). The cultivation form of apple orchards is a slender spindle, which is the standard cultivation form in the European agroecological environment. In this form, the trees usually reach a maximum height of 2.2–2.5 m. In the study area, the row spacing between trees was 3.5 m and the distance inside the row was 1.0 m, with an average tree height of 2.33 m. The average crown height was 1.87 m. The apple varieties in the orchard out were Idared and Golden deliches in the fruit growth phase. The second part of the study was carried out on a twelve-year-old vineyard (45°23′56″ N and 17°36′58″ E). The vineyard belongs to the Guyot type of cultivation, the most widespread type of cultivation in the world. The vineyard where the study was carried out had an average plant height of 1.84 m; the distance between the vines in a row was 0.9 m, and the distance between vineyard rows was 2.8 m. The grape variety at the vineyard was Graševina in the stage before flowering. Figure 2 shows these two permanent plantations.
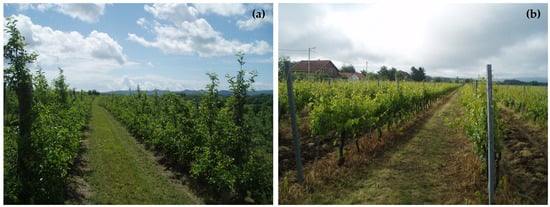
Figure 2.
Apple orchard (a) and vineyard (b) in field research.
The leaf area index (LAI) and leaf area density (LAD) were calculated for both plantations, after which, the airflow velocities were adjusted on both sprayers (apple orchard: LAI = 1.76 m2 m−2 and LAD = 4.59 m2 m−3; vineyard: LAI = 1.65 m2 m−2 and LAD = 15.45 m2 m−3).
Two different types of sprayers from the same manufacturer were used in the study, i.e., two different types of airflow: machines with radial and axial fans. The axial fan sprayer with vertical air deflectors, with dimensions of 150 cm × 14 cm, had a fan diameter of 820 mm consisting of eight adjustable blades. It was possible to set two speeds of rotation of the fan and five levels of inclination of the blades. The sprayer had a tank capacity of 1000 L, and this type of sprayer is characterized by the following dimensions: a length of 3.3 m, height of 1.5 m, width of 1.2 m, and weight of the machine without liquid in the tank of 450 kg. The airflow in the field research was set according to the LAI and LAD and amounted to 10,995.75 m3 h−1 for the vineyard and 14,154.75 m3 h−1 for the apple orchard.
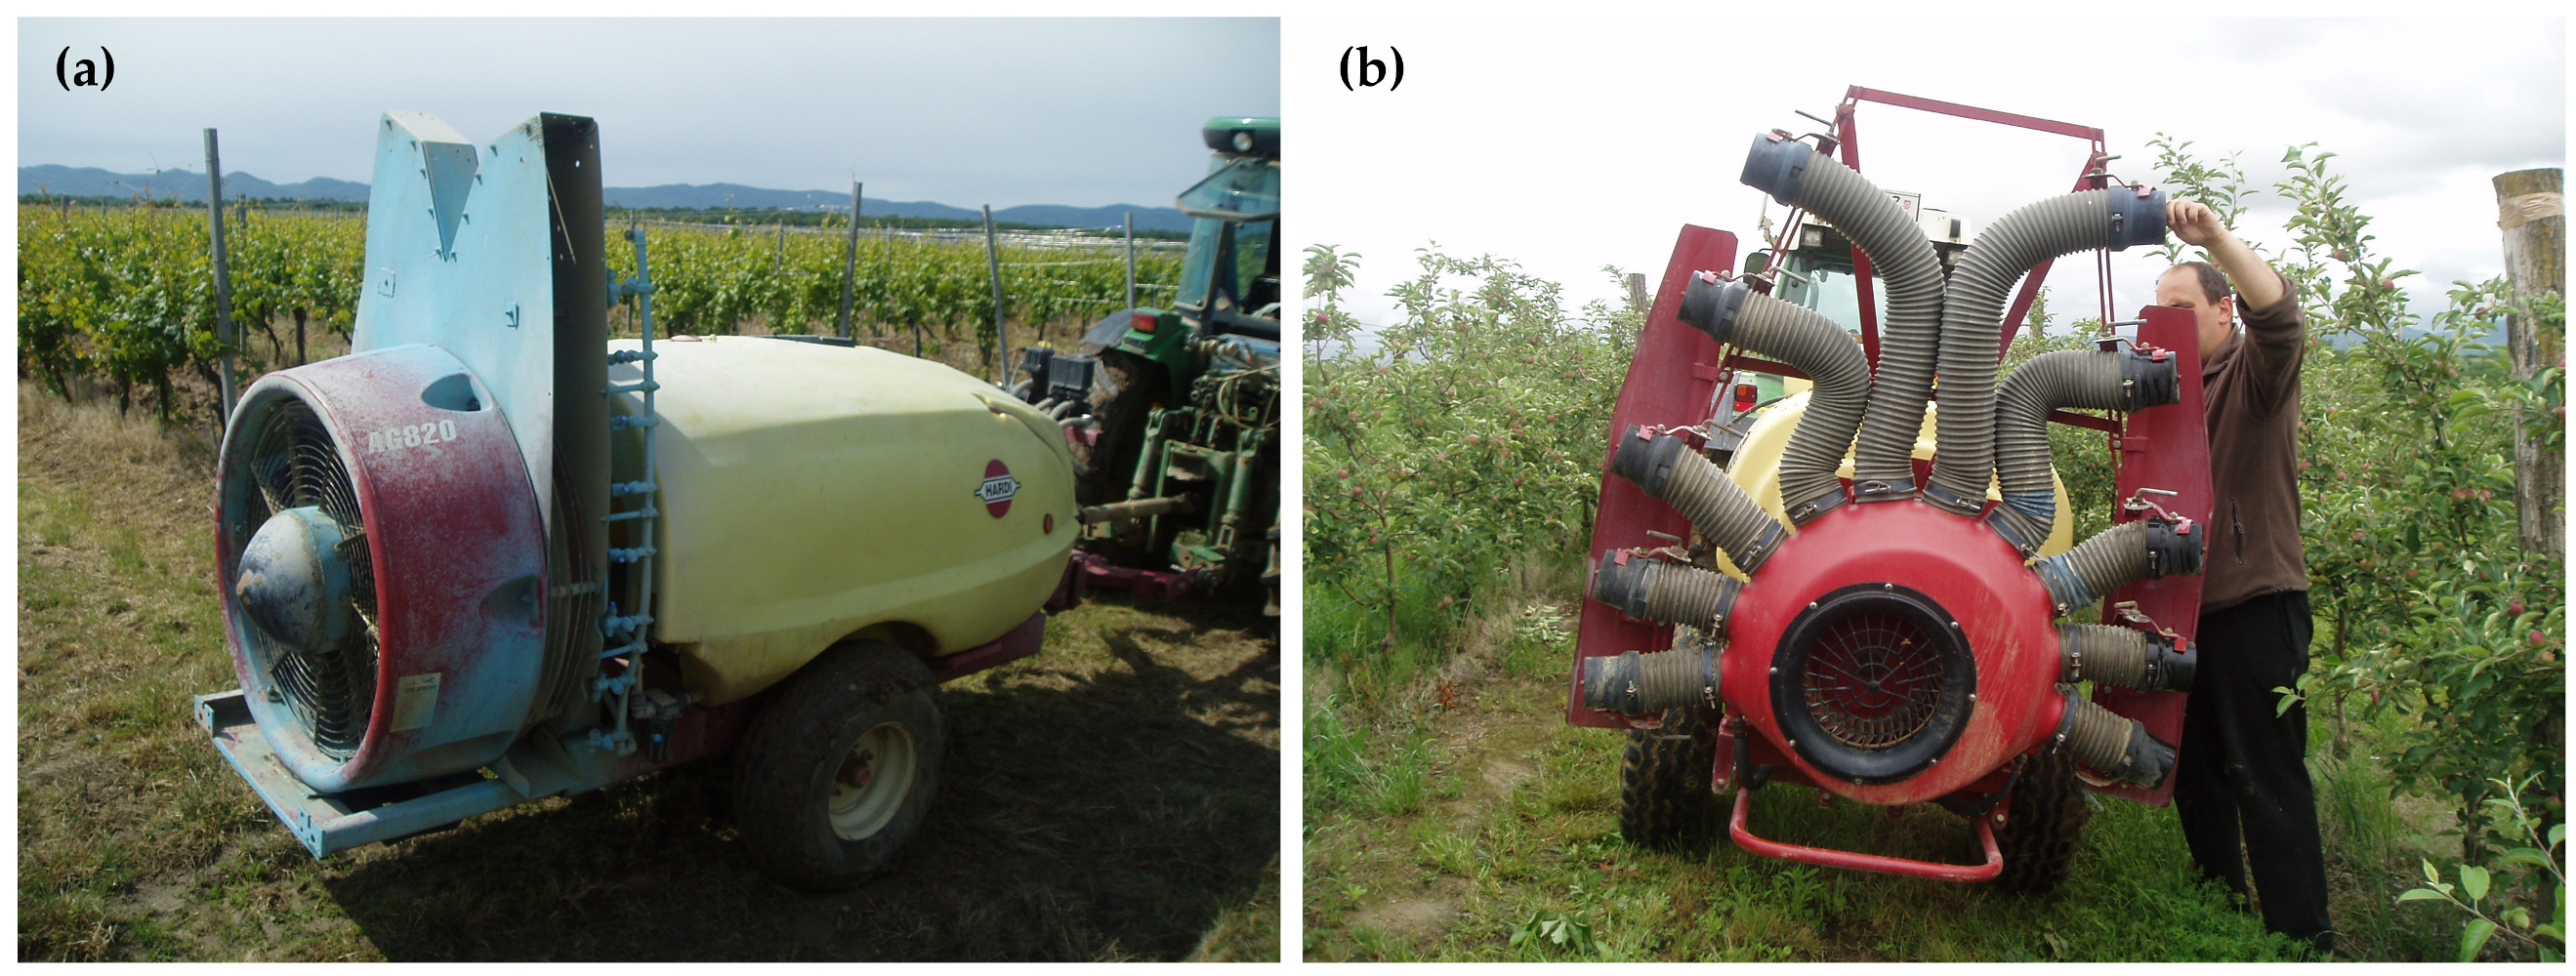
A fan with a diameter of 800 mm and 40 blades was installed on the radial sprayer. The sprayer had a tank capacity of 1000 L, and this type of atomizer is characterized by the following dimensions: sprayer length of 3.0 m, height of 2.1 m, and width of 1.5 m. The airflow was set to 10,265.16 m3 h−1 for the apple orchard and 6248.33 m3 h−1 for the vineyard. Before starting the tests, the sprayers used were tested in accordance with HRN EN ISO 16122 (Agricultural and forestry machines–Inspection of sprayers in use–Part 5: Aerial spray systems. Croatian Standards Institute: Zagreb, Croatia, 2021) to determine the correct functioning of the individual components. Figure 3 shows the sprayers used in the field research.
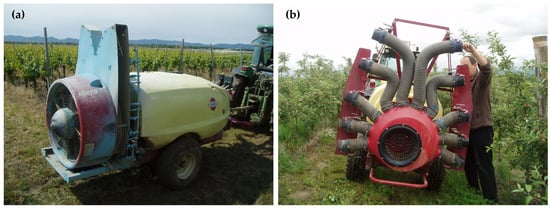
Figure 3.
Axial (a) and radial (b) sprayer.
In the study, nozzles with different ISO numbers were used in order to be able to set different spray norms with different working pressures, i.e., the type of nozzle is one of the most important technical factors of spraying, upon which the droplet size distribution depends. The nozzles were marked according to the ISO 10625 standard and tested according to HRN EN ISO 16122 before the field study. Nozzles with three different liquid flows were used: Lechler TR 80 015 C; Lechler TR 80 02 C; and Lechler TR 80 03 C.
The working speed was set in two variants—6 and 8 km h−1. The accuracy of the tractor speed meter was checked by measuring the time (stopwatch) in which the tractor crossed a given field path (within the plantation where the study was conducted) over a distance of 100 m (measured with a meter and marked with flags). During the measurement, a sprayer with a full tank and a fan switched on was attached to the tractor.
The spraying norm as a technical factor was determined according to the volume of the plantations, whereby the TRV method (tree row volume) was used for the calculation [7,19]. The volume of the orchard (TRV) was calculated from the equation:
where TRV—tree row volume (m3); hn—average orchard height (m); bk—average treetop width (m); and br—row width (m).
Lower liquid volumes were used for the vineyard due to its smaller growth habit and lower leaf mass. The study varied with three spray volumes (Figure 1): 250, 325, and 400 L ha−1 for the apple orchards and 250, 300, and 350 L ha−1 for the vineyard. After determining the volume of the orchard and the spraying standard, the next step in calibrating the sprayer was to calculate the required nozzle flow and pressure. The nozzle flow was calculated according to equation [7,19]:
where Qm—nozzle flow (L min−1); Nr—spraying norm (L ha−1); vr—working speed (km h−1); br—row width (m); and n—number of nozzles in exploitation. The final step of the calibration was to calculate the required pressure using the following equation [2,7,20]:
where Q1—liquid flow at pressure p1 (L min−1); Q2—liquid flow at pressure p2 (L min−1); p1—pressure at Q1 liquid flow (bar); and p2—pressure at Q2 liquid flow (bar). The working pressure was determined individually for each treatment.
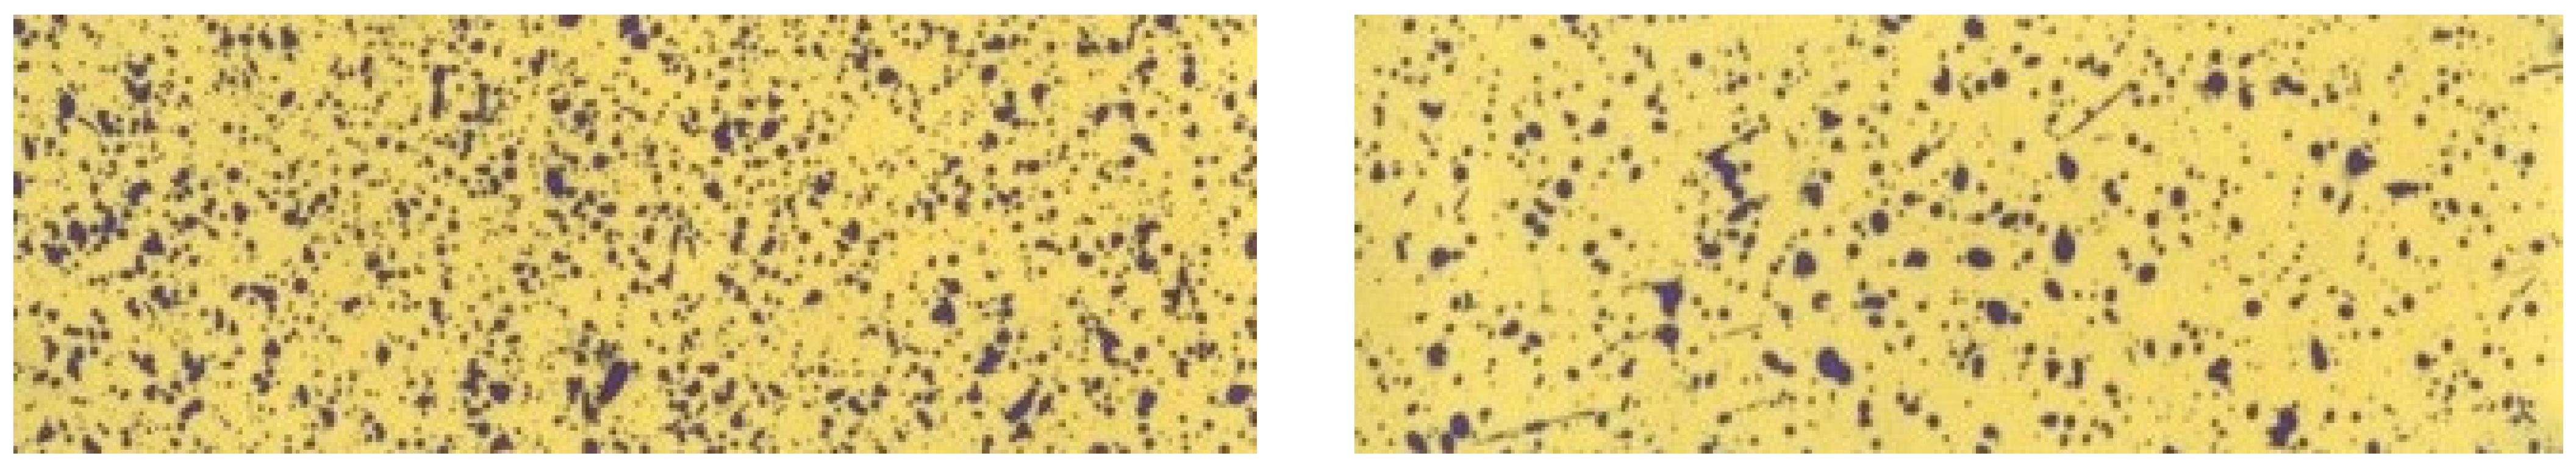
To collect the sprayed liquid in the plantations, water-sensitive papers (WSP) were used [2,7,21,22]. This method represents the most acceptable field method for determining the coverage of a treated surface and the size of droplets. WSPs consist of yellow rectangular strips measuring 75 × 25 mm, which have a thin film of bromphenol on their surface that reacts when in contact with water. Thus, a drop that falls on the WSP leaves an imprint that can be used to determine the degree of coverage of the treated surface. WSPs from the Swiss manufacturer Syngenta were used in this research. The WSPs in the study were placed at three levels of the canopy, which were proportionally distributed (top, middle, and bottom levels). In the apple orchards, the lower level was approximately 0–62 cm, the middle level was from 62 to 124 cm, and the top level was from 124 to 187 cm. The vineyard had a lower level of approximately 0–43 cm, the middle level was from 43 to 86 cm, and the top level was from 86 to 130 cm. In order to obtain data on the uniform coverage of the treated surface of the entire tree/vine, five WSPs were placed at each level, and four trees/vines were used in repetition. In total, 15 WSPs were used for each tree/vine, and 60 WSPs for the entire treatment. The total area per treatment on which surface coverage was measured was 1125 cm² (30 × 37.5 cm). The research utilized trees/vines located in the study area, specifically in a row length of 100 m, and WSPs were placed on the front and back of the leaves. Figure 4 shows the WSPs from the filed research.
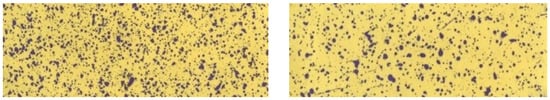
Figure 4.
Water-sensitive papers (WSPs).
After the field research, the WSP samples were collected and each was analyzed by using the digital image system [23,24] (DIA) by using the ImageJ software v 1.46r [25]. The DIA system utilized in this study consisted of a lightening chamber equipped with 8 halogen lamps arranged in a circular formation to provide top lighting (CE Lighting, DX MR16-18LED, 2 W, 12 V, 15 ÷ 60° with a temperature of 6500 K—providing an illumination of 850 ± 10 lux to the sample area), as well as lower lighting with an energy-saving bulb (Philips Genie, 8 W, 405 lm) positioned beneath the surface of sandblasted glass on which the sample was positioned. Within the lightening chamber, there iwa a digital camera (Canon EOS—1100D; image sensor: CMOS, resolution ≈ 10.10 MP; lens: Canon EF—S18—55 mm (f/3.5–5.6 IS)) located in the upper part of the chamber approximately 60 cm from the sample. Prior to the analysis, the entire system had to undergo a calibration process [26,27]. The illumination within the chamber was measured using a digital light meter (YF-170, YU—Fong Electronics, Taiwan), and white balance calibration was carried out using a standard white ceramic tile (CR—A43, Konica Minolta, Japan).
2.2. Machine Learning Methods for Prediction and Accuracy Assessment
The ensemble machine learning prediction of the four leaf surface spraying coverage factors (area coverage, droplets per cm2, droplet diameter, and drift) was performed according to the four technical factors of spraying, including nozzle type, working speed, spraying norm, and crop type as independent variables (covariates). This resulted in 144 samples individually for axial and radial sprayers. Quantile random forest (QRF), support vector regression with radial basis function kernel (SVR), Bayesian Regularization for Feed-Forward Neural Networks (BRNN), and Ensemble Machine Learning (ENS) were evaluated for the prediction, having achieved a high prediction accuracy in previous crop monitoring and management studies [15,28,29]. These methods also meet the prerequisite of the ensemble machine learning approach, having mutually different fundamental prediction approaches, including decision trees, support vector regression, and neural networks. The ensemble machine learning predictions were performed in R v4.0.3 using “caret” and “caretEnsemble” libraries.
QRF represents an upgrade over classic random forest regression by constructing an ensemble of regression trees according to the value distribution of the input leaf surface spraying coverage factors [30]. Instead of optimizing for the mean, the splitting criterion at each node in the tree-building process is tuned for a specific quantile of the input variable. As a result, the QRFs predict a range of quantiles, including the 10th, 50th, and 90th percentiles, indicating the ranges within which future observations are expected. Additionally, QRF is proficient in handling skewed or outlier-containing data in comparison to methods that solely focus on the mean, so they are less susceptible to being unduly influenced by extreme values, as they concentrate on multiple quantiles [31]. To balance the bias–variance trade-off during tree building, the mtry hyperparameter determines the number of independent variables that are taken into account at each decision tree split. A high mtry value allows the trees to focus on specific feature interactions, increasing the variance and leading to overfitting, while a low mtry value increases the likelihood of introducing bias if the selected independent variables are not informative enough for splitting [32].
Unlike linear regression, which assumes a straight-line connection, SVR addresses complicated, non-linear patterns in the data by using a kernel function to transform the input data into a higher-dimensional space where a linear relationship can be established [33]. SVR iteratively searches for a hyperplane in a high-dimensional feature space that optimizes the gap between it and the nearest support vectors to establish the decision boundary. The radial basis function kernel implicitly projects the original data points into a higher-dimensional space where linear separation is possible by tuning two hyperparameters, sigma and C [34]. By computing the similarity between data points in this high-dimensional space, the kernel function enables SVR to learn non-linear correlations without the need for computationally expensive prediction [35]. This method effectively resolves non-linear regression problems while maintaining the advantages of SVR, such as its robust generalization and resistance to outliers. A decision boundary with a high sigma value is smoother and less prone to noise, while lower values result in a boundary that is more impacted by neighboring data points. The trade-off between fitting the training data and the model complexity is managed by the C hyperparameter, defining adherence to the data first and running the risk of overfitting by adding noise with proportionally higher C values [34].
To improve generalization and prevent overfitting, Bayesian regularization incorporates a statistical framework into feed-forward neural networks for regression problems with BRNN [36]. In traditional neural networks, an error function, such as mean squared error, is minimized during the training between the predicted values and the actual values [37]. However, this may cause the issue of relying too heavily on the training set, possibly leading the model to perform less accurately on untested data. Bayesian regularization addresses this issue by incorporating preexisting assumptions about the weights and biases of the network, represented as probability distributions [36]. This approach favors smaller weights to avoid overly complex models, discouraging the network from overfitting the training data. The neurons hyperparameter in BRNN has a direct impact on the model complexity, determining the number of neurons in each hidden layer of the network. Increasing the number of neurons in the network allows it to identify more complex correlations in the data, which can improve its ability to simulate non-linear processes, but also possibly lead to overfitting [38].
The proposed ensemble method combined the strengths of three learners with distinct qualities to achieve robust and accurate regression tasks using a generalized linear modeling framework [16]. QRF provided comprehensive value distribution processing, SVR addressed non-linearity, while BRNN improved generalization. To ensure a more reliable and accurate representation of the underlying connections within the data, the ensemble aggregated their predictions using the generalized linear model. According to previous studies [18,39], this leads to lower variance in results, a higher prediction accuracy, and the ability to identify intricate relationships that may be difficult for individual models to detect.
An accuracy assessment of the ensemble machine learning prediction approach and its respective individual models was performed according to a 10-fold cross-validation in 10 repetitions. The coefficient of determination (R2), root-mean-square error (RMSE), and normalized RMSE (NRMSE) were applied for the accuracy assessment (3–5). R2 quantified the variations in the leaf surface spraying coverage factors captured per model on a relative basis, while RMSE and NRMSE quantified the average prediction error using the absolute and normalized absolute approaches, respectively. A higher R2 and lower RMSE and NRMSE indicated a higher prediction accuracy for each of the four leaf surface spraying coverage factors:
where —actual leaf surface spraying coverage factors; —predicted leaf surface spraying coverage factors; —mean of actual leaf surface spraying coverage factors; and n—sample count.
3. Results
As mentioned in the materials and methods, different machine learning models were used to process the data from the field research, namely: quantile random forest (QRF), support vector regression with radial basis function kernel (SVR), Bayesian Regularization for Feed-Forward Neural Networks (BRNN), and Ensemble Machine Learning (ENS). The parameter settings of the individual models are shown in Table 1.

Table 1.
The optimal hyperparameters according to automatic tuning for the evaluated machine learning methods.
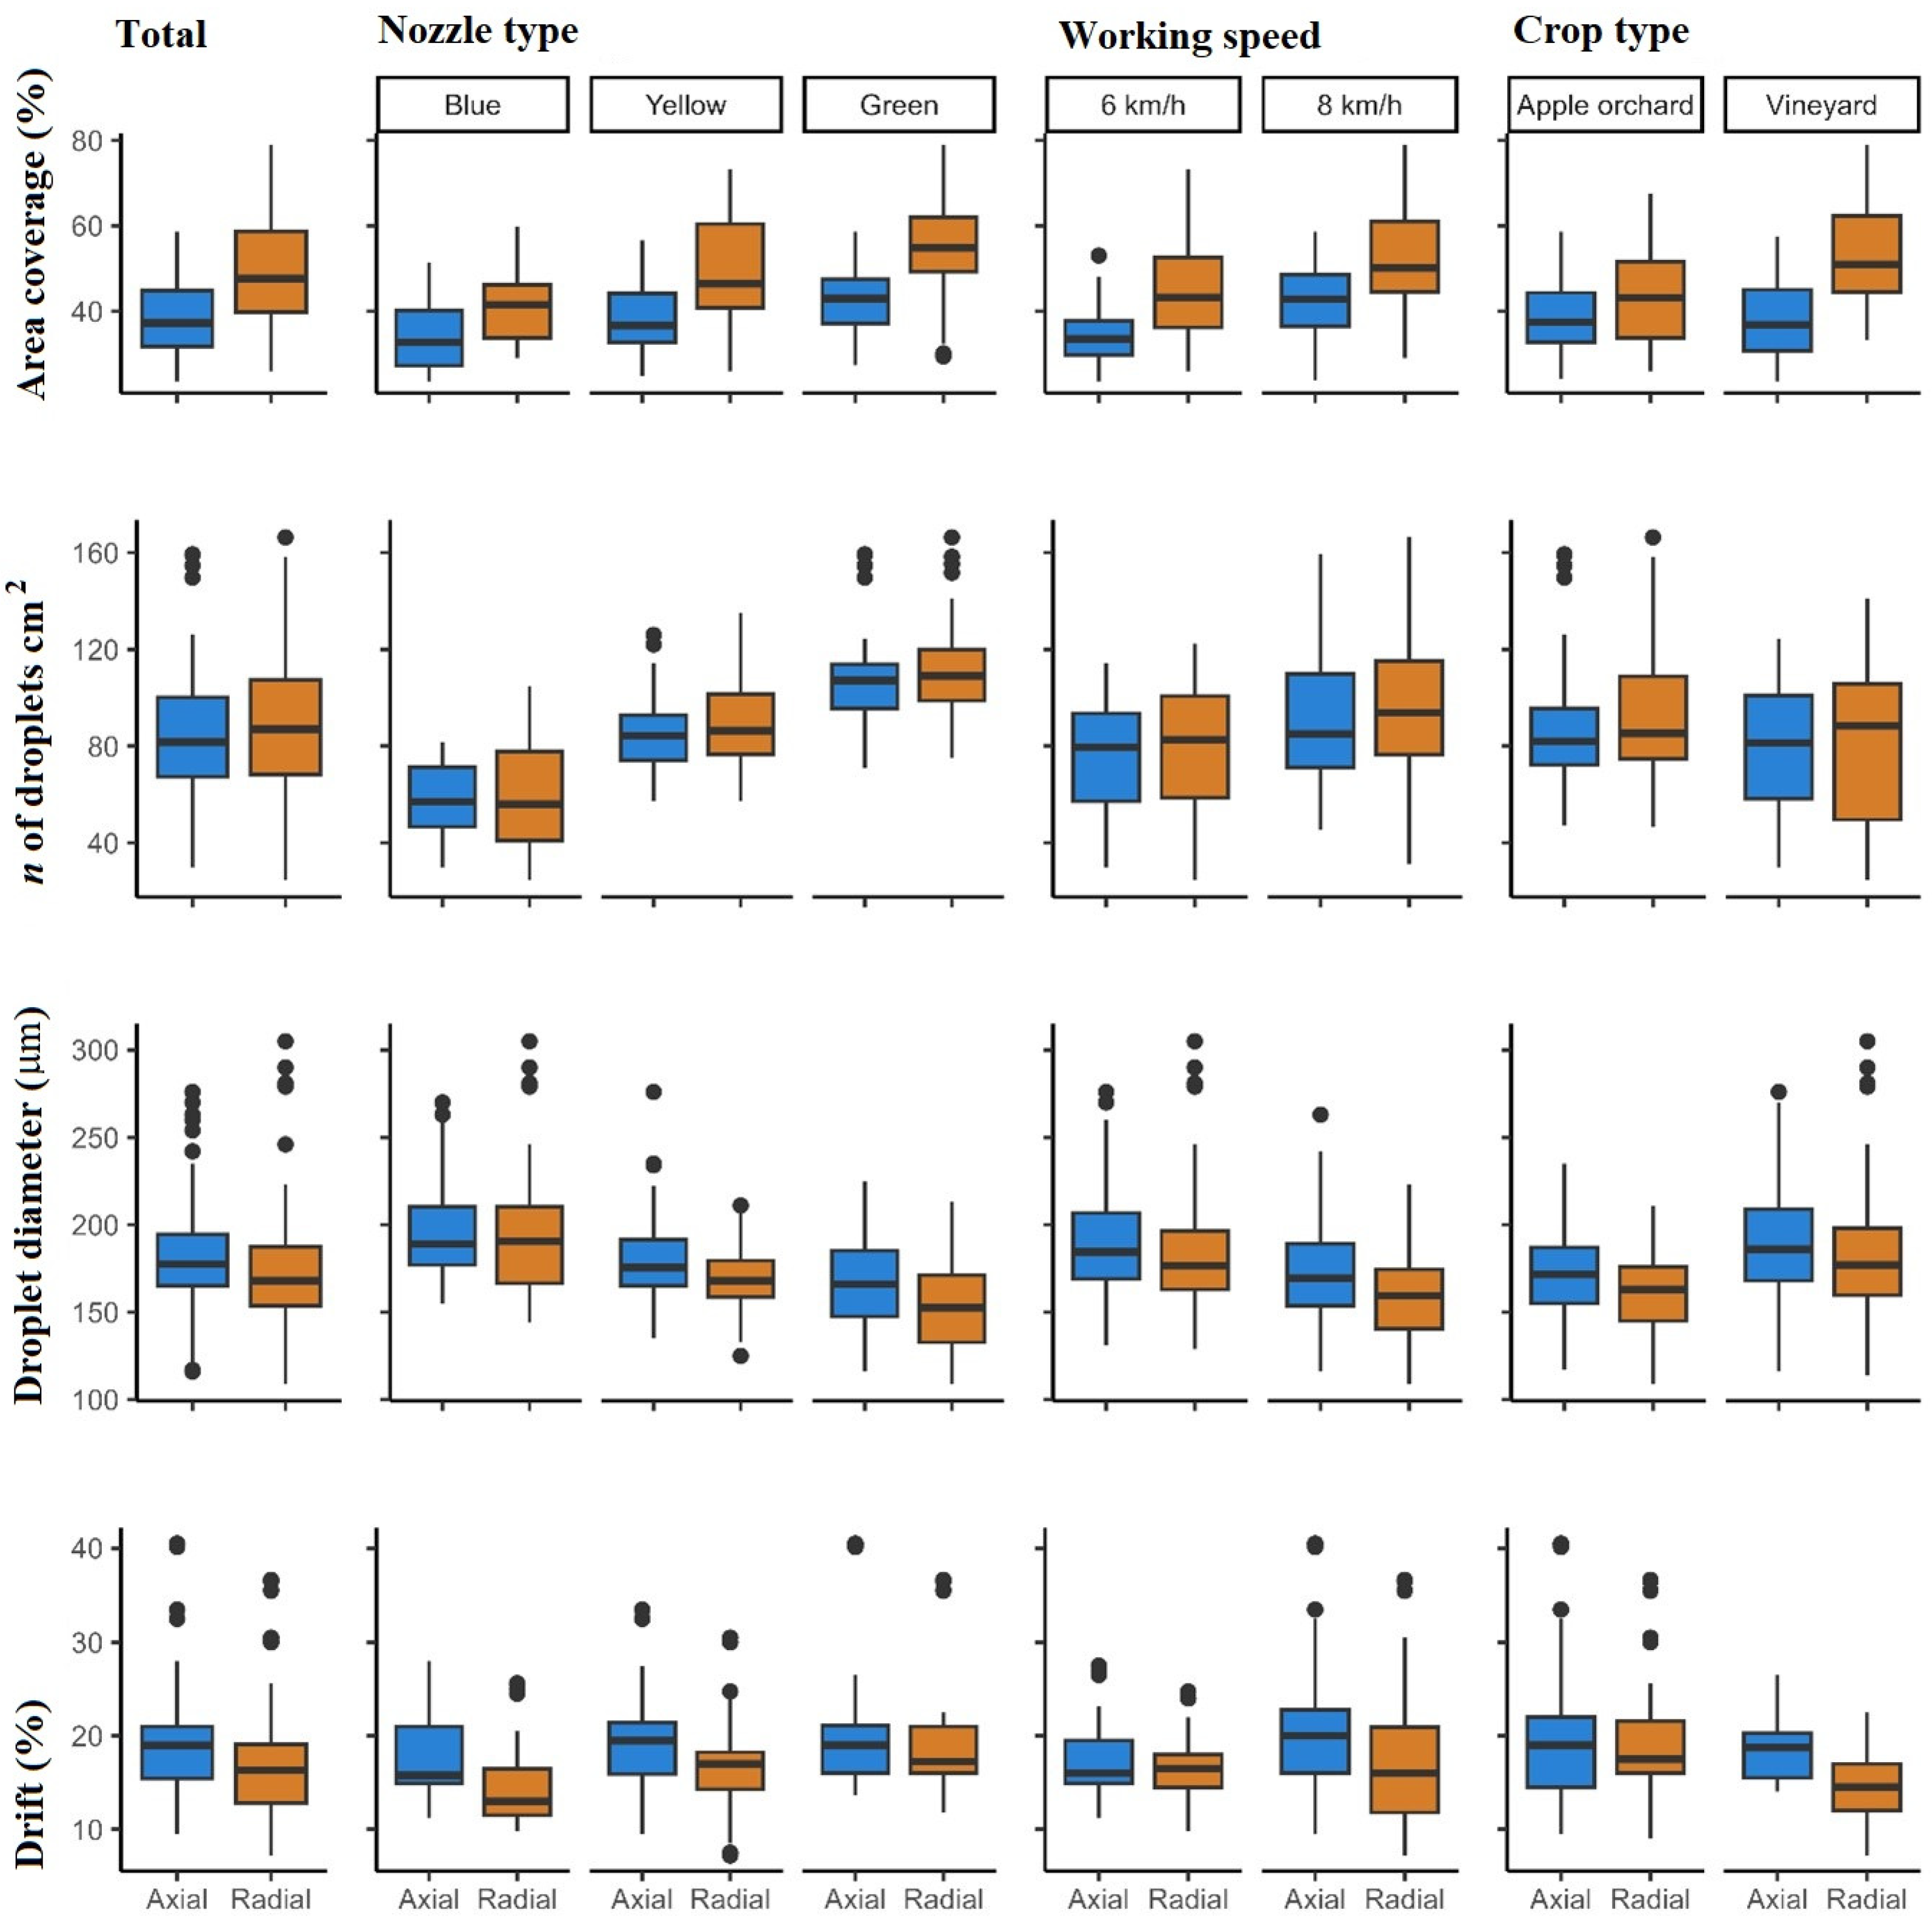
The investigation of the area coverage as a function of the technical factors of spraying allowed for the conclusion that the radial sprayer achieved a statistically significantly greater coverage in all treatments. This fact was reflected in several important aspects of the fan type, namely: the radial blower generated a greater hydropneumatic dissolution of the liquid flow due to the higher velocity of the air flow at the outlet from the deflector (technical design of the fan), resulting in smaller droplets covering the treated area better. The technical dependence of the droplet size in the stream and its diameter and number per cm2 can be clearly seen in the total column. The radial sprayer achieved a larger number of droplets per cm2 and a smaller droplet diameter. Another important fact in favor of the radial fan is that it produced less drift, i.e., a larger number of droplets were deposited on the target surface. In this case, flexible air conduits can be aligned in the direction of the largest leaf mass, which is of great importance and is difficult to achieve with an axial fan.
The investigation confirmed the technical dependence of the area coverage, the number of droplets per cm2, and the droplet diameter (Figure 5). Looking at the columns of the nozzle types, it can be seen that the area coverage and the number of droplets were lowest in the treatments with the blue nozzle, while these properties were statistically significantly higher in the treatments with the green nozzle. In contrast, the droplet diameter was largest in the treatments with the blue nozzle and statistically significantly smaller in the treatments with the green nozzle. As already mentioned, the radial sprayer achieved a lower drift in all treatments with different nozzles. The distribution of the data for the working speed was similar to that for the nozzle type.
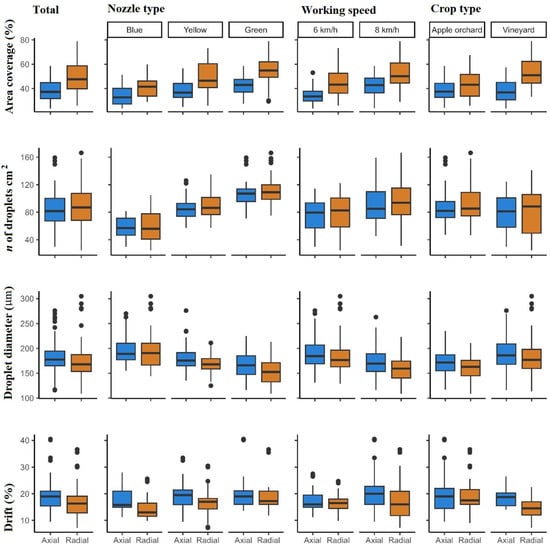
Figure 5.
Boxplots for distribution of technical factors of spraying according to coverage factors.
At a working speed of 6 km h−1, a lower area coverage and droplets per cm2 were achieved due to the lower working pressures in the treatments, while the droplet diameter was significantly smaller at a speed of 8 km h−1. In this case, drift was significantly lower at a speed of 8 kmh−1 with the radial sprayer, while there were no significant differences at a speed of 6 km h−1. Looking at the crop type, there was a statistically significant difference in the area coverage and in the study of drift in the vineyard.
Looking at the accuracy of a particular machine learning model, it can be seen that most methods had quite a good accuracy. For the axial sprayer, the BRNN method had the best R2 value with 0.745 for area coverage and 0.921 for number of droplets per cm2, while ENS provided the best value for drift (0.984). The system errors were small (e.g., minimal RMSE for area coverage = 4.54 and minimal drift = 0.70), and when normalized, they were negligible.
A similar distribution of data was also shown by the tests with the radial sprayer. The SVR method showed the highest accuracy for the area coverage (0.781), QRF for the number of droplets per cm2 (0.894), and ENS for the droplet diameter (0.750) and the drift (0.979). The system errors were small, as with the axial sprayer, and when normalized, they were negligible.
The only property that showed an unsatisfactory accuracy with all models was the droplet diameter when working with an axial sprayer (R2 from 0.437 (QRF) to 0.503 (BRNN)). Table 2 shows the accuracies of the individual machine learning models as a function of the features of the spray coverage factors.
Table 2.
The accuracy assessment of the evaluated machine learning methods.
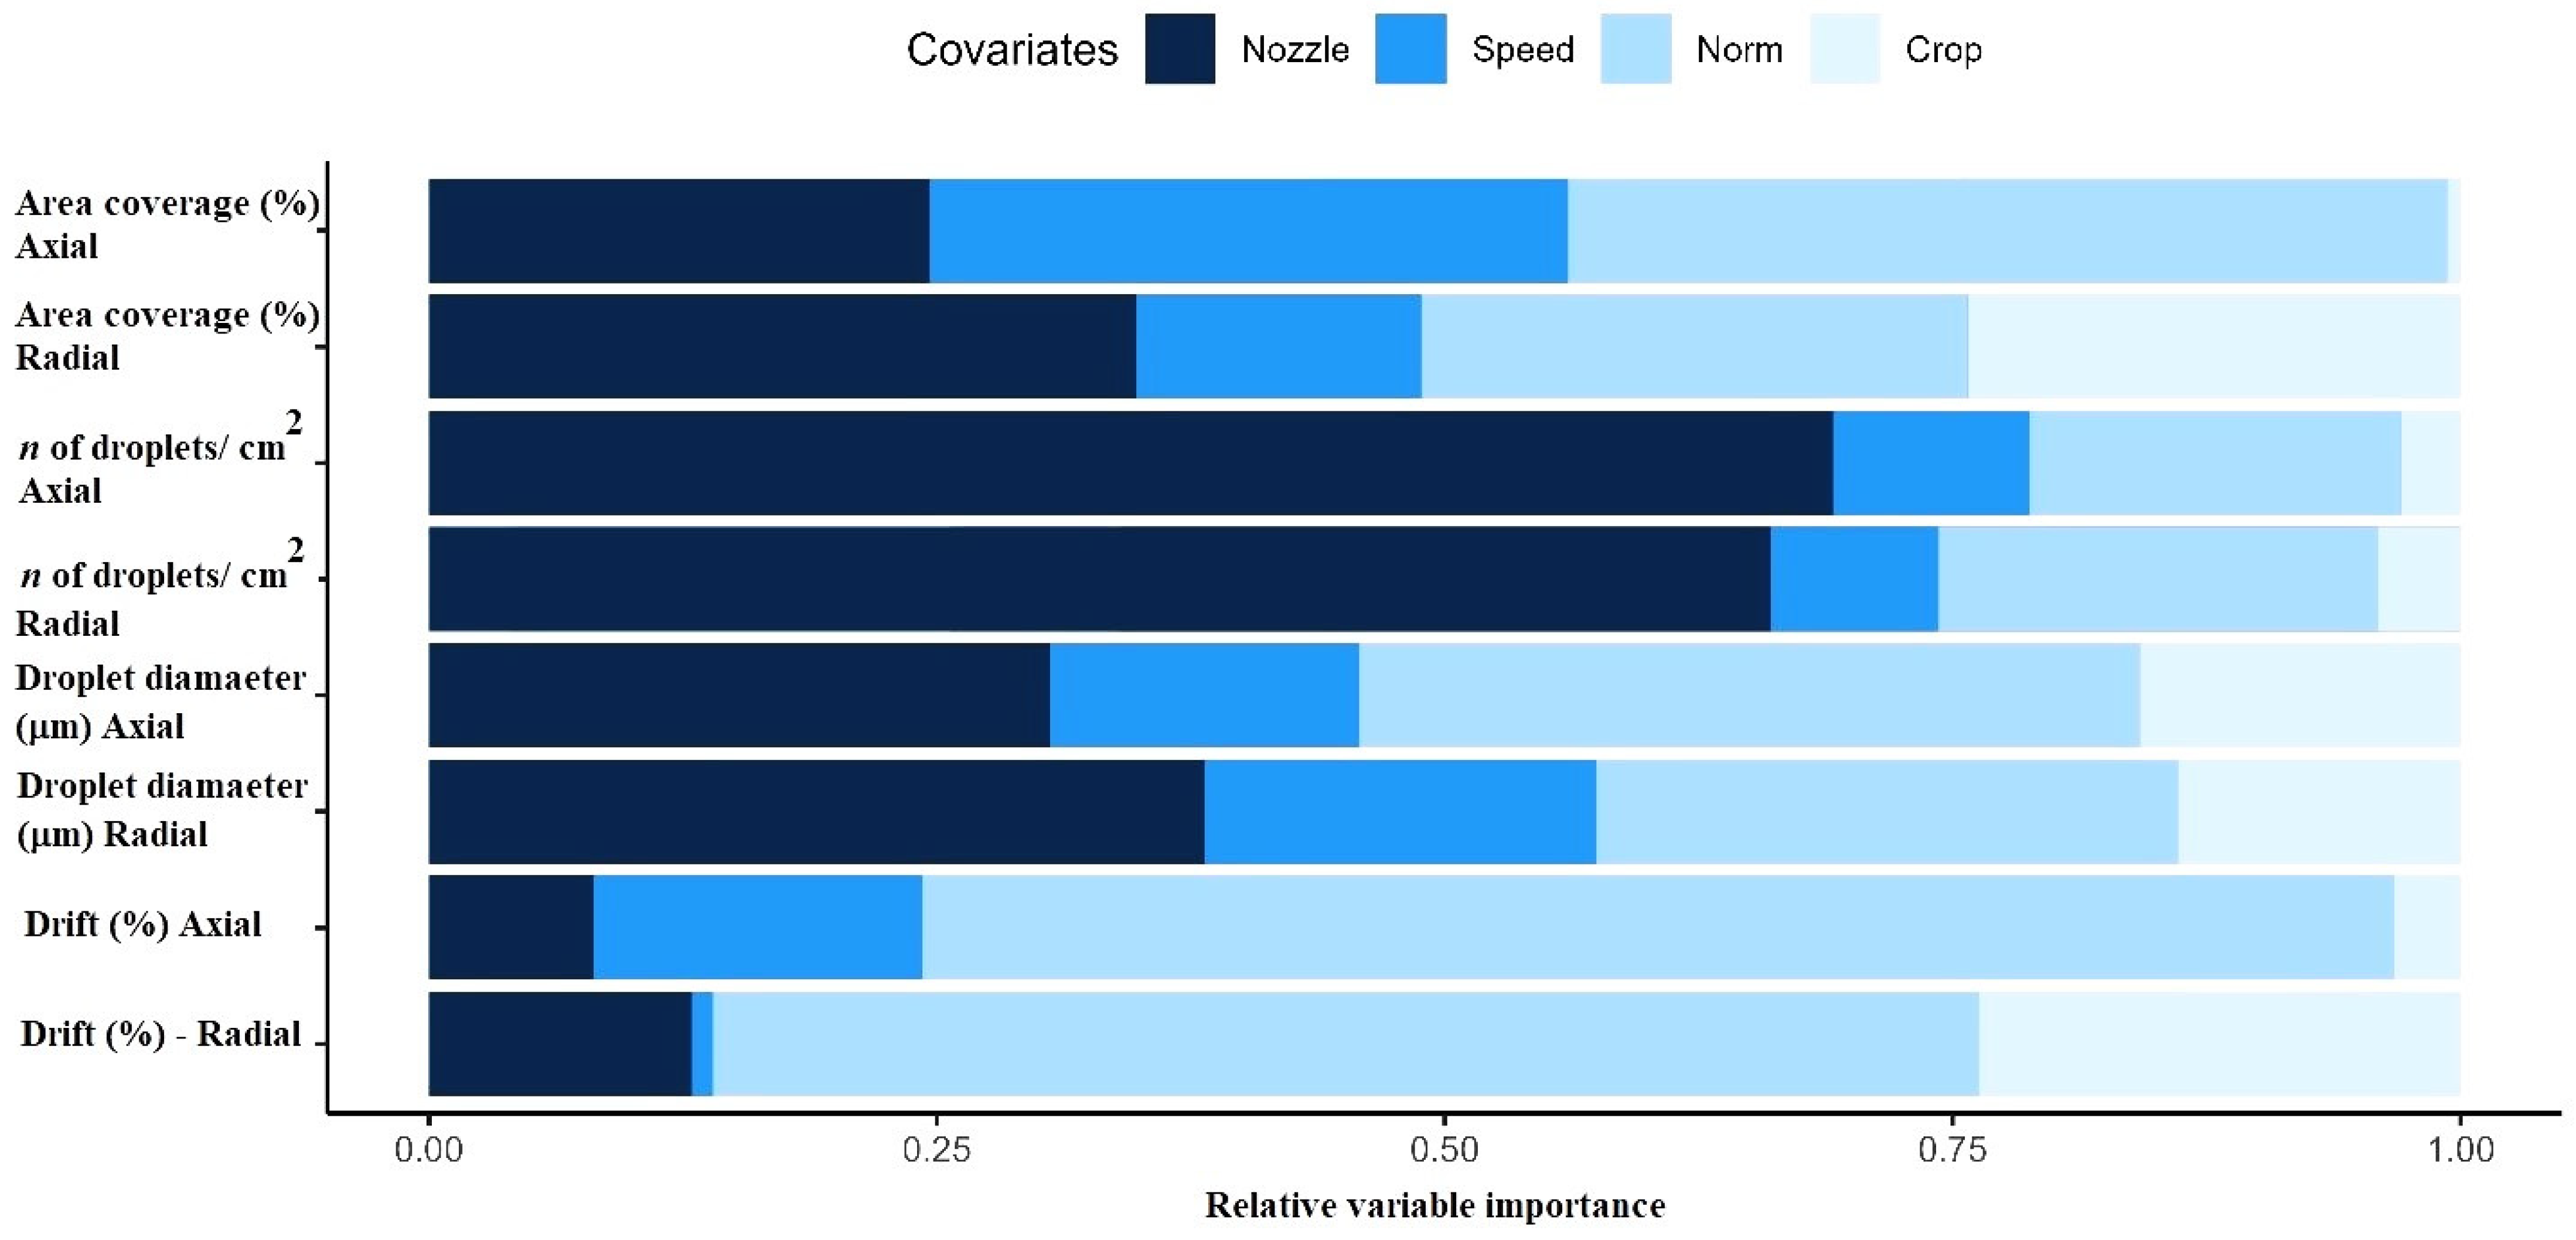
By studying the results obtained from research with different machine learning methods, the importance of each individual technical factor of spraying for the prediction of an individual coverage factor of the treated surface can be shown with the data in Figure 6. In the majority of predictions and considering the importance of individual spraying coverage factors, it can be seen that, in most cases, the main roles were played by the type of nozzle and the spray rate, and the least important by the type of plantation.
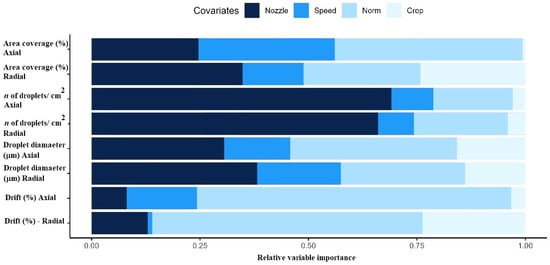
Figure 6.
The relative variable importance of four independent technical factors of spraying used for the prediction of spraying coverage factors.
For the prediction of the area coverage property with both sprayers, the type of plantation had the least influence, while the highest values were predicted with the nozzle type (axial = 24.6% and radial = 34.8%) and spraying norms (axial = 43.3% and radial = 26.9%).
For the property of the number of droplets, the nozzle type had the greatest influence on the prediction: axial = 69.1% and radial = 66.0%. Other factors, together, had an influence on the prediction of 30.9–34%. For the prediction of the droplet diameter property, the data distribution was similar to the surface coverage property. The biggest influences on the diameter prediction were the spray rate (axial = 38.4% and radial = 28.6%) and nozzle type (axial = 30.6% and radial = 38.2%). When studying the drift, the situation changed significantly, where the main influence of the prediction was the spray norm (axial = 72.4% and radial = 62.3%). The speed of movement was not the main determining factor, except for with the real impact of area coverage with an axial fan (31.4%) and a radial sprayer for the droplet diameter (19.3%).
4. Discussion
Determining the importance of the technical factors of spraying and adapting them to individual plantations with the aim of achieving the greatest possible surface coverage results have long been the subject of scientific research. Its aim has been to find the best possible solution for adjusting spraying parameters to reduce drift and spraying norms, and, thus, pesticide consumption, in line with increasingly stringent ecological standards [2,7,19]. Various statistical methods and determination methods have been used in the literature to reveal these factors, but with the development of computer technology, this process has been greatly accelerated by the application of artificial intelligence and machine learning methods. As this is a new topic, there is still little research on the subject, so this study highlights the promise for the future and the use of machine learning in optimizing spray parameters in permanent plantations.
When planning this research, the most important technical factors for spraying were taken into account: different types of sprayers, nozzles, plantations, spraying norms, and working speeds. Other scientists have also recognized this problem by including these parameters in their research and considering which factor is most appropriate for each plantation. This study included two types of sprayers (radial fan and axial fan sprayers), while the study by Petrović, D. et al. [4] included two different types of axial fan sprayers. Other studies [6,40] have listed a whole range of different types of sprayers used under different operating conditions depending on the environmental factors and types of plantations.
In this study, the method with water-sensitive papers and digital image analysis was used, which is the most effective method to evaluate spray cover under field conditions and is used by many scientists [2,7,21,22]. In addition, it is very important to determine the leaf factors (LAD and LAI) [41] in order to adjust the airflow velocity and spraying norm [5]. In accordance with the needs of current ecological standards, the spraying norm was set at norms of 250–400 L ha−1 and agrotechnical working speeds of 6 and 8 km h−1, in line with other worldwide research [5,19,42,43]. These studies have shown that the type of nozzle is one of the most important technical factors in achieving a very high area coverage, and most studies are being conducted in this direction [2,7,8].
This is confirmed by other worldwide studies [44,45], in which authors have stated that droplet size, nozzle type, and working pressure are the three most important factors in need of manipulation to achieve the greatest possible coverage of a treated surface. Accordingly, the technical factors of spraying can be optimized to achieve a satisfactory coverage of the treated area. In this research prediction, machine learning methods were used to predict the highest values of area coverage with the nozzle type (axial = 24.6% and radial = 34.8%) and spraying norms (axial = 43.3% and radial = 26.9%). In this study, the airflow was adapted to the type of plantation and leaf mass, so that lower airflows were used for vineyards (from 6248.33 m3 h−1 to 10,995.75 m3 h−1) and higher ones for apple orchards (from 10,265.16 m3 h−1 to 14,154.75 m3 h−1). These values were determined during preliminary investigations to adjust the airflow so that the air was not blown through the canopy and did not cause excessive drift. The values given are in line with the values proposed by Bondesan, D. et al. [46], which state that an airflow of more than 12,000 m3 h−1 is not recommended for the predominant forms of cultivation in Europe.
It has already been established that the type of nozzle has the greatest influence on the number of droplets in the liquid flow and on their diameter, which was determined as a result of various machine learning models (axial = 69.1% and radial = 66.0%), while the spray norm (axial = 38.4% and radial = 28.6%) and nozzle type (axial = 30.6% and radial = 38.2%) have the greatest influence on the prediction of the droplet diameter. This is also confirmed by research [47] that investigated the influence of three droplet sizes on surface coverage. The greatest coverage of the treated surface was found for small droplets, as they are less prone to drift than very small droplets and achieve a greater coverage than medium-sized droplets. Nuyttens, D. et al. [48] also found that nozzles with a lower ISO number (01, 015, and 02) produced droplets with a smaller diameter compared to nozzles with a higher ISO number (025, 03, and 04) at the same operating pressure. The prediction with machine learning in this study showed that the main influence on drift prediction came from the factor of the spraying norm (axial = 72.4% and radial = 62.3%), i.e., higher spray rates caused more losses, while the authors in [3,4] found that the nozzle type was also one of the main factors affecting drift potential when comparing standard and air-injector nozzles. Ozkan, H.E. [49] states that droplets smaller than 200 µm are most sensitive to drift and that the negative side of small droplets is that they are very susceptible to loss (up to 70%). Therefore, he suggests that a droplet reduction threshold be set for each sprayer and plant type to achieve the optimum coverage of the treated area and minimize liquid drift.
As for machine learning methods in predicting the coverage factor of the treated surface, the results and accuracy parameters showed promising trends. The results indicate that for area coverage, BRNN and SVR performed better than QRF and ENS with both axial and radial components, with BRNN having the highest R2 and lowest RMSE and NRMSE with axial and SVR having the highest R2 and lowest RMSE and NRMSE with radial. For droplets per cm2, all methods performed similarly with slight differences, with either BRNN or ENS having the highest R2 and lowest RMSE and NRMSE with axial and all evaluated machine learning methods having the lowest RMSE and NRMSE for at least one parameter of the radial sprayer. However, for droplet diameter, all methods performed poorly with both axial and radial components, with ENS having the highest R2 and lowest RMSE and NRMSE, respectively, with axial and BRNN having the highest R2 and lowest RMSE and NRMSE with radial. For drift, all methods performed well with both axial and radial components, with ENS having the highest R2 with axial and BRNN having the highest R2 and lowest RMSE with radial. Previous studies also support the notion that machine learning methods show promise in predicting leaf surface spraying coverage factors [50,51]. The ability of these models to outperform traditional methodologies in predicting factors such as area coverage, droplets per cm2, and drift highlights their potential to significantly improve precision agriculture techniques [52]. In comparison to previous studies, the results of this study confirm that machine learning methods, specifically BRNN and SVR, can provide accurate predictions for leaf surface spraying coverage factors regarding area coverage and droplets per cm2 [53]. However, further research is needed to improve the prediction accuracy for droplet diameter. Additionally, the results indicate that machine learning methods are effective in predicting drift, which is an important factor in leaf surface spraying [54].
5. Conclusions
In line with the increasing environmental demands of intensive farming and the EU’s “From pork to fork” strategy, more emphasis is being placed on the amount of pesticides used in production and the possibility of reducing them. This research is, therefore, part of this strategy, which aims to maximize the coverage of treated areas to ensure a good effect of pesticides and reduce the number of protective repetitions, thus reducing the consumption of pesticides. Good coverage is difficult to achieve and is determined under field conditions by several interactions between the technical factors of spraying. In this study, which is in line with other research worldwide, the main technical factors considered were the type of plantation, the type of machine, the type of nozzle, the speed of movement, and the spraying norm.
To collect data on the coverage factors of the treated area (area coverage, droplet diameter, number of droplets per cm2, and drift), a method using water-sensitive paper and digital image analysis was used. The method has been used for many years to determine spraying parameters in agriculture and is one of the more acceptable field methods, in contrast to laser methods used under closed conditions in the laboratory.
The novelty of this work is the fact that the data processing was not carried out using standard methods of variance analysis, etc., but with machine learning methods, namely: quantile random forest (QRF), support vector regression with radial basis function kernel (SVR), Bayesian Regularization for Feed-Forward Neural Networks (BRNN), and Ensemble Machine Learning (ENS). These methods represent an ever faster-growing trend in the development of machine learning as a scientific method and the application of artificial intelligence in agriculture.
By applying machine learning methods, the importance of the technical factors of spraying on the characteristics of surface coverage and the technical dependency in their interactions could be determined. The nozzle type proved to be an important factor for area coverage (axial 24.6% and radial 34.8%), the number of droplets per cm2 (axial 69.1%; radial 66.0%), and the droplet diameter (axial 30.6% and radial 38.2%). For drift, the spraying norm had the highest value in prediction (axial 74.4% and radial 62.3%). In most cases, the crop type did not have too much influence on the area coverage factors. A greater coverage of the treated area and a higher number of droplets were achieved with the radial sprayer, as well as less drift.
Looking at the accuracy of a particular machine learning model, it can be seen that most methods showed a quite good accuracy. For the axial sprayer, the BRNN method had the best R2 value with 0.745 for area coverage and 0.921 for the number of droplets, while ENS provided the best value for drift (0.984). The system errors were small (minimal RMSE for area coverage = 4.54 and minimal drift = 0.70), and when normalized, they were negligible. A similar distribution of data was also seen in the tests with a radial sprayer. The SVR method showed the highest accuracy for area coverage (0.781), QRF for the number of droplets per cm2 (0.894), and ENS for the droplet diameter (0.750) and drift (0.979). As with the axial sprayer, the system errors were small and negligible during normalization. However, the accuracy of the machine learning models for droplet diameter (Axial: R2 = 0.437 (QRF) − 0.503 (BRNN); Radial: R2 = 0.691 (SVR) − 0.750 (ENS)) is a range that will provide extensive and high-quality training data coverage in the future.
This study used a relatively new scientific method for data processing based on the principles of machine learning and the use of neural networks. A special feature it possesses is that the mentioned methods can be used in the entire agricultural sector, where very accurate and fast solutions can be obtained in relation to project tasks. Thus, this research also tried to find answers to the nature and behavior of the technical factors of spraying considering the current issue of pesticide use in agriculture and the possibility of reducing their use. This research provides highly accurate results that can be directly applied in agricultural production and also serve as a basis for future research on this topic
Author Contributions
Conceptualization, V.T. and D.R.; methodology, V.T. and D.R.; software, D.R.; validation, V.T.; formal analysis, M.J.; investigation, V.T.; resources, V.T.; data curation, V.T. and D.R.; writing—original draft preparation, V.T. and D.R.; writing—review and editing, V.T., D.R. and M.J.; visualization, D.R.; supervision, M.J.; project administration, M.J.; funding acquisition, V.T. All authors have read and agreed to the published version of the manuscript.
Funding
This research received no external funding.
Data Availability Statement
The raw data supporting the conclusions of this article will be made available by the authors on request.
Conflicts of Interest
The authors declare no conflicts of interest.
References
- Cerruto, E.; Manetto, G.; Papa, R.; Longo, D. Modelling spray pressure effects on droplet size distribution from agricultural nozzles. Appl. Sci. 2021, 11, 9283. [Google Scholar] [CrossRef]
- Tadić, V.; Zebec, V.; Ravlić, M.; Brozović, B.; Ilić, J.; Vujčić, B. Impact of technical spraying factors on leaf area coverage in a vineyard. Agron. J. 2016, 5–6, 215–230. [Google Scholar]
- Petrović, D.; Jurišić, M.; Plaščak, I.; Duvnjak, V.; Marković, M.; Banaj, A.; Tadić, V. Impact of selective application with ultrasonic sensors on drift and liquid deposit in the cherry orchard. Poljoprivreda 2019, 25, 89–98. [Google Scholar] [CrossRef]
- Petrović, D.; Banaj, Đ.; Banaj, A.; Barač, Ž.; Vidaković, I.; Tadić, V. The Impact of Conventional and Sensor Spraying on Drift and Deposit in Cherry Orchard. Teh. Vjesn. 2019, 26, 1211–1217. [Google Scholar] [CrossRef]
- Palma, R.P.; Da Cunha, J.P.A.R. Multivariate Analysis Applied to the Ground Application of Pesticides in the Corn Crop. AgriEngineering 2023, 5, 829–839. [Google Scholar] [CrossRef]
- Wei, Z.; Rui, L.; Xue, X.; Sun, Y.; Zhang, S.; Li, Q.; Chang, C.; Zhang, Z.; Sun, Y.; Dou, Q. Research Status, Methods and Prospects of Air-Assisted Spray Technology. Agronomy 2023, 13, 1407. [Google Scholar] [CrossRef]
- Salcedo, R.; Zhu, H.; Zhang, Z.; Wei, Z.; Chen, L.; Ozkan, E.; Falchieri, D. Foliar deposition and coverage on young apple trees with PWM-controlled spray systems. Comput. Electron. Agric. 2020, 178, 105794. [Google Scholar] [CrossRef]
- Cieniawska, B.; Parafiniuk, S.; Kluza, P.A.; Otachel, Z. Matching the Liquid Atomization Model to Experimental Data Obtained from Selected Nozzles. Appl. Sci. 2023, 13, 4433. [Google Scholar] [CrossRef]
- Mishra, A.K.; Arya, R.; Tyagi, R.; Grover, D.; Mishra, J.; Vimal, S.R.; Mishra, S.; Sharma, S. Non-judicious use of pesticides indicating potential threat to sustainable agriculture. Sustain. Agric. Rev. 2021, 50, 383–400. [Google Scholar] [CrossRef]
- European Commission: Directive 2009/128/EC—Sustainable Use of Pesticides. Brussels, Belgium. 2009. Available online: https://food.ec.europa.eu/plants/pesticides/sustainable-use-pesticides_en (accessed on 15 July 2024).
- Mahmud, M.S.; Zahid, A.; He, L.; Martin, P. Opportunities and possibilities of developing an advanced precision spraying system for tree fruits. Sensors 2021, 21, 3262. [Google Scholar] [CrossRef]
- Shaikh, T.A.; Rasool, T.; Lone, F.R. Towards leveraging the role of machine learning and artificial intelligence in precision agriculture and smart farming. Comput. Electron. Agric. 2022, 198, 107119. [Google Scholar] [CrossRef]
- Benos, L.; Tagarakis, A.C.; Dolias, G.; Berruto, R.; Kateris, D.; Bochtis, D. Machine learning in agriculture: A comprehensive updated review. Sensors 2021, 21, 3758. [Google Scholar] [CrossRef]
- Elbasi, E.; Zaki, C.; Topcu, A.E.; Abdelbaki, W.; Zreikat, A.I.; Cina, E.; Shdefat, A.; Saker, L. Crop prediction model using machine learning algorithms. Appl. Sci. 2023, 13, 9288. [Google Scholar] [CrossRef]
- Radočaj, D.; Gašparović, M.; Radočaj, P.; Jurišić, M. Geospatial prediction of total soil carbon in European agricultural land based on deep learning. Sci. Total Environ. 2024, 912, 169647. [Google Scholar] [CrossRef] [PubMed]
- Ganaie, M.A.; Hu, M.; Malik, A.K.; Tanveer, M.; Suganthan, P.N. Ensemble deep learning: A review. Eng. Appl. Artif. Intell. 2022, 115, 105151. [Google Scholar] [CrossRef]
- Yang, J.; Zeng, X.; Zhong, S.; Wu, S. Effective neural network ensemble approach for improving generalization performance. IEEE Trans. Neural Netw. Learn. Syst. 2013, 24, 878–887. [Google Scholar] [CrossRef]
- Radočaj, D.; Tuno, N.; Mulahusić, A.; Jurišić, M. Evaluation of Ensemble Machine Learning for Geospatial Prediction of Soil Iron in Croatia. Agriculture 2023, 29, 53–61. [Google Scholar] [CrossRef]
- Doruchowski, G.; Hołownicki, R.; Godyń, A.; Świechowski, W. Sprayer calibration training—Concept and performance. In Proceedings of the Fourth European Workshop on Standardized Procedure for the Inspection of Sprayers—SPISE 4, Lana, Italy, 27–29 March 2012; pp. 166–171. [Google Scholar]
- Banaj, Đ.; Tadić, V.; Banaj, Ž.; Lukač, P. Pesticide Application Technics Improvement, 1st ed.; University of Josip Juraj Strossmayer, Faculty of Agrobiotechnical Sciences: Osijek, Croatia, 2011; p. 53. [Google Scholar]
- He, M.; Qi, P.; Han, L.; He, X. Study on Spray Evaluation: The Key Role of Droplet Collectors. Agronomy 2024, 14, 305. [Google Scholar] [CrossRef]
- Guo, J.; Dong, X.; Qiu, B. Analysis of the Factors Affecting the Deposition Coverage of Air-Assisted Electrostatic Spray on Tomato Leaves. Agronomy 2024, 14, 1108. [Google Scholar] [CrossRef]
- Fox, R.D.; Derksen, R.C.; Cooper, J.A.; Krause, C.R.; Ozkan, H.E. Visual and Image System Measurement of Spray Deposits Using Water–Sensitive Paper. Appl. Eng. Agric. 2003, 19, 549–552. [Google Scholar] [CrossRef]
- Jaeken, P.; Lootens, P.; Vandecasteele, P.; de Moor, M. Image Analysis of Water Sensitive Paper as a Tool for the Evaluation of Spray Distribution of Orchard Sprayers. Asp. Appl. Biol. 2000, 57, 329–342. [Google Scholar]
- Schneider, C.A.; Rasband, W.S.; Eliceiri, K.W. NIH Image to ImageJ: 25 Years of Image Analysis. Nat. Methods 2012, 9, 671–675. [Google Scholar] [CrossRef] [PubMed]
- Papadakis, S.E.; Abdul-Malek, S.; Kamdem, R.E.; Yam, K.L. A Versatile and Inexpensive Technique for Measurement Colour of Foods. Food Technol. 2000, 54, 48–51. [Google Scholar]
- Wee, A.G.; Lindsey, D.T.; Kuo, S.; Johnston, W.M. Colour accuracy of commercial digital cameras for use in dentistry. Dent. Mater. 2006, 22, 553–559. [Google Scholar] [CrossRef]
- Sirsat, M.S.; Cernadas, E.; Fernández-Delgado, M.; Barro, S. Automatic prediction of village-wise soil fertility for several nutrients in India using a wide range of regression methods. Comput. Electron. Agric. 2018, 154, 120–133. [Google Scholar] [CrossRef]
- Gyamerah, S.A.; Ngare, P.; Ikpe, D. Probabilistic forecasting of crop yields via quantile random forest and Epanechnikov Kernel function. Agric. For. Meteorol. 2020, 280, 107808. [Google Scholar] [CrossRef]
- Sharma, A.; Jain, A.; Gupta, P.; Chowdary, V. Machine learning applications for precision agriculture: A comprehensive review. IEEE Access 2020, 9, 4843–4873. [Google Scholar] [CrossRef]
- Vaysse, K.; Lagacherie, P. Using quantile regression forest to estimate uncertainty of digital soil mapping products. Geoderma 2017, 291, 55–64. [Google Scholar] [CrossRef]
- Meinshausen, N.; Ridgeway, G. Quantile regression forests. J. Mach. Learn. Res. 2006, 7, 983–999. [Google Scholar]
- Basak, D.; Pal, S.; Patranabis, D.C. Support vector regression. Neural Inf. Process. Lett. Rev. 2007, 11, 203–224. [Google Scholar]
- Phienthrakul, T.; Kijsirikul, B. Evolutionary strategies for hyperparameters of support vector machines based on multi-scale radial basis function kernels. Soft Comput. 2010, 14, 681–699. [Google Scholar] [CrossRef]
- Paidipati, K.K.; Chesneau, C.; Nayana, B.M.; Kumar, K.R.; Polisetty, K.; Kurangi, C. Prediction of rice cultivation in India—Support vector regression approach with various kernels for non-linear patterns. AgriEngineering 2021, 3, 182–198. [Google Scholar] [CrossRef]
- Burden, F.; Winkler, D. Bayesian regularization of neural networks. In Artificial Neural Networks: Methods and Applications; Springer: Berlin/Heidelberg, Germany, 2009; pp. 23–42. [Google Scholar] [CrossRef]
- Olawoyin, A.; Chen, Y. Predicting the future with artificial neural network. Procedia Comput. Sci. 2018, 140, 383–392. [Google Scholar] [CrossRef]
- Sun, W.; Paiva, A.R.; Xu, P.; Sundaram, A.; Braatz, R.D. Fault detection and identification using Bayesian recurrent neural networks. Comput. Chem. Eng. 2020, 141, 106991. [Google Scholar] [CrossRef]
- Prodhan, F.A.; Zhang, J.; Sharma, T.P.P.; Nanzad, L.; Zhang, D.; Seka, A.M.; Naveed, A.; Hasan, S.S.; Hoque, M.Z.; Mohana, H.P. Projection of future drought and its impact on simulated crop yield over South Asia using ensemble machine learning approach. Sci. Total Environ. 2022, 807, 151029. [Google Scholar] [CrossRef] [PubMed]
- Rathnayake, A.P.; Chandel, A.K.; Schrader, M.J.; Hoheisel, G.A.; Khot, L.R. Spray patterns and perceptive canopy interaction assessment of commercial airblast sprayers used in Pacific Northwest perennial specialty crop production. Comput. Electron. Agric. 2021, 184, 106097. [Google Scholar] [CrossRef]
- Li, Q.J.; Xue, Y.X. Total leaf area estimation based on the total grid area measured using mobile laser scanning. Comput. Electron. Agric. 2022, 204, 107503. [Google Scholar] [CrossRef]
- Waldner, W.; Knoll, M. Experiences with and benefits of the inspection of air-assisted sprayers from the fruit and winegrowers’ point of view. In Proceedings of the Fourth European Workshop on Standardized Procedure for the Inspection of Sprayers—SPISE 4, Lana, Italy, 27–29 March 2012; pp. 44–49. Available online: https://d-nb.info/1250837278/34#page=46 (accessed on 15 July 2024).
- Marucco, P.; Tamagnone, M.; Balsari, P. Study of Air Velocity Adjustment to Maximize Spray Deposition in Peach Orchards. Agric. Eng. Int. CIGR Ejournal 2008, 10, 08009. [Google Scholar]
- Zhu, H.; Derksen, R.C.; Krause, C.R.; Brazee, R.D.; Zondag, R.H.; Fox, R.D.; Reding, M.E.; Ozkan, H.E. Spray deposition and off-target loss in nursery tree crops with conventional nozzle, air induction nozzle and drift retardant. In Proceedings of the ASAE Annual International Meeting, Tampa, FL, USA, 17–20 July 2005; p. 051007. [Google Scholar] [CrossRef]
- Wolf, R.E.; Williams, W.L.; Gardisser, D.R.; Whitney, R.W.; (Kansas State University, Manhattan, KS, USA). Using DropletScan to Analyze Spray Quality. Personal communication, 2004. Available online: https://bae.k-state.edu/faculty/wolf/Papers/ASAE991026.pdf (accessed on 15 July 2024).
- Bondesan, D.; Rizzi, C.; Ianes, P.; Angeli, G.; Bassi, R.; Dalpiaz, A.; Ioriatti, C. Towards integration of inspection procedures, calibration and drift reducing devices for an efficient use of pesticides and reduction of application impact. In Proceedings of the Fourth European Workshop on Standardized Procedure for the Inspection of Sprayers—SPISE 4, Lana, Italy, 27–29 March 2012; pp. 135–139. [Google Scholar]
- Cross, J.V.; Walklate, P.J.; Murray, R.A.; Richardson, G.M. Spray deposits and losses in different sized apple trees from an axial fan orchard sprayer: 3. Effects of air volumetric flow rate. J. Crop Prot. 2003, 25, 381–394. [Google Scholar] [CrossRef]
- Nuyttens, D.; Baeten, K.; De Schampheleire, M.; Sonck, B. Effect of nozzle type, size and pressure on spray droplet characteristics. Biosyst. Eng. 2007, 97, 333–345. [Google Scholar] [CrossRef]
- Ozkan, H.E.; Derksen, R.C.; (Ohio State University, Columbus, OH, USA). Effectiveness of Turbodrop and Turbo Teejet Nozzles in Drift Reduction Personal communication, 2016. Available online: https://faes-webmain.org.ohio-state.edu/ohioline/factsheet/fabe-524 (accessed on 15 July 2024).
- Domingues, T.; Brandão, T.; Ferreira, J.C. Machine learning for detection and prediction of crop diseases and pests: A comprehensive survey. Agriculture 2022, 12, 1350. [Google Scholar] [CrossRef]
- Attri, I.; Awasthi, L.K.; Sharma, T.P. Machine learning in agriculture: A review of crop management applications. Multimed. Tools Appl. 2024, 83, 12875–12915. [Google Scholar] [CrossRef]
- Kok, Z.H.; Shariff, A.R.M.; Alfatni, M.S.M.; Khairunniza-Bejo, S. Support vector machine in precision agriculture: A review. Comput. Electron. Agric. 2021, 191, 106546. [Google Scholar] [CrossRef]
- Marković, D.; Vujičić, D.; Tanasković, S.; Đorđević, B.; Ranđić, S.; Stamenković, Z. Prediction of pest insect appearance using sensors and machine learning. Sensors 2021, 21, 4846. [Google Scholar] [CrossRef]
- Chen, S.; Lan, Y.; Zhou, Z.; Ouyang, F.; Wang, G.; Huang, X.; Deng, X.; Cheng, S. Effect of droplet size parameters on droplet deposition and drift of aerial spraying by using plant protection UAV. Agronomy 2020, 10, 195. [Google Scholar] [CrossRef]
Disclaimer/Publisher’s Note: The statements, opinions and data contained in all publications are solely those of the individual author(s) and contributor(s) and not of MDPI and/or the editor(s). MDPI and/or the editor(s) disclaim responsibility for any injury to people or property resulting from any ideas, methods, instructions or products referred to in the content. |
© 2024 by the authors. Licensee MDPI, Basel, Switzerland. This article is an open access article distributed under the terms and conditions of the Creative Commons Attribution (CC BY) license (https://creativecommons.org/licenses/by/4.0/).